1. Introduction
Engineered cementitious composites (ECC), a novel class of ultra-high ductile cementitious materials with saturated multiple cracking characteristics, have emerged as a promising option for improving the performance, as well as the sustainability of concrete infrastructures over the past few decades [
1]. Designed based on the micromechanics theory, ECC that exhibits obvious strain hardening behavior overcomes the inherent drawback of brittleness in normal concrete [
2,
3]. Through deliberately tailoring the properties of matrix, fiber, and fiber/matrix interface, ECC, reinforced by a moderate fiber volume of nearly 2%, has an ultra-high tensile strain capacity of more than 3% [
4]. ECC possesses the intrinsic crack control capacity, which could efficiently impede the penetration of aggressive ions, thus improving the material/structural durability [
5,
6,
7,
8]. The life cycle maintenance and repair needs could be dramatically reduced, and high sustainability is thus achieved [
6].
Nevertheless, the fabrication of ECC that consumes a high content of cement not only increases the initial material cost but also compromises the carbon and energy footprints of the composites. To promote the broader application of ECC and enhance the sustainability of ECC-made infrastructure, the usage of environmentally friendly ingredients is highly needed. Substituting cement with supplementary cementitious materials (SCMs) such as ground granulated blast-furnace slag (GGBS) and fly ash (FA) have been considered to be an effective method to mitigate the environmental impacts without compromising the mechanical properties [
9,
10]. However, the total amount of available fly ash and slag accounts for about 15% of the cement production, and the availability of fly ash keeps decreasing as traditional coal-fired power plants encounter increasingly high environmental pressure [
11,
12]. Furthermore, the replacement ratio of fly ash as SCM in cement was generally limited to 30%, otherwise, the high dosage of fly ash would have adverse effects on the strength development of ECC [
13]. Therefore, it is highly necessary to find alternative cementitious materials.
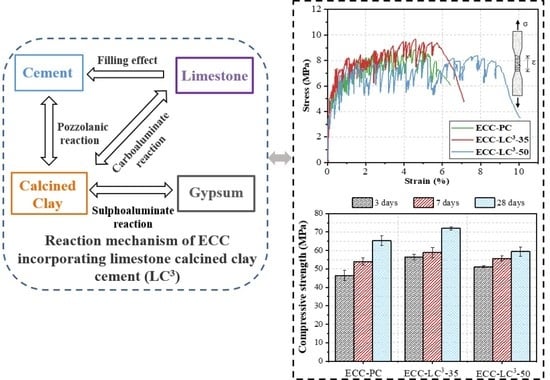
Limestone calcined clay cement (LC
3), proposed by Scrivener et al. [
14,
15], promises to be one of the suitable alternatives. When thermally activated, clay possesses high pozzolanic activities in contact with cement [
16,
17]. Limestone that acts as an effective filler also participates in the reaction with the reactive components in calcined clay [
18,
19,
20]. The abundant reserves of clayey soils and limestone could ensure the continuous supply [
14]. Moreover, the embodied energy and carbon for producing calcined clay and limestone powder are much lower than those for cement production [
13]. Several researchers [
21,
22] have explored the possibility of incorporating LC
3 in strain-hardening cement-based composites. Liu et al. have explored the compression properties and microstructural characteristics of LC
3 based-ECC with different polypropylene (PP) fiber content and curing conditions [
23]. Yu et al. have used ultrahigh-volume limestone and calcined clay blend to produce ECC, which exhibits tensile strain capacity of 0.57–1.58% and tensile strength of 3.24–5.19 MPa [
24]. Ductile LC
3-ECCs with a tensile strain capacity of 6% are also reported in [
25,
26]. Although substantial progress has been made, the in-situ fiber distribution state of ECC incorporating LC
3 has not yet been studied.
Since ECC is designed based on the micromechanical principles, the composite behavior at the macroscale is closely related to the fiber distribution state and the interfacial bond properties between fiber and matrix. Poor fiber dispersion not only has detrimental effects on the mechanical properties of fiber-reinforced cementitious composites but also makes it difficult to establish the link between fiber dispersion and strain hardening properties [
27,
28]. Thus, a reliable quantification method is highly required to determine the fiber distribution characteristics of ECC [
27]. This work aims to investigate the influence of LC
3 on the fiber distribution homogeneity as well as the fiber/matrix interface and to explore the links between microscale properties and macroscale mechanical performance. Furthermore, LC
3-ECC designed in this work exhibits not only high tensile strength but also high tensile ductility. A good balance has been achieved between mechanical resistance and deformability.
In this paper, the mechanical performance of ECC incorporating three dosages of LC3 (0, 35%, and 50%) was investigated. The cubic compression test and uniaxial tensile test of dog-bone-shaped specimens were performed. The fiber dispersion state was studied by fluorescence technique, and the digital image analysis was carried out. The single fiber pullout test was performed to quantitatively analyze the fiber/matrix interfacial properties. The microstructural characteristics of the ECC matrix were also investigated. Mercury intrusion porosimeter (MIP) test was used to study the influence of LC3 on the pore structure of ECC. X-ray diffraction (XRD) and thermogravimetric analysis (TGA) tests were conducted to analyze the phase assemblage of ECC matrix incorporating LC. Through performing the life cycle assessment, the environmental advantages of using LC3 in ECC are also discussed.
2. Experiment Program
2.1. Materials and Mixture Proportion
Reference ECC was composed of ordinary Portland cement (OPC) 52.5R (VCEM P·I), quartz sand, polyethylene (PE) fiber, and water. While for ECC-LC
3 groups, calcined clay, and limestone powder at the mixing ratio of 2:1 was used to replace OPC [
29]. The replacement ratios were, respectively, 35% and 50%, as shown in
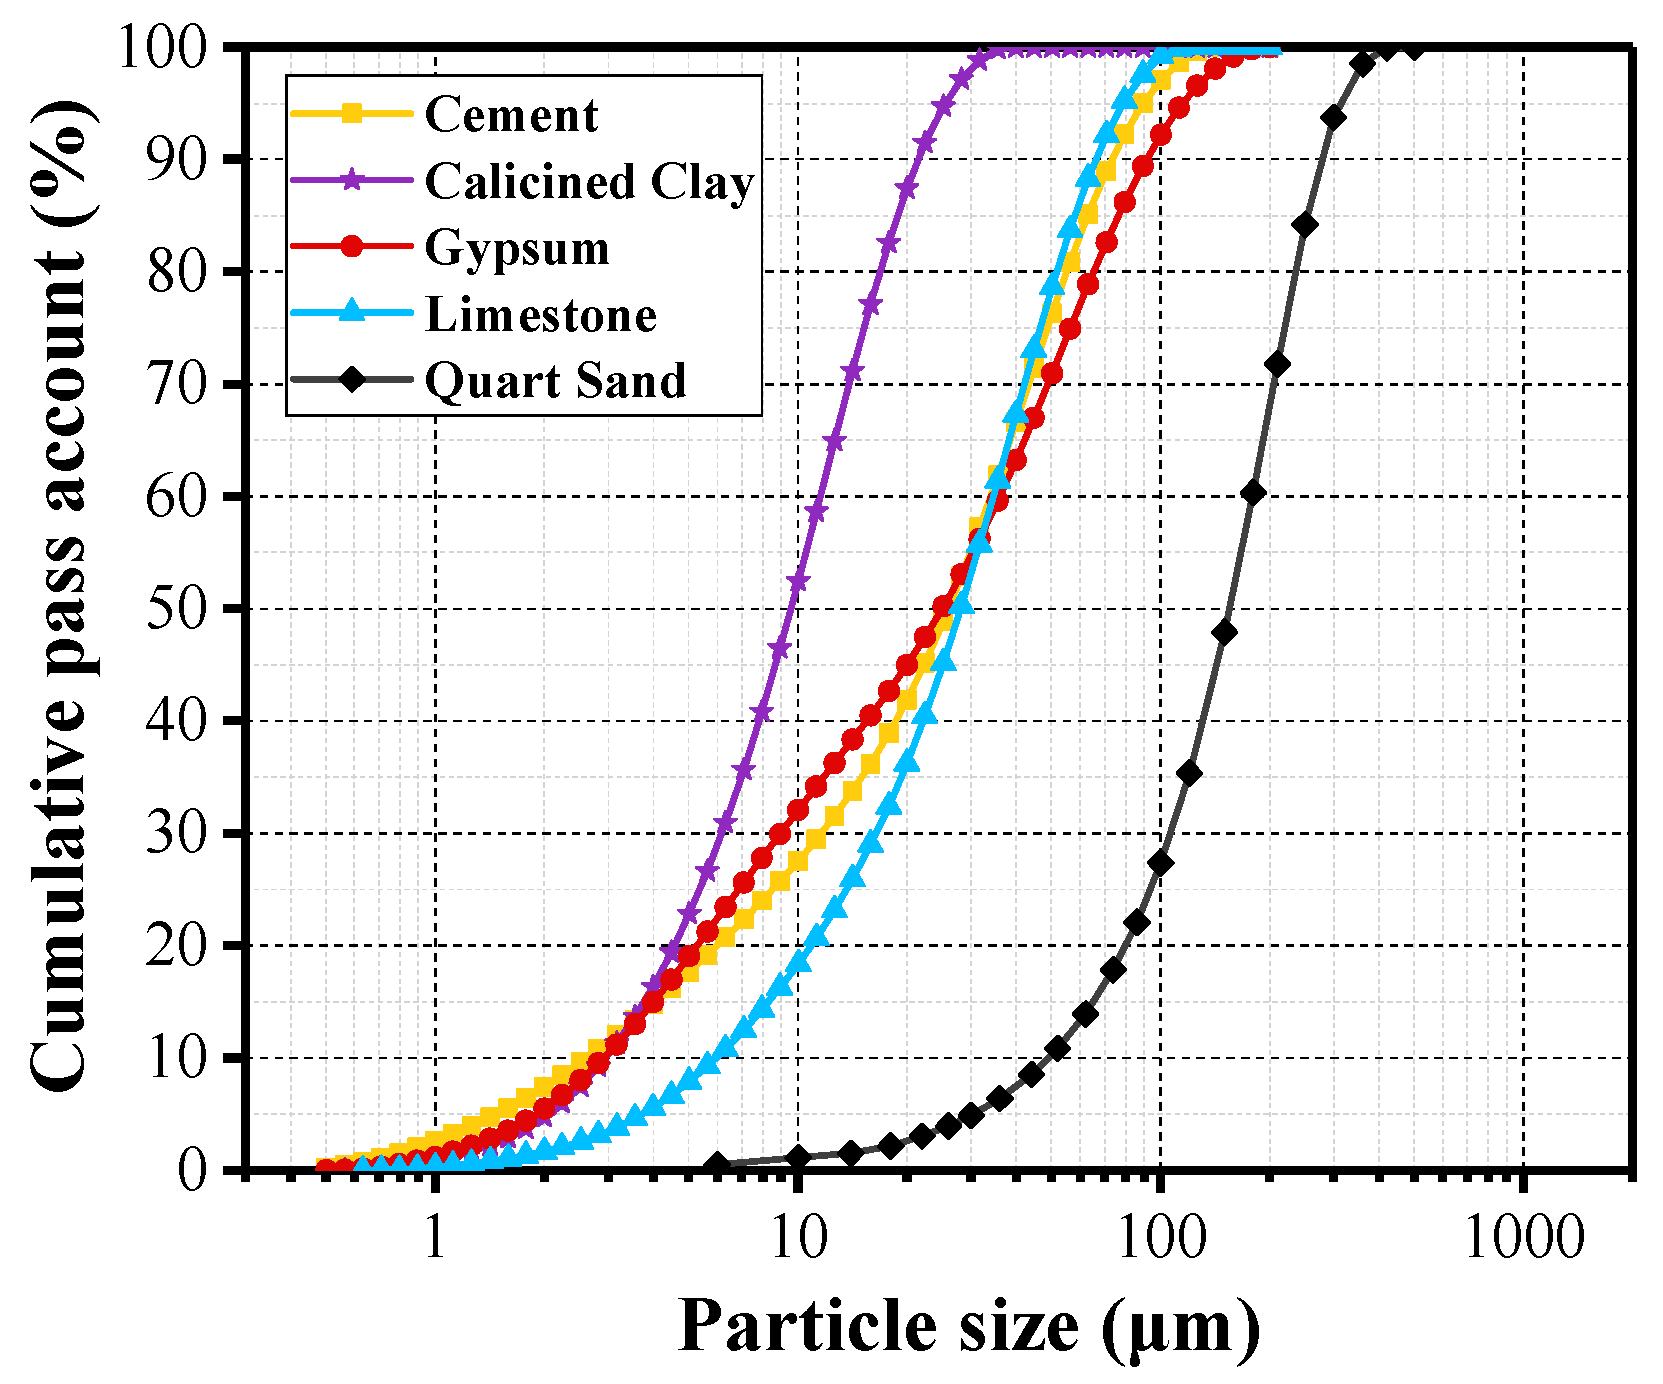
Table 1. Gypsum was added to adjust the early-age reaction process of aluminates. Polycarboxylate-based high-range water reducer (HRWR), sika viscocrete 3301–40, was added to improve the workability of the fresh mixture. The water to binder ratio was kept being 0.25 for the three studied mixtures. The particle size distribution curves of raw materials, determined by a laser particle analyzer, are demonstrated in
Figure 1. Calcined clay was made from kaolin tailings in Maoming, China. Calcined clay mainly contained quartz, illite, and amorphous phases. The chemical composition of all used binders in
Table 2 was quantitatively analyzed by the X-ray fluorescence (XRF) technique. ZSX Primus Ⅱ X-Ray Fluorimeter, Rigaku (Tokyo, Japan), was used for XRF testing. PE fiber, purchased from the company QUANTUMETA in Beijing, China, exhibits hydrophobic nature, and its detailed properties are illustrated in
Table 3. To ensure the uniform distribution of fibers in the cementitious mixture, the following mixing procedure was employed. Initially, the solid mix, including OPC, calcined clay, limestone powder, gypsum, and quartz sand, was stirred in the mixer at a low speed for 3 min. Afterward, water along with HRWR was poured into the dry blend. The mixture was agitated at a low speed for 5 min and a high speed for 1 min. PE fibers were gradually added to the mixture during the stirring process. Finally, the agitation process lasted for another minute to eliminate the agglomeration of fibers in the slurry. According to GB/T 2419–2005, the fluidity of the fresh mixture was tested. After 24 h, the cast samples were demolded and put in a standard curing room at 23 ± 3 °C and 95% relative humidity until 28 days.
2.2. Macroscopic Mechanical Test
Three 50 × 50 × 50 mm
3 cubes were used for compression test according to JGJ/T70−The cubic specimens were loaded at a rate of 0.3 MPa/s by a 2000 kN MTS machine. The average compressive strength of the three specimens was used for further analysis. According to the recommendation of Japan Society of Civil Engineers (JSCE) [
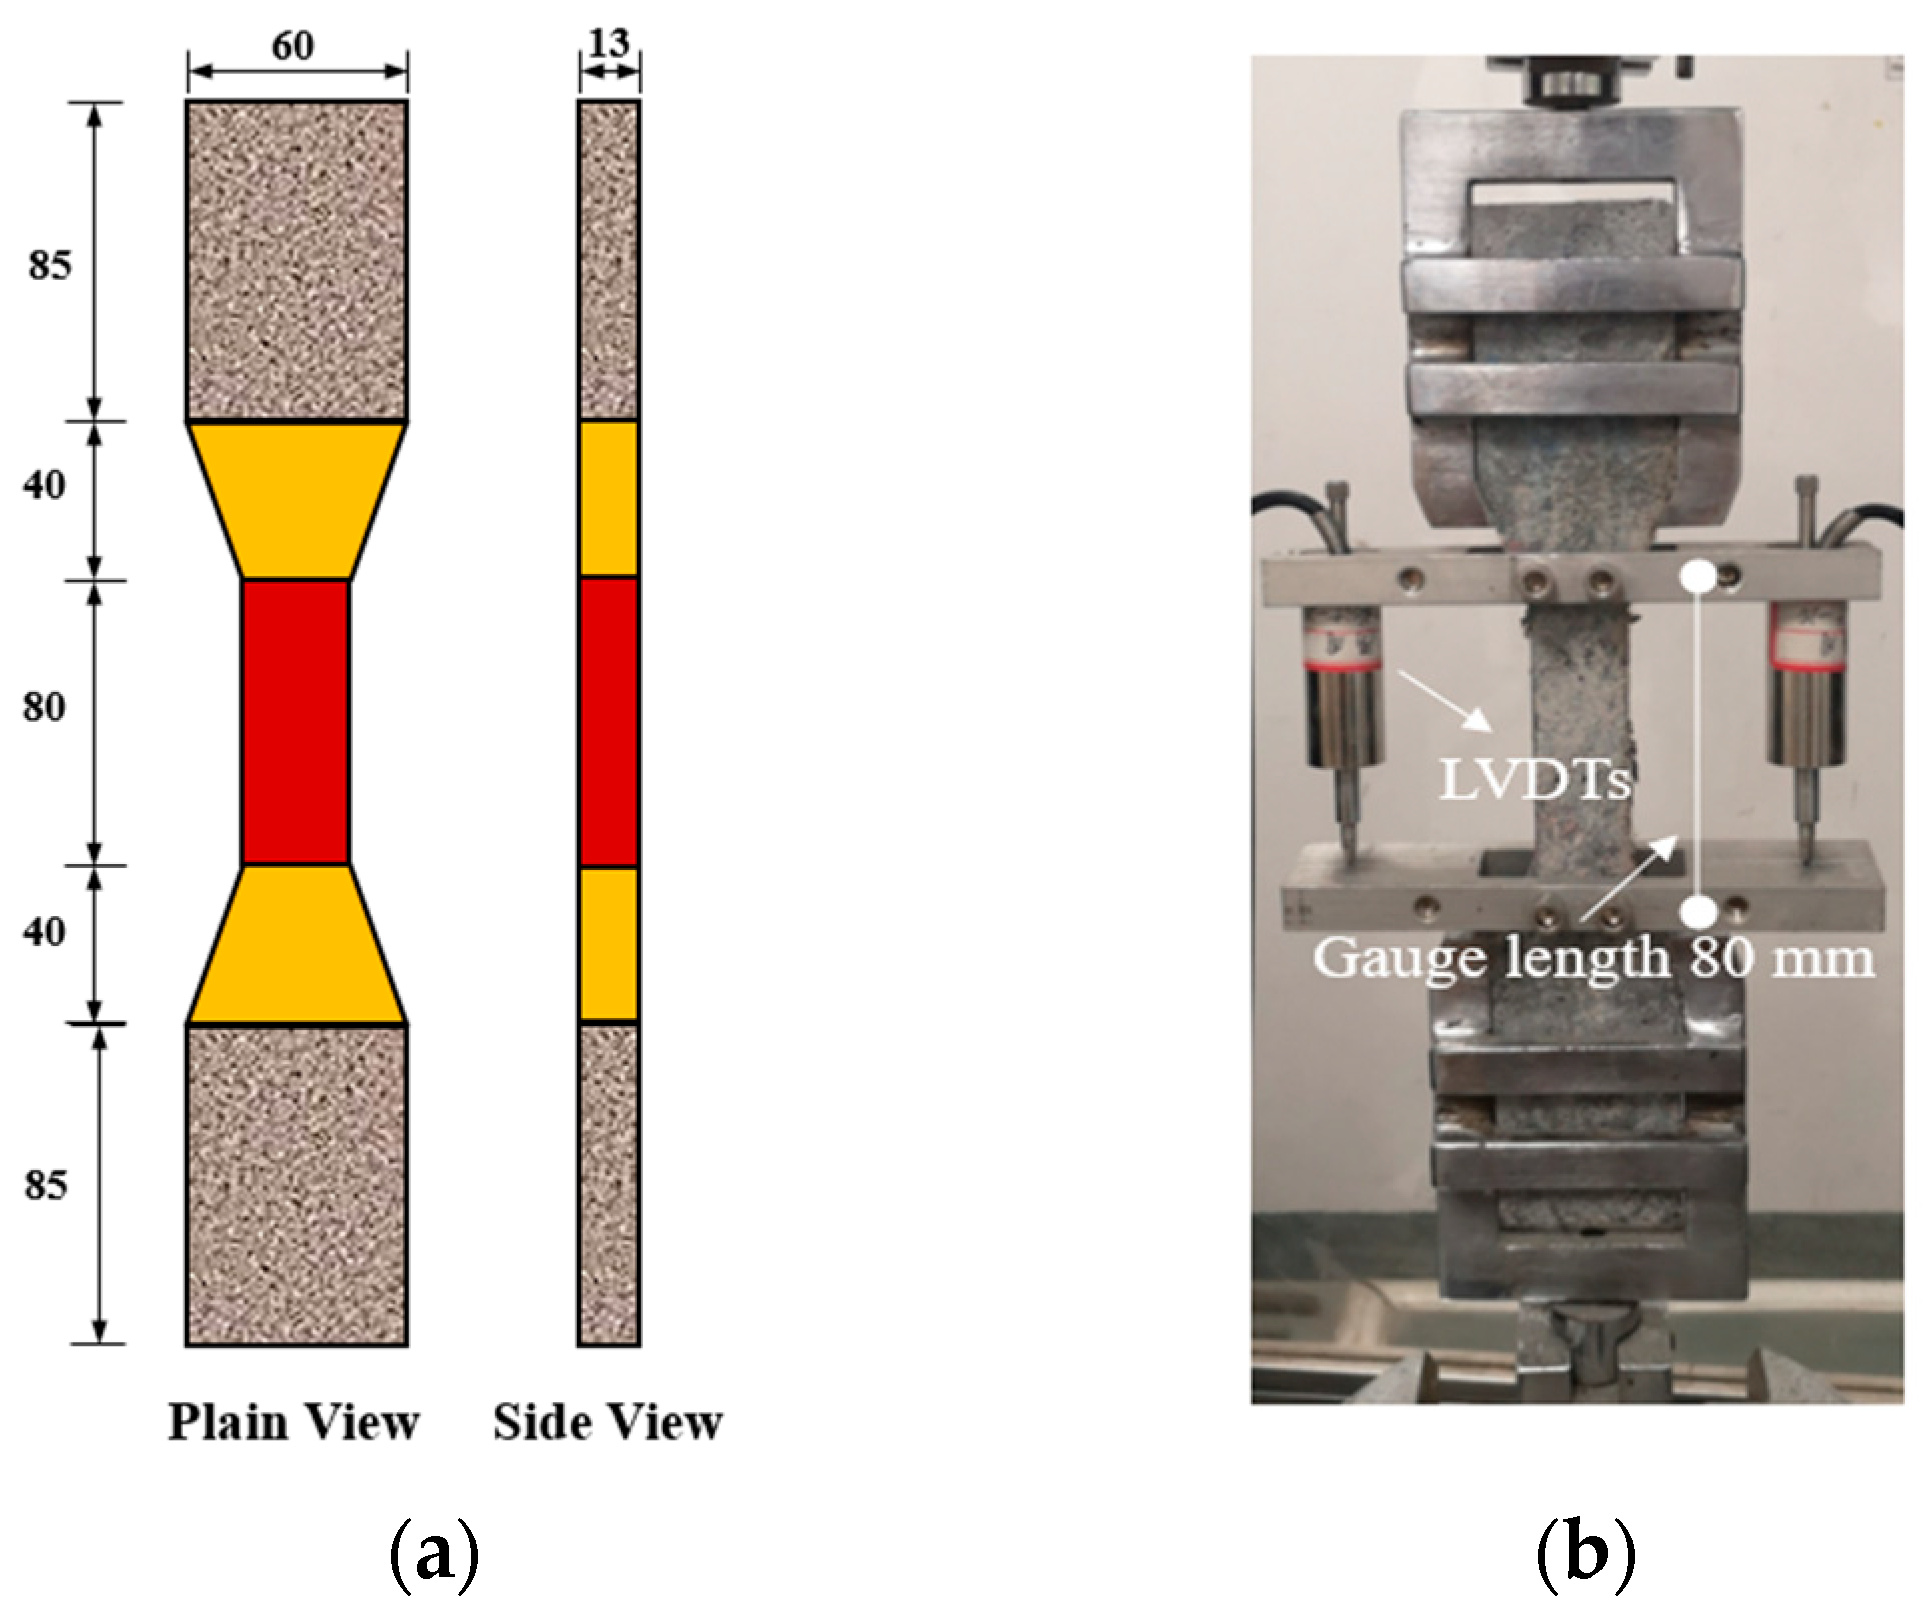
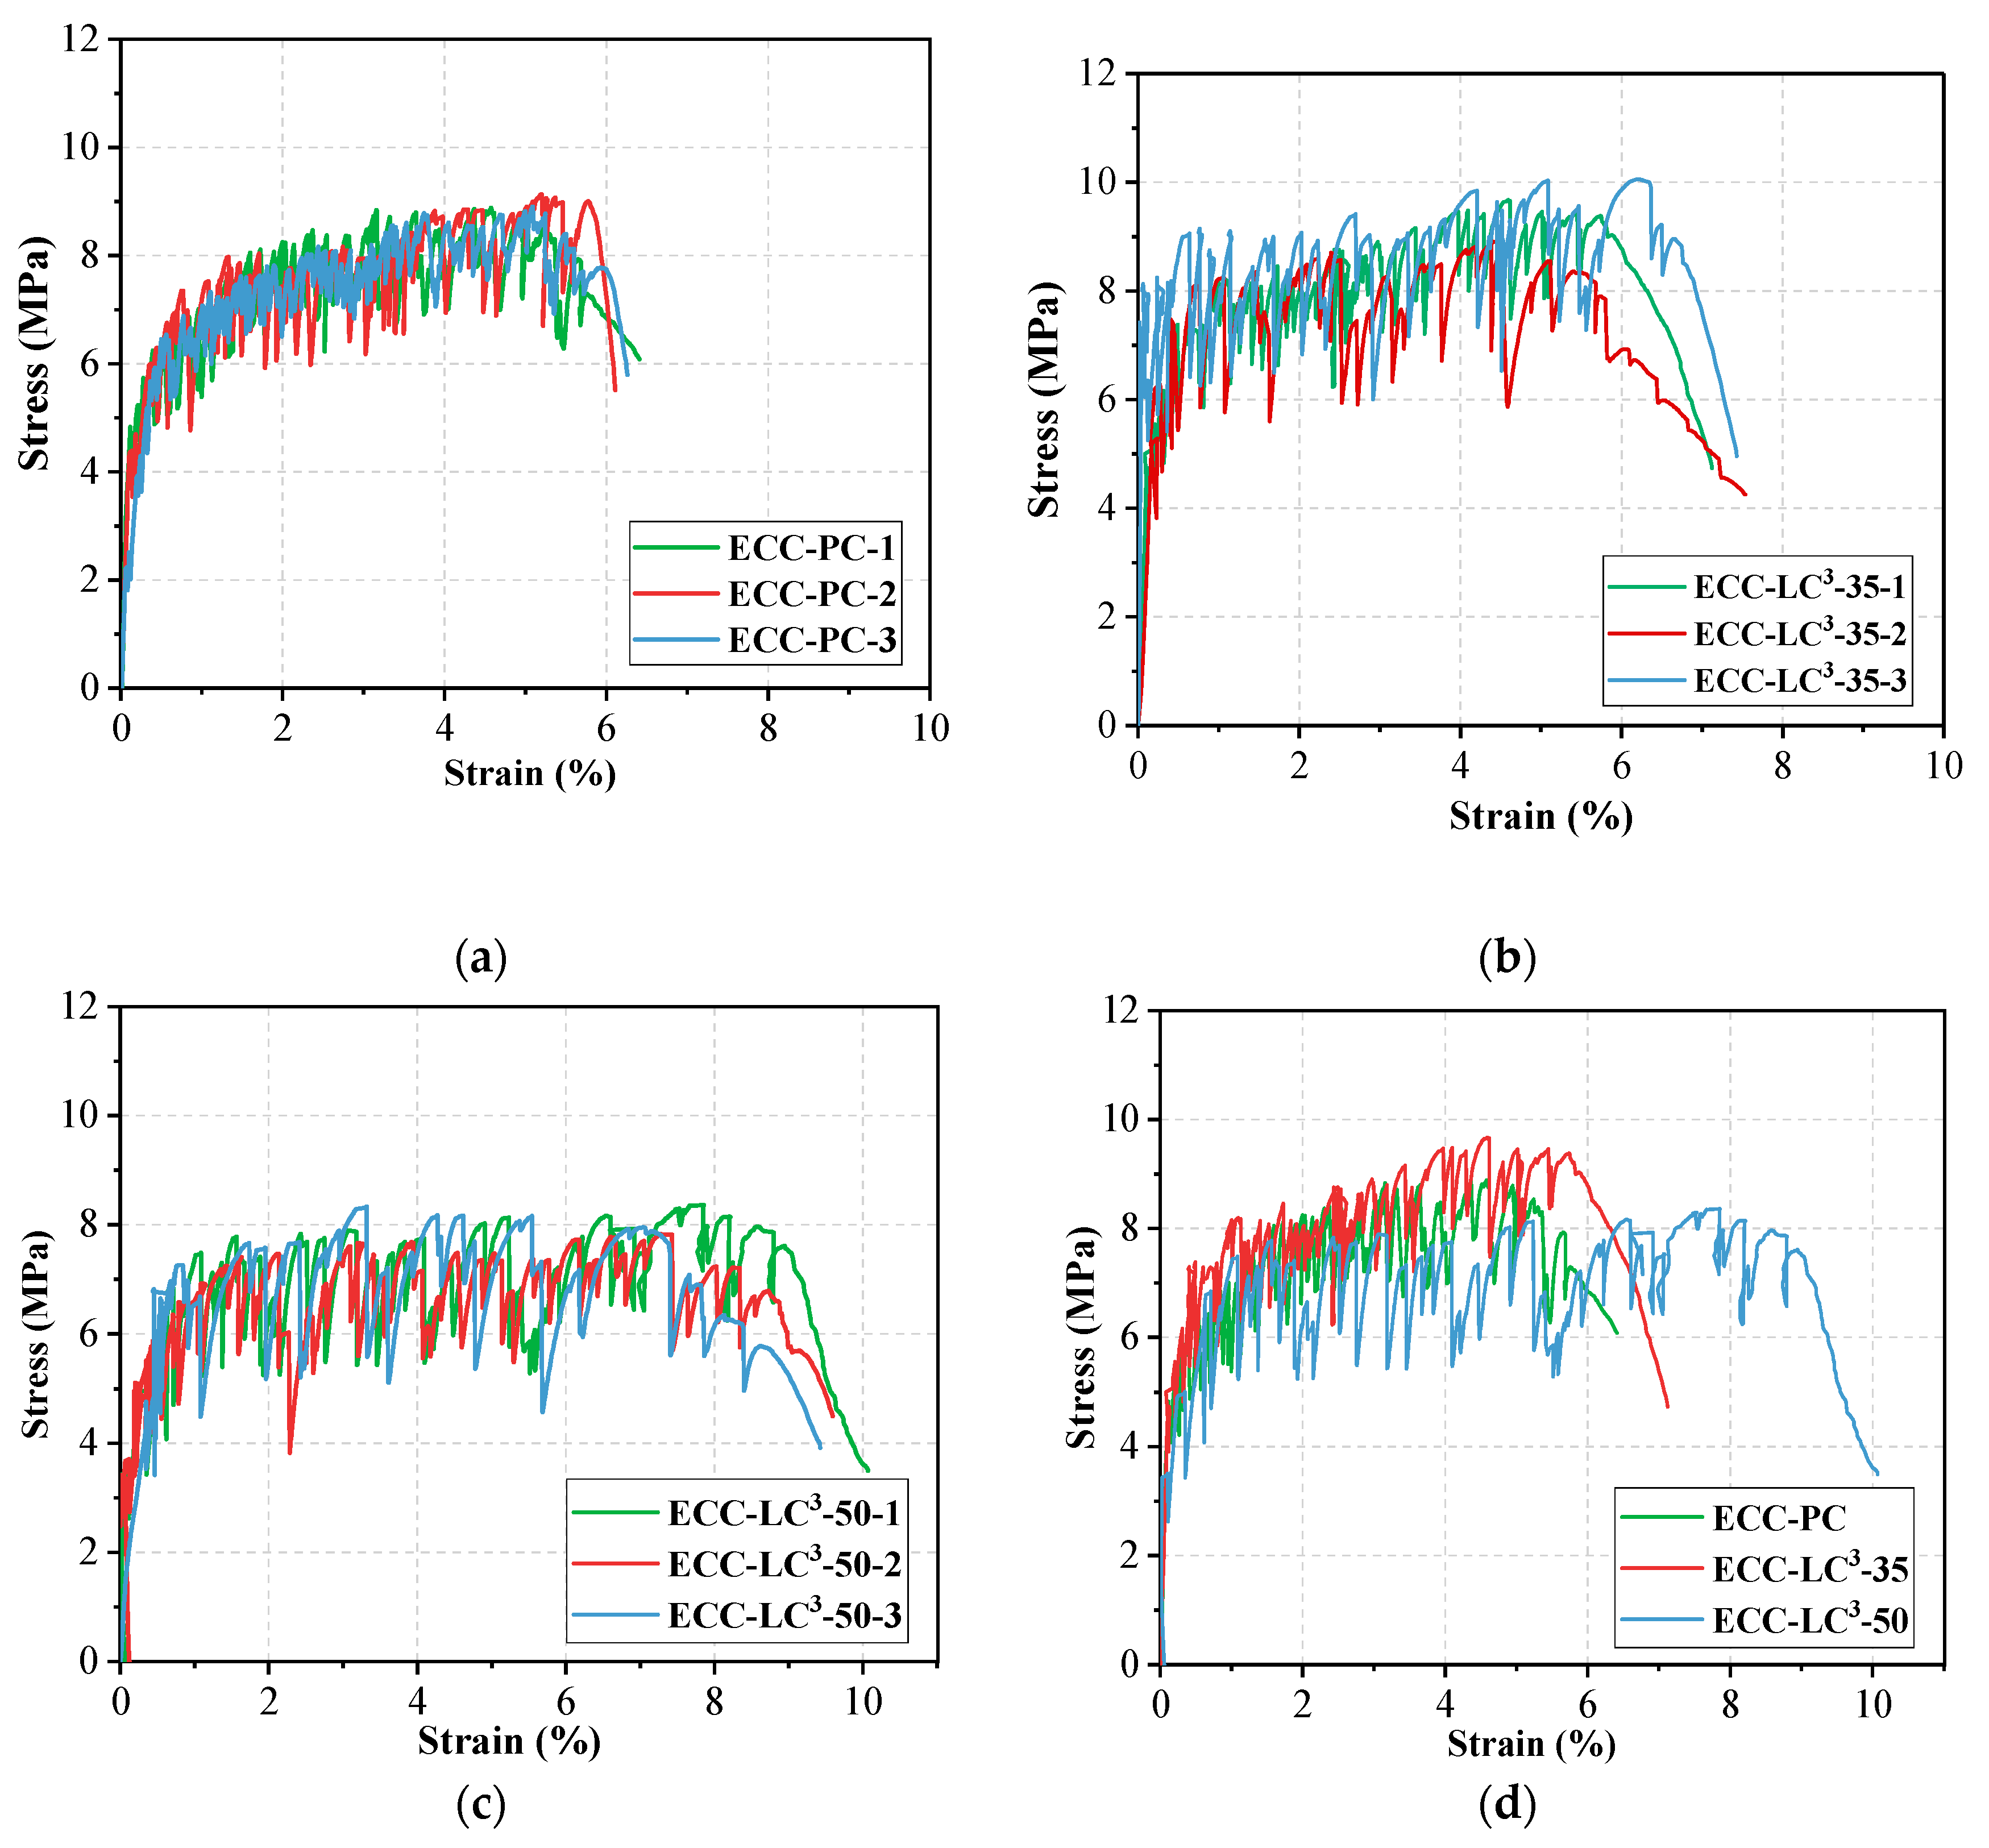
30], dog-bone shaped specimens were used to determine the tensile properties of ECC. The geometric size of the specimen is demonstrated in
Figure 2a. An MTS Landmark electro-hydraulic servo machine was employed to carry out the uniaxial tensile test. The load was applied at the rate of 1 mm/min. The tensile deformation over the gauge length of 80 mm was measured by two linear variable displacement transducers (LVDTs) installed on the two lateral faces of the specimen, as shown in
Figure 2b. For each mixture, at least three specimens were tested. After the test, the tensile cracking patterns of the central narrow part of the specimen were analyzed.
2.3. Fiber Distribution Evaluation
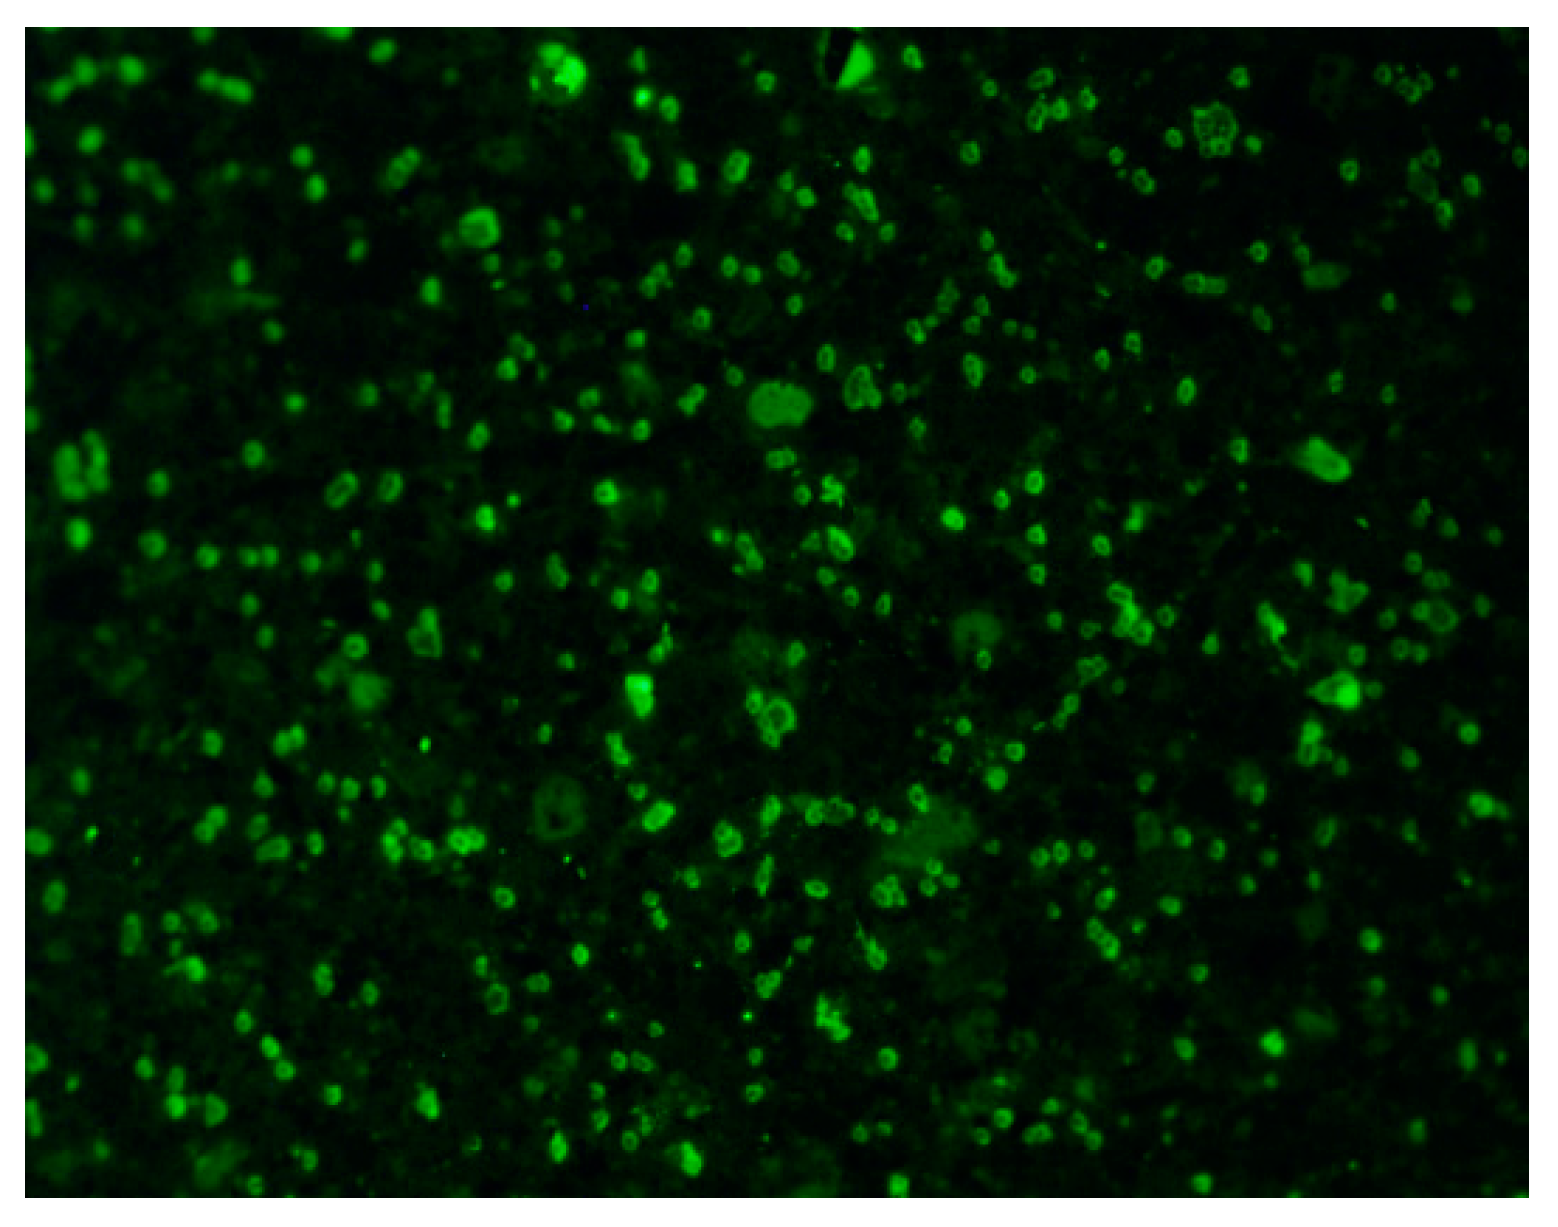
Fiber dispersion uniformity plays a vital role in determining the tensile performance of ECC. In this work, the fluorescence technique was used to detect PE fibers in ECC and was employed for quantifying fiber distribution. It is known that non-organic PE fibers could fluoresce and emit green light of 449 nm wavelength when excited by ultra-violet incident light with the wavelength being 385 nm [
31]. By separating the emitted fluorescence from the illumination light using a UV filter, fibers appear as greenish dots under the fluorescence microscope while the surrounding matrix appears as dark gray, as illustrated in
Figure 3.
After the tensile test, the central loading zone of the specimen was cut into five equal parts, and the cross-section of each part was used for fluorescence analysis. An Olympus BX-51 microscope equipped with an Olympus DP-70 high-resolution digital camera was employed to capture fluorescence images of dog-bone cross-sections. For each cross-section, the whole region was divided into fifteen rectangular zones, and one image was captured for each rectangle by a DP-70 camera [
32]. The fiber distribution coefficient α
f was then calculated according to the following formula:
where X
i is the number of fibers in the i-th image, determined according to the methodology proposed by Lee et al. [
27]; X
average is the average number of fibers in all images; and n is the image number. The value of α
f tends towards 1 when the fiber dispersion is homogeneous, while the value of α
f becomes close to 0 when the fiber dispersion is nonhomogeneous.
2.4. Single Fiber Pullout Test
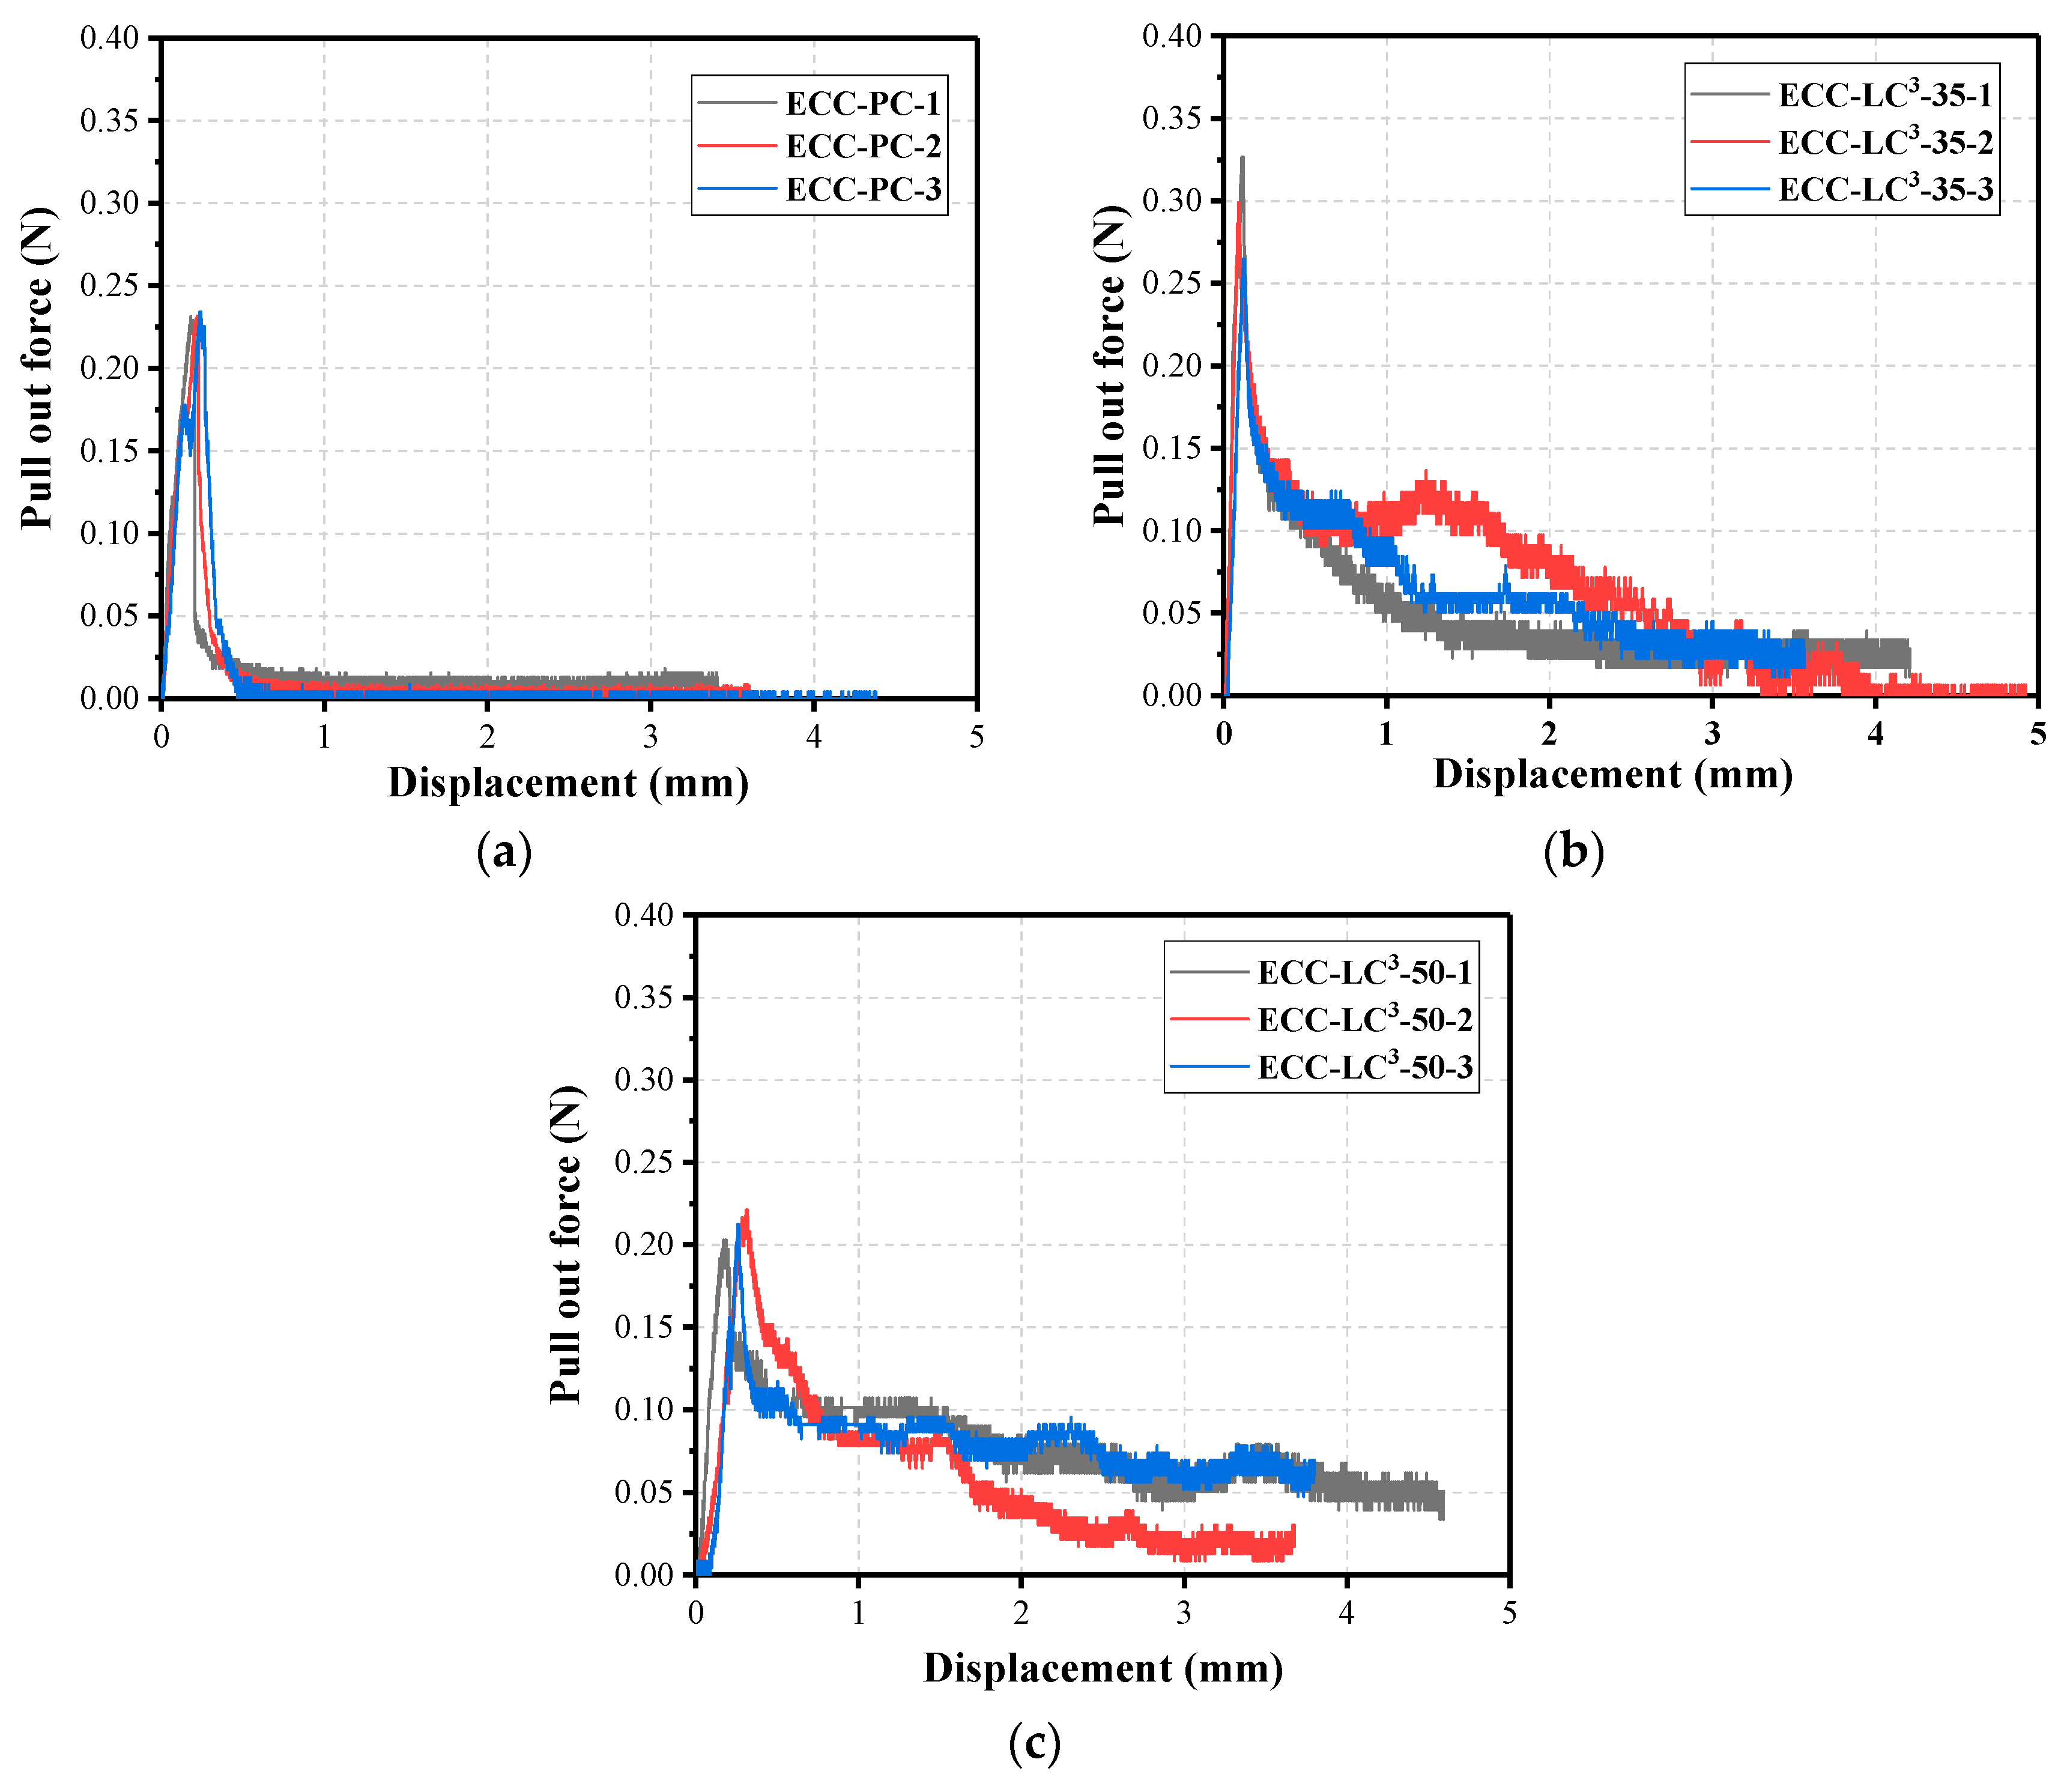
To characterize the interfacial properties between PE fiber and LC
3-based cementitious matrix, the single fiber pullout test was performed. The alignment-controlled PE fiber was taped to a plastic mold and the fresh mixture was poured in. The specimen was demolded after 24 h and then cured in a room environment until 28 days. Through properly cutting in perpendicular to the fiber length direction, the single fiber pullout samples were obtained. The fiber embedment length of each sample was 6 mm, and the fiber-free length was 1 mm. The pullout test was carried out using a universal testing machine. The fiber-free end was glued to an aluminum plate connected to the load cell and the bottom of the single fiber pullout specimen was taped to the base plate of the device. The pullout force was measured by a 5 N load cell. The whole test setup was illustrated in
Figure 4. For each mixture type, at least 3 specimens were tested. During the test, the displacement-controlled load was applied at a rate of 1 mm/min.
2.5. Microstructure Characterization Test
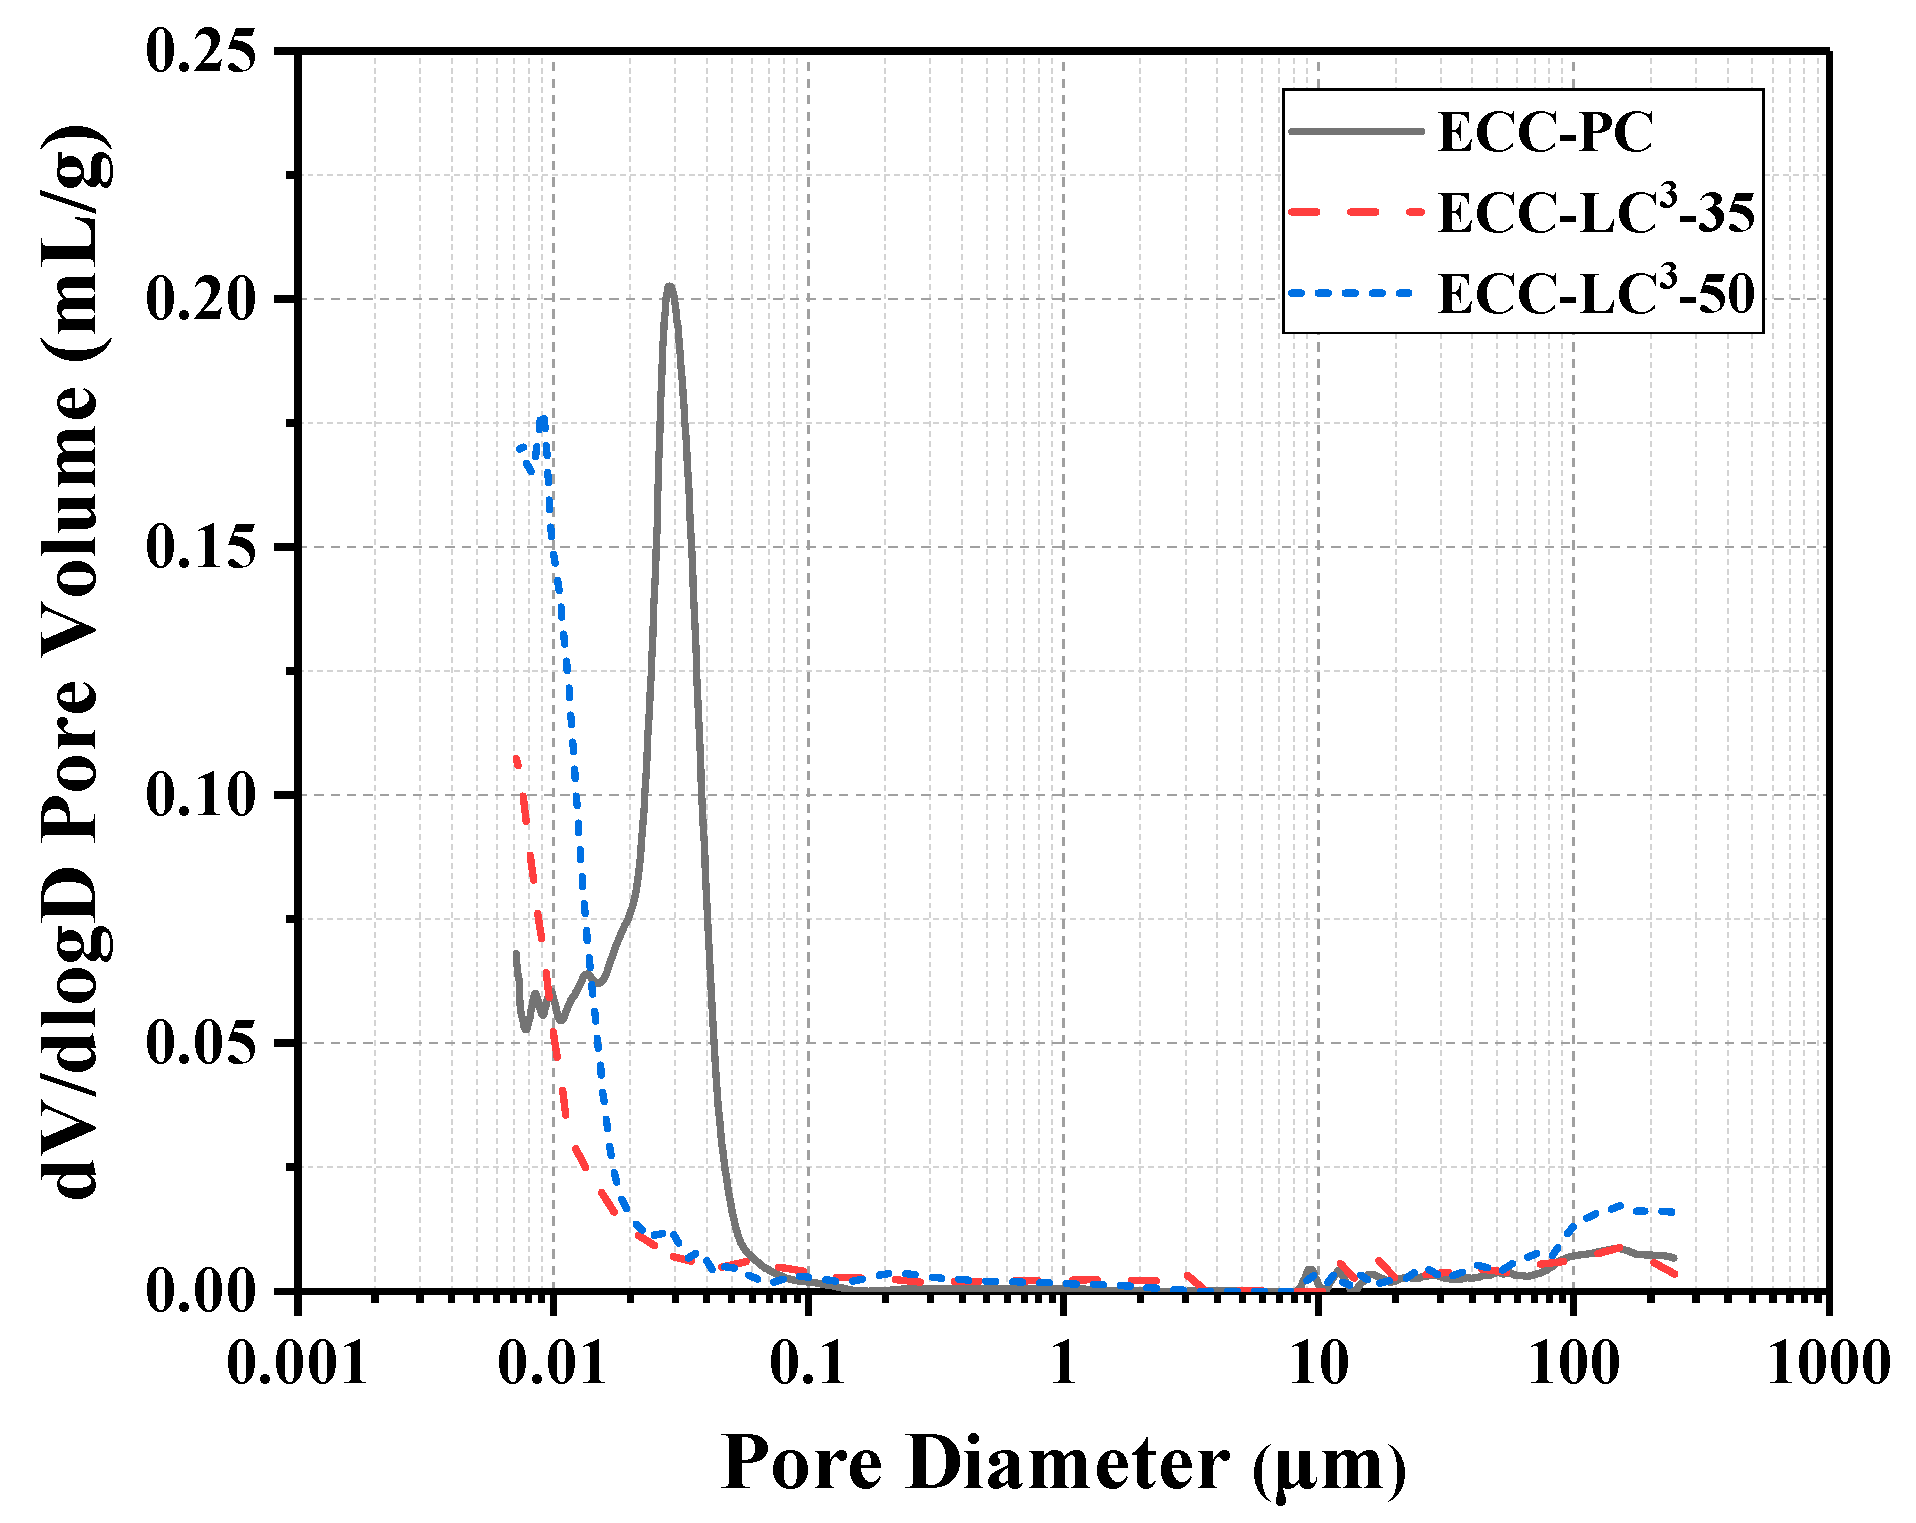
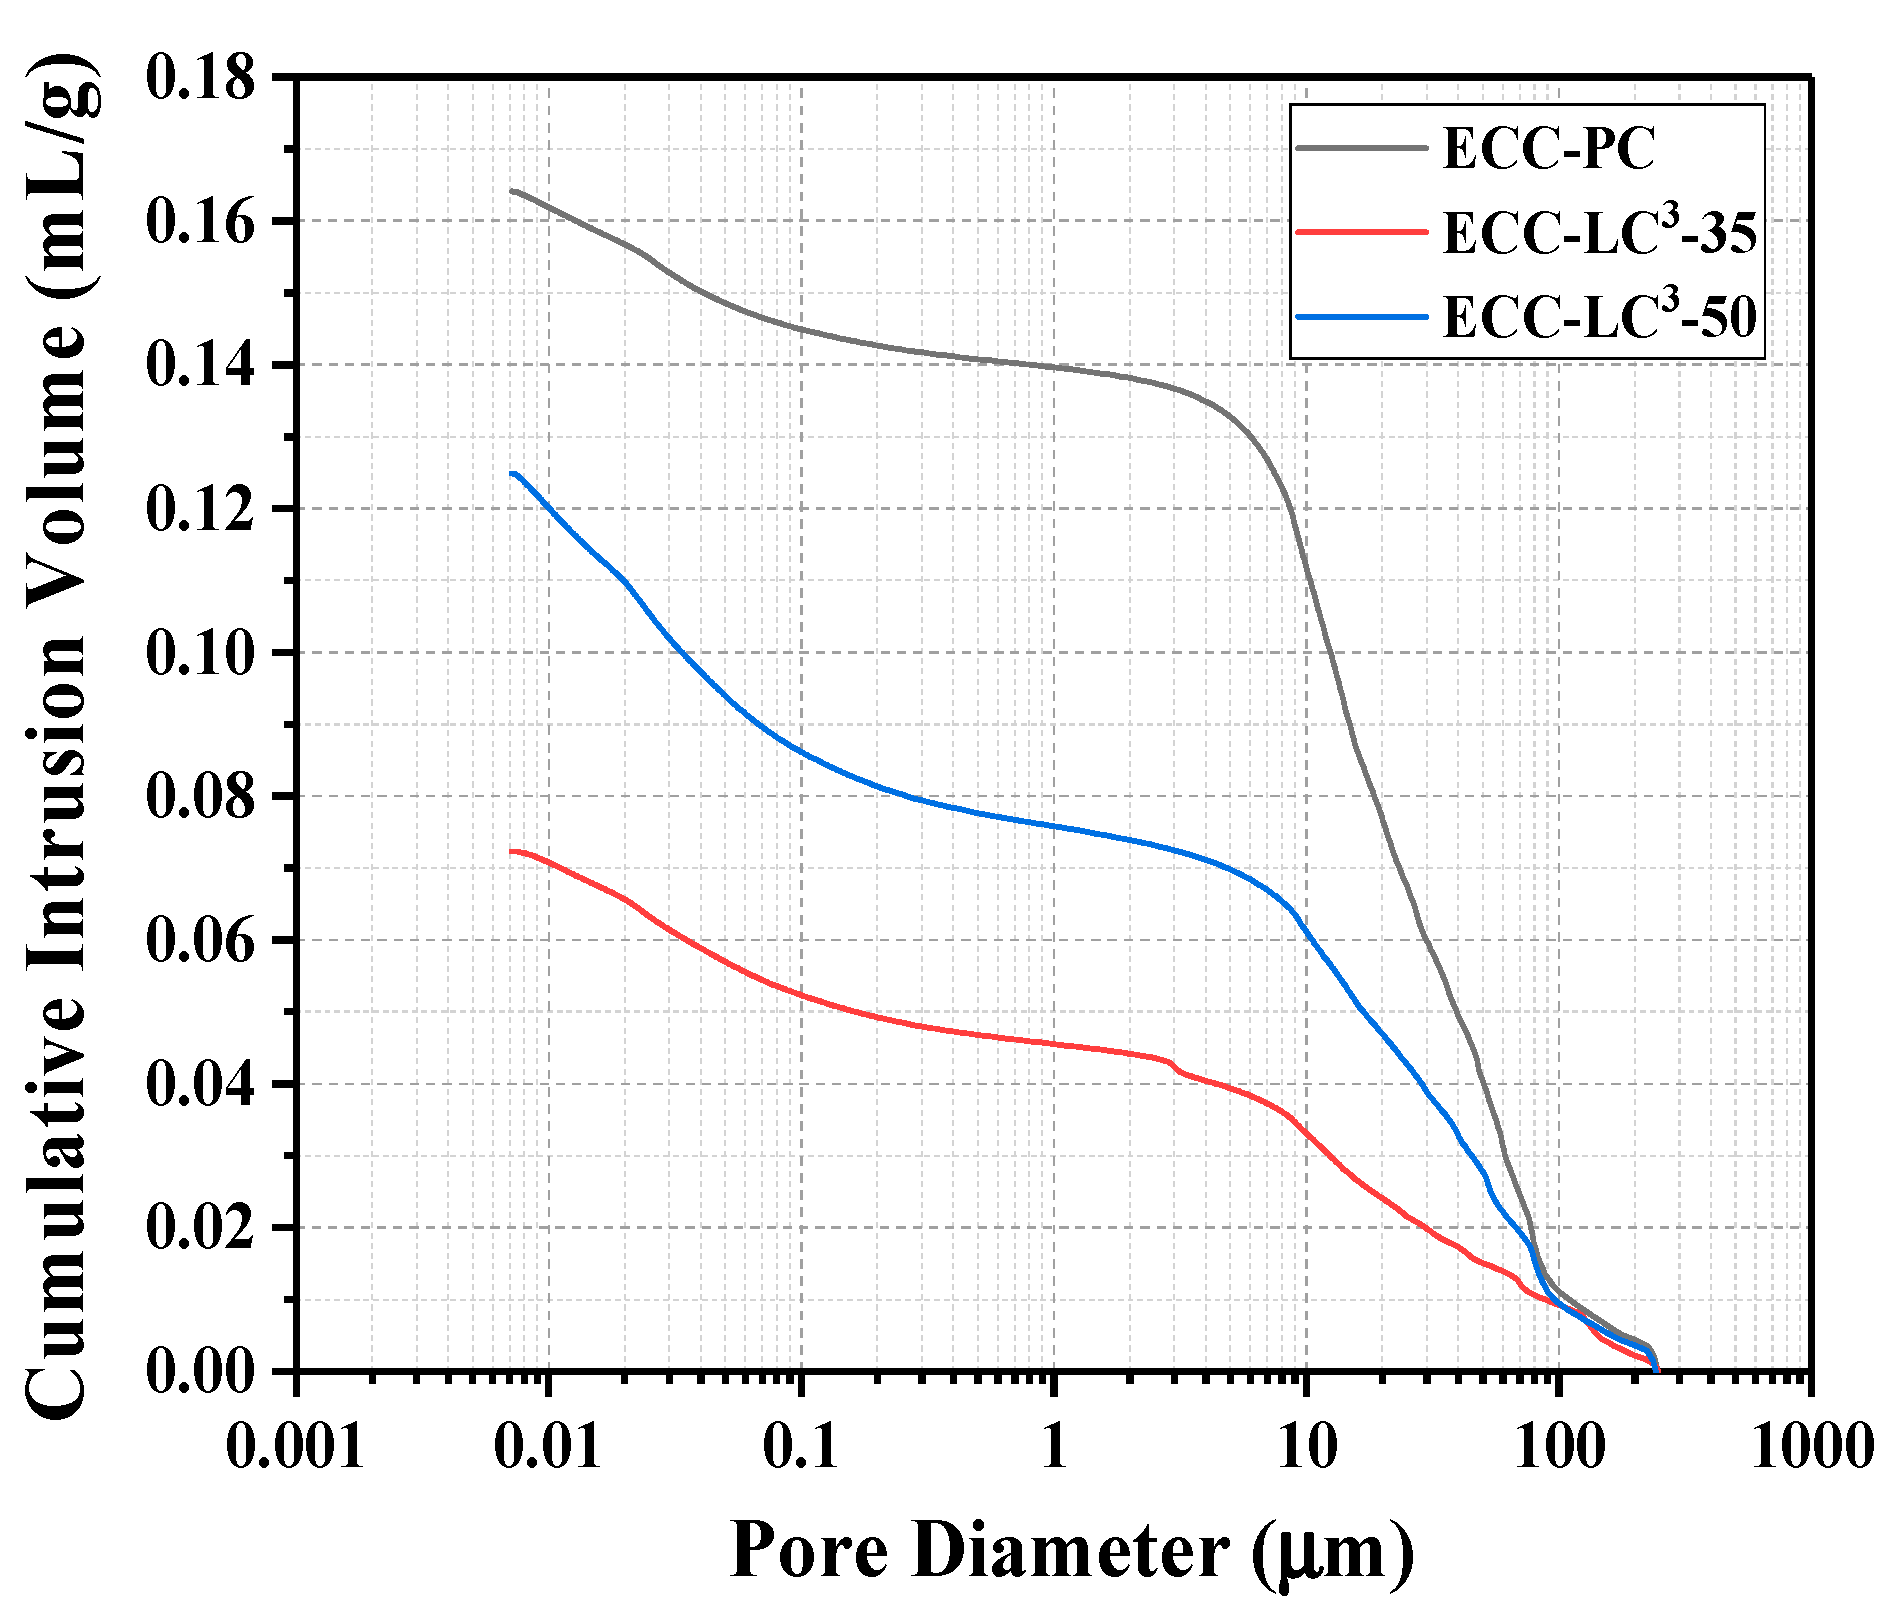
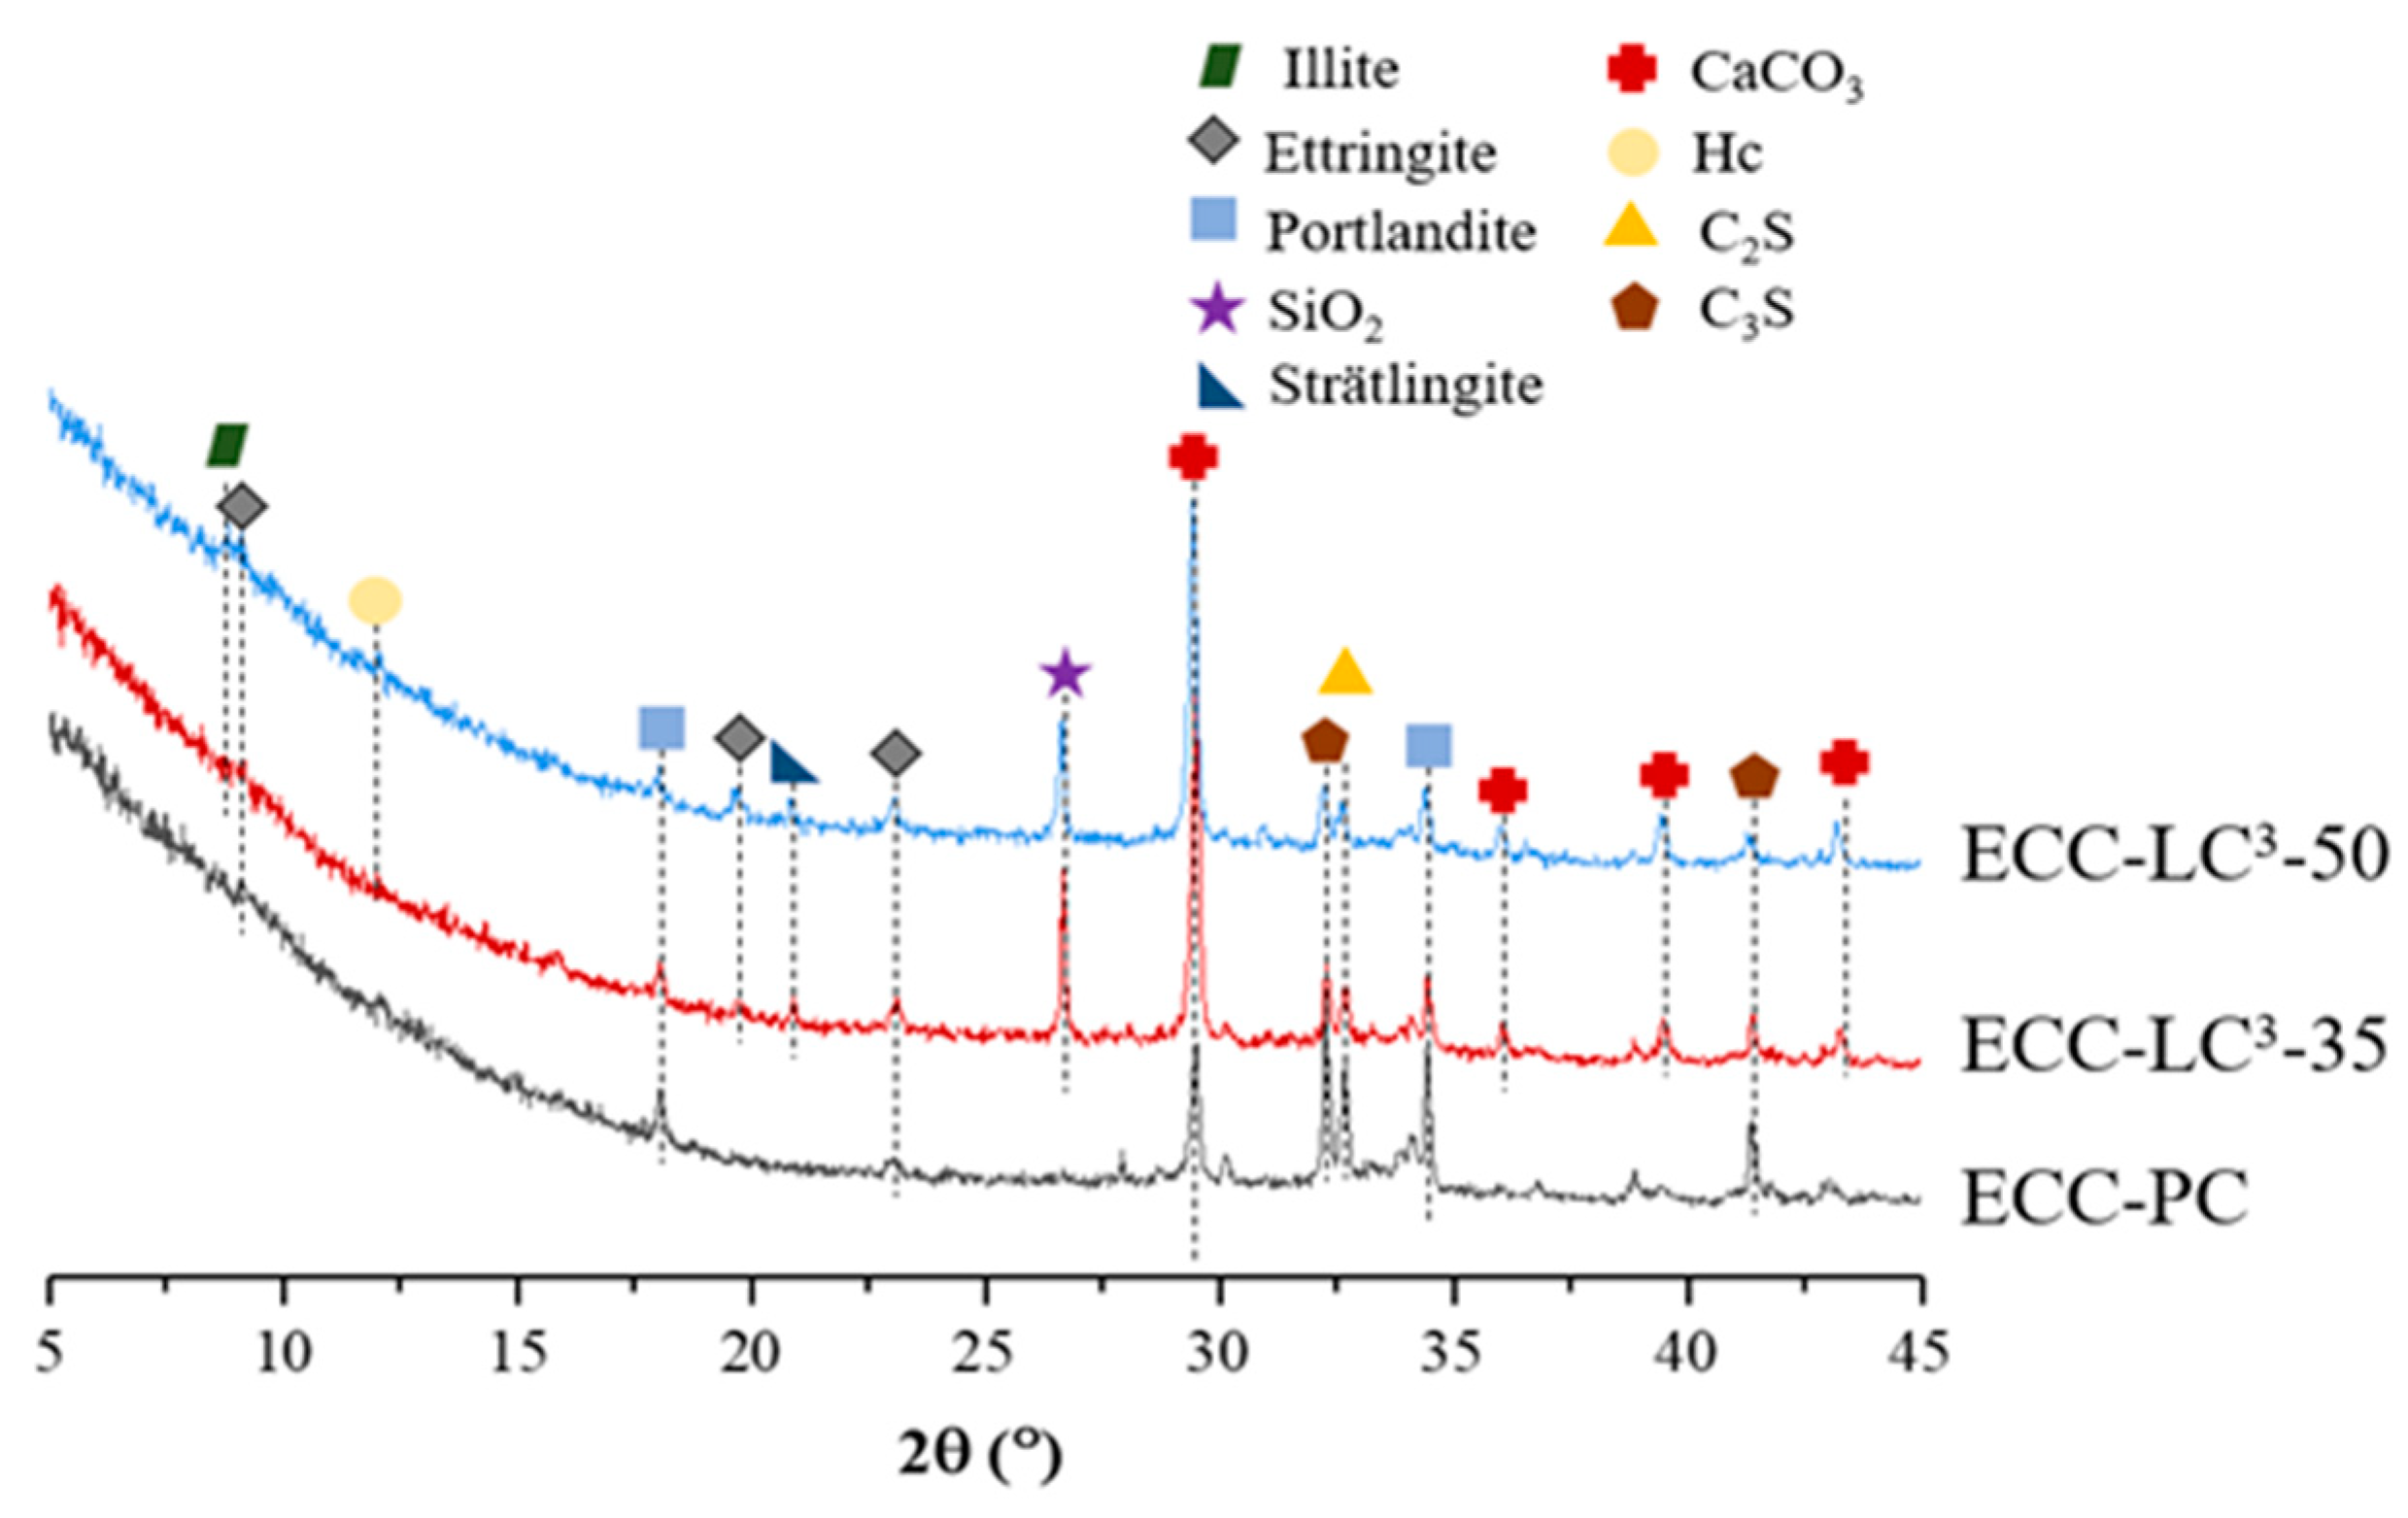
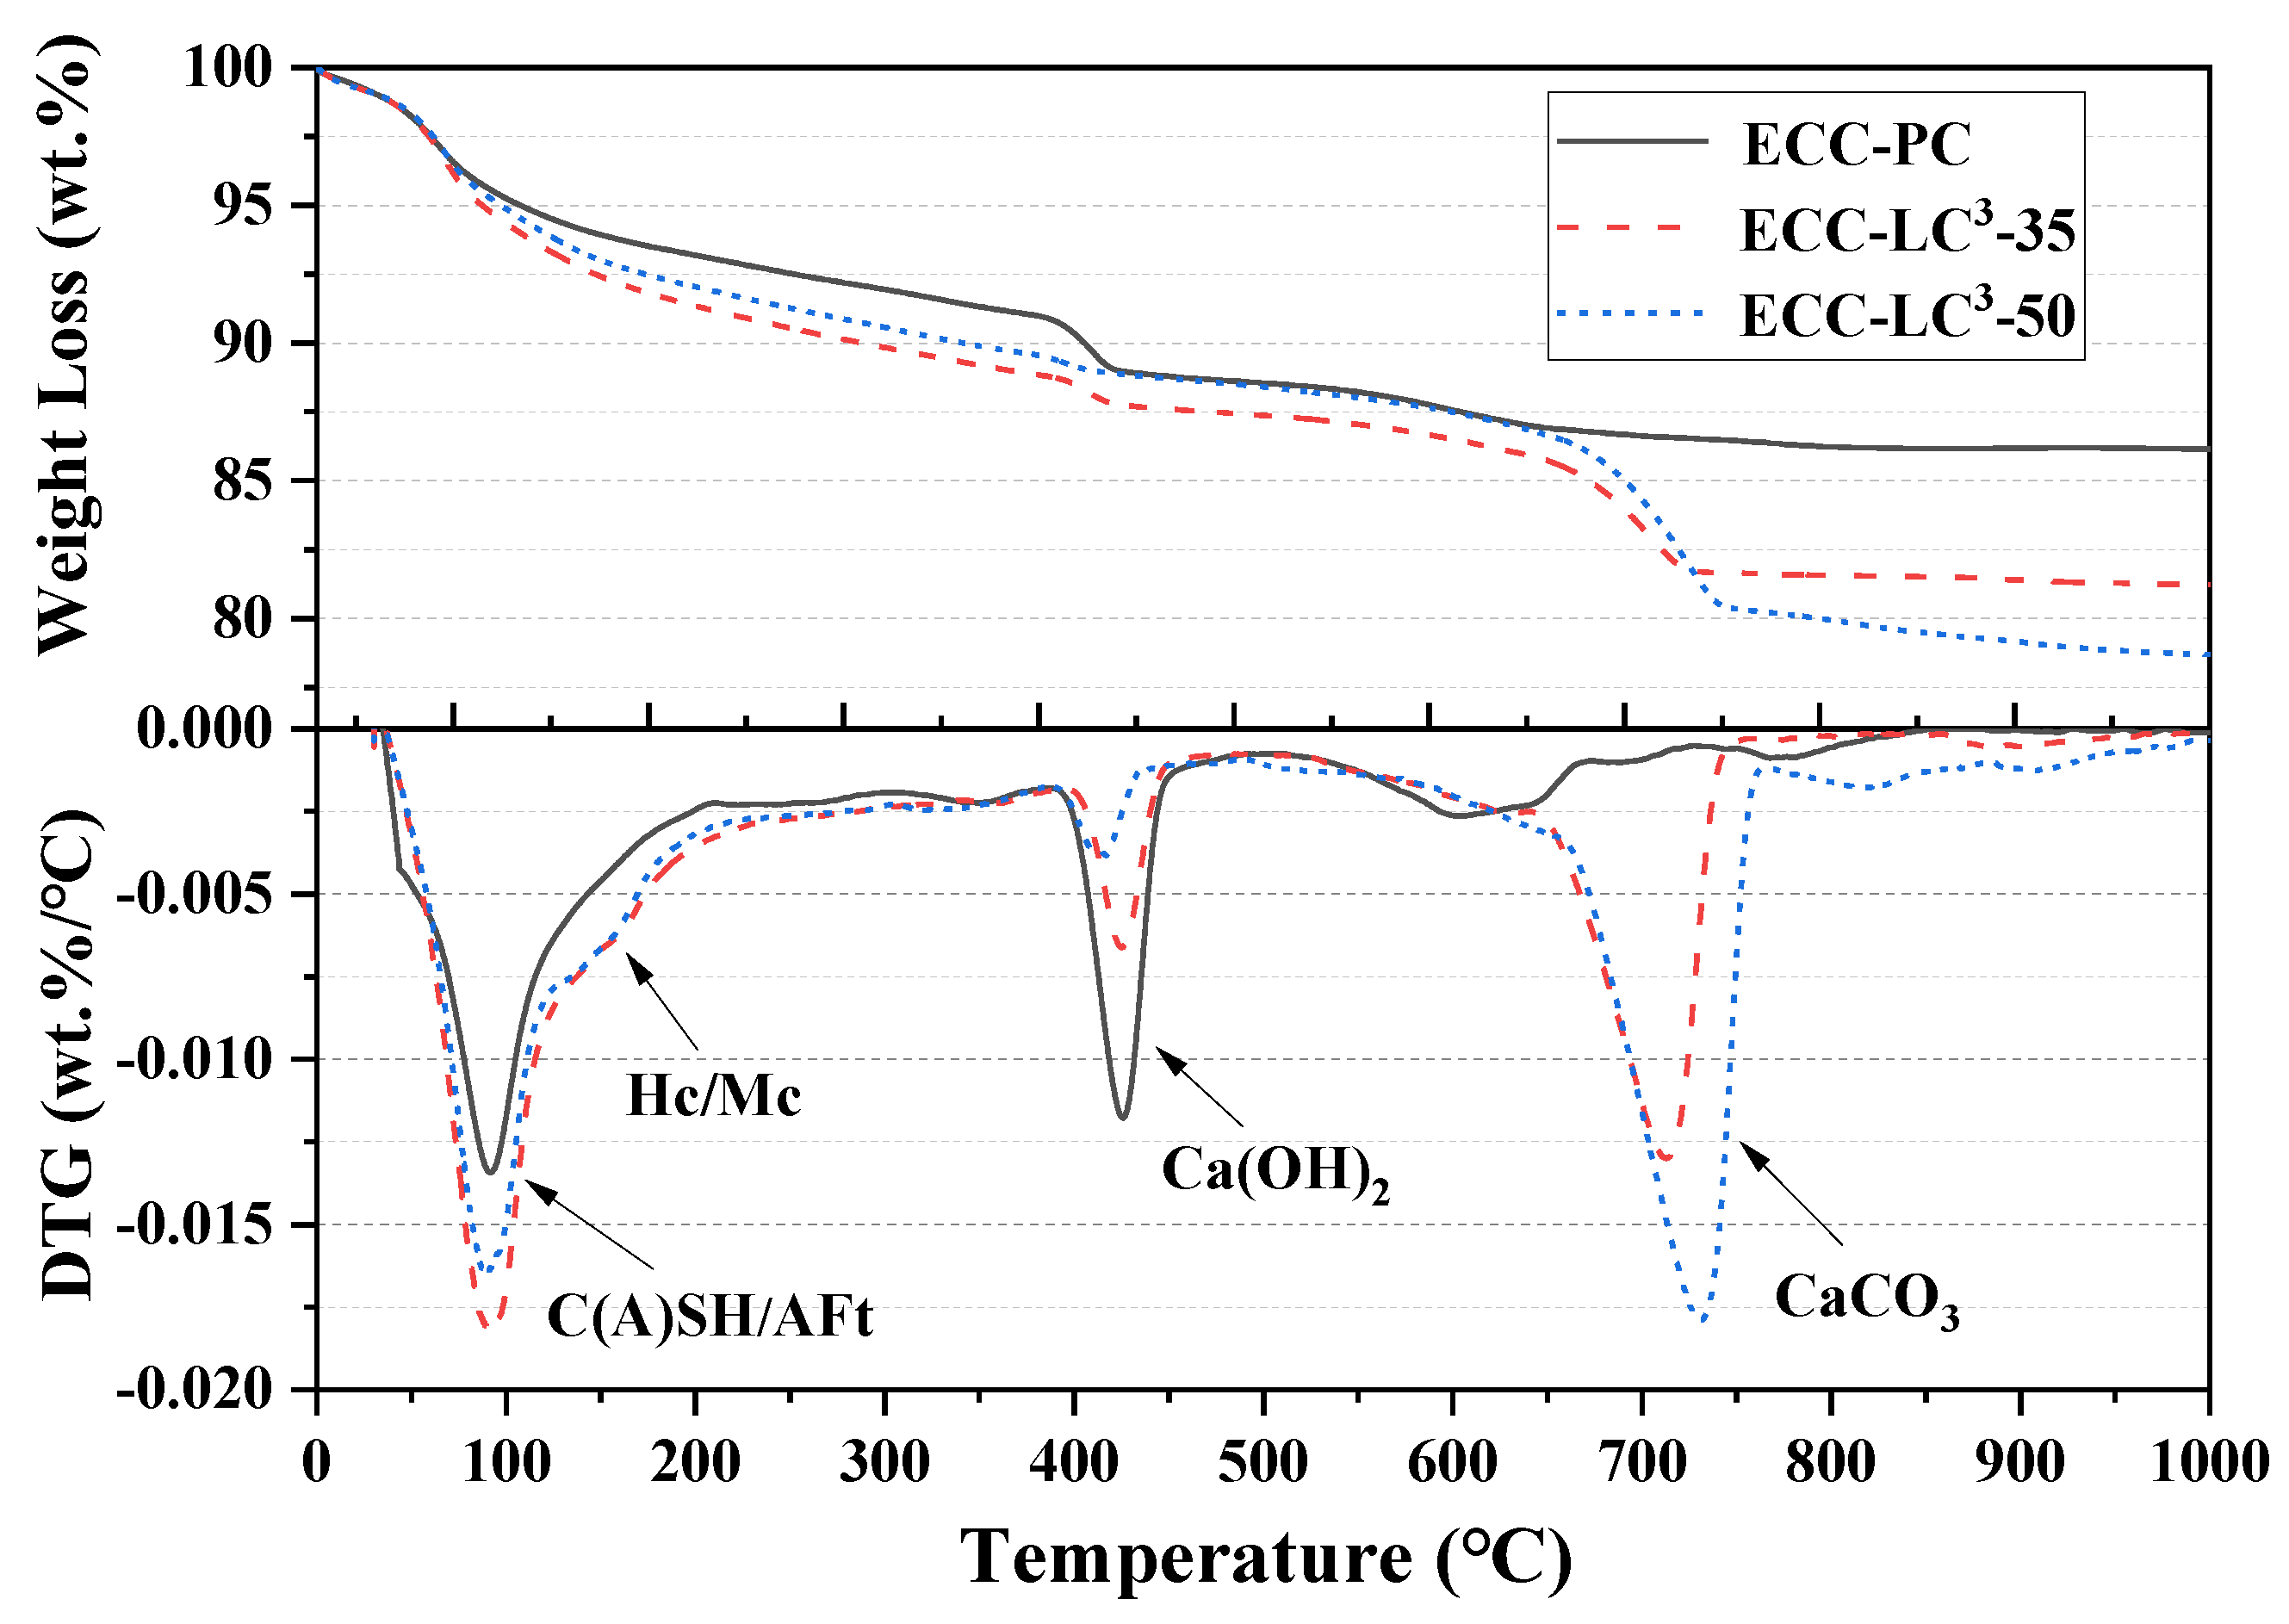
To characterize the influence of LC3 binder system on the micropore structure of ECC matrix, MIP was used to determine the porosity and pore size distribution curves of the matrix. Poromaster GT-60 Mercury Intrusion Porosimeter, Quantachromre (Boynton Beach, FL, USA), was used for MIP testing. The small sample particles were immersed in absolute ethyl alcohol to terminate hydration and then vacuum oven-dried at 60 ℃ for 24 h before test. The hydration phases of the cementitious matrix were investigated by carrying out XRD test. D8 ADVANCE X-Ray Diffractometer, BRUKER, AXS (Karlsruhe, Germany), was used for XRD testing. Samples were vacuum dried and then grounded into fine powders. Cu Kα radiation (λ = 1.54 Å) was performed at 40 kV and 40 mA, and the scan speed was set to be 0.02°/step. The TGA test was also conducted to study the phase assemblage of ECC matrix. STA409PC Simultaneous Thermal Analyzer, Netzsch (Nedgex GmbH, Selb, Germany), was used for TGA testing. The dried sample particles were heated from the range of 30 ℃ to 1000 ℃under a nitrogen atmosphere at a rate of 10 ℃/min. The weight loss was analyzed afterward.
2.6. Methodologies of Environmental Impact Assessment
Life cycle assessment (LCA) is conducted to evaluate the potential environmental impact of ECC, for which four steps, including system boundary definition, inventory analysis, assessing impacts, and interpretation of results, are conducted based on the guideline of ISO 14040. This work focused on the environmental impact caused by the raw material processing of ECC. GaBi software (10.5.1.124, Sphera Solutions GmbH, Leinfelden-Echterdingen, Germany), that has a self-developed database was used for LCA analysis. This database could connect with the commonly used international databases, which enhances the correctness of data and ensures the reliability of LCA results.
6. Conclusions
A comprehensive investigation concerning the macroscopic mechanical properties, matrix/fiber interfacial properties, microstructural characteristics, fiber distribution homogeneity, and the potential environmental impact of ECC incorporating different dosages of LC3 is carried out. The following conclusions can be drawn.
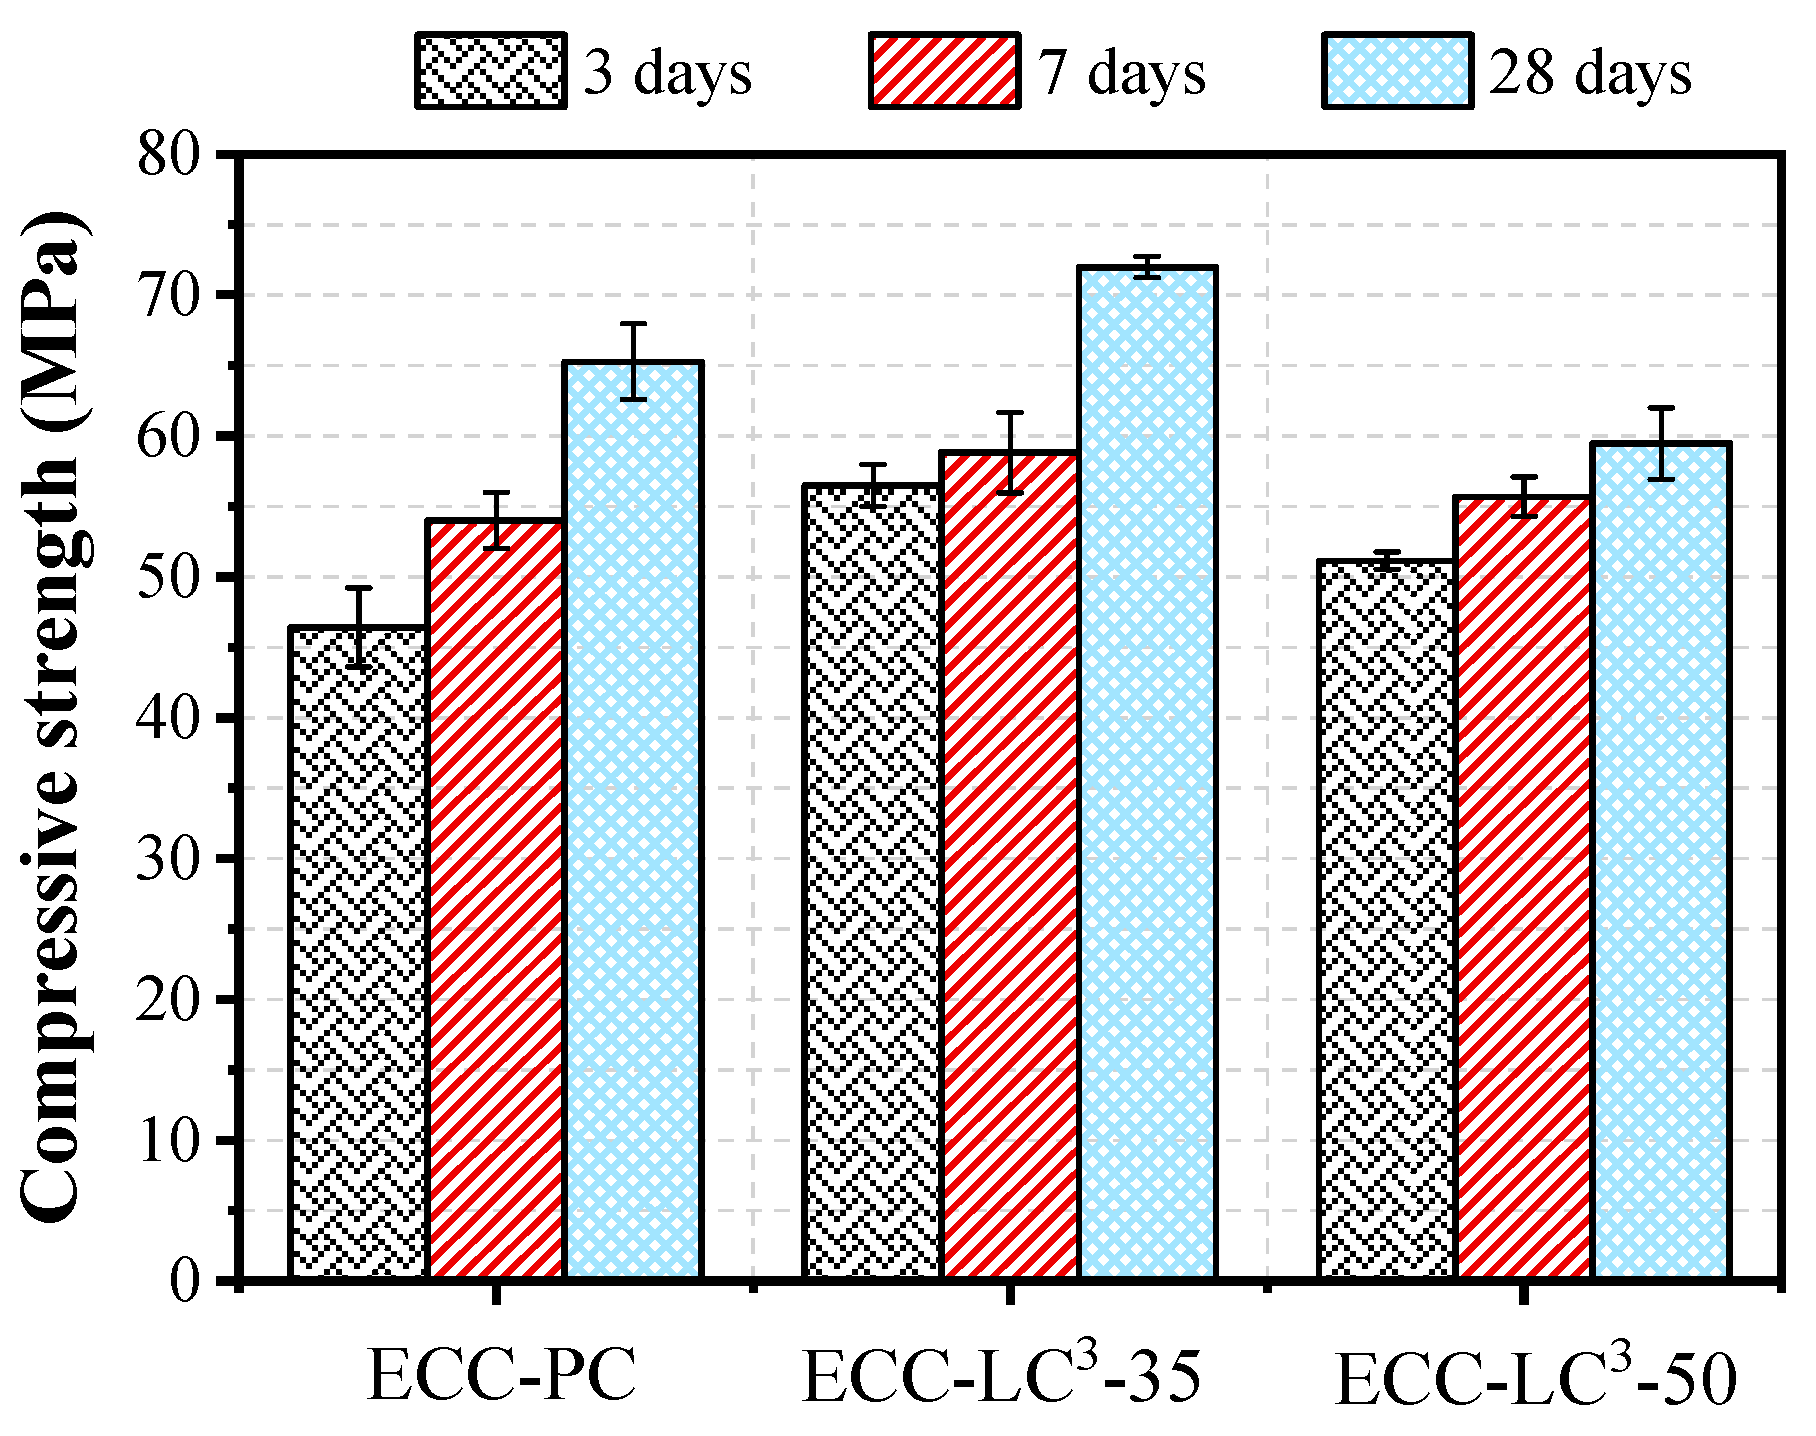
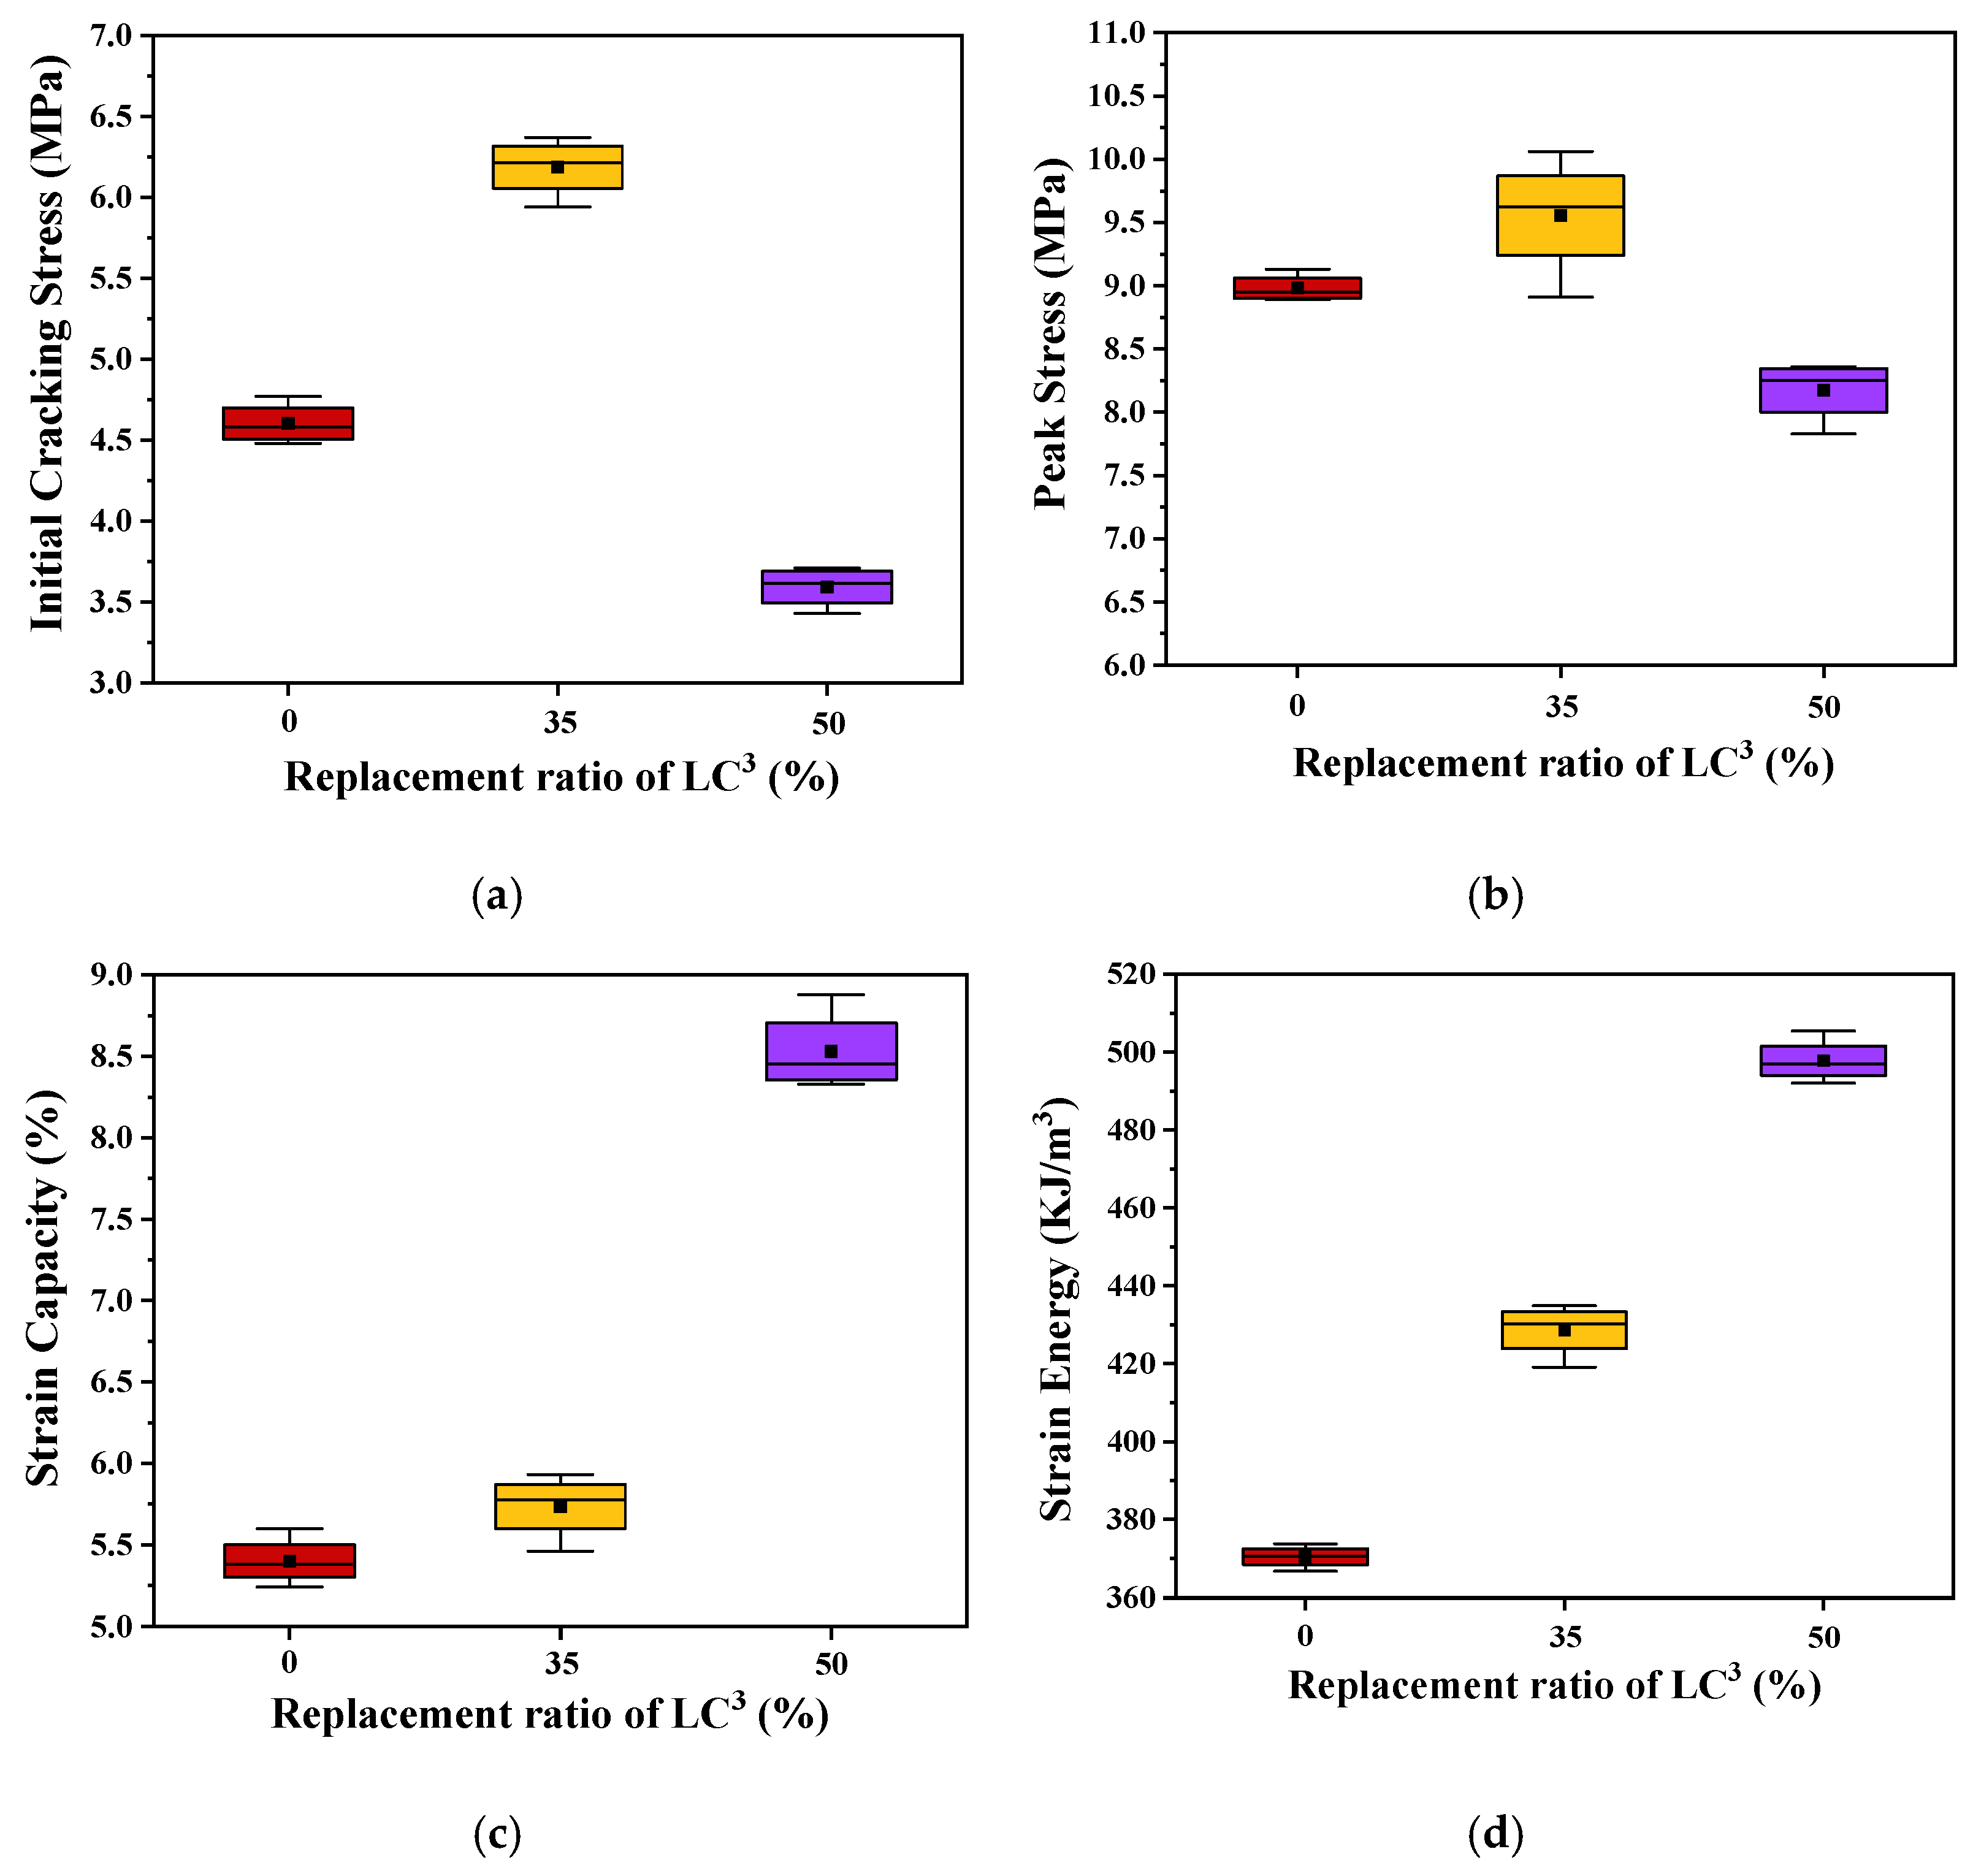
(1) The pozzolanic reactivity of calcined clay plays a dominant role in determining the compressive strength at an early age, while, at 28 days, the compressive strength shows first a rising and then a descending trend with the increasing of LC3 replacement ratio. A similar tendency is observed for the tensile strength of the composites as well as the fiber/matrix interfacial bond strength at 28 days. The strength loss of ECC-LC3–50 could be attributed to the lowering of available Ca(OH)2 content, which limits the pozzolanic reaction.
(2) The strain capacity of ECC is largely enhanced with the incorporation of LC. The increment ratio rises with the increase of LC3 dosage, with the strain capacity of ECC-LC3–50 being 57.96% higher than that of the OPC-based ECC. The improvement of strain hardening behavior is closely related to the higher fiber dispersion uniformity of LC3-based groups. For ECC-LC3–50, the relatively low initial cracking stress further favors the growth of cracks in a controlled manner.
(3) The addition of LC3 leads to the pore refinement of the ECC matrix, especially for the ECC-LC3–35 group, which exhibits the highest strength at 28 days. The composition analysis indicates that carboaluminates are generated owing to the reaction between aluminates and calcium carbonate from limestone. Additional hydration products including C-(A)-S-H and Aft are also formed, which contributes to the densification of the microstructure of the ECC matrix. Besides, the Ca(OH)2 content is dramatically reduced while the CaCO3 content is remarkably increased.
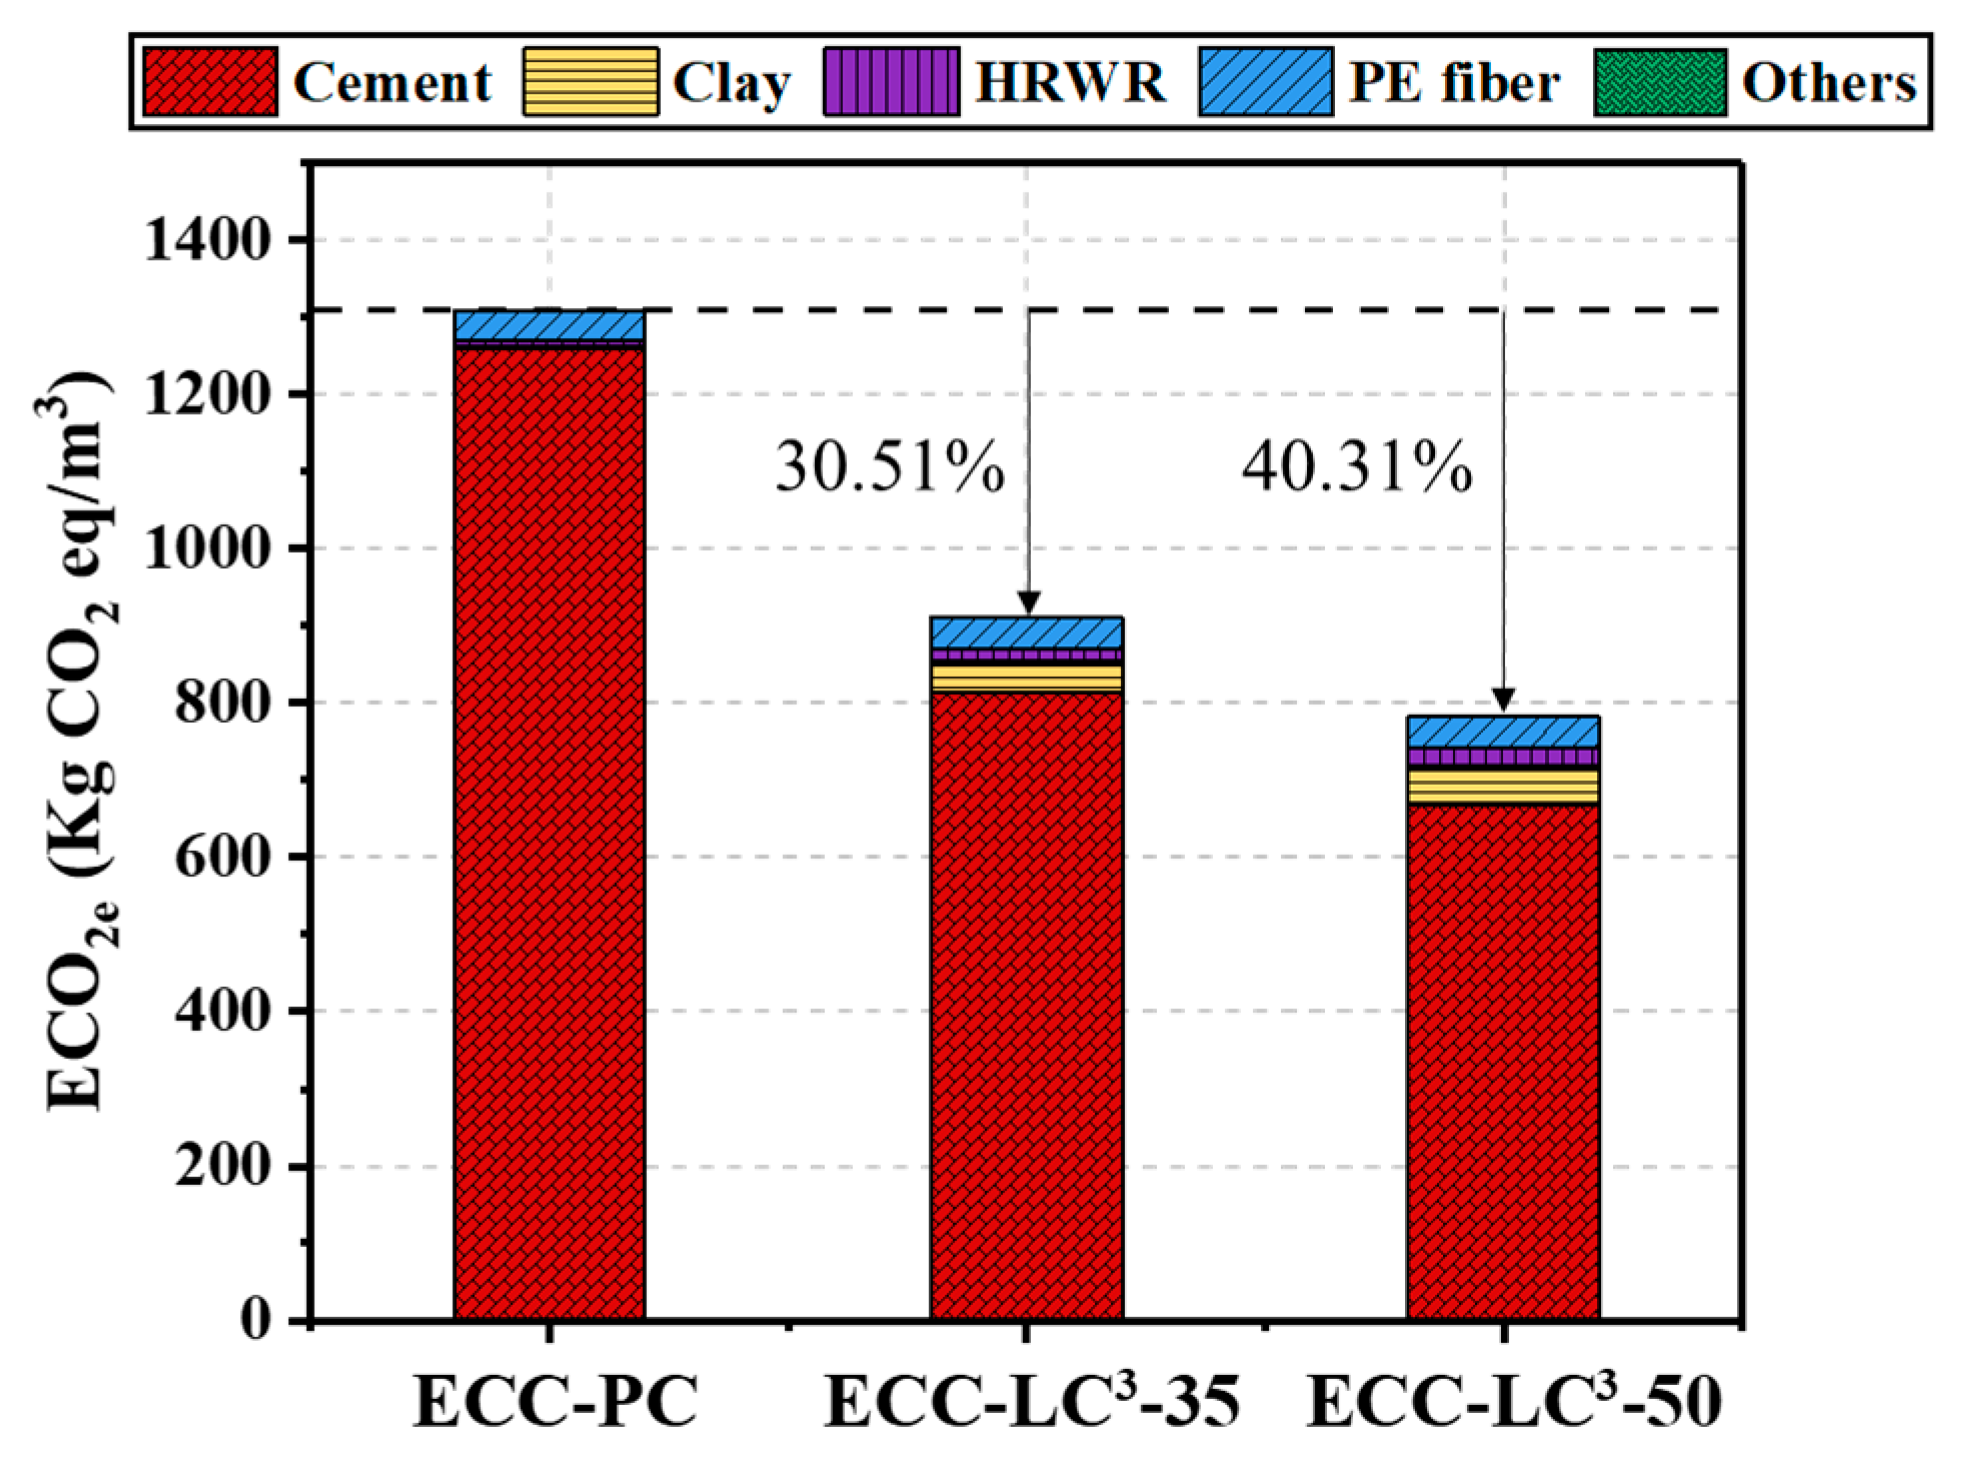
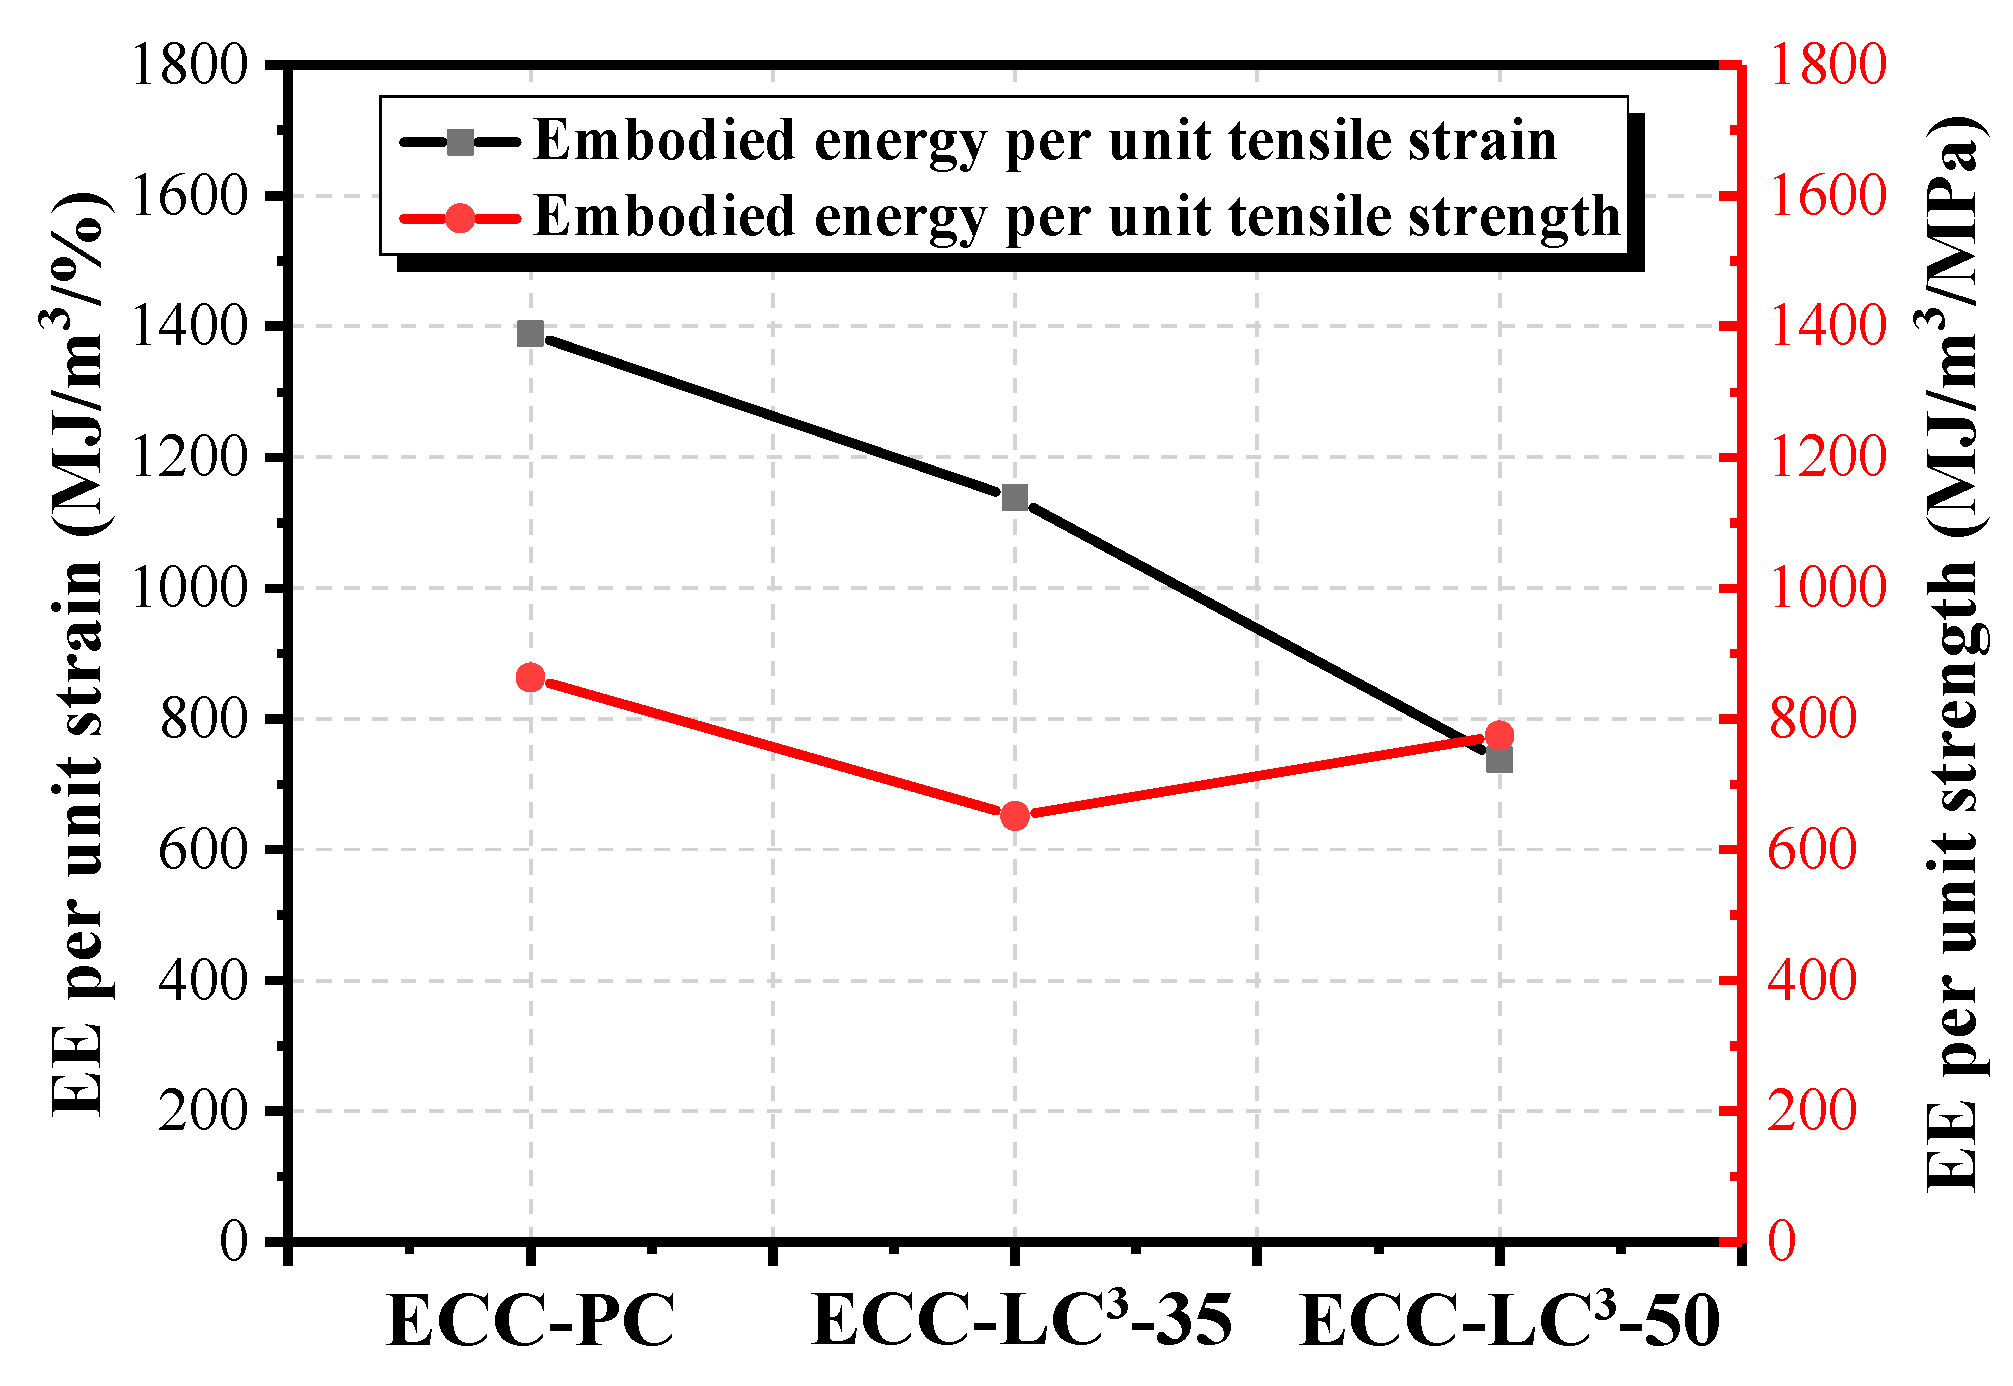
(4) The results of the life cycle assessment imply that the environmental impact of cement among all the components of ECC is the highest. When OPC is partly replaced by LC3, the consumed energy and equivalent CO2 emission decrease, especially the equivalent CO2 emission with the reduction ratio attaining 40.31%. Besides, the environmental impact of PE fiber and HRDR is non-negligible. By calculating the energy consumption and the equivalent CO2 emission per unit strain and unit strength, it is found that ECC-LC3–35 exhibits the highest mechanical resistance, and ECC-LC3–50 shows the best deformability from the environmental point of view.


 ,
, 


