
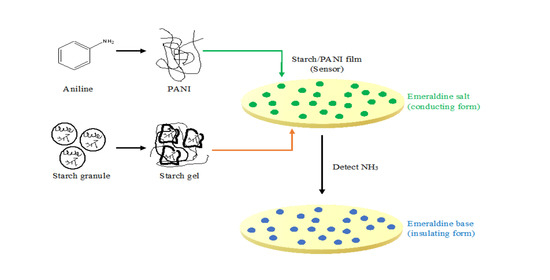
Starch/Polyaniline Biopolymer Film as Potential Intelligent Food Packaging with Colourimetric Ammonia Sensor


Abstract
:
1. Introduction
2. Materials and Methods
2.1. Materials
2.2. Synthesis of Polyaniline (PANI)
2.2.1. Synthesis
2.2.2. Characterisation
2.3. Fabrication of Starch/PANI Films
2.3.1. Synthesis
2.3.2. Characterisation
2.4. Sensor Performance of Starch/PANI Films
3. Results and Discussion
3.1. Characterisation of PANI
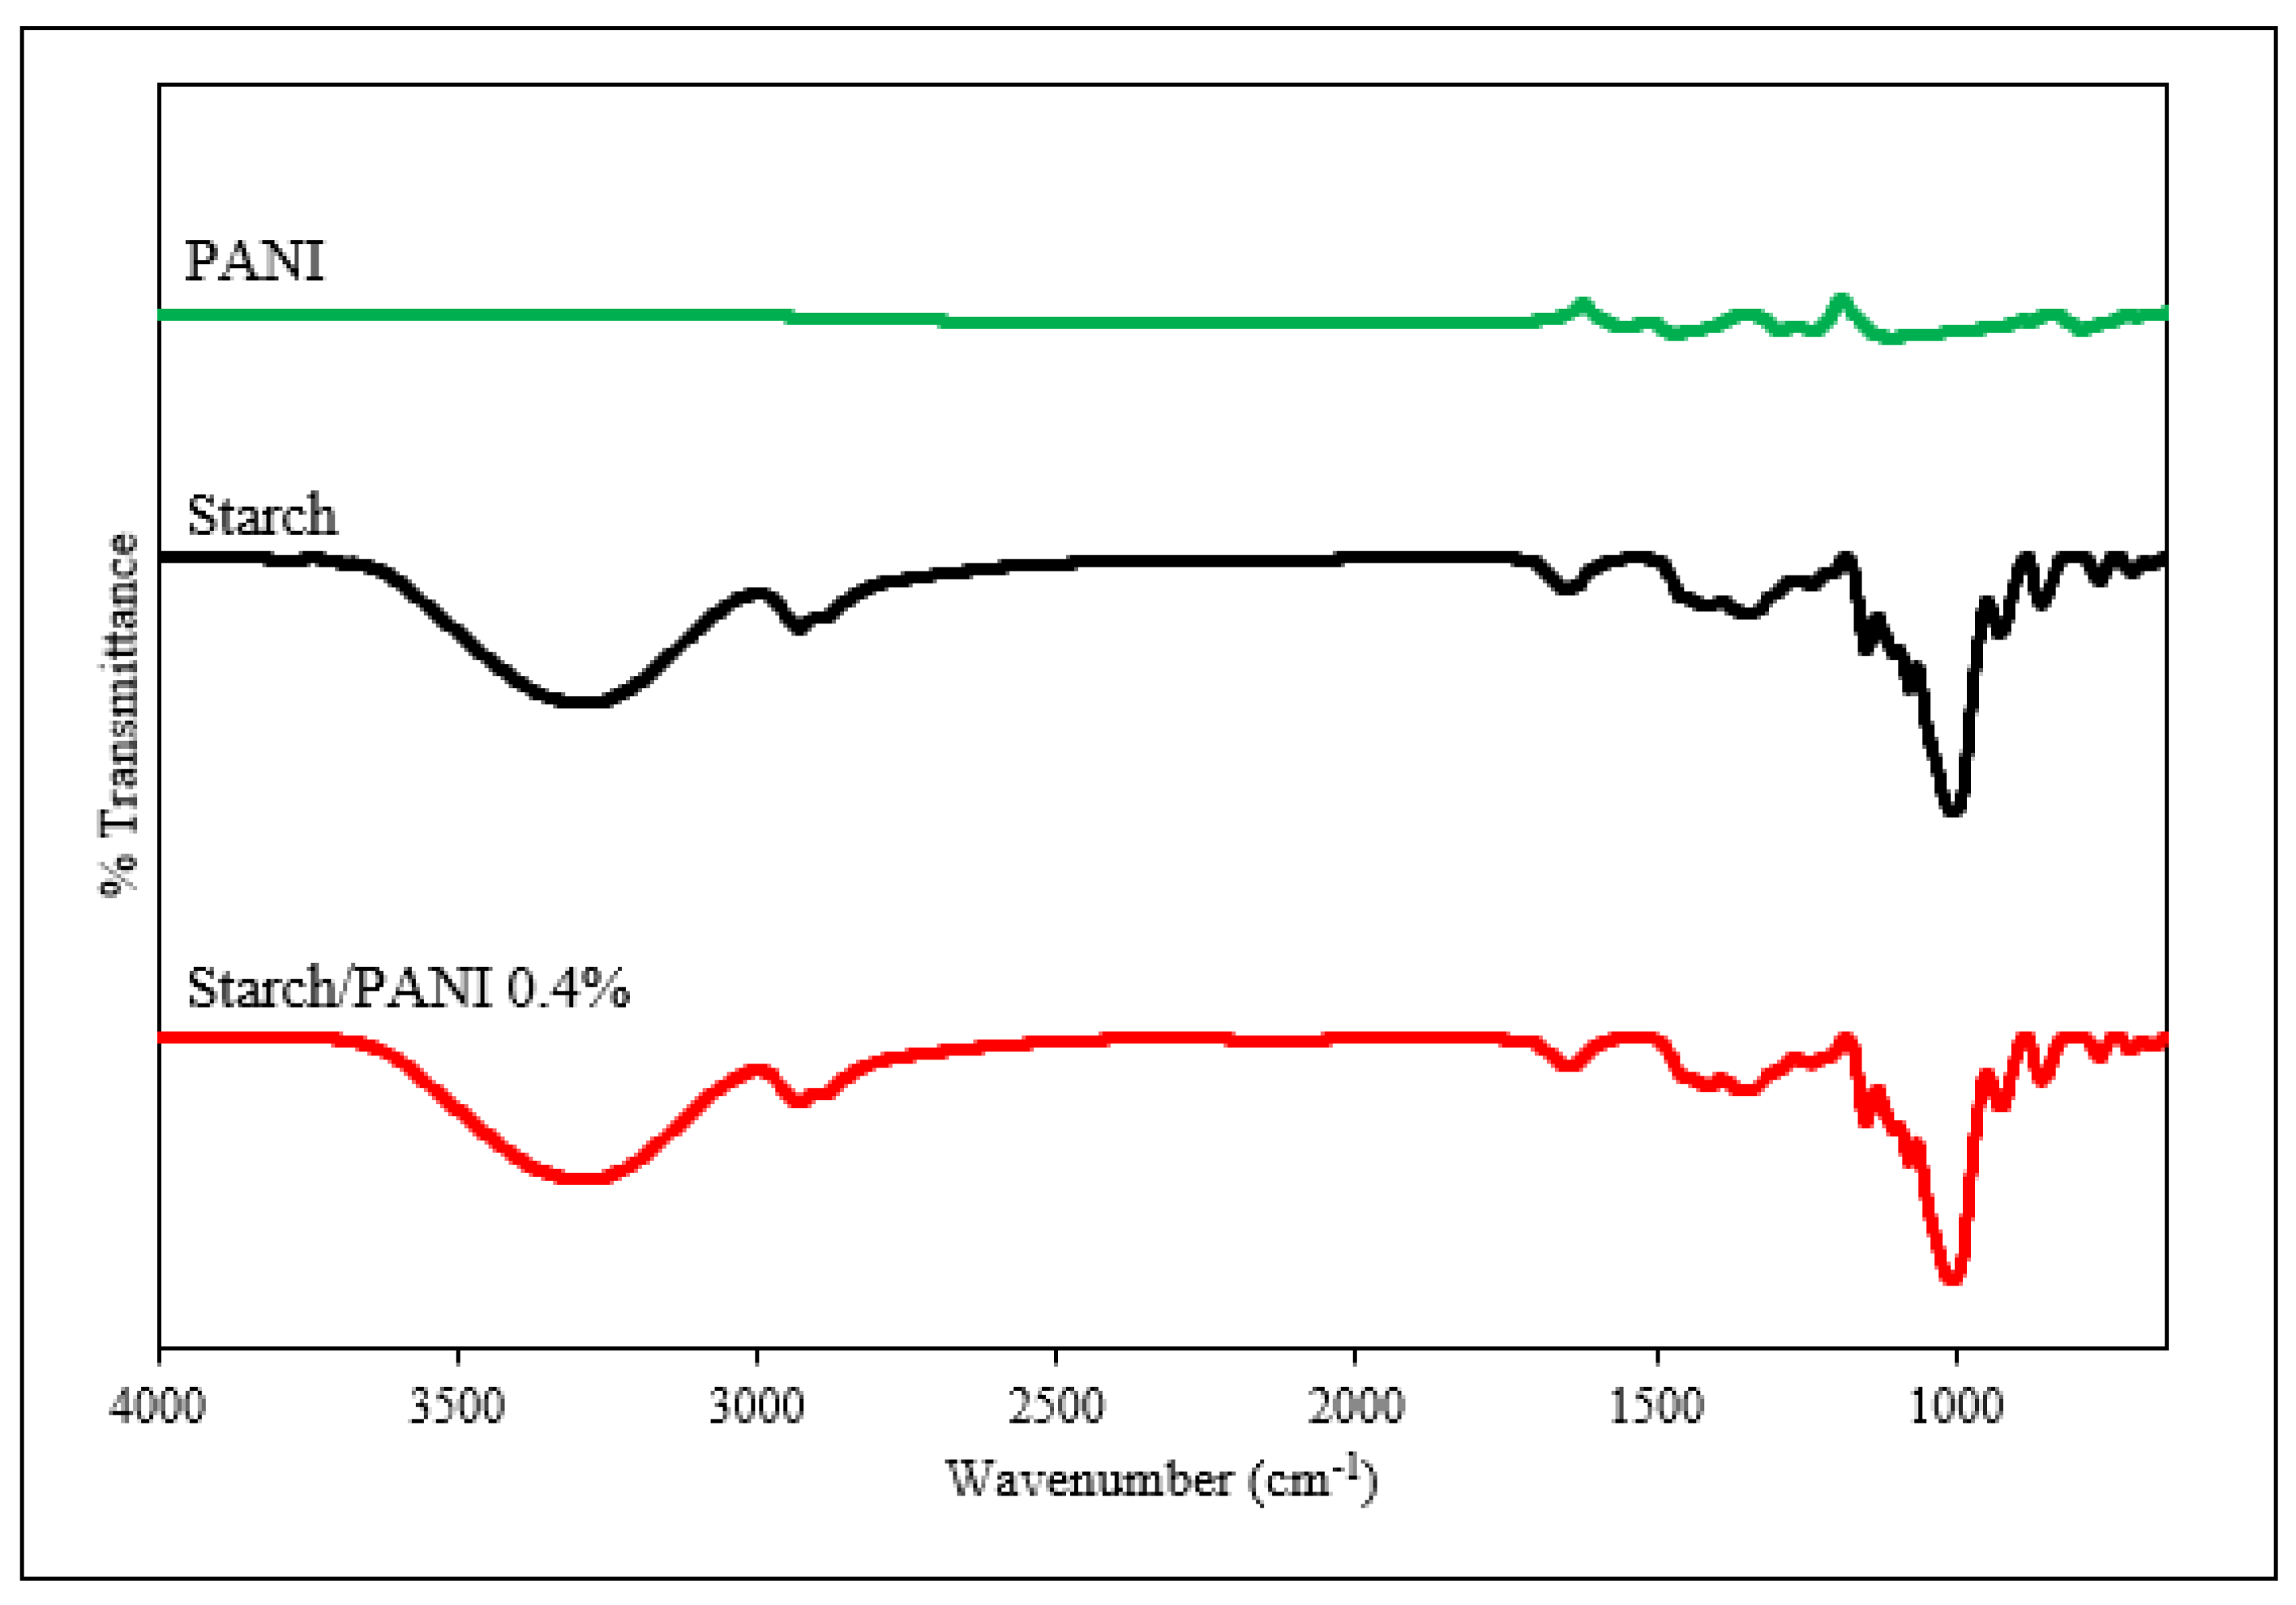
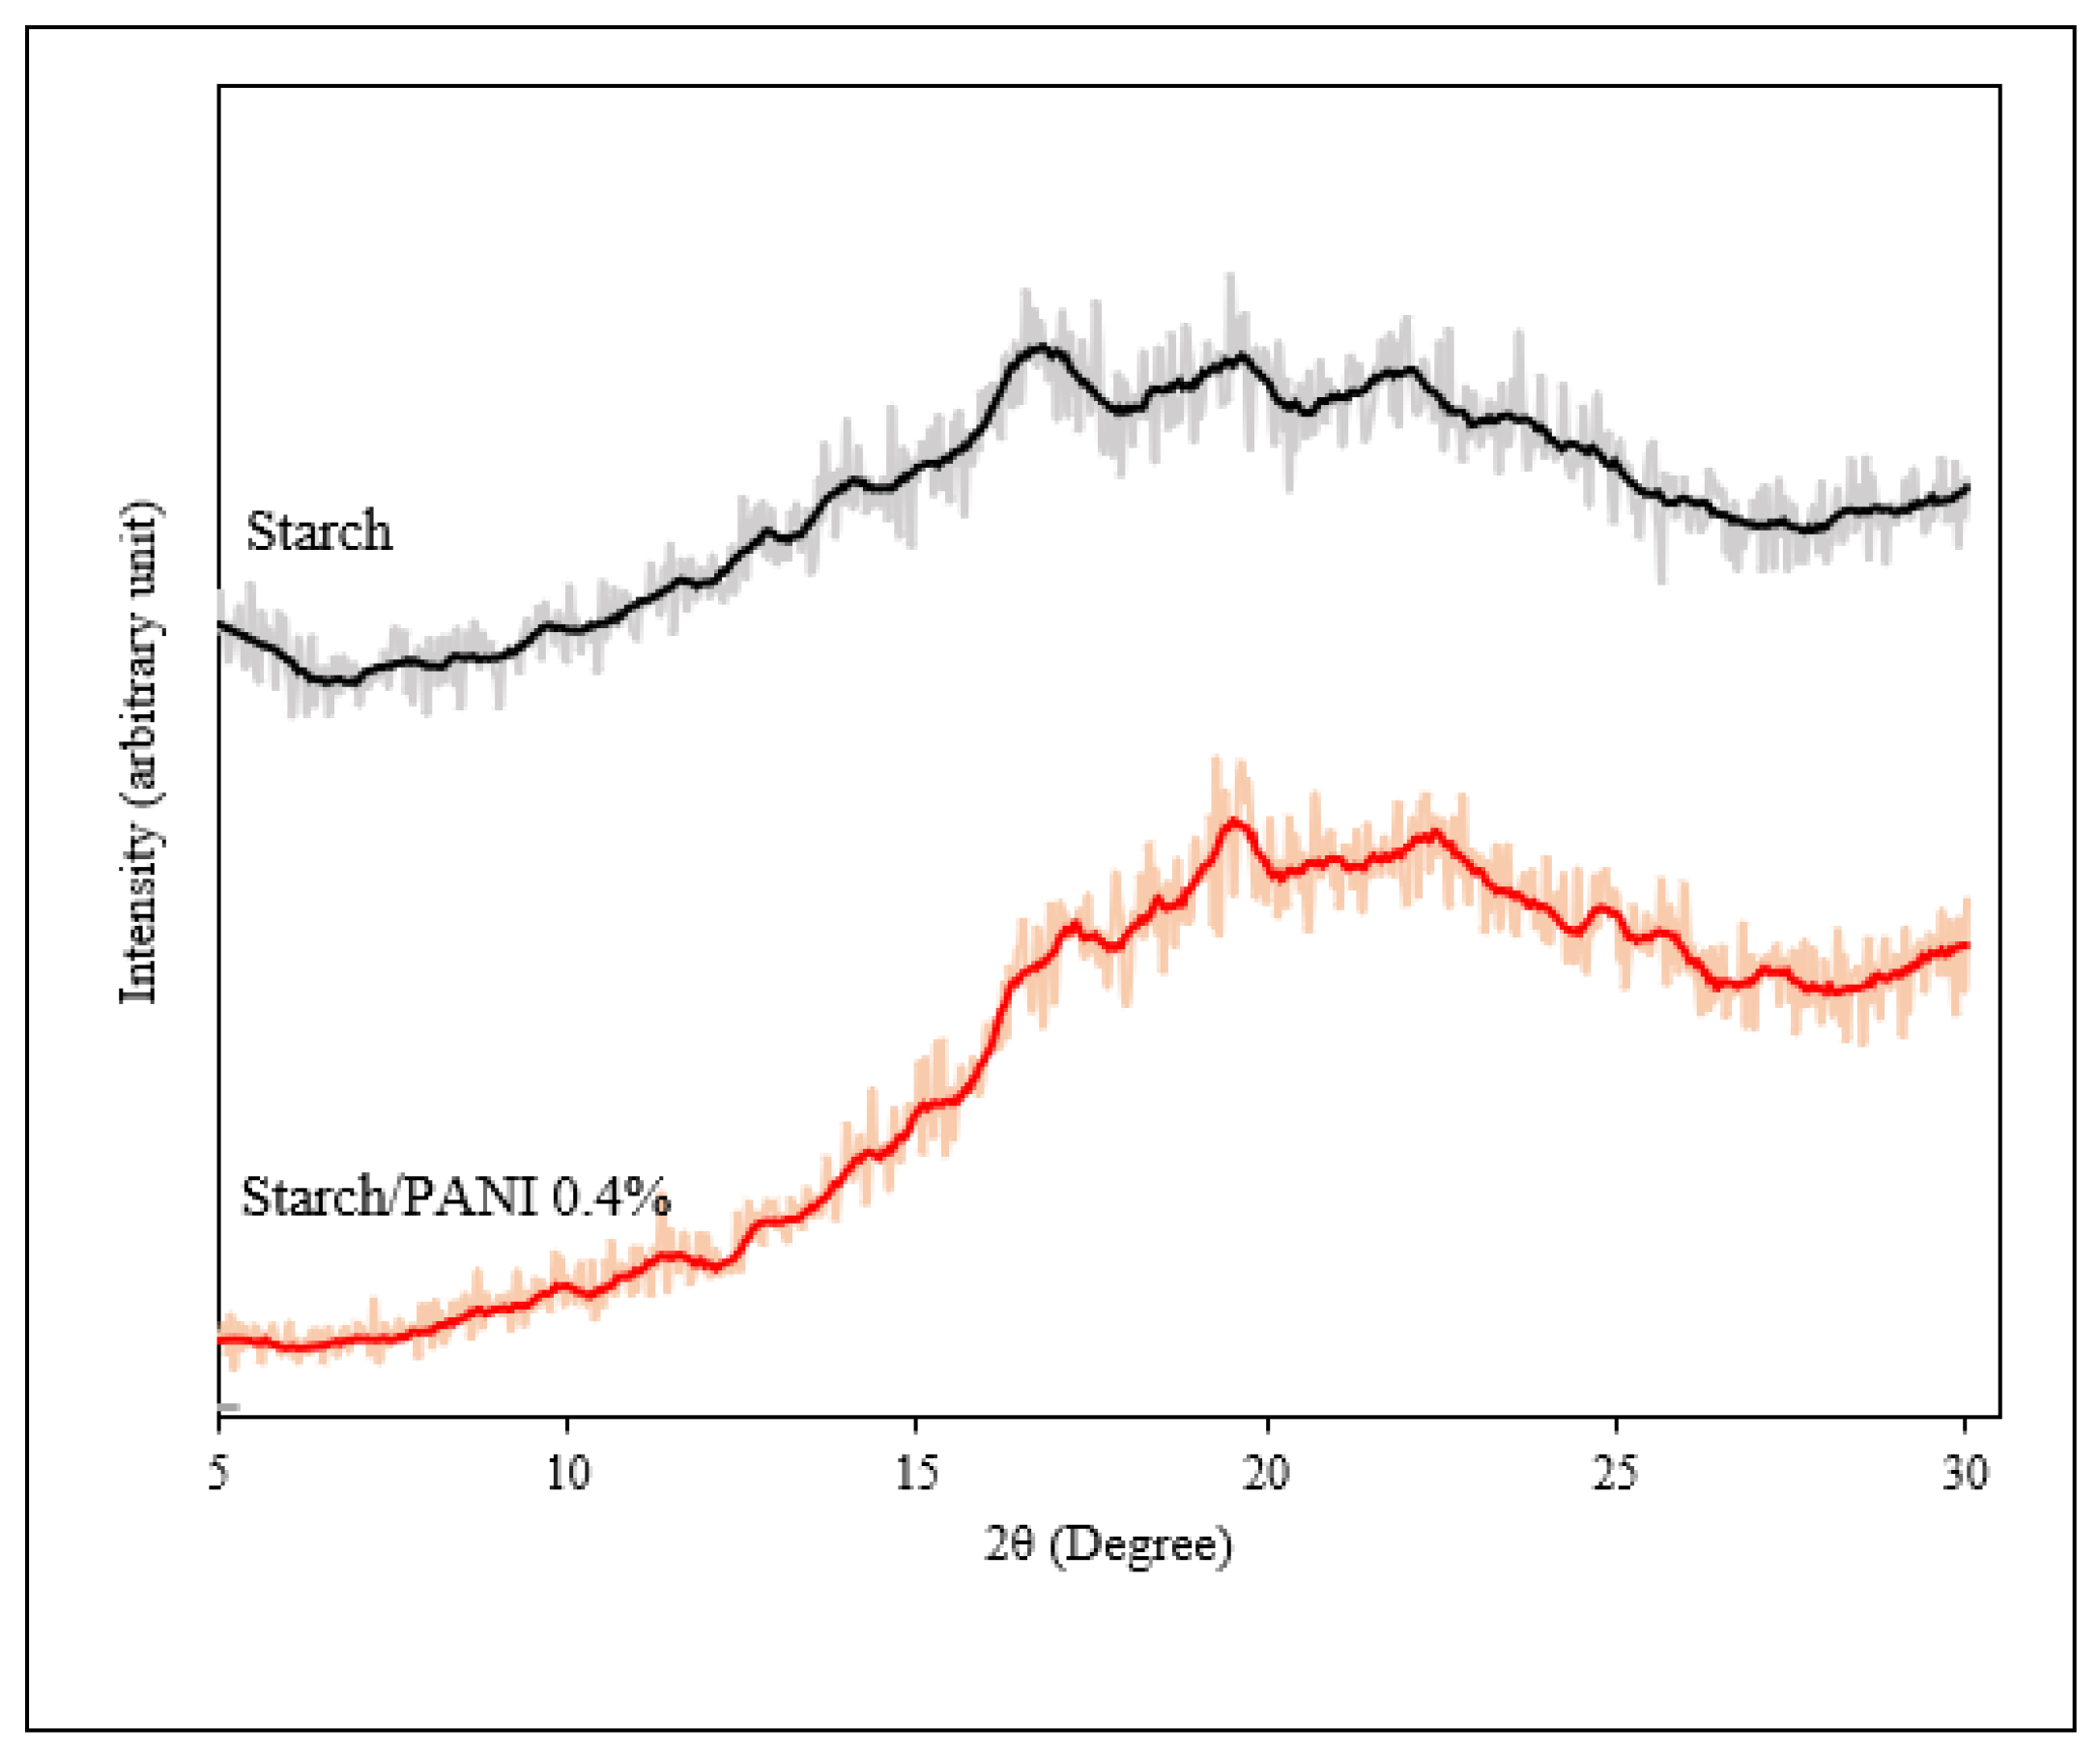
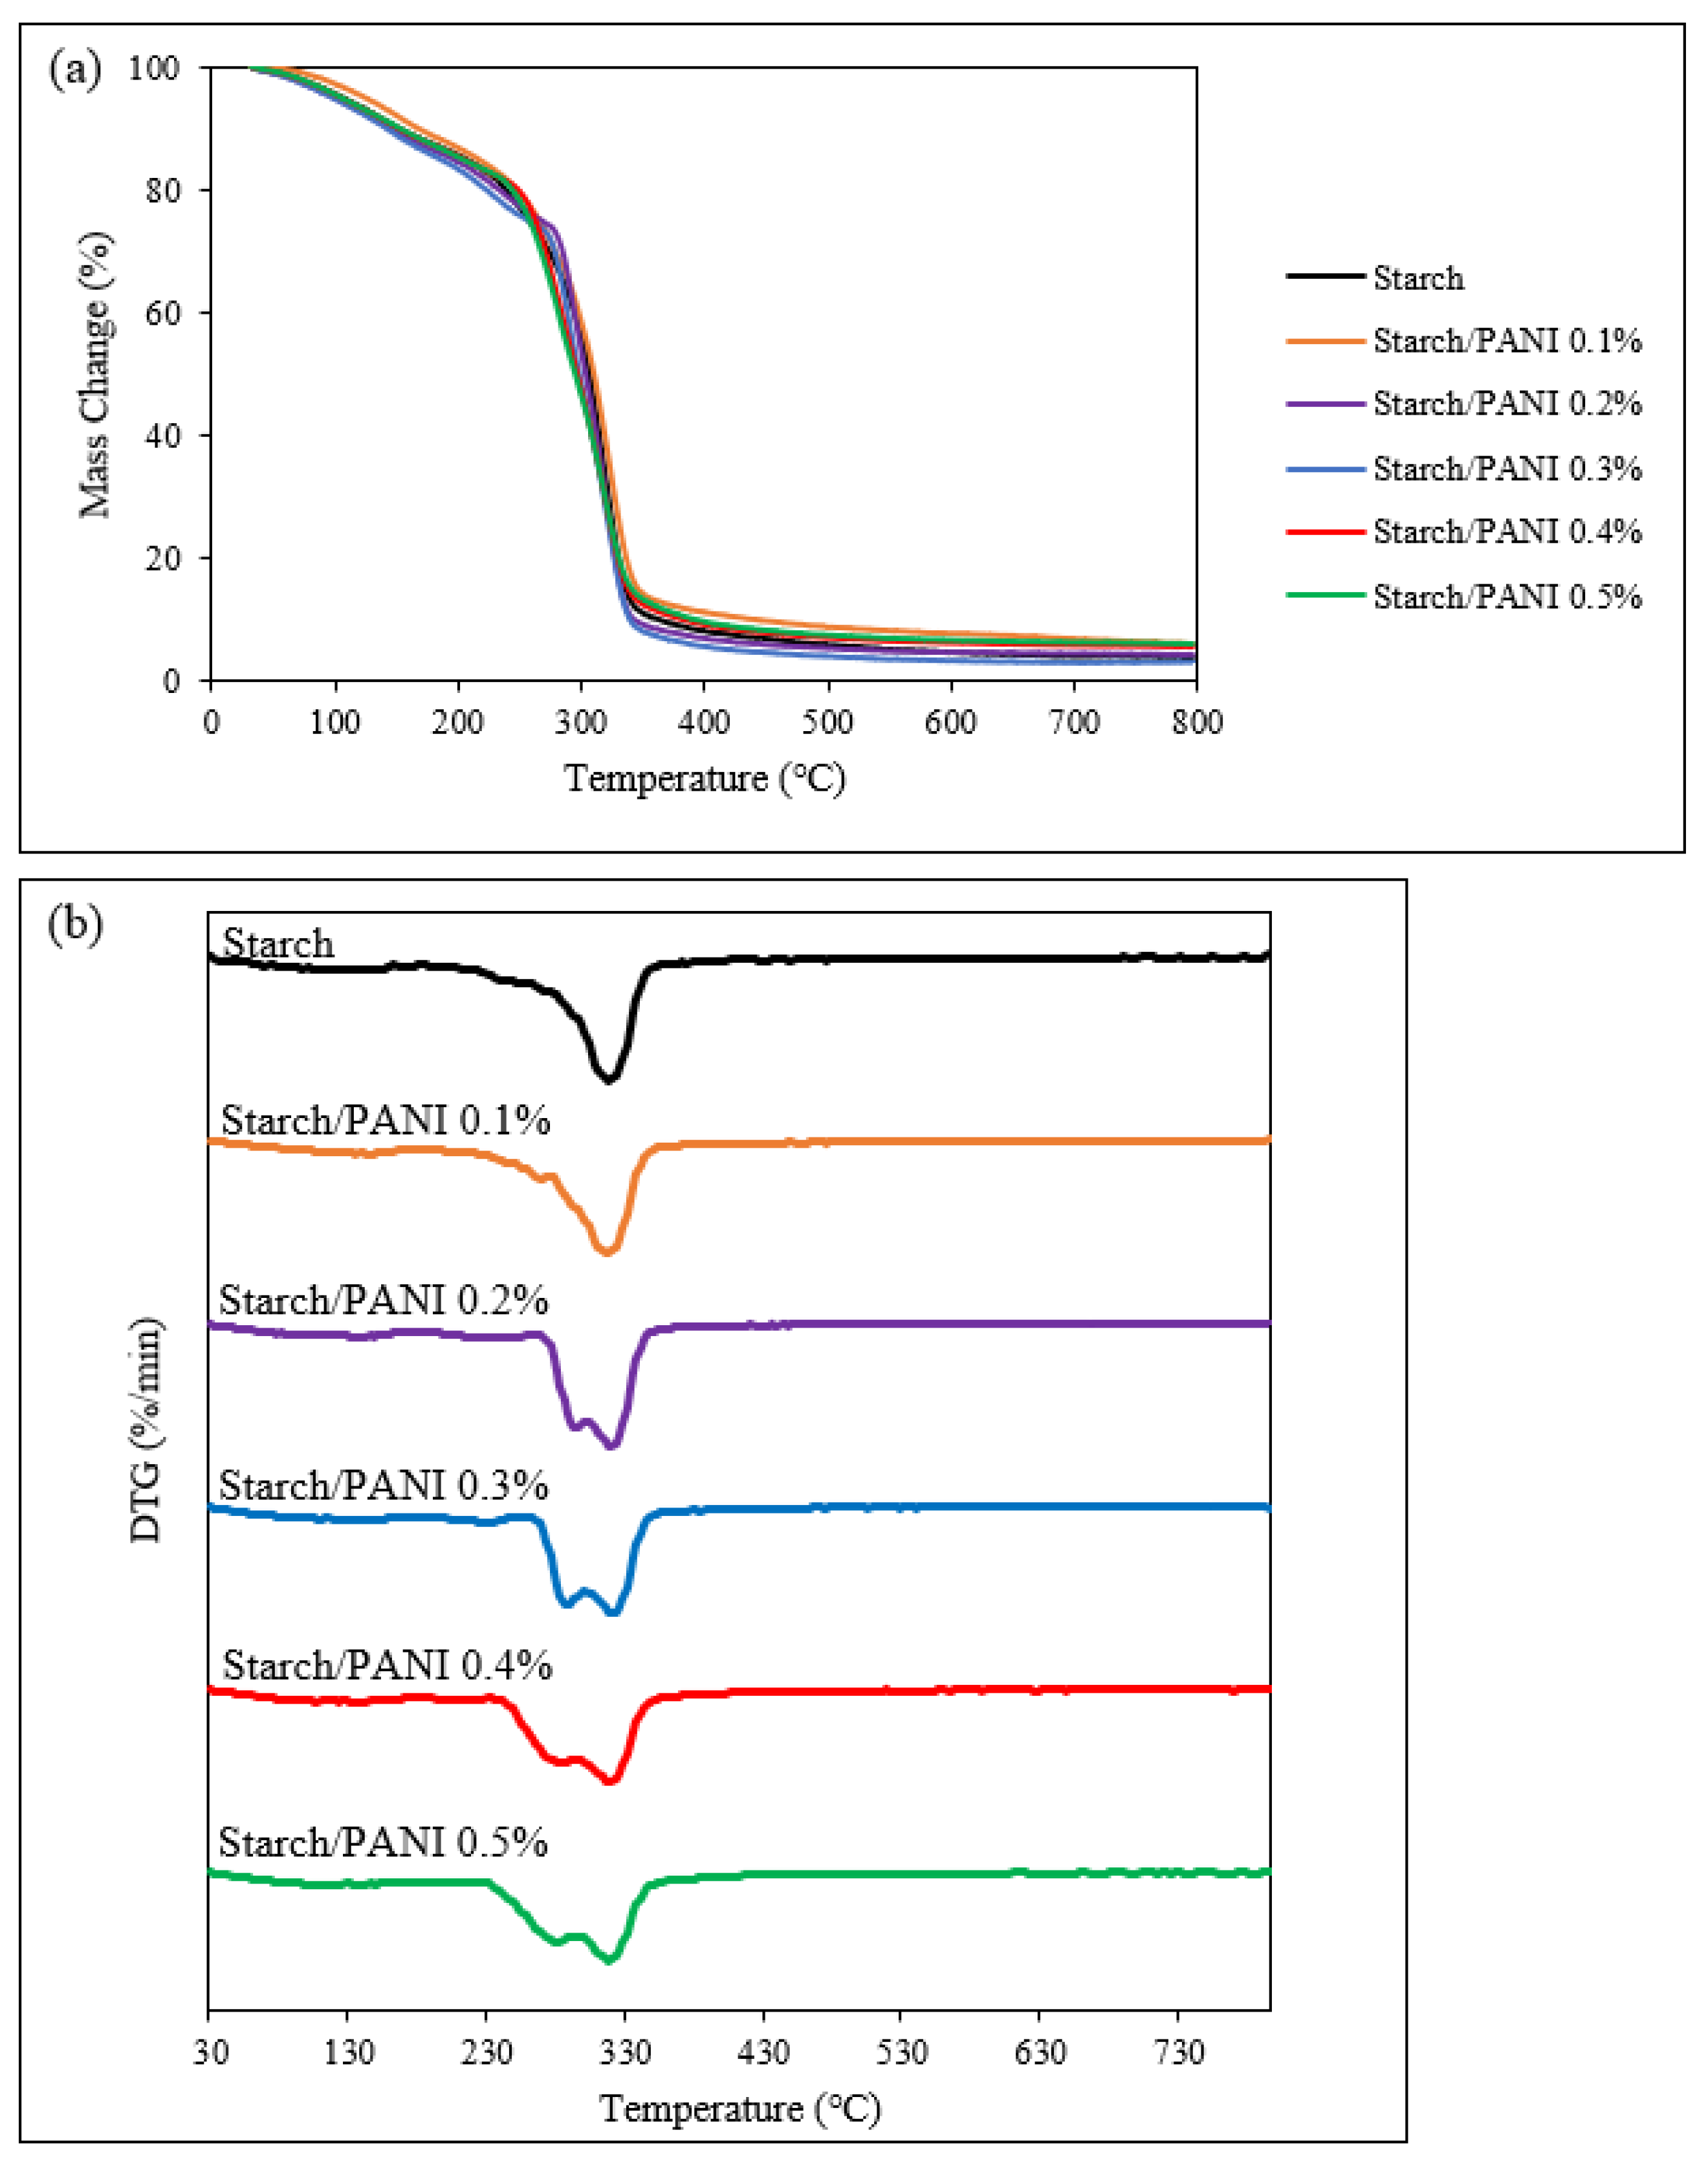
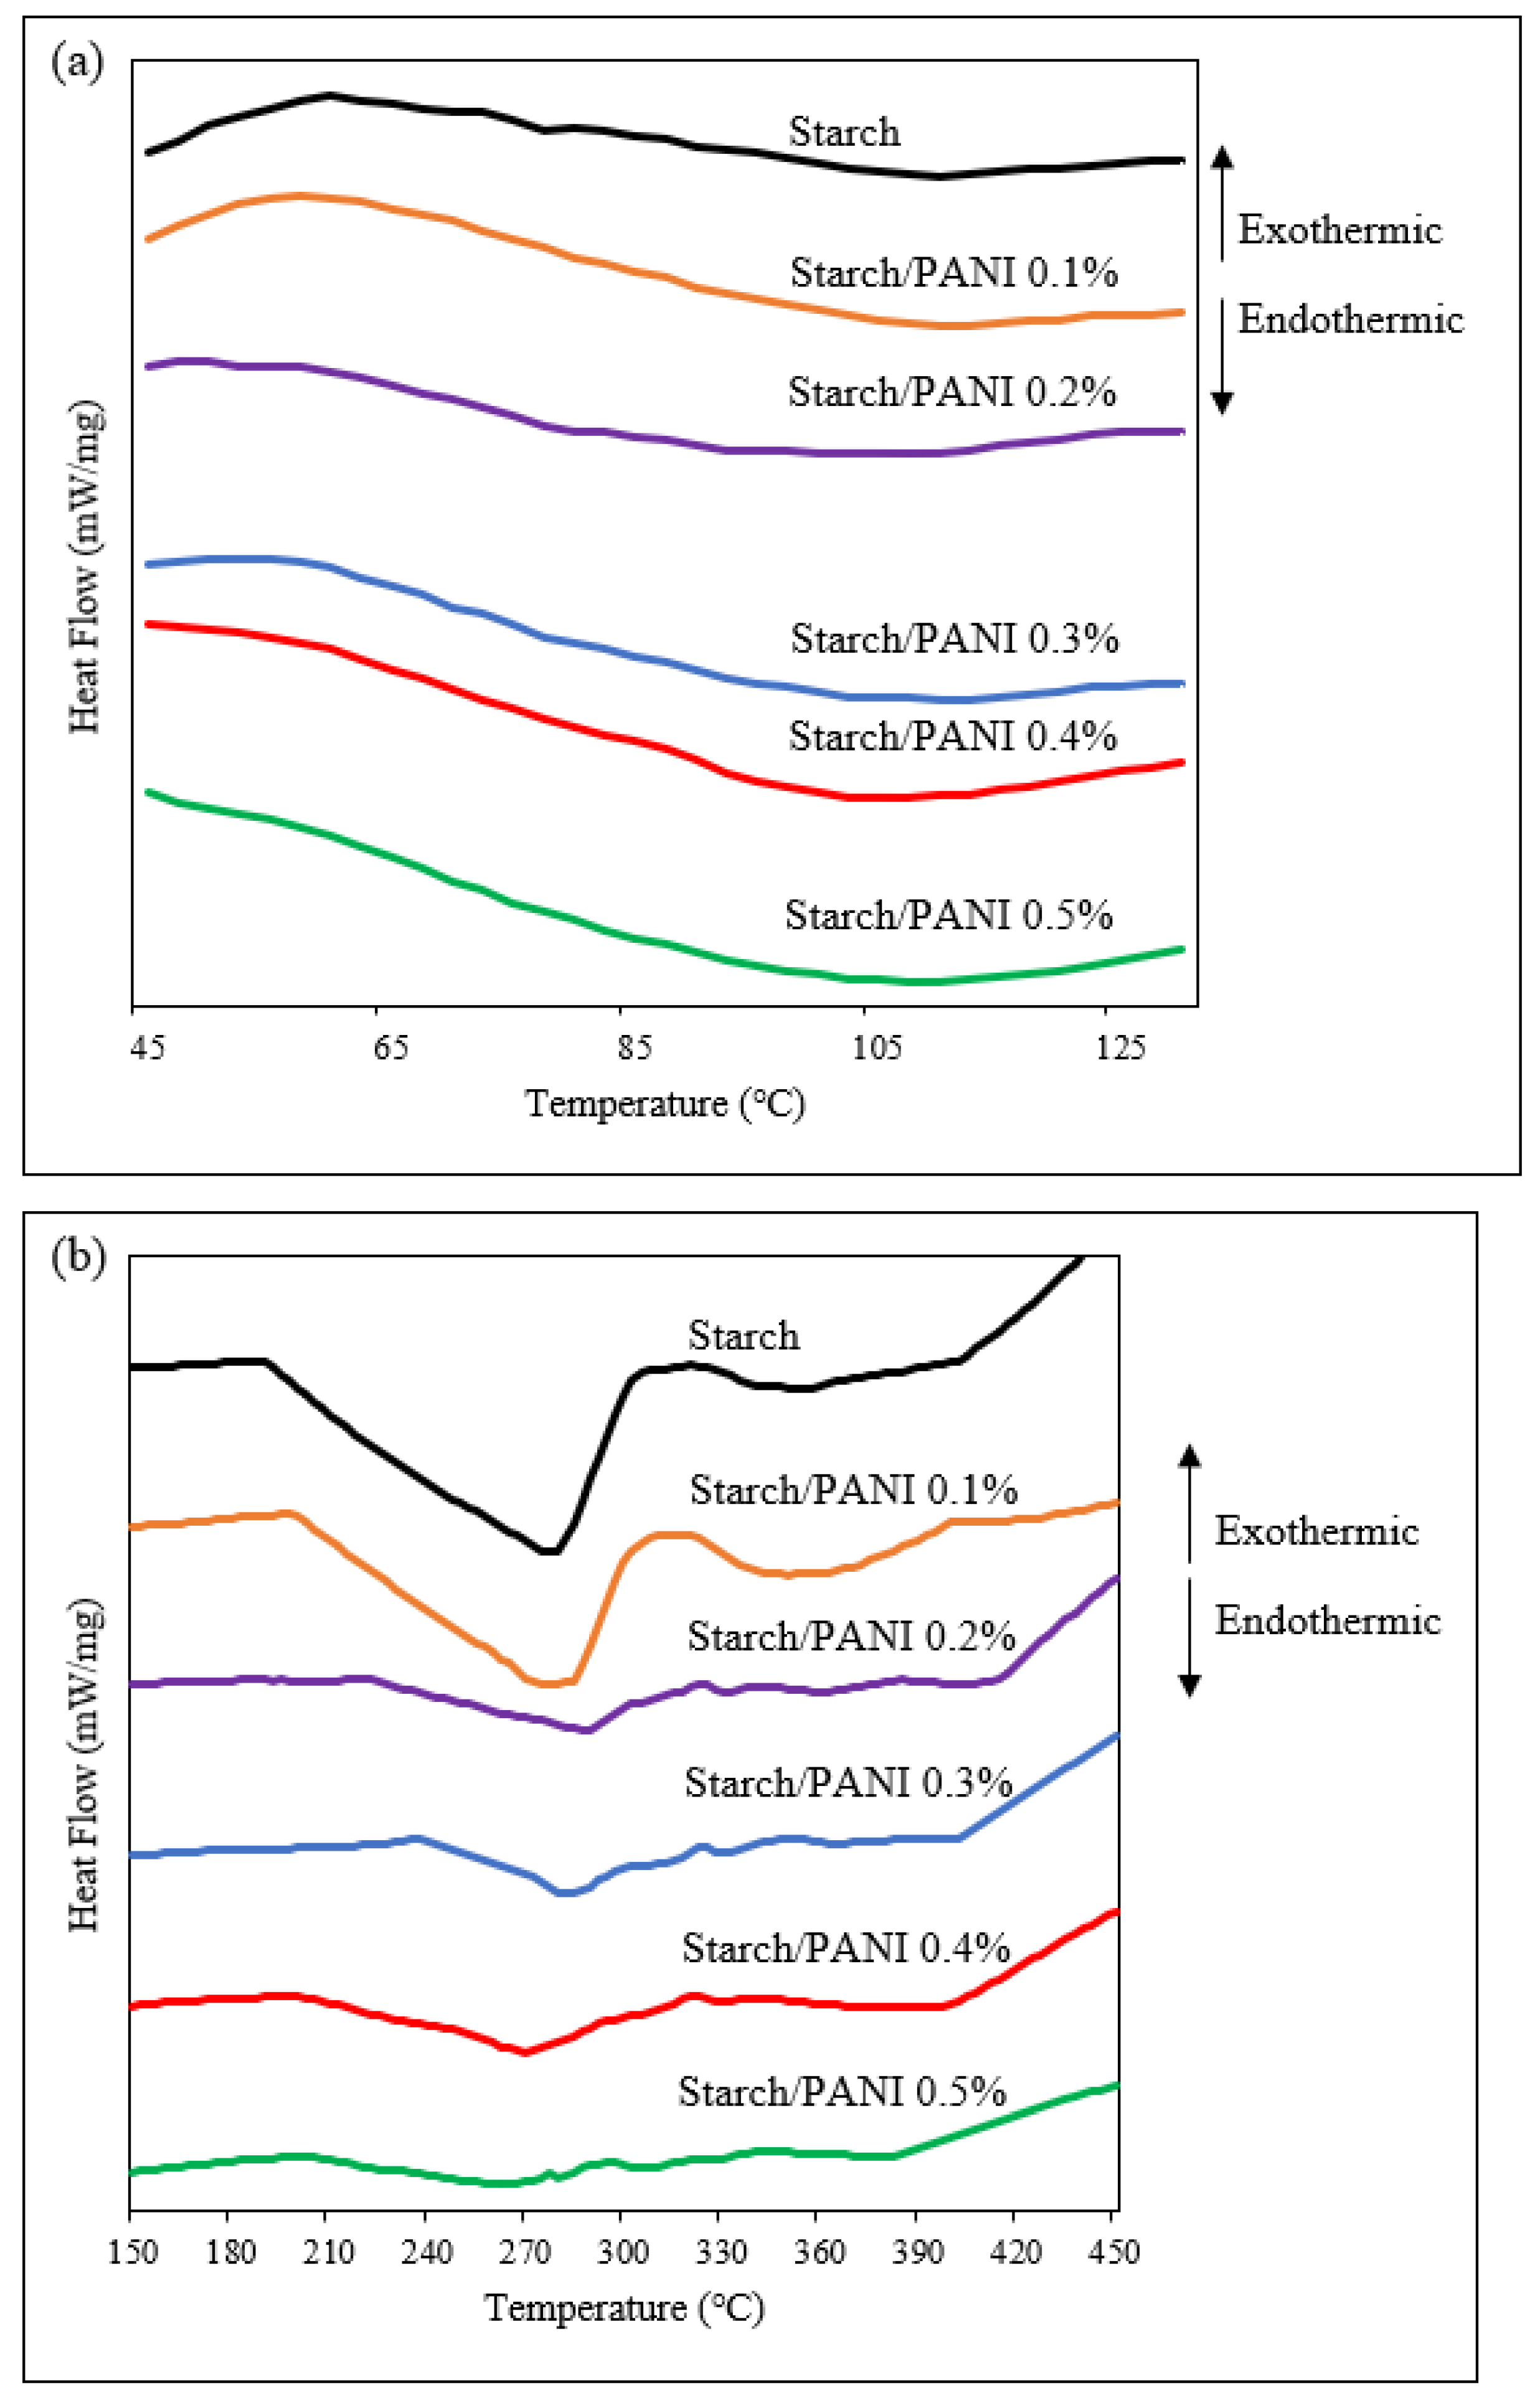
3.2. Characterisation of Starch and Starch/PANI Films
3.3. Sensor Performance of Starch/PANI Films
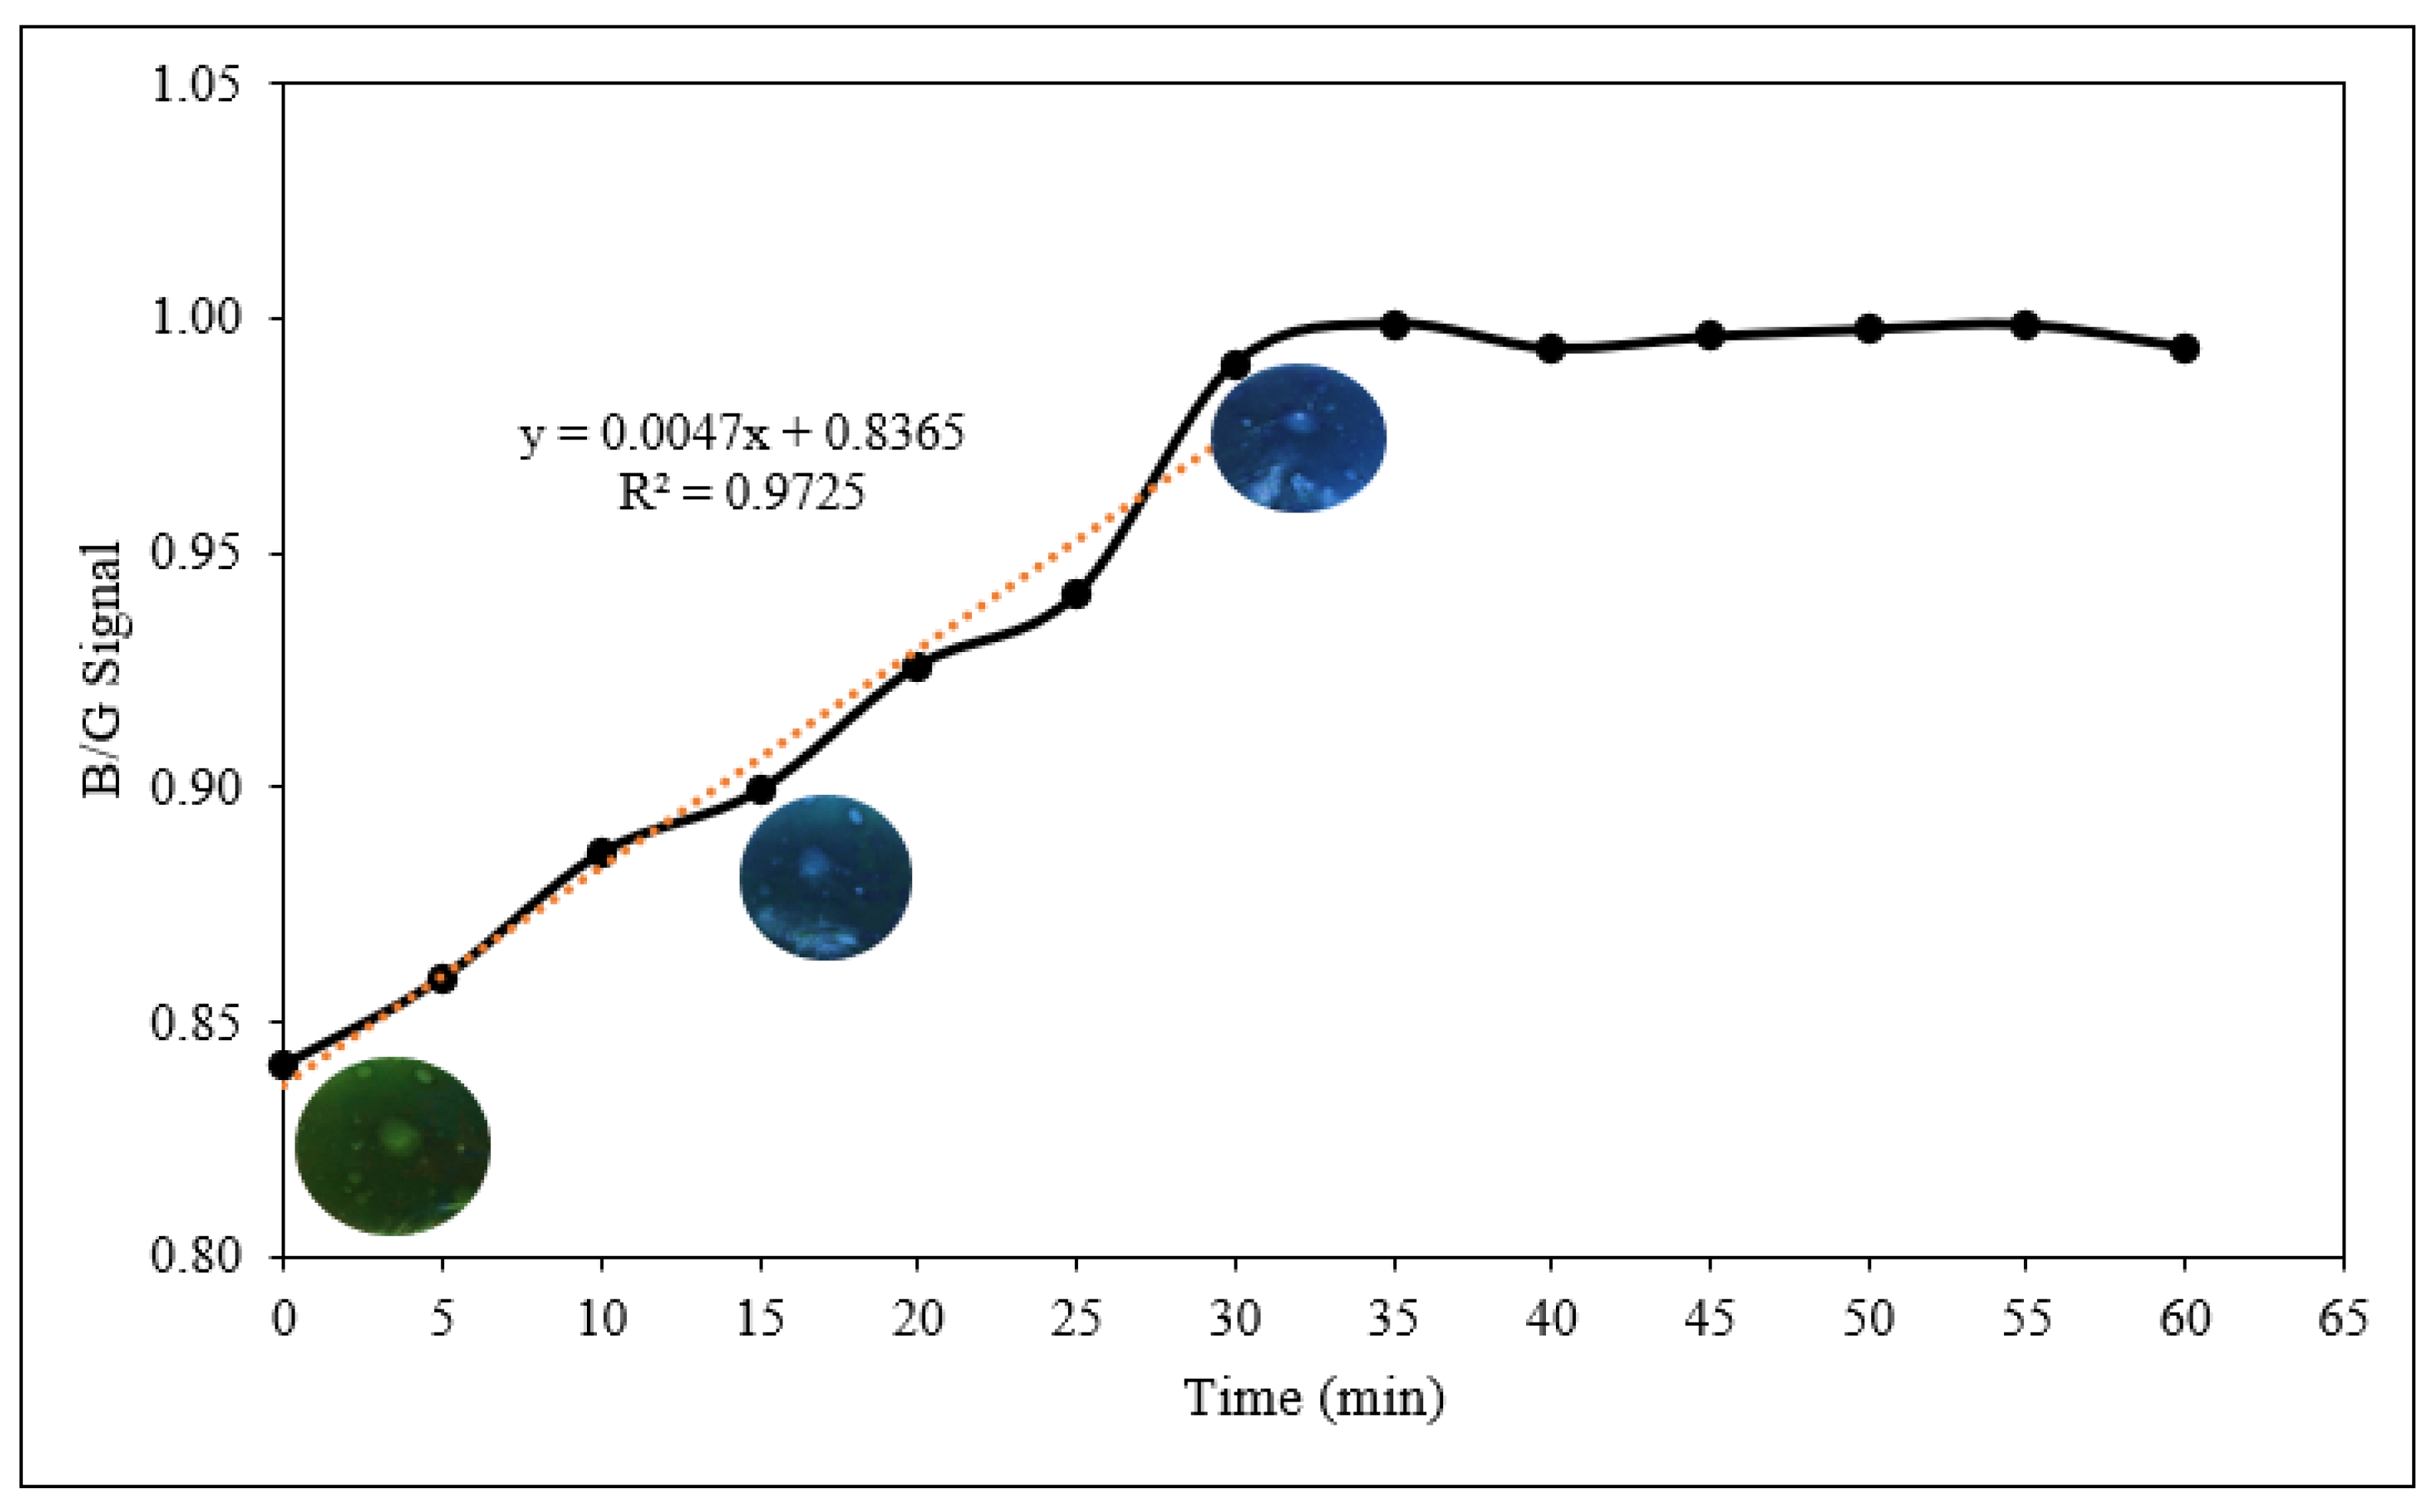
3.3.1. Response Time of Starch/PANI Films towards Volatile Ammonia
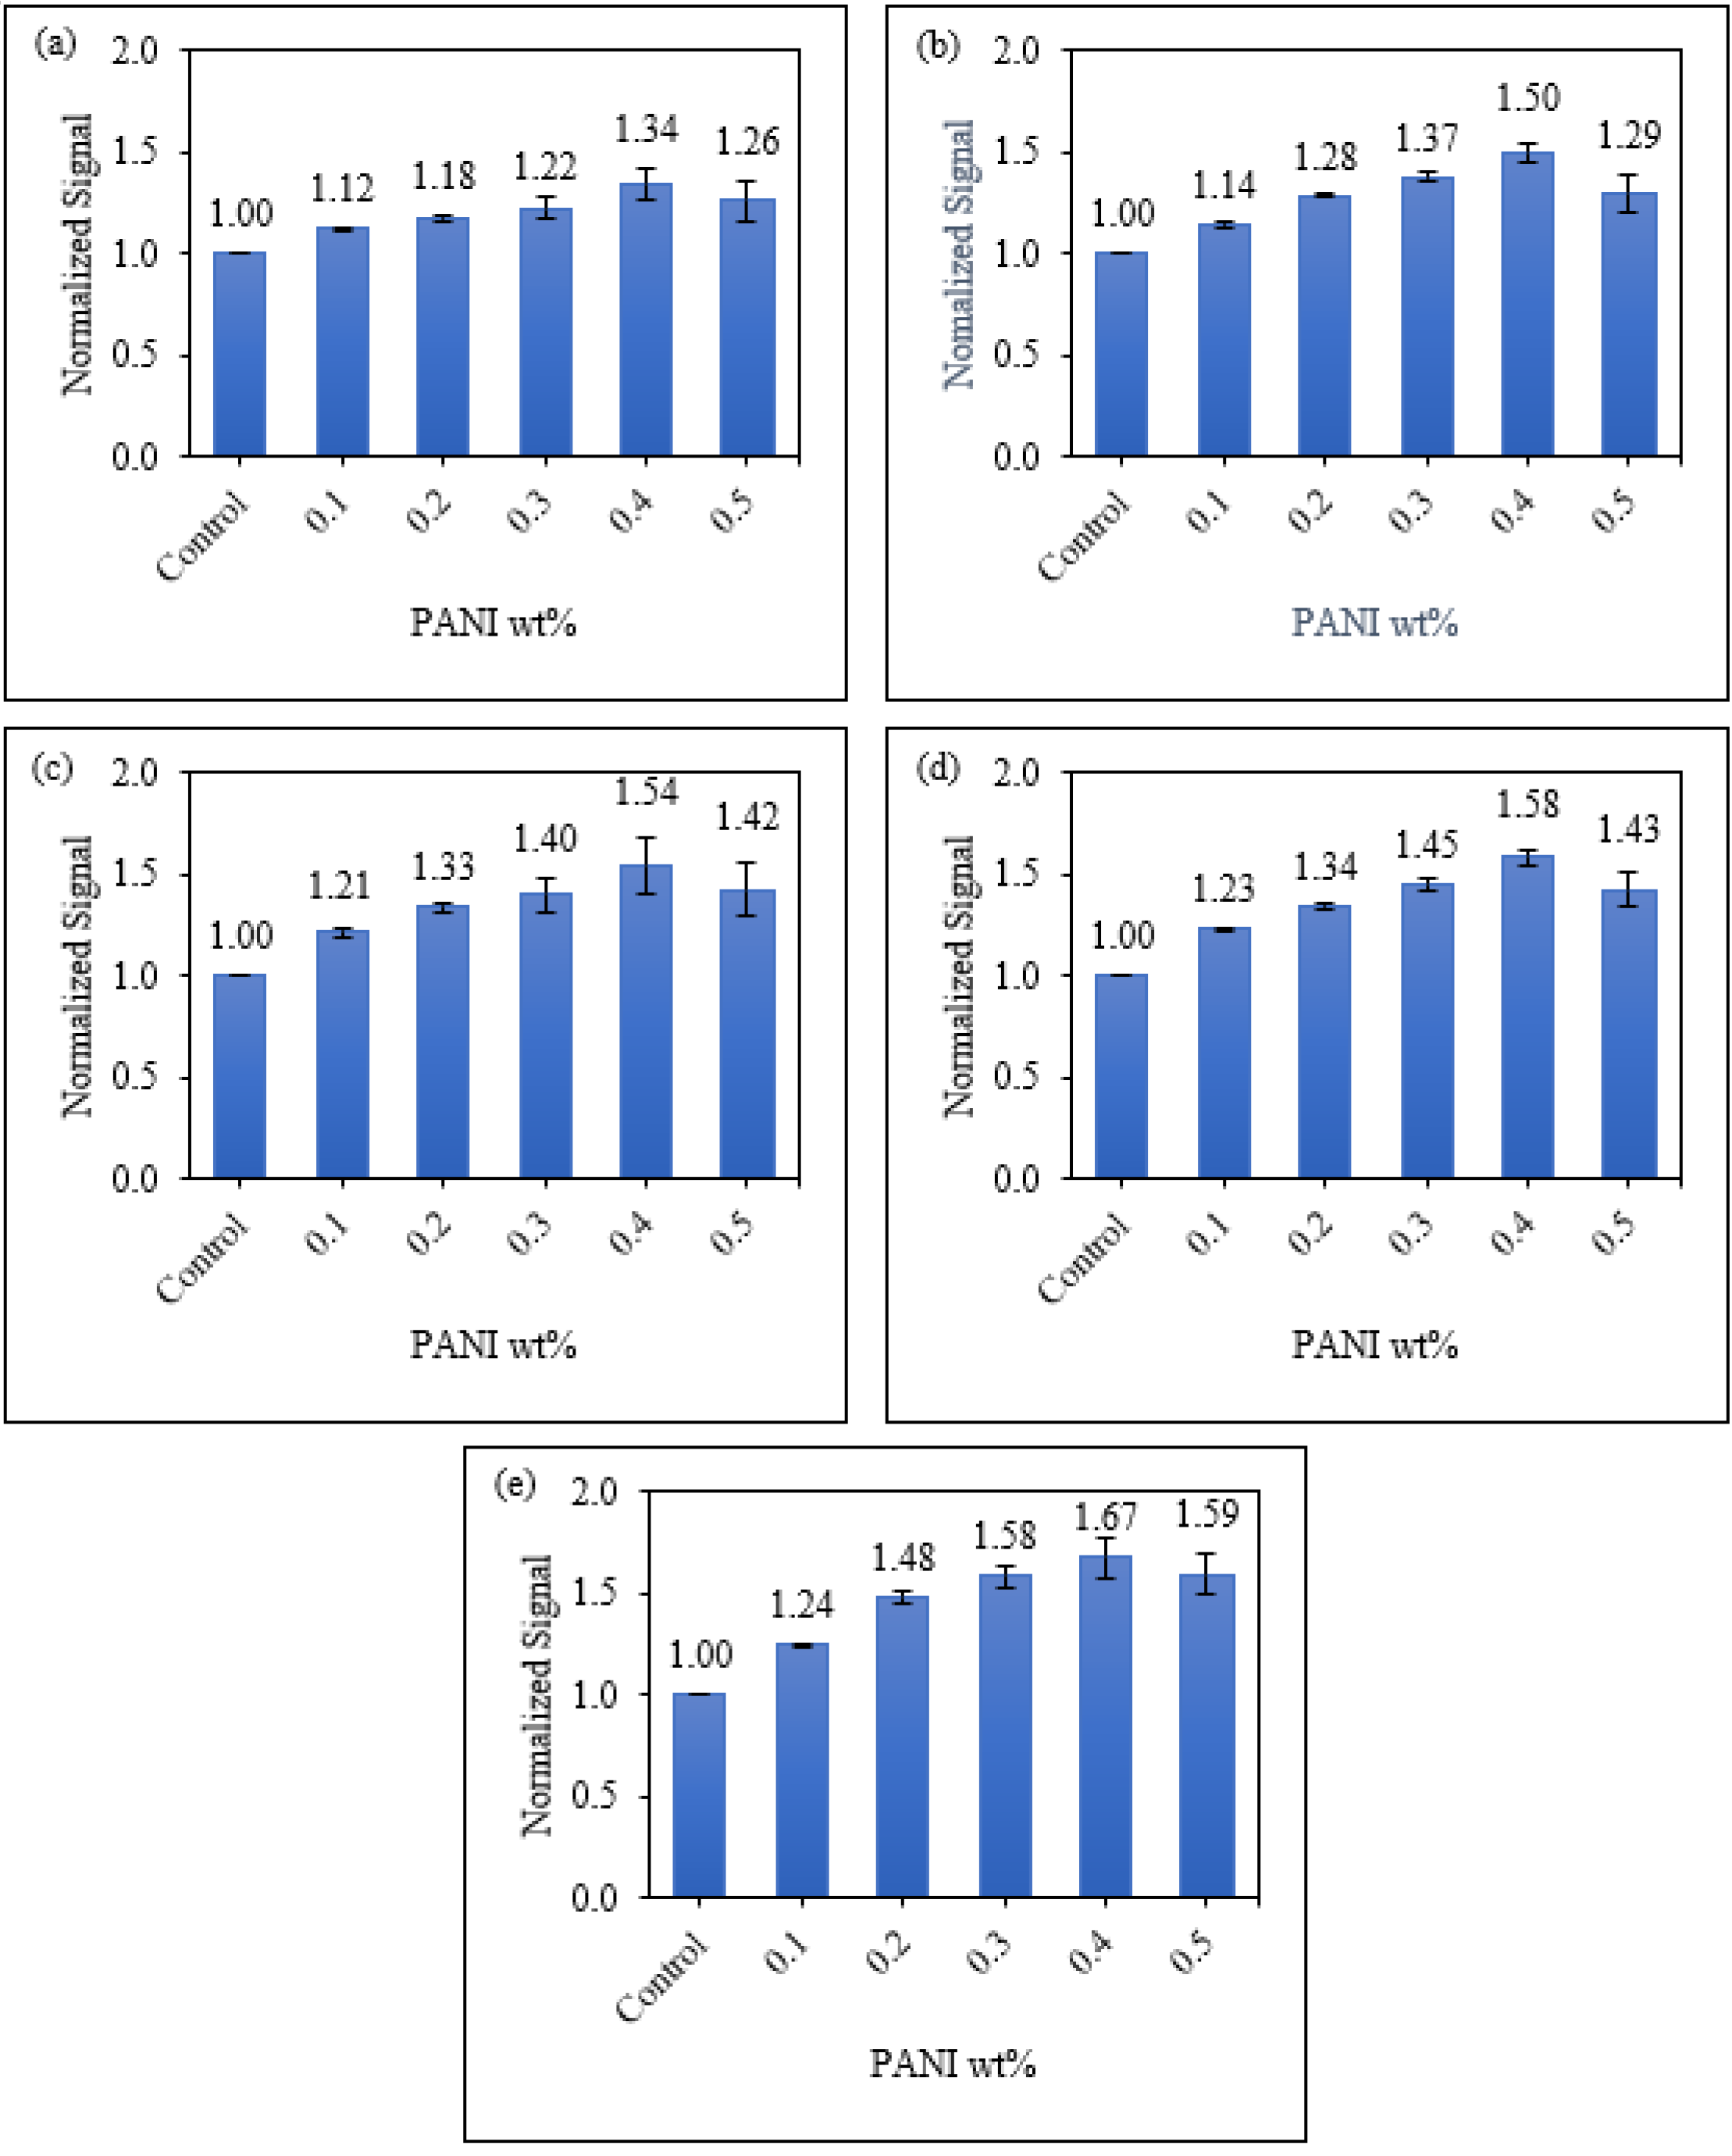
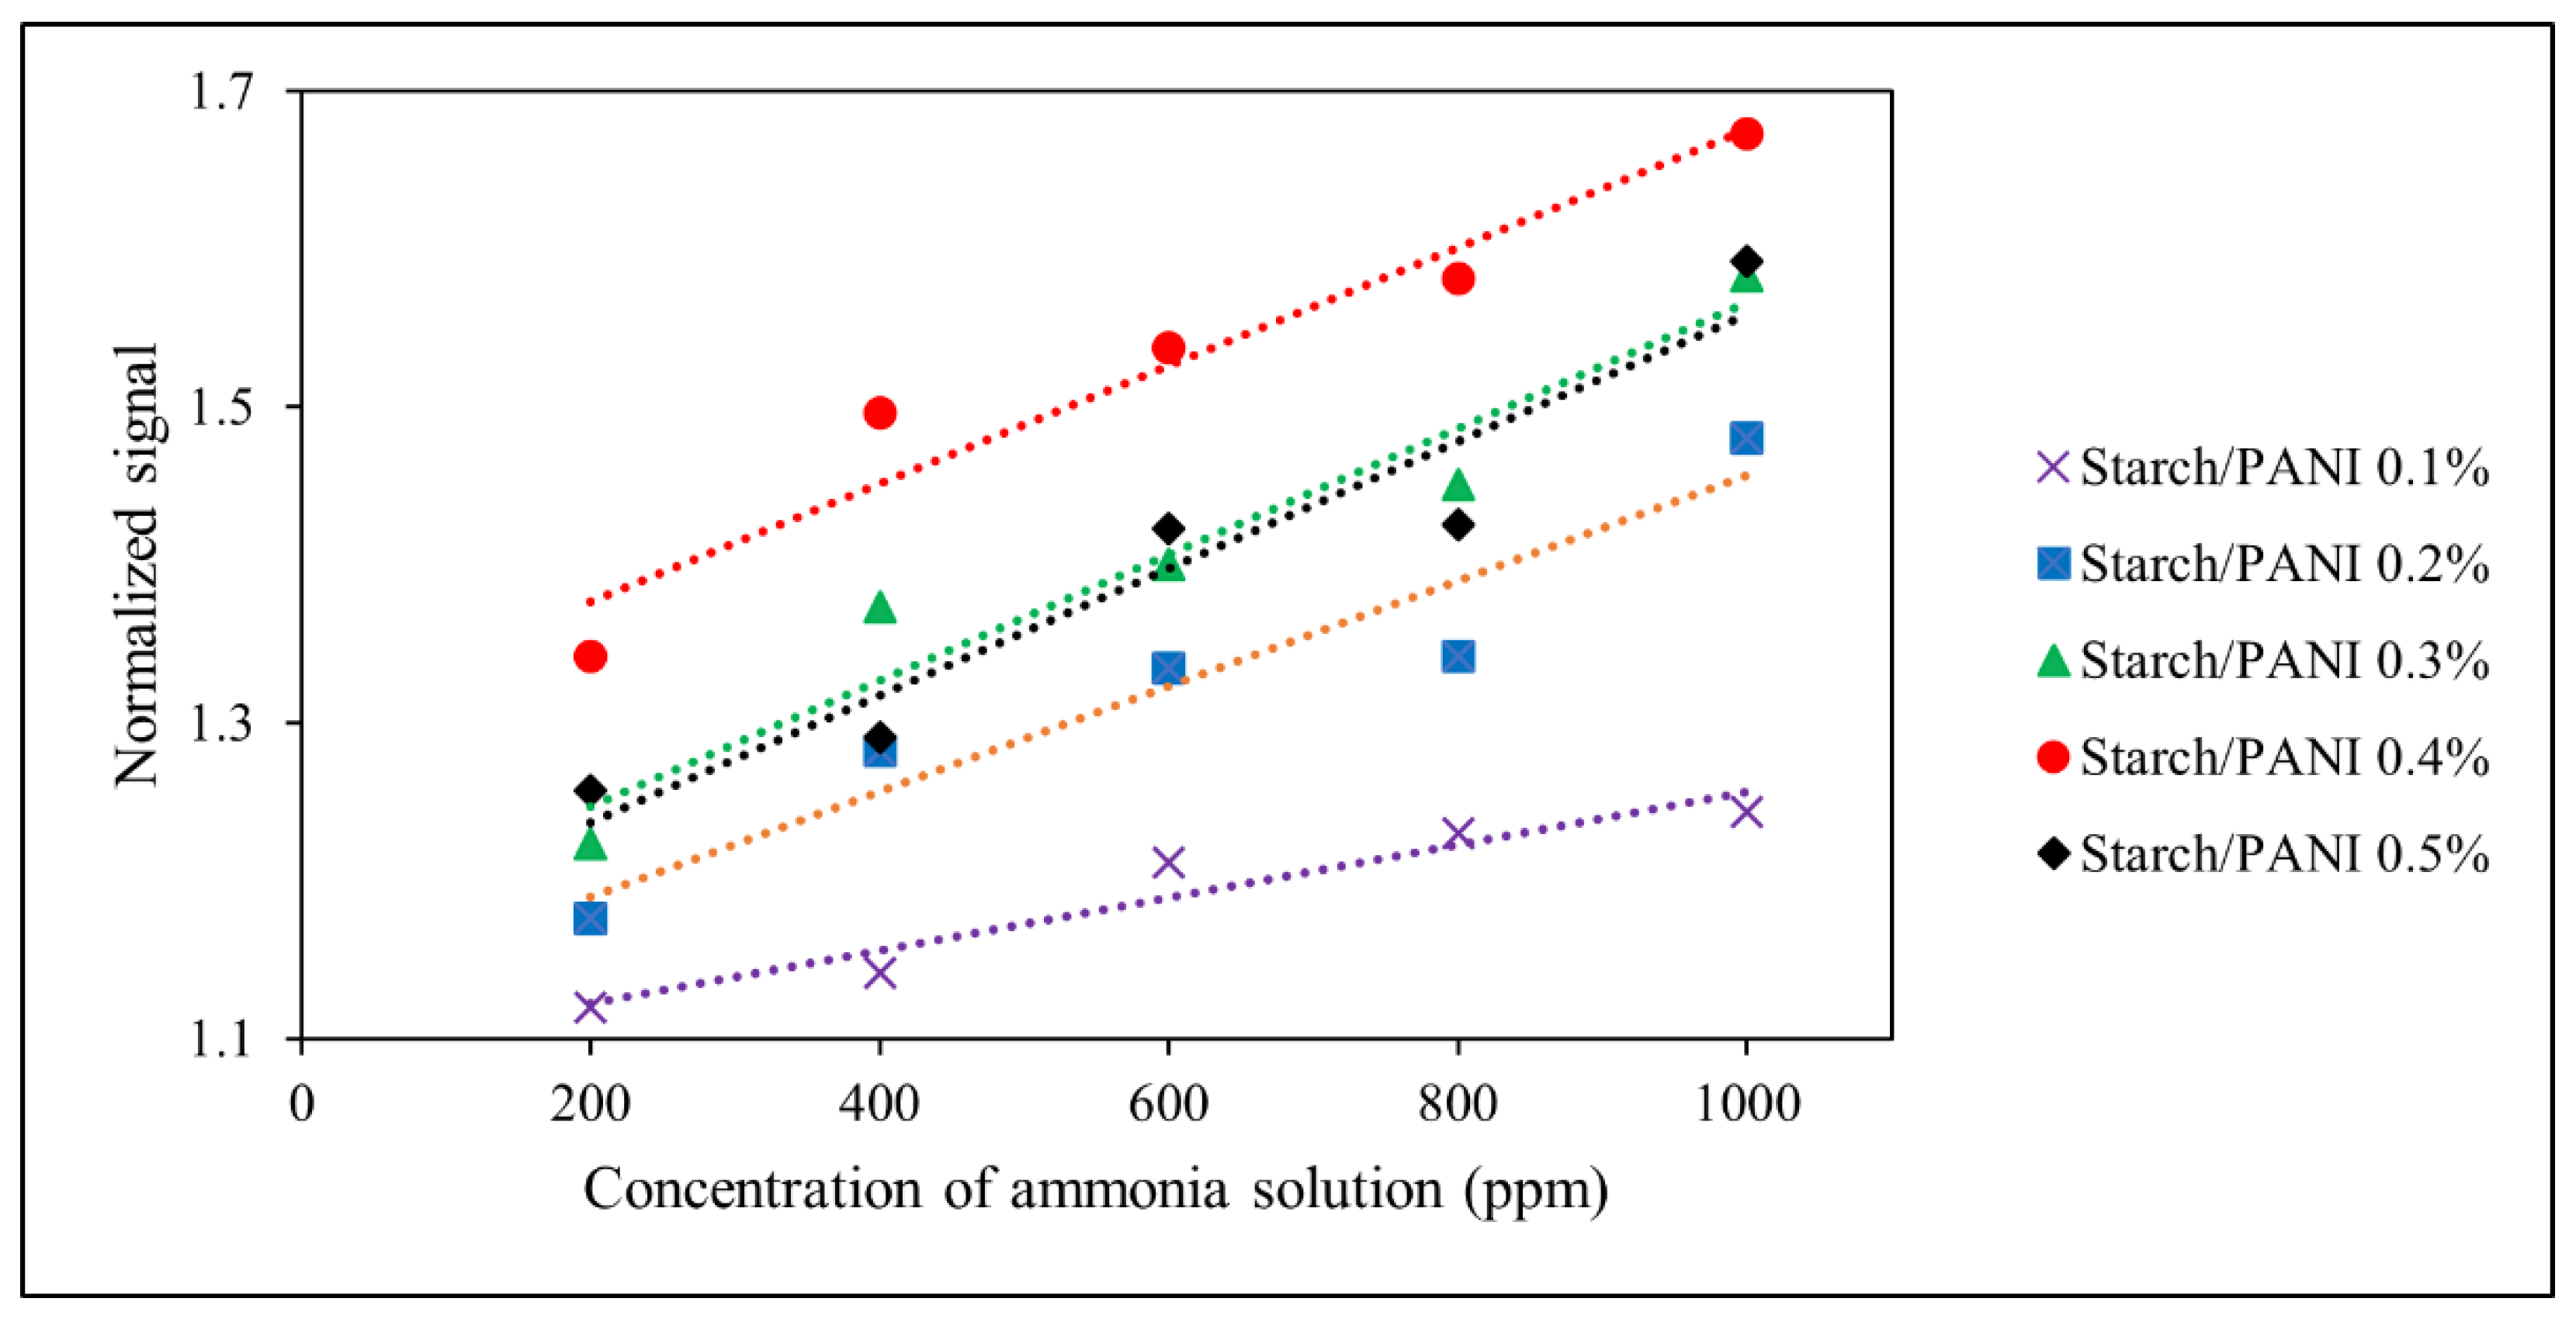
3.3.2. Sensitivity of Starch/PANI Films as an Ammonia-Vapour Sensor with Varying PANI wt.%
3.3.3. Sensitivity of Starch/PANI Film as an Ammonia-Vapour Sensor at Various Temperatures
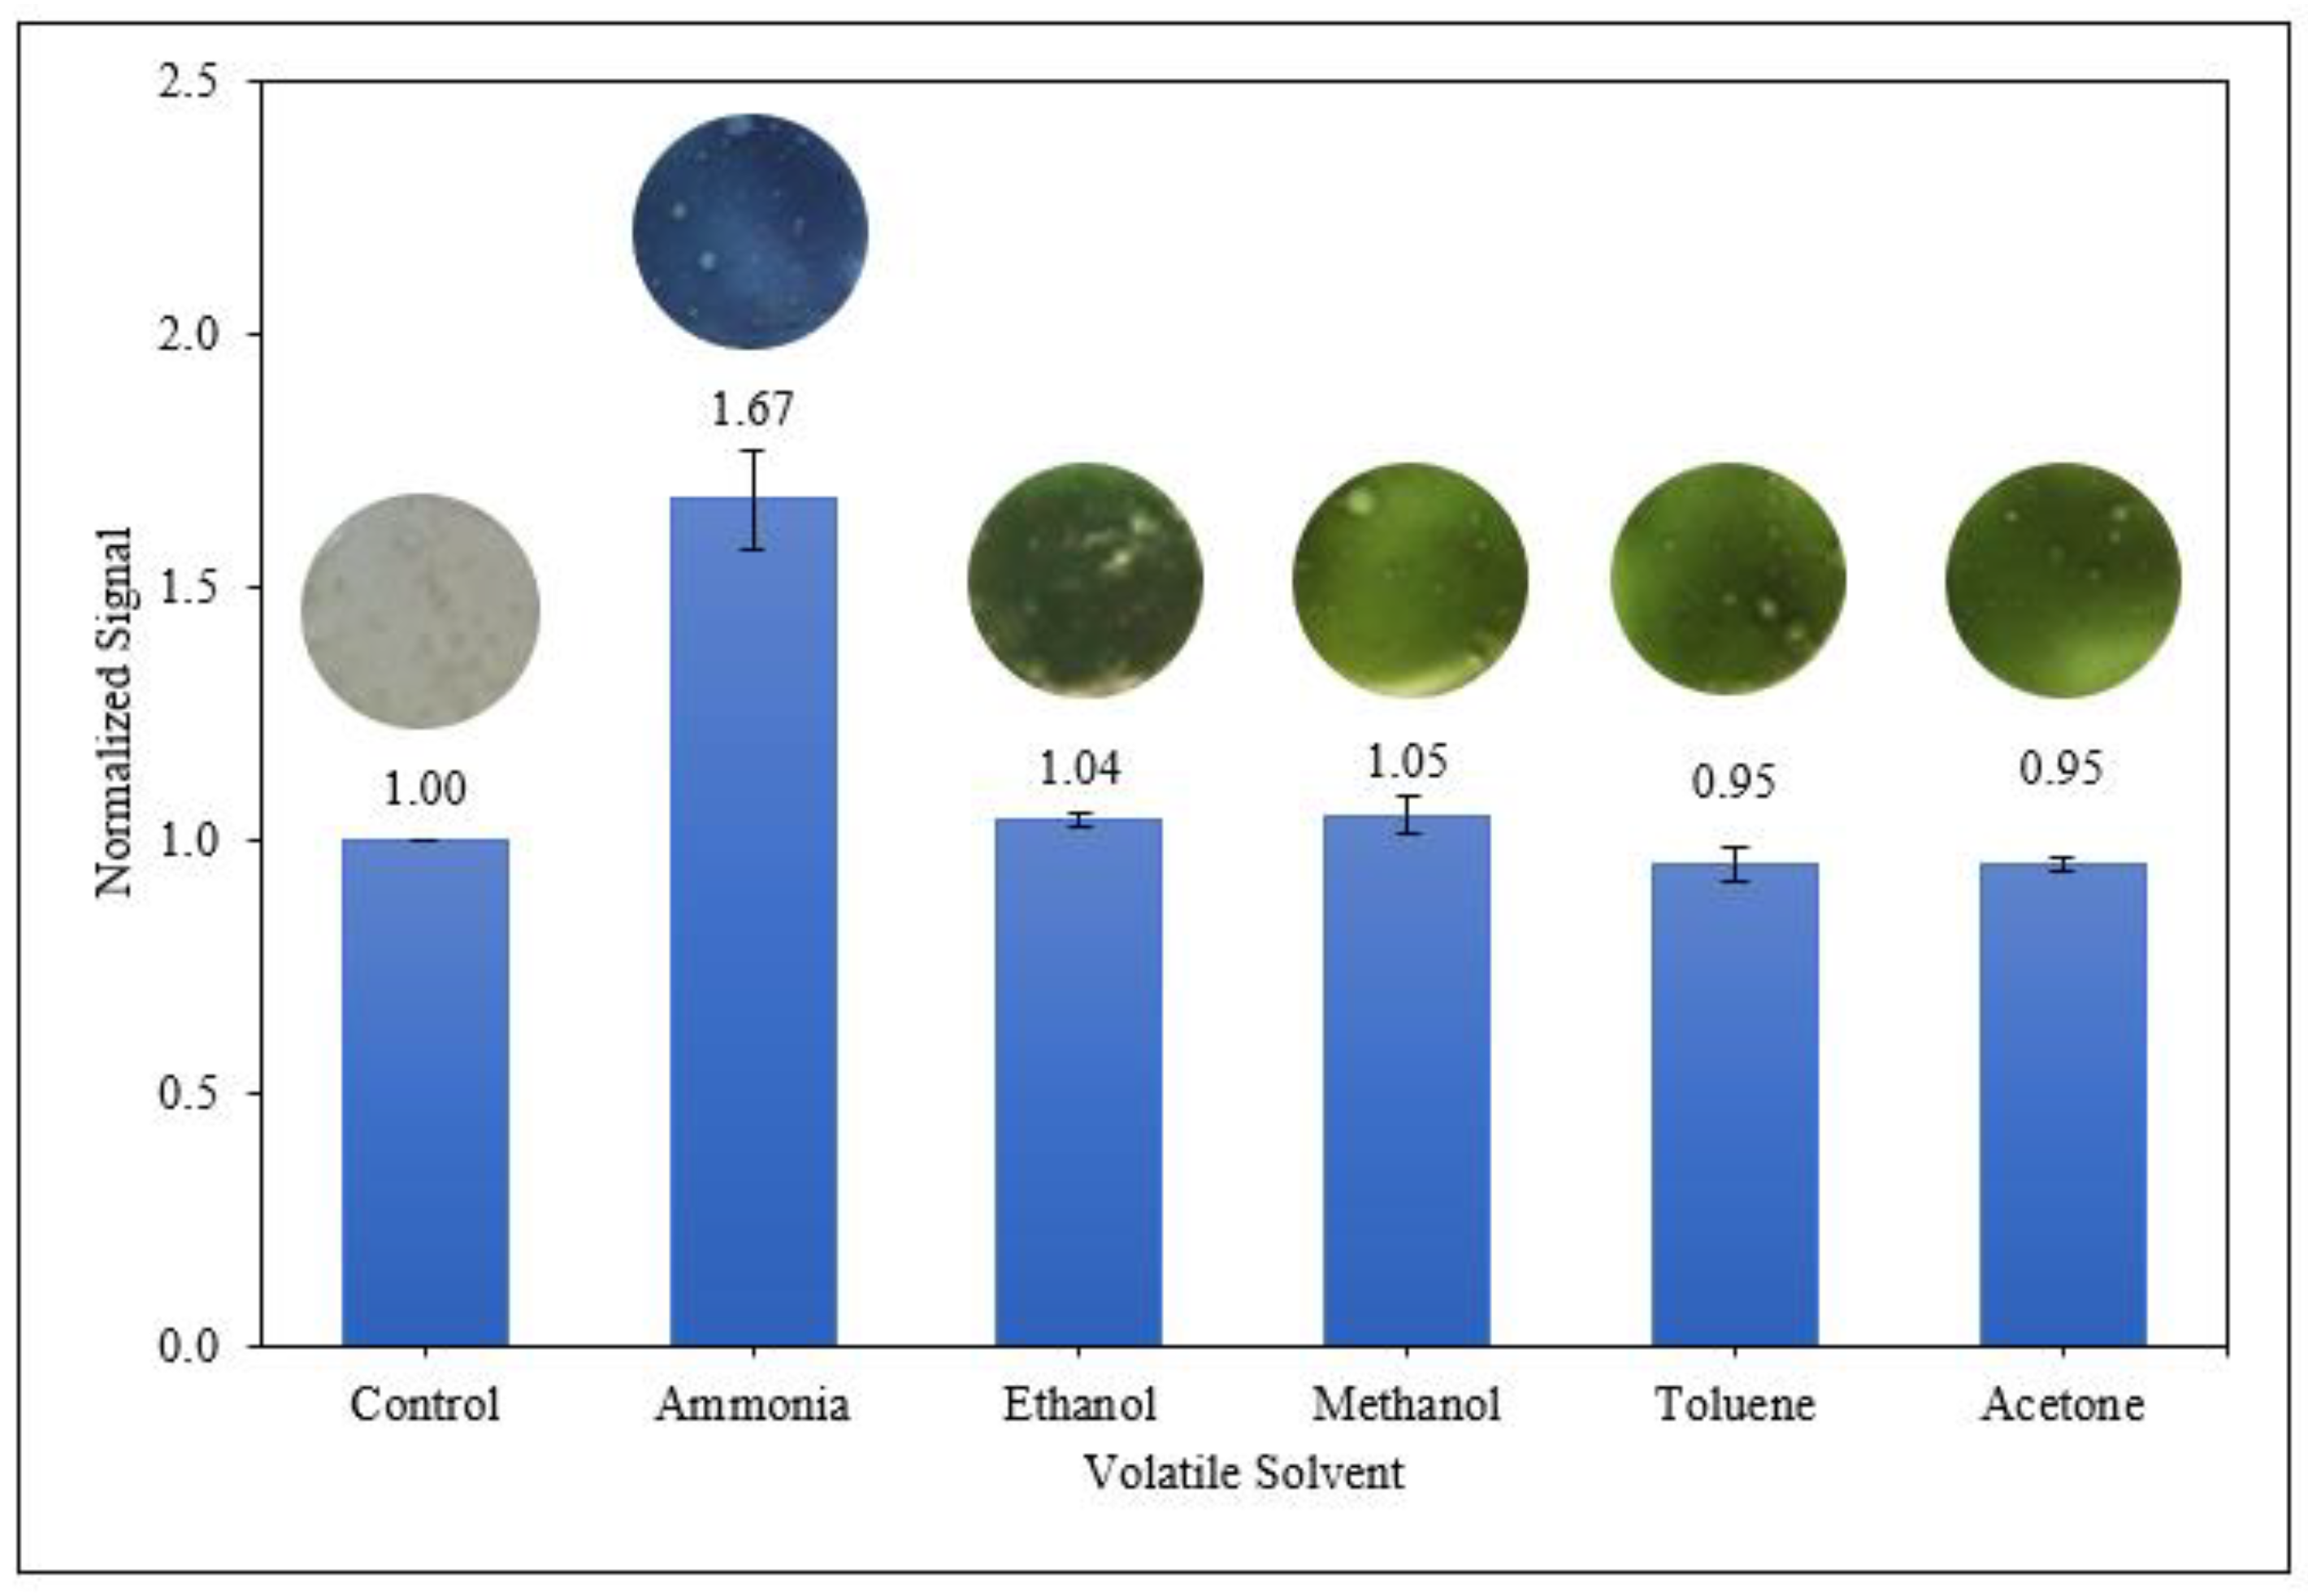
3.3.4. Selectivity of Starch/PANI Films as Ammonia-Vapour Sensor
4. Conclusions
Author Contributions
Funding
Institutional Review Board Statement
Informed Consent Statement
Data Availability Statement
Acknowledgments
Conflicts of Interest
References
- Naser, A.Z.; Deiab, I.; Darras, B.M. Poly(Lactic Acid) (PLA) and Polyhydroxyalkanoates (PHAs), Green Alternatives to Petroleum-Based Plastics: A Review. RSC Adv. 2021, 11, 17151–17196. [Google Scholar] [CrossRef]
- Eriksen, M.; Lebreton, L.C.M.; Carson, H.S.; Thiel, M.; Moore, C.J.; Borerro, J.C.; Galgani, F.; Ryan, P.G.; Reisser, J. Plastic Pollution in the World’s Oceans: More than 5 Trillion Plastic Pieces Weighing over 250,000 Tons Afloat at Sea. PLoS ONE 2014, 9, e111913. [Google Scholar] [CrossRef] [PubMed] [Green Version]
- Arini, A.; Gigault, J.; Venel, Z.; Bertucci, A.; Baudrimont, M. The Underestimated Toxic Effects of Nanoplastics Coming from Marine Sources: A Demonstration on Oysters (Isognomon Alatus). Chemosphere 2022, 295, 133824. [Google Scholar] [CrossRef] [PubMed]
- Torres-Giner, S.; Figueroa-Lopez, K.J.; Melendez-Rodriguez, B.; Prieto, C.; Pardo-Figuerez, M.; Lagaron, J.M. Emerging Trends in Biopolymers for Food Packaging. In Sustainable Food Packaging Technology; Athanassiou, A., Ed.; John Wiley & Sons: Hoboken, NJ, USA, 2021; pp. 1–33. [Google Scholar]
- Zhong, Y.; Godwin, P.; Jin, Y.; Xiao, H. Biodegradable Polymers and Green-Based Antimicrobial Packaging Materials: A Mini-Review. Adv. Ind. Eng. Polym. Res. 2020, 3, 27–35. [Google Scholar] [CrossRef]
- Wang, Y.; Huang, Y.; Bai, H.; Wang, G.; Hu, X.; Kumar, S.; Min, R. Biocompatible and Biodegradable Polymer Optical Fiber for Biomedical Application: A Review. Biosensors 2021, 11, 472. [Google Scholar] [CrossRef]
- Zhao, D.; Zhu, Y.; Cheng, W.; Chen, W.; Wu, Y.; Yu, H. Cellulose-Based Flexible Functional Materials for Emerging Intelligent Electronics. Adv. Mater. 2021, 33, 2000619. [Google Scholar] [CrossRef]
- Zhai, X.; Li, Z.; Shi, J.; Huang, X.; Sun, Z.; Zhang, D.; Zou, X.; Sun, Y.; Zhang, J.; Holmes, M.; et al. A Colorimetric Hydrogen Sul Fi de Sensor Based on Gellan Gum-Silver Nanoparticles Bionanocomposite for Monitoring of Meat Spoilage in Intelligent Packaging. Food Chem. 2019, 290, 135–143. [Google Scholar] [CrossRef]
- Yildirim, H.; Capone, R.; Karanlik, A.; Bottalico, F.; Debs, P.; El Bilali, H. Food Wastage in Turkey: An Exploratory Survey on Household Food Waste. J. Food Nutr. Res. 2016, 4, 483–489. [Google Scholar] [CrossRef]
- Williams, H.; Lindström, A.; Trischler, J.; Wikström, F.; Rowe, Z. Avoiding Food Becoming Waste in Households—The Role of Packaging in Consumers’ Practices across Different Food Categories. J. Clean. Prod. 2020, 265, 121775. [Google Scholar] [CrossRef]
- Gustavsson, J.; Cederberg, C.; Sonesson, U. Global Food Losses and Food Waste; Food and Agriculture Organization of The United Nations: Rome, Italy, 2011. [Google Scholar] [CrossRef]
- Toma, L.; Costa Font, M.; Thompson, B. Impact of Consumers’ Understanding of Date Labelling on Food Waste Behaviour. Oper. Res. 2017, 20, 543–560. [Google Scholar] [CrossRef] [Green Version]
- Flórez, M.; Guerra-Rodríguez, E.; Cazón, P.; Vázquez, M. Chitosan for Food Packaging: Recent Advances in Active and Intelligent Films. Food Hydrocoll. 2022, 124, 107328. [Google Scholar] [CrossRef]
- Won, S.; Won, K. Self-Powered Flexible Oxygen Sensors for Intelligent Food Packaging. Food Packag. Shelf Life 2021, 29, 100713. [Google Scholar] [CrossRef]
- EFSA. Guidelines on Submission of a Dossier for Safety Evaluation by the EFSA of Active or Intelligent Substances Present in Active and Intelligent Materials and Articles Intended to Come into Contact with Food. EFSA J. 2009, 7, 1208. [Google Scholar] [CrossRef]
- Duan, M.; Yu, S.; Sun, J.; Jiang, H.; Zhao, J.; Tong, C.; Hu, Y.; Pang, J.; Wu, C. Development and Characterization of Electrospun Nanofibers Based on Pullulan/Chitin Nanofibers Containing Curcumin and Anthocyanins for Active-Intelligent Food Packaging. Int. J. Biol. Macromol. 2021, 187, 332–340. [Google Scholar] [CrossRef] [PubMed]
- Chen, H.Z.; Zhang, M.; Rao, Z. Development of Cellulose Nanofibrils Reinforced Polyvinyl Alcohol Films Incorporated with Alizarin for Intelligent Food Packaging. Int. J. Food Sci. Technol. 2021, 56, 4248–4257. [Google Scholar] [CrossRef]
- Salarbashi, D.; Tafaghodi, M.; Bazzaz, B.S.F.; Mohammad Aboutorabzade, S.; Fathi, M. PH-Sensitive Soluble Soybean Polysaccharide/SiO2 Incorporated with Curcumin for Intelligent Packaging Applications. Food Sci. Nutr. 2021, 9, 2169–2179. [Google Scholar] [CrossRef] [PubMed]
- Priyadarshi, R.; Ezati, P.; Rhim, J.-W. Recent Advances in Intelligent Food Packaging Applications Using Natural Food Colorants. ACS Food Sci. Technol. 2021, 1, 124–138. [Google Scholar] [CrossRef]
- Singh, S.; Gaikwad, K.K.; Lee, Y.S. Anthocyanin—A Natural Dye for Smart Food Packaging Systems. Korean J. Packag. Sci. Technol. 2018, 24, 167–180. [Google Scholar] [CrossRef]
- Kuswandi, B.; Restyana, A.; Abdullah, A.; Heng, L.Y.; Ahmad, M. A Novel Colorimetric Food Package Label for Fish Spoilage Based on Polyaniline Film. Food Control 2012, 25, 184–189. [Google Scholar] [CrossRef]
- Rahman, S.U.; Röse, P.; Shah, A.U.H.A.; Krewer, U.; Bilal, S. An Amazingly Simple, Fast and Green Synthesis Route to Polyaniline Nanofibers for Efficient Energy Storage. Polymers 2020, 12, 2212. [Google Scholar] [CrossRef]
- Hussin, H.; Gan, S.N.; Phang, S.W. Development of Water-Based Polyaniline Sensor for Hydrazine Detection. Sens. Actuators A Phys. 2021, 317, 112460. [Google Scholar] [CrossRef]
- Yslas, E.I.; Ibarra, L.E.; Peralta, D.O.; Barbero, C.A.; Rivarola, V.A.; Bertuzzi, M.L. Polyaniline Nanofibers: Acute Toxicity and Teratogenic Effect on Rhinella Arenarum Embryos. Chemosphere 2012, 87, 1374–1380. [Google Scholar] [CrossRef] [PubMed]
- Kašpárková, V.; Humpoliček, P.; Stejskal, J.; Capáková, Z.; Bober, P.; Skopalová, K.; Lehocký, M. Exploring the Critical Factors Limiting Polyaniline Biocompatibility. Polymers 2019, 11, 362. [Google Scholar] [CrossRef] [PubMed] [Green Version]
- Mustapha, N.; Khairuddin, N.; Muhamad, I.I.; Hashim, S.; Siddique, M.B.M. Characterization of HEC/PANI Film as a Potential Electroactive Packaging with PH Sensor. Sains Malays. 2016, 45, 1169–1176. [Google Scholar]
- Wang, W.; Li, M.; Li, H.; Liu, X.; Guo, T.; Zhang, G.; Xiong, Y. A Renewable Intelligent Colorimetric Indicator Based on Polyaniline for Detecting Freshness of Tilapia. Packag. Technol. Sci. 2017, 31, 133–140. [Google Scholar] [CrossRef]
- Liu, X.; Wang, Y.; Zhu, L.; Tang, Y.; Gao, X.; Tang, L.; Li, X.; Li, J. Dual-Mode Smart Packaging Based on Tetraphenylethylene-Functionalized Polyaniline Sensing Label for Monitoring the Freshness of Fish. Sens. Actuators B Chem. 2020, 323, 128694. [Google Scholar] [CrossRef]
- Sapurina, I.; Shishov, M.A. The Mechanism of the Oxidative Polymerization of Aniline and the Formation of Supramolecular Polyaniline Structures. In New Polymers for Special Applications; InTechOpen: London, UK, 2012; Volume 9, pp. 251–312. [Google Scholar] [CrossRef]
- Ji, X.; Leng, M.; Xie, H.; Wang, C.; Dunbar, K.R.; Zou, Y.; Fang, L. Extraordinary Electrochemical Stability and Extended Polaron Delocalization of Ladder-Type Polyaniline-Analogous Polymers. Chem. Sci. 2020, 11, 12737–12745. [Google Scholar] [CrossRef]
- Franceschelli, L.; Berardinelli, A.; Dabbou, S.; Ragni, L.; Tartagni, M. Sensing Technology for Fish Freshness and Safety: A Review. Sensors 2021, 21, 1373. [Google Scholar] [CrossRef]
- Cai, C.; Mo, J.; Lu, Y.; Zhang, N.; Wu, Z.; Wang, S.; Nie, S. Integration of a Porous Wood-Based Triboelectric Nanogenerator and Gas Sensor for Real-Time Wireless Food-Quality Assessment. Nano Energy 2021, 83, 105833. [Google Scholar] [CrossRef]
- Khong, C.H.; Lee, M.L.Y.; Ahmad, I.; Phang, S.W. Development of Grafted Rubber/Polyaniline/Carboxymethyl Cellulose Film as Green Conductive Polymer Film. Polym. Bull. 2021, 1–12. [Google Scholar] [CrossRef]
- Mokhtar, N.; Chye, D.A.T.; Phang, S.W. Microwave Absorption Properties of Polyaniline/Titanium Dioxide (PAni/TiO2) Doped with Different Types of Fullerenes. Macromol. Symp. 2018, 382, 1800089. [Google Scholar] [CrossRef]
- Butoi, B.; Groza, A.; Dinca, P.; Balan, A.; Barna, V. Morphological and Structural Analysis of Polyaniline and Poly(o-Anisidine) Layers Generated in a DC Glow Discharge Plasma by Using an Oblique Angle Electrode Deposition Configuration. Polymers 2017, 9, 732. [Google Scholar] [CrossRef] [PubMed] [Green Version]
- Mustaffa, N.A.; Ahsan, Q.; Azam, M.A.; Abdullah, L.C. Dodecylbenzene Sulfonic Acid Concentration Effect on Electrical and Thermal Properties of Polyaniline. Malays. J. Anal. Sci. 2017, 21, 950–957. [Google Scholar] [CrossRef]
- Rahman, K.H.; Kar, A.K. Titanium-Di-Oxide (TiO2) Concentration-Dependent Optical and Morphological Properties of PAni-TiO2 Nanocomposite. Mater. Sci. Semicond. Process. 2020, 105, 104745. [Google Scholar] [CrossRef]
- Sambasevam, K.P.; Mohamad, S.; Phang, S.W. Chemical Sensor for Hydrazone Detection Using Polyaniline Film. Malays. J. Anal. Sci. 2017, 21, 762–769. [Google Scholar] [CrossRef]
- Jumat, N.A.; Phang, S.W.; Ching, J.J.; Basirun, W.J. Synthesis of Polyaniline-TiO2 Nanocomposites and Their Application in Photocatalytic Degradation. Polym. Polym. Compos. 2017, 25, 507–514. [Google Scholar] [CrossRef]
- Khong, C.H.; Chia, M.R.; Ahmad, I.; Phang, S.W. Chemical Treatment of Grafted Rubber-Based Conductive Polymer Film for Homogeneity Improvement. J. Appl. Polym. Sci. 2021, 138, 51455. [Google Scholar] [CrossRef]
- Dai, L.; Zhang, J.; Cheng, F. Effects of Starches from Different Botanical Sources and Modification Methods on Physicochemical Properties of Starch-Based Edible Films. Int. J. Biol. Macromol. 2019, 132, 897–905. [Google Scholar] [CrossRef]
- Basiak, E.; Lenart, A.; Debeaufort, F. How Glycerol and Water Contents Affect the Structural and Functional Properties of Starch-Based Edible Films. Polymers 2018, 10, 412. [Google Scholar] [CrossRef] [Green Version]
- Pozo, C.; Rodríguez-Llamazares, S.; Bouza, R.; Barral, L.; Castaño, J.; Müller, N.; Restrepo, I. Study of the Structural Order of Native Starch Granules Using Combined FTIR and XRD Analysis. J. Polym. Res. 2018, 25, 266. [Google Scholar] [CrossRef]
- Zhang, Y.; Zhang, G. Starch Content and Physicochemical Properties of Green Wheat Starch. Int. J. Food Prop. 2019, 22, 1463–1474. [Google Scholar] [CrossRef] [Green Version]
- Abdullah, U.H.; Ahmad, I.; Hamzah, A.; Rosli, N.A. Effectiveness of Starch/Cinnamon Oil Film as Food Packaging with Antimicrobial Properties. Sains Malays. 2020, 49, 1935–1945. [Google Scholar] [CrossRef]
- Sheng, L.; Li, P.; Wu, H.; Liu, Y.; Han, K.; Gouda, M.; Tong, Q.; Ma, M.; Jin, Y. Tapioca Starch-Pullulan Interaction during Gelation and Retrogradation. LWT 2018, 96, 432–438. [Google Scholar] [CrossRef]
- Azmi, N.S.; Kadir Basha, R.; Othman, S.H.; Mohammed, M.A.P. Characterization of Antioxidant Tapioca Starch/Polyaniline Composites Film Prepared Using Solution Casting Method. Food Res. 2019, 3, 317–324. [Google Scholar] [CrossRef]
- Nand, A.V.; Ray, S.; Travas-Sejdic, J.; Kilmartin, P.A. Characterization of Polyethylene Terephthalate/Polyaniline Blends as Potential Antioxidant Materials. Mater. Chem. Phys. 2012, 134, 443–450. [Google Scholar] [CrossRef]
- Cao, C.; Shen, M.; Hu, J.; Qi, J.; Xie, P.; Zhou, Y. Comparative Study on the Structure-Properties Relationships of Native and Debranched Rice Starch. CYTA—J. Food 2020, 18, 84–93. [Google Scholar] [CrossRef] [Green Version]
- Todica, M.; Nagy, E.M.; Niculaescu, C.; Stan, O.; Cioica, N.; Pop, C.V. XRD Investigation of Some Thermal Degraded Starch Based Materials. J. Spectrosc. 2016, 2016, 9605312. [Google Scholar] [CrossRef]
- Zhai, X.; Shi, J.; Zou, X.; Wang, S.; Jiang, C.; Zhang, J.; Huang, X.; Zhang, W.; Holmes, M. Novel Colorimetric Films Based on Starch/Polyvinyl Alcohol Incorporated with Roselle Anthocyanins for Fish Freshness Monitoring. Food Hydrocoll. 2017, 69, 308–317. [Google Scholar] [CrossRef] [Green Version]
- Hashemi Monfared, A.; Jamshidi, M. Synthesis of Polyaniline/Titanium Dioxide Nanocomposite (PAni/TiO2) and Its Application as Photocatalyst in Acrylic Pseudo Paint for Benzene Removal under UV/VIS Lights. Prog. Org. Coat. 2019, 136, 105257. [Google Scholar] [CrossRef]
- Gul, S.; Shah, A.U.H.A.; Bilal, S. Synthesis and Characterization of Processable Polyaniline Salts. J. Phys. Conf. Ser. 2013, 439, 012002. [Google Scholar] [CrossRef] [Green Version]
- Koga, N.; Goshi, Y.; Yamada, S.; Pérez-Maqueda, L.A. Kinetic Approach to Partially Overlapped Thermal Decomposition Processes: Co-Precipitated Zinc Carbonates. J. Therm. Anal. Calorim. 2013, 111, 1463–1474. [Google Scholar] [CrossRef]
- Zainuddin, S.Y.Z.; Ahmad, I.; Kargarzadeh, H. Cassava Starch Biocomposites Reinforced with Cellulose Nanocrystals from Kenaf Fibers. Compos. Interfaces 2013, 20, 189–199. [Google Scholar] [CrossRef]
- Nasution, H.; Julianti, E.; Dalimunthe, N.F.; Wulandari, G. The Role of Betel (Piper Betle) Leaf Extract and Glycerol on Physical Properties of Bioplastic Based on Sago Starch. IOP Conf. Ser. Earth Environ. Sci. 2021, 912, 012042. [Google Scholar] [CrossRef]
- Sharma, P.; Avedisian, C.T.; Brunson, J.D.; Tsang, W. Decomposition by Film Boiling Heat Transfer of Glycerol. Int. J. Heat Mass Transf. 2019, 139, 873–880. [Google Scholar] [CrossRef]
- Rodriguez-Pineda, L.M.; Munoz-Prieto, E.; Rius-Alonso, C.A.; Palacios-Alquisira, J. Preparation and Characterization of Potato Starch Nanoparticles with Acrylamide by Microwave Radiation. Cienc. En Desarro. 2018, 9, 149–159. [Google Scholar] [CrossRef] [Green Version]
- Kumar, A.; Kumar, A.; Mudila, H.; Awasthi, K.; Kumar, V. Synthesis and Thermal Analysis of Polyaniline (PANI). J. Phys. Conf. Ser. 2020, 1531, 012108. [Google Scholar] [CrossRef]
- Saadattalab, V.; Shakeri, A.; Gholami, H. Effect of CNTs and Nano ZnO on Physical and Mechanical Properties of Polyaniline Composites Applicable in Energy Devices. Prog. Nat. Sci. Mater. Int. 2016, 26, 517–522. [Google Scholar] [CrossRef]
- Zareh, E.N.; Moghadam, P.N.; Azariyan, E.; Sharifian, I. Conductive and Biodegradable Polyaniline/Starch Blends and Their Composites with Polystyrene. Iran. Polym. J. 2011, 20, 319–328. [Google Scholar]
- Amin, M.R.; Chowdhury, M.A.; Kowser, M.A. Characterization and Performance Analysis of Composite Bioplastics Synthesized Using Titanium Dioxide Nanoparticles with Corn Starch. Heliyon 2019, 5, e02009. [Google Scholar] [CrossRef] [Green Version]
- Dragoni, D.; Behler, J.; Bernasconi, M. Mechanism of Amorphous Phase Stabilization in Ultrathin Films of Monoatomic Phase Change Material. Nanoscale 2021, 13, 16146–16155. [Google Scholar] [CrossRef]
- Martínez, P.; Peña, F.; Bello-Pérez, L.A.; Núñez-Santiago, C.; Yee-Madeira, H.; Velezmoro, C. Physicochemical, Functional and Morphological Characterization of Starches Isolated from Three Native Potatoes of the Andean Region. Food Chem. X 2019, 2, 100030. [Google Scholar] [CrossRef]
- Hsieh, M.Y.; Huang, P.J. Magnetic Nanoprobes for Rapid Detection of Copper Ion in Aqueous Environment by Surface-Enhanced Raman Spectroscopy. RSC Adv. 2022, 12, 921–928. [Google Scholar] [CrossRef]
- Pang, Z.; Yildirim, E.; Pasquinelli, M.A.; Wei, Q. Ammonia Sensing Performance of Polyaniline-Coated Polyamide 6 Nanofibers. ACS Omega 2021, 6, 8950–8957. [Google Scholar] [CrossRef] [PubMed]
- Ibrahim, S.A.; Abdul Rahman, N.; Yaacob, M.H.; Abu Bakar, M.H.; Mohamad, F.S.; Mohd Yahya, N.A.; Md Yusoff, N.; Mahdi, M.A. Self-Assembled Polyaniline Nanostructures in Situ Deposited on Silica Optical Fibers for Ammonia Gas Sensing. Synth. Met. 2022, 283, 116962. [Google Scholar] [CrossRef]
- Nguyen, L.H.; Naficy, S.; McConchie, R.; Dehghani, F.; Chandrawati, R. Polydiacetylene-Based Sensors to Detect Food Spoilage at Low Temperatures. J. Mater. Chem. C 2019, 7, 1919–1926. [Google Scholar] [CrossRef]
- Virgilio, A.; Silva, A.B.S.; Nogueira, A.R.A.; Nóbrega, J.A.; Donati, G.L. Calculating Limits of Detection and Defining Working Ranges for Multi-Signal Calibration Methods. J. Anal. At. Spectrom. 2020, 35, 1614–1620. [Google Scholar] [CrossRef]
- Arango, T.; Besteiro, R.; Ortega, J.A.; Castro, Á.; Ramiro, M.; Fern, D. Linear Models for the Prediction of Animal Zone Ammonia in a Weaned Piglet Building. Agronomy 2021, 11, 1927. [Google Scholar] [CrossRef]
- Babazadeh, S.; Moghaddam, P.A.; Keshipour, S.; Mollazade, K. Colorimetric Sensing of Imidacloprid in Cucumber Fruits Using a Graphene Quantum Dot/Au (III) Chemosensor. Sci. Rep. 2020, 10, 14327. [Google Scholar] [CrossRef]
- Bordbar, M.M.; Nguyen, T.A.; Tran, A.Q.; Bagheri, H. Optoelectronic Nose Based on an Origami Paper Sensor for Selective Detection of Pesticide Aerosols. Sci. Rep. 2020, 10, 17302. [Google Scholar] [CrossRef]
- Florea, A.; Cowen, T.; Piletsky, S.; De Wael, K. Electrochemical Sensing of Cocaine in Real Samples Based on Electrodeposited Biomimetic Affinity Ligands. Analyst 2019, 144, 4639–4646. [Google Scholar] [CrossRef]
- Zhang, X.; Wang, Z.; Liu, Z.; Liu, B.; Wu, R.; Chen, Z.; Zuo, X. New Application of a Traditional Method: Colorimetric Sensor Array for Reducing Sugars Based on the in-Situ Formation of Core-Shell Gold Nanorod-Coated Silver Nanoparticles by the Traditional Tollens Reaction. Microchim. Acta 2021, 188, 142. [Google Scholar] [CrossRef] [PubMed]
- Gu, Y.; Huang, J. Colorimetric Detection of Gaseous Ammonia by Polyaniline Nanocoating of Natural Cellulose Substances. Colloids Surf. A Physicochem. Eng. Asp. 2013, 433, 166–172. [Google Scholar] [CrossRef]
- Bekhit, A.E.D.A.; Holman, B.W.B.; Giteru, S.G.; Hopkins, D.L. Total Volatile Basic Nitrogen (TVB-N) and Its Role in Meat Spoilage: A Review. Trends Food Sci. Technol. 2021, 109, 280–302. [Google Scholar] [CrossRef]
- Ng, W.T.; Zaki, S.A.; Hagishima, A.; Rijal, H.B.; Yakub, F. Affordable Retrofitting Methods to Achieve Thermal Comfort for a Terrace House in Malaysia with a Hot–Humid Climate. Energy Build. 2020, 223, 110072. [Google Scholar] [CrossRef]
- Mikhalovsky, S.V.; Savina, I.N.; Dainiak, M.; Ivanov, A.E.; Galaev, I.Y. Biomaterials/Cryogels. In Comprehensive Biotechnology; Moo-Young, M., Ed.; Elsevier Inc.: Pergamon, Turkey, 2019; pp. 411–423. [Google Scholar] [CrossRef]
- Chen, P.S. Great Affinity of Ammonia for Water. J. Chem. Educ. 1972, 49, A267. [Google Scholar] [CrossRef]
- Hansen, C.M. Hansen Solubility Parameters: A User’s Handbook: Second Edition, 2nd ed.; CRC Press: New York, NY, USA, 2007. [Google Scholar] [CrossRef]
- Tu, M.C.; Cheema, J.A.; Yildiz, U.H.; Palaniappan, A.; Liedberg, B. Vapor Phase Solvatochromic Responses of Polydiacetylene Embedded Matrix Polymers. J. Mater. Chem. C 2017, 5, 1803–1809. [Google Scholar] [CrossRef]


| Polymer Films | Temperature (°C) | |||
|---|---|---|---|---|
| Stage I | Stage II | Stage III | Stage IV | |
| Starch | 120.0 | NIL | 274.2 | 316.5 |
| Starch/PANI 0.1% | 140.1 | NIL | 292.4 | 318.7 |
| Starch/PANI 0.2% | 122.3 | 236.7 | 292.4 | 319.5 |
| Starch/PANI 0.3% | 128.0 | 228.8 | 287.5 | 319.3 |
| Starch/PANI 0.4% | 124.4 | 211.3 | 280.4 | 319.8 |
| Starch/PANI 0.5% | 116.5 | 189.6 | 277.5 | 317.8 |
| Polymer Films | Tg (°C) | Tm (°C) | ∆Hf (J/g) |
|---|---|---|---|
| Starch | 77.0 | 277.6 | 23.8 |
| Starch/PANI 0.1% | 77.0 | 281.3 | 19.5 |
| Starch/PANI 0.2% | 77.0 | 287.5 | 9.1 |
| Starch/PANI 0.3% | 76.3 | 282.5 | 6.3 |
| Starch/PANI 0.4% | 71.3 | 270.0 | 4.1 |
| Starch/PANI 0.5% | 68.4 | 262.6 | 3.2 |
| Before | After | |
|---|---|---|
| Starch/PANI 0.1% | 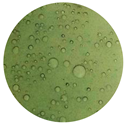 |  |
| Starch/PANI 0.2% | 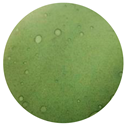 |  |
| Starch/PANI 0.3% | 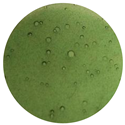 | 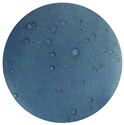 |
| Starch/PANI 0.4% | 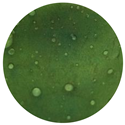 |  |
| Starch/PANI 0.5% | 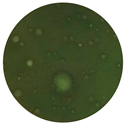 |  |
| Polymer Films | Regression Equation | R2 | RSD (%) | LOD (ppm) | LOQ (ppm) | |
|---|---|---|---|---|---|---|
| Slope | Intercept | |||||
| Starch/PANI 0.1% | 0.0002 | 1.0891 | 0.9238 ** | 1.95 | 812 | 2459 |
| Starch/PANI 0.2% | 0.0003 | 1.1227 | 0.9208 ** | 2.38 | 166 | 502 |
| Starch/PANI 0.3% | 0.0004 | 1.1670 | 0.9200 ** | 6.10 | 148 | 448 |
| Starch/PANI 0.4% | 0.0004 | 1.3015 | 0.9359 ** | 8.72 | 145 | 440 |
| Starch/PANI 0.5% | 0.0004 | 1.1562 | 0.9379 ** | 12.41 | 167 | 505 |
Publisher’s Note: MDPI stays neutral with regard to jurisdictional claims in published maps and institutional affiliations. |
© 2022 by the authors. Licensee MDPI, Basel, Switzerland. This article is an open access article distributed under the terms and conditions of the Creative Commons Attribution (CC BY) license (https://creativecommons.org/licenses/by/4.0/).
Share and Cite
Chia, M.-R.; Ahmad, I.; Phang, S.-W. Starch/Polyaniline Biopolymer Film as Potential Intelligent Food Packaging with Colourimetric Ammonia Sensor. Polymers 2022, 14, 1122. https://doi.org/10.3390/polym14061122
Chia M-R, Ahmad I, Phang S-W. Starch/Polyaniline Biopolymer Film as Potential Intelligent Food Packaging with Colourimetric Ammonia Sensor. Polymers. 2022; 14(6):1122. https://doi.org/10.3390/polym14061122
Chicago/Turabian StyleChia, Min-Rui, Ishak Ahmad, and Sook-Wai Phang. 2022. "Starch/Polyaniline Biopolymer Film as Potential Intelligent Food Packaging with Colourimetric Ammonia Sensor" Polymers 14, no. 6: 1122. https://doi.org/10.3390/polym14061122
APA StyleChia, M.-R., Ahmad, I., & Phang, S.-W. (2022). Starch/Polyaniline Biopolymer Film as Potential Intelligent Food Packaging with Colourimetric Ammonia Sensor. Polymers, 14(6), 1122. https://doi.org/10.3390/polym14061122