Article

Sorption of Fluoride and Bacterial Disinfection Property of Biosynthesized Nanofibrous Cellulose Decorated Ag–MgO–Nanohydroxyapatite Composite for Household Water Treatment

1
Environmental Remediation and Nano Sciences (EnviReN), Department of Geography and Environmental Sciences, Faculty of Science, Engineering and Agriculture, University of Venda, Private Bag X5050, Thohoyandou 0950, South Africa
2
School of Chemistry and Material Sciences, Technical University of Kenya, Haile Selassie Avenue, P.O. Box 52428, Nairobi 00200, Kenya
3
Engineering Systems and Environmet, School of Engineering and Applied Sciences, University of Virginia, P.O. Box 400747, Charlottesville, VA 22904, USA
4
Molecular Parasitology and Opportunistic Infections Program, Department of Biochemistry and Microbiology, Faculty of Science, Engineering, and Agriculture, University of Venda, Private Bag X5050, Thohoyandou 0950, South Africa
*
Author to whom correspondence should be addressed.
Polymers 2022, 14(5), 890; https://doi.org/10.3390/polym14050890
Submission received: 21 December 2021 / Revised: 7 February 2022 / Accepted: 8 February 2022 / Published: 23 February 2022

Abstract

:
An innovative and sustainable approach to integrating modified Ag–MgO–nanohydroxyapatite on a nanofibrous cellulose template (CNF-AgMgOnHaP) as a multifunctional adsorbent via a hydrothermal bioreduction route using Citrus paradisi peel extract was developed and examined. The surface morphology and mineralogical properties of CNF-AgMgOnHaP by UV–vis spectroscopy, SEM-EDS, XRD, FTIR, TEM, and BET techniques are reported. Batch fluoride sorption studies and its disinfection potential against common bacteria in surface water were evaluated. The results showed the successful synthesis of a modified multistructural CNF-AgMgOnHaP composite with an improved BET surface area of 160.17 m2/g. The sorption of fluoride by the adsorbent was found to strongly depend on the different sorption conditions with a maximum F sorption capacity of 8.71 mg/g at 303 K, and pH of 5 with 0.25 g dosage at 10 min contact time (25 ± 3 °C). Equilibrium fluoride sorption onto the CNF-AgMgOnHaP was best described by the Freundlich isotherm model across all the operating temperatures. The overall kinetic results showed that the adsorption mechanisms not only depend on using the pseudo-second-order process but are also governed by the mass transfer of the adsorbate molecules from the external surface onto the pores of the adsorbent. The thermodynamic parameters revealed that the adsorption process of F onto CNF-AgMgOnHaP was endothermic and spontaneous at the sorbent/solution interface. The synthesized composite also provides some antibacterial activity against common infectious microbes from contaminated drinking water. The overall results suggested that the CNF-AgMgOnHaP nanocomposite possesses the potential for the simultaneous decontamination of pollutants and microbes in drinking water.

Graphical Abstract

1. Introduction

Water, according to the United Nations World Water Development Reports [1], is at the core of sustainable development. It is widely acknowledged that providing safe and clean water to communities is the most crucial part of enhancing the wellbeing of people. The lack of centralized treated water supply systems means the rural communities of most developing and sub-Saharan African countries rely on unsafe surface and groundwater sources for their domestic water supply [2,3]. The majority of untreated waters in these rural communities are prone to toxic inorganic metal ions and infectious microbes introduced by natural and anthropogenic activities, resulting in death from water related diseases [4].
Fluoride concentration is an important toxic inorganic contaminant in groundwater resources from the standpoint of public health around the world. Excess fluoride in drinking water is estimated to be a problem in many countries around the world, with significant health effects and morbidity in many regions depending on geographical and economic status [5,6,7]. Fluoride, below the recommended limit of 1.5 mg/L, is an important component in preventing tooth cavities, and facilitating the mineralization of bone, dental enamel, and arduous tissues in humans [8,9,10]. However, in excess, it can be detrimental to human health, leading to dental or crippling skeletal fluorosis [8,11,12]. Besides fluoride epidemics, most acute water related diseases are often associated with the consumption of infectious microbes from contaminated water, which are responsible for about 2.2 million deaths yearly in developing countries [8,13,14]. The disinfection of microbial contamination in these water sources has proven effective against the adverse effects on human health. The disinfection of these microbiological hazards from contaminated water using the conventional chlorination method is rapidly becoming a major challenge, because of microbial resistance and the formation of detrimental reproductive and carcinogenic disinfection byproducts (DBPs) [15,16]. The importance of removing these toxic substances and water disinfection through innovative and sustainable technology cannot be overstated, for improved water quality and ecology. The remediation techniques used are based on the sorption principle as well as chemical cell death by disrupting the cell walls of microbes, particularly at the point of use [17,18]. Many of the materials developed, to date, based on such technologies, as well as their modes of operation and mechanisms, have been reviewed and reported [7,17,18,19,20]. However, challenges, such as high operating costs, high maintenance, low adsorption capacity, incomplete pollutant removal, and toxic sludge release [10,21,22], posed by these technologies have limited their potential field applications.
To overcome these drawbacks, intense efforts are now being directed toward the development of low cost, high selectivity and capacity, readily available, ecofriendly, and sustainable multifunctional biopolymeric reinforced composites, to address these recurring waterborne epidemics. In accordance with the World Health Organization’s (W.H.O.) technological sustainability, biopolymeric reinforced composites provide a solution for economically and ecologically viable multifunctional water purification techniques, to adequately remediate these pollutants in contaminated water resources for use in household water treatment devices.
Nanocellulose has been receiving considerable interest in preparing new composite materials that selectively target toxic metal ions in water because of its surface functionalizable hydroxyl, inherent hydrogen bonds, and van der Waal forces, which, in synergy, may enhance the adsorption capacity of the targeted chemical species [23,24]. Its many remarkable properties, such as mechanical strength, biodegradability, nontoxicity, and renewability, serve as an edge for its application in water treatment, compared to other equivalent sorbent materials [25]. We have recently reported the systemic development and effectiveness of antimicrobial based biogenic nanoparticles and multifunctional metal/metal oxides composites for fluoride and pathogens decontamination from water [26,27,28].
This research is a continuation of the integration, demonstrating the multifunctional properties of biopolymers as a metal based composite reinforcement; due to their exceptional characteristics that offer vast potential in remediating hazardous contaminants from aqueous solution. Therefore, the focus of this study was to isolate cellulose nanofiber from sawdust; biosynthesize a modified Ag-MgO nanoparticle using Citrus paradisi (Grapefruit red) peel extracts as a bioreducing, stabilization, and capping agent on nanohydroxyapatite nanocomposite. To create an improved multifunctional adsorbent by impregnating the Ag-MgOnHaP onto a cellulose nanofiber network, which is intended to simultaneously remediate toxic inorganic and microbial contaminants in drinking water. It is also envisaged that the fabricated adsorbent can be applied in household water treatment devices.

2. Materials and Methods

2.1. Chemicals and Reagents

All chemicals were of analytical reagent grade. Ca(NO3)2·4H2O, KH2PO4, Mg(NO3)2·6H2O, AgNO3, NaClO2, H2SO4, NaF, NaOH, and other chemicals used were obtained from Sigma-Aldrich (St. Louis, MO, USA) and supplied by Rochelle Chemicals, Johannesburg, South Africa. The raw material used in the preparation of cellulose nanofiber in this work is sawdust/wood chips (waste product of woodworking operations) and the peel of Citrus paradisi (Grapefruit red). Raw sawdust was collected from the School of Agriculture, University of Venda, South Africa. Ultrapure water from Ultrapure Milli-Q water S.A.S (Molsheim, France) (18.2 MΩ/cm) was used in the preparation and dilution of standards throughout the experiment.

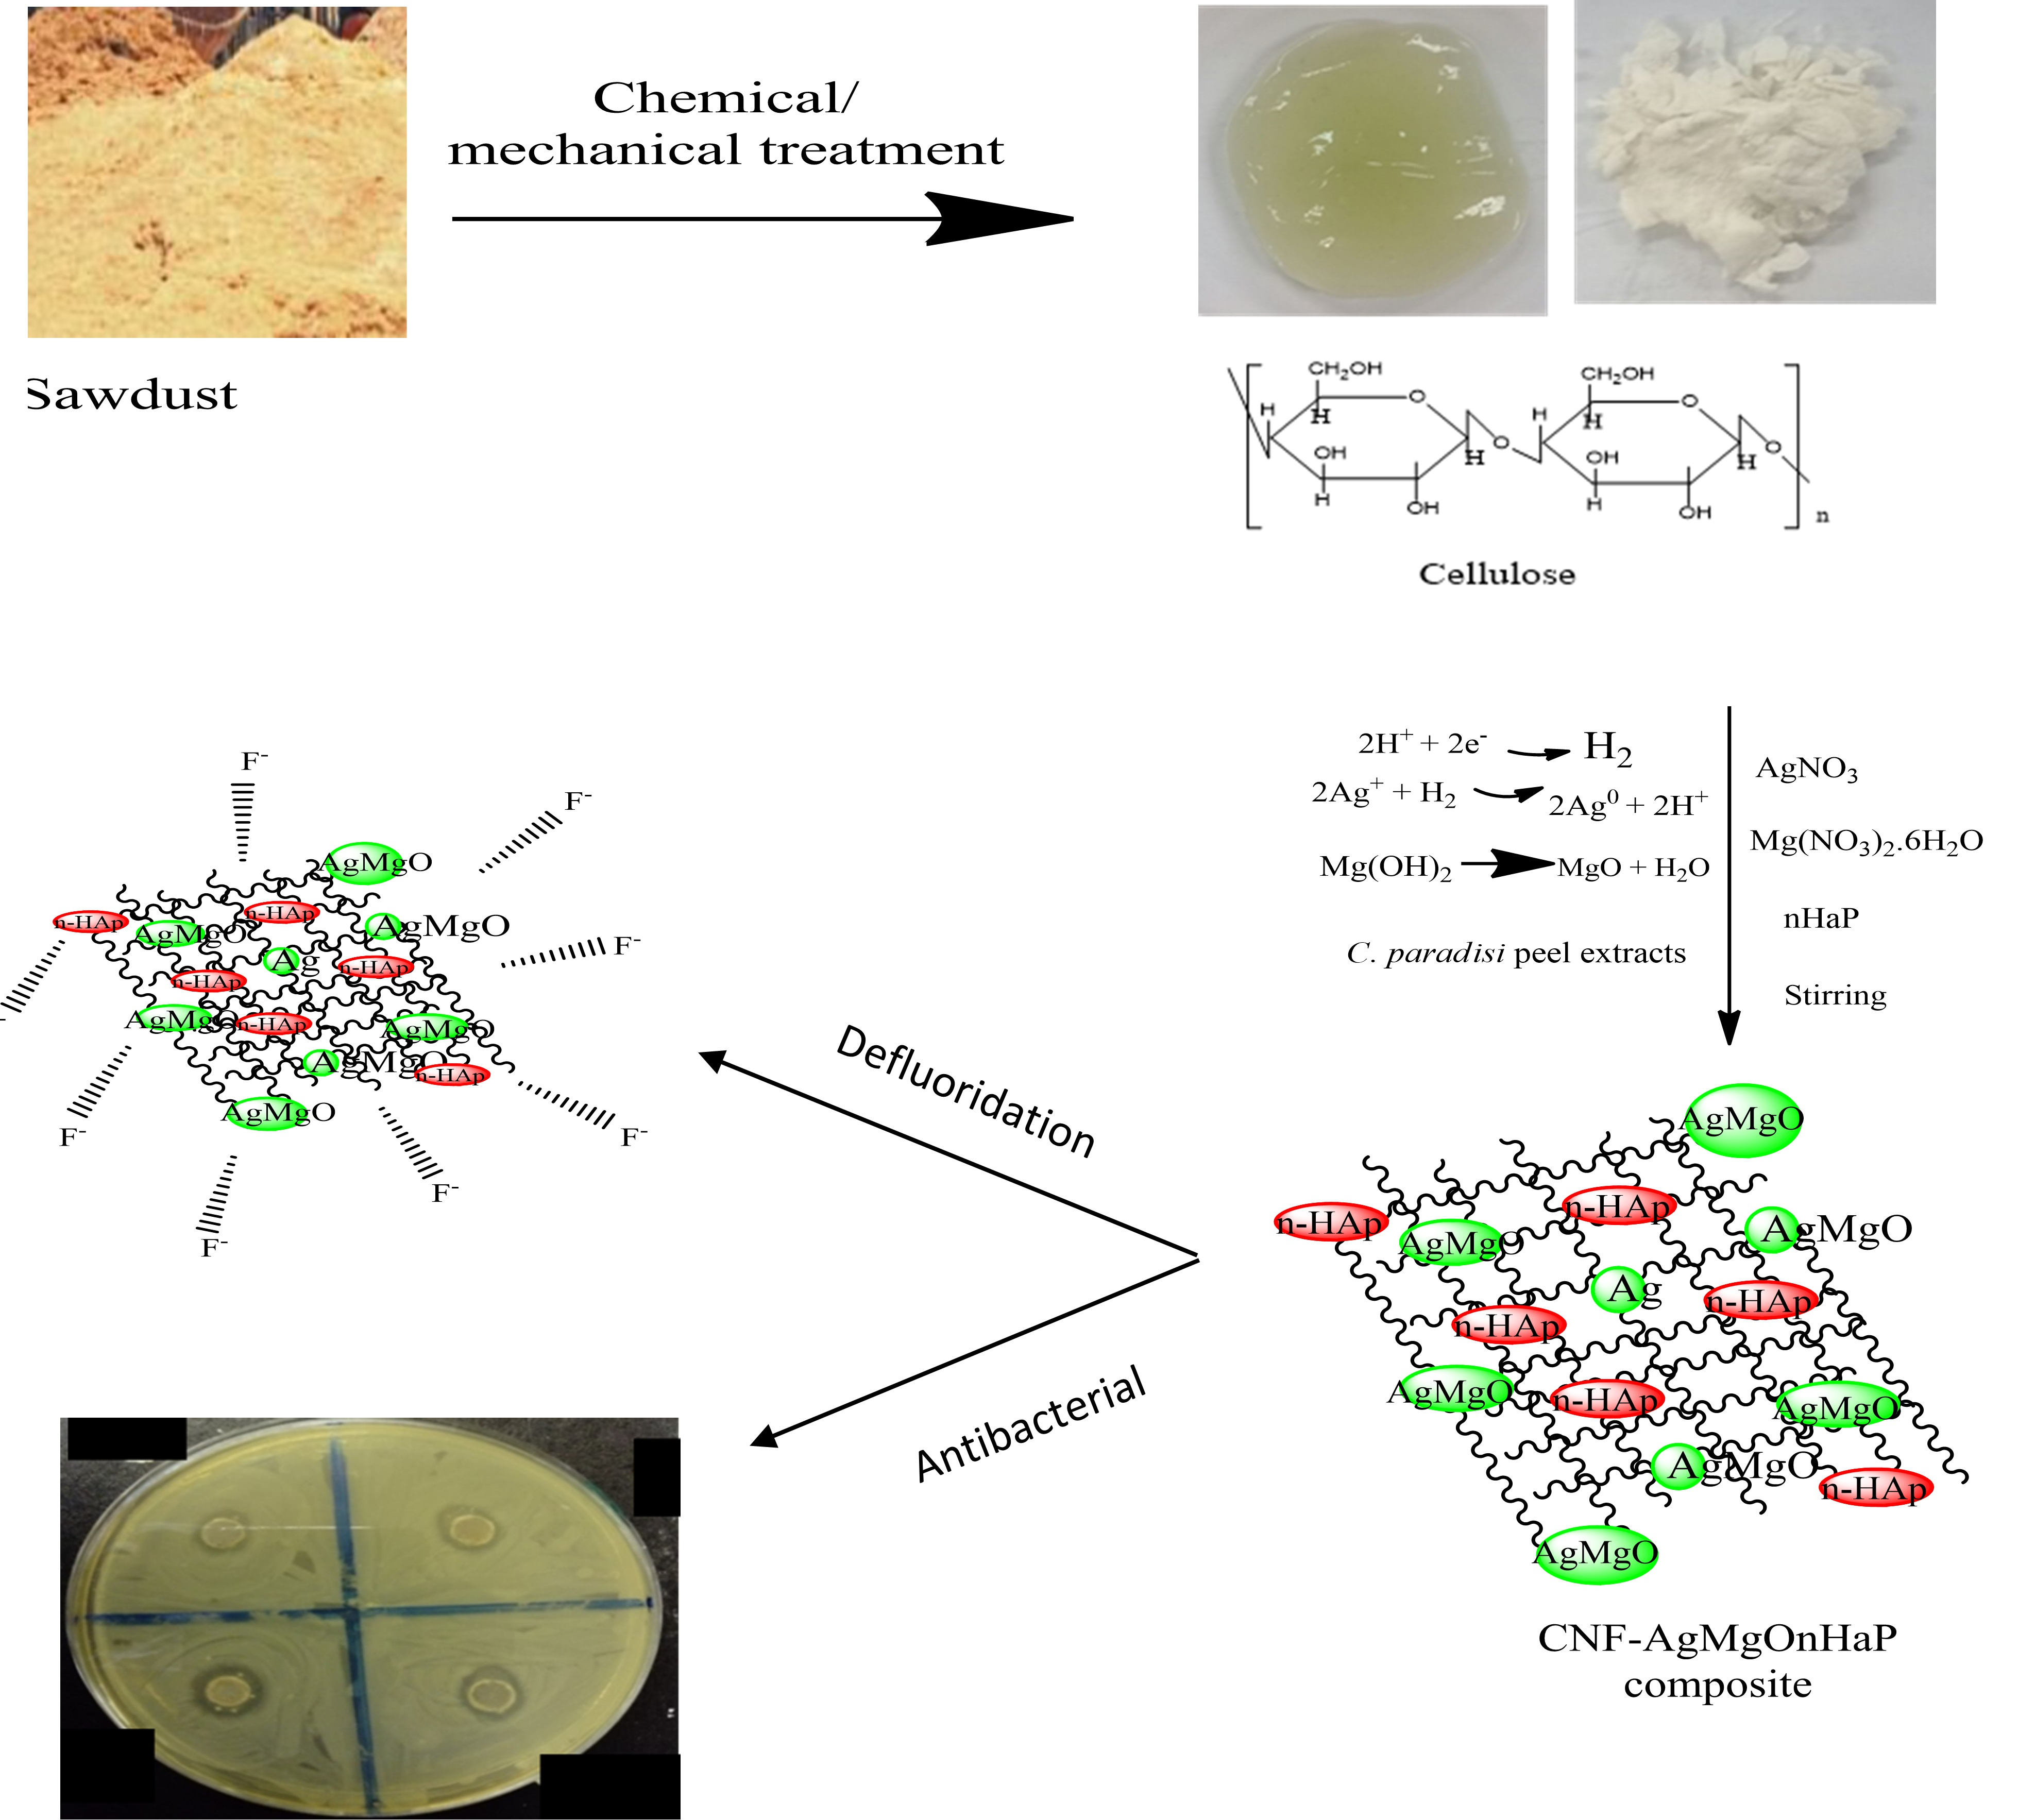
2.2. Preparation of Adsorbent

2.2.1. Preparation of Citrus Paradisi Peel Extract

The fruit peels of Citrus paradisi (Grapefruit red) were removed, cleaned thoroughly using Ultrapure Milli-Q water S.A.S (Molsheim, France) (18.2 MΩ/cm) to remove any dust particles adhering to the surface and cut to small pieces. A total of 30 g of the peel was added to 100 mL of Ultrapure water and boiled for 20 min at 70 °C. The extract was cooled and filtered through Whatman No.1 filter paper (Cytiva, Shrewsbury, MA, USA) and stored at 4 °C for further use.

2.2.2. Preparation of Cellulose Nanofibers from Sawdust Biomass (CNF)

Extraction of cellulose nanofiber was carried out by a modified method for purification of sawdust through chemical (alkaline-acid) and mechanical (ultrasound) modes of treatment, as described by [29,30]. The sawdust was first dried in sunlight and then cut to small sizes using a domestic blending machine (PHILIP, 400W, HR 2103) and passed through a 100-mesh sieve. The ground pieces were further dried in a hot air oven overnight at 65 °C before the alkaline pretreatment. The pretreatment soaking was carried out in an alkali solution (4 wt.% NaOH solution) at room temperature for 3 h, followed by continuous washing with Ultrapure water (18.2 MΩ/cm). The obtained pretreated fibers were delignified by bleaching with a buffer solution (pH 4.5) of acetic acid 5% (w/v), sodium chlorite (NaClO2), and Ultrapure water boiled for 3 h at 70 °C with a pulp to liquor ratio of 1:1. The mixture was allowed to cool and filtered and washed using excess Ultra-pure water (18.2 MΩ/cm). The bleaching process was repeated three times. The obtained delignified and hemicellulose free cellulose fibers were further subjected to acid hydrolysis using 8.5 M of sulphuric acid (fiber to liquor ratio of 1:10) for 1 h at 50 °C. The reaction mixture was stopped by washing several times (in 10-fold excess Ultrapure water), followed by centrifugation at 4500 rpm at room temperature for 30 min until the resultant supernatant liquor became turbid (pH between 5–6). The obtained suspension was stored in the refrigerator at 4 °C for further use. The resulting suspension (colloidal cellulose particles) was thereafter subjected to sonication for 45 min in an ice bath to obtain the nanofibers.

2.2.3. Preparation of Nanohydroxyapatite (nHaP)

Synthetic nanohydroxyapatite (nHaP) was prepared as described by Poinern et al. [31], by reacting 40 mL of 0.32 M Ca(NO3)2·4H2O with 60 mL of 0.19 M KH2PO4 solution under continuous stirring with the Ca/P ratio maintained at 1.67. Subsequently, aqueous NH4OH (25%) was added dropwise to adjust the pH value to 9, and the solution was stirred for 6 h and thereafter left to age for 24 h at room temperature. During the mixing process, the pH value was continually checked and maintained at 9 (using NH4OH). The composite solution was thereafter subjected to ultrasound agitation at 100% amplitude (0.5 cycles) for 1 h. The product obtained after the sonication was filtered and dried at 40 °C in an oven for 24 h before being ground into a fine powder.

2.2.4. Synthesis Conditions of Cellulose–Nanofiber–AgMgOnanohydoxyapatite

The cellulose–nanofiber–AgMgOnanohydoxyapatite composite was synthesized by incorporating nanohydroxyapatite bound to Ag-MgO nanoparticle into a cellulose nanofiber matrix via bioreduction and in situ precipitation method at room temperature. For this, 10 g (w/w %) of the obtained colloidal cellulose suspension from sawdust (CNF) was added to a mixture of solutions containing 40 mL of aqueous Citrus paradisi peel extracts, 60 mL 1 mM AgNO3, and 20 mL 0.1 M Mg(NO3)2·6H2O. The solution was mixed under continuous stirring for 12 h at 40 °C. The bioprocess seed growth kinetics of the nanocomposite through color variation was monitored using UV–Vis spectroscopy. To this continuously stirred bioreduced reaction mixture (CNF-AgMgO), 5 g of nHaP was dispersed into the mixture and was agitated on a magnetic stirrer (Heidolph (Schwabach, Germany)) for 8 h to achieve homogenous mixing. The mixture was filtered and oven dried at 60 °C for 24 h, and then ground to obtain the cellulose–nanofiber–AgMgOnHaP (CNF-AgMgOnHaP). The synthesis routes were repeated by varying the colloidal cellulose suspension loading within the CNF–AgMgOnHaP composite from 10 to 100 (w/w %) to evaluate the optimum loading weight percentage required for optimum defluoridation efficiency.

2.3. Instruments for Material Characterization

The surface morphological, elemental analysis, and physicochemical compositions of the synthesized sorbent were assessed using a scanning electron microscope (SEM) (FEI Nova, Brno, Czechoslovakia Republic) with an FEI Nova NanoSEM 230 with a field emission gun equipped with an Oxford Xmax SDD detector operating at an accelerating voltage of 20 kV for the EDS detector (Oxford X-Max with INCA software). The ALPHA Fourier Transform Infrared spectrum (4000–400 cm−1) equipped with ATR-Diamond (Bruker, Karlsruhe, Germany) was used to obtain the infrared spectrum of the sorbent. Bruker-D8 Powder Diffractometer (Bruker D8 Advance, Cu-K radiation, wavelength 1.54443Å Lynx-eye XE detector) with a theta-theta goniometer X-ray diffraction (XRD) technique was employed to examine the sorbent structural phase modification. The CNF-AgMgOnHaP composite kinetic growth rate was characterized using UV-Visible Spectrophotometers (220–600 nm), (SPECTROstar Nano/BMG LABTECH). Transmission electron microscopy (TEM) images were taken using an FEI Tecnai20 (Hillsboro, OR, USA) equipped with a LaB6 emitter, operating at 200 kV and fitted with a Gatan Tridiem GIF with a 2k × 2k CCD camera. Images were collected using the Digital Micrograph suite of programs for size and shape. The surface area, pore area, and pore volume of the synthesized nanocomposite were measured using nitrogen adsorption Brunauer–Emmett–Teller (BET) surface area and porosity analyzer (Micromeritics ASAP2020). The adsorption–desorption plots were used to calculate the specific surface area. UP400S (400 W at 24 kHz power control amplitude 20–100% ultrasonic device with ultrasonic horn H14) from Hielscher Ultrasonic was used for sonicating. The surface interaction and composition of the fluoride loaded sorbent were studied by the X-ray Photoelectron Spectrometer Microprobe (XPS) (Thermo Scientific ESCAlab 250Xi) (Waltham, MA, USA), with a monochromatic Al Kα X-ray source (1486.7 eV). The high resolution scans were conducted according to the peak being examined with a pass energy of 20 eV (Pressure < 8–10 mBar) and spot size of 900 μm with a wide survey scan between 0–1300 eV.

2.4. Batch Fluoride Adsorption Procedure

Batch fluoride sorption studies were performed and evaluated with the synthesized CNF-AgMgOnHaP for the removal of fluoride in simulated and field groundwater. The effects of contact time, pH, adsorbent dose, initial adsorbate concentration, and coexisting ions on the equilibrium adsorption capacity were optimized. Standard stock fluoride ion solution (1000 mg/L) was prepared by dissolving 2.210 g NaF into 1000 mL of Ultrapure water under ambient conditions. The desired fluoride solution was prepared by the dilution of the standard stock solution. Batch adsorption experiments were carried out by mixing 0.225 g of CNF-AgMgOnHaP with 50 mL of 10 mg/L F solution. The mixture was shaken thoroughly using a reciprocating shaker (STUART SSL2) (Staffordshire, UK) at 250 rpm. The solution was then filtered, and the residual fluoride ion concentration was determined. F and pH were determined using a fluoride ion selective electrode (9609 BNWP) (Orion) (Waltham, MA, USA) coupled to an ISE/pH/EC electrode (Thermo SCIENTIFIC-ORION VERSA STAR Advanced Electrochemistry meter fluoride ion selective electrode) calibrated with four fluoride standards containing TISAB III at the volume ratio of 1:10, as with the samples. The pH values of the solution were adjusted by 0.1 mol/L HCl or NaOH. The effect of coexisting anions on the defluoridation efficiency of the adsorbent was evaluated at an anion concentration of 10–30 mg/L in a 10 mg/L fluoride solution. The adsorption isotherm experiments were conducted by varying fluoride concentrations within the range of 5–100 mg/L in a constant temperature water bath shaker (EcoBath) (Kyonggi, Korea) in the temperature range of 303, 313 and 323 K. Adsorption isotherms and kinetic models were adopted and used to model adsorption data. All the experiments were conducted in triplicate, and the mean of the results was computed. Equations (1) and (2) were used to determine the percentage fluoride removal and adsorption capacity, qe (mg/g) of the adsorbent.
%   Fluoride   Adsorption   =   ( C o     C e ) C o   ×   100
q e   =   ( C o     C e )   ×   V m
where Co is the initial F concentration (mg/L); Ce is the F concentration at equilibrium (mg/L); V is the volume of solution (L), and m is the dried mass of the adsorbent (g).

2.5. Point of Zero Charge (pHpzc)

The pH at the point of zero charge of CNF-AgMgOnHaP was determined in 1 M, 0.1 M, and 0.01 M KCl solutions for consistency of results. The pH of solutions was adjusted to desired values by adding 0.1 M HCl or 0.1 M NaOH. The new pH, therefore, constituted the initial pH (pHi) of solutions. Aliquots of 25 mL of solutions were pipetted into 50 mL plastic bottles. A mass of 0.25 g of adsorbent was then weighed into each of the bottles. The bottles were corked and shaken inside a constant temperature water bath shaker at 150 rpm for 24 h. After equilibration, the equilibrium pH (pHe) of each mixture was quickly measured and recorded.

2.6. Regeneration of CNF-AgMgOnHaP Composite

The regeneration experiments were conducted to evaluate the reusability of the spent sorbent using 0.01 M NaOH and 0.1 M Na2CO3 solutions. In each case of the desorption process, 0.25 g of CNF-AgMgOnHaP composite was added to 50 mL of 10 mg/L fluoride solution. The fluoride loaded adsorbent was agitated separately with 50 mL of 0.01 M NaOH and 0.1 M Na2CO3 for 30 min, thereafter the adsorbent was filtered, and the filtrate was subsequently analyzed for residual fluoride. The collected adsorbent on the filter membrane was washed with Milli-Q water and then dried at 80 °C for 3 h. The regenerated adsorbent was then reused for further fluoride removal for up to four regeneration cycles.

2.7. Antibacterial Evaluation of the Composite

The antibacterial efficacy of the biosynthesized CNF-AgMgOnHaP nanocomposite was determined qualitatively from the observed zone of inhibition (mm) using the standard agar well disc diffusion methods (Kirby Bauer disk diffusion test). The indicator strains used were Escherichia coli (ATCC 35218), Staphylococcus aureus (ATCC 33591), and Klebsiella pneumonia (ATCC 700603). Bacterial suspensions were prepared with a turbidity of 0.5 McFarland. A total of 50 μL of each strain was spread evenly on 20 mL of solidified and dried freshly prepared MHA agar plates. Wells were punctured at equidistance using sterile pipette tips. A total of 50 μL each of CNF-AgMgOnHaP was dispensed into the wells already inoculated with the bacterial cell suspension. The plates were incubated at 37 °C for 24 h and the diameter of the zone of growth inhibition around the different sample concentrations (1–10 mg/mL) was measured in millimeters (mm). The measured zones of inhibition were used to determine the antibacterial activities of the nanocomposite.

2.8. Statistical Tools

The computations were carried out using OriginPro 8.SR0 and Excel software. The best fit sorption models were analyzed using the linear and nonlinear analysis, adjusted correlation coefficient (Adj. R2), and chi-square analysis (χ2) were computed.

3. Results and Discussions

3.1. Effects of Cellulose Nanofiber Loading (wt.%) in CNF-AgMgOnHaP Adsorbent on Adsorption

The percentage weight effects of cellulose nanofibers in the CNF-AgMgOnHaP composite were evaluated for fluoride sorption capacity. This was carried out by contacting 0.225 g of the composite with 50 mL of 10 mg/L initial fluoride solution at 250 rpm for 30 min. Table 1 shows the results of percentage fluoride removal. The results suggests that the higher the CNF weight content, the more the hydroxyl groups present in the composite, resulting in more binding sites for the fluoride sorption capacity throughout the composite matrices.

3.2. Structural Morphological Analysis

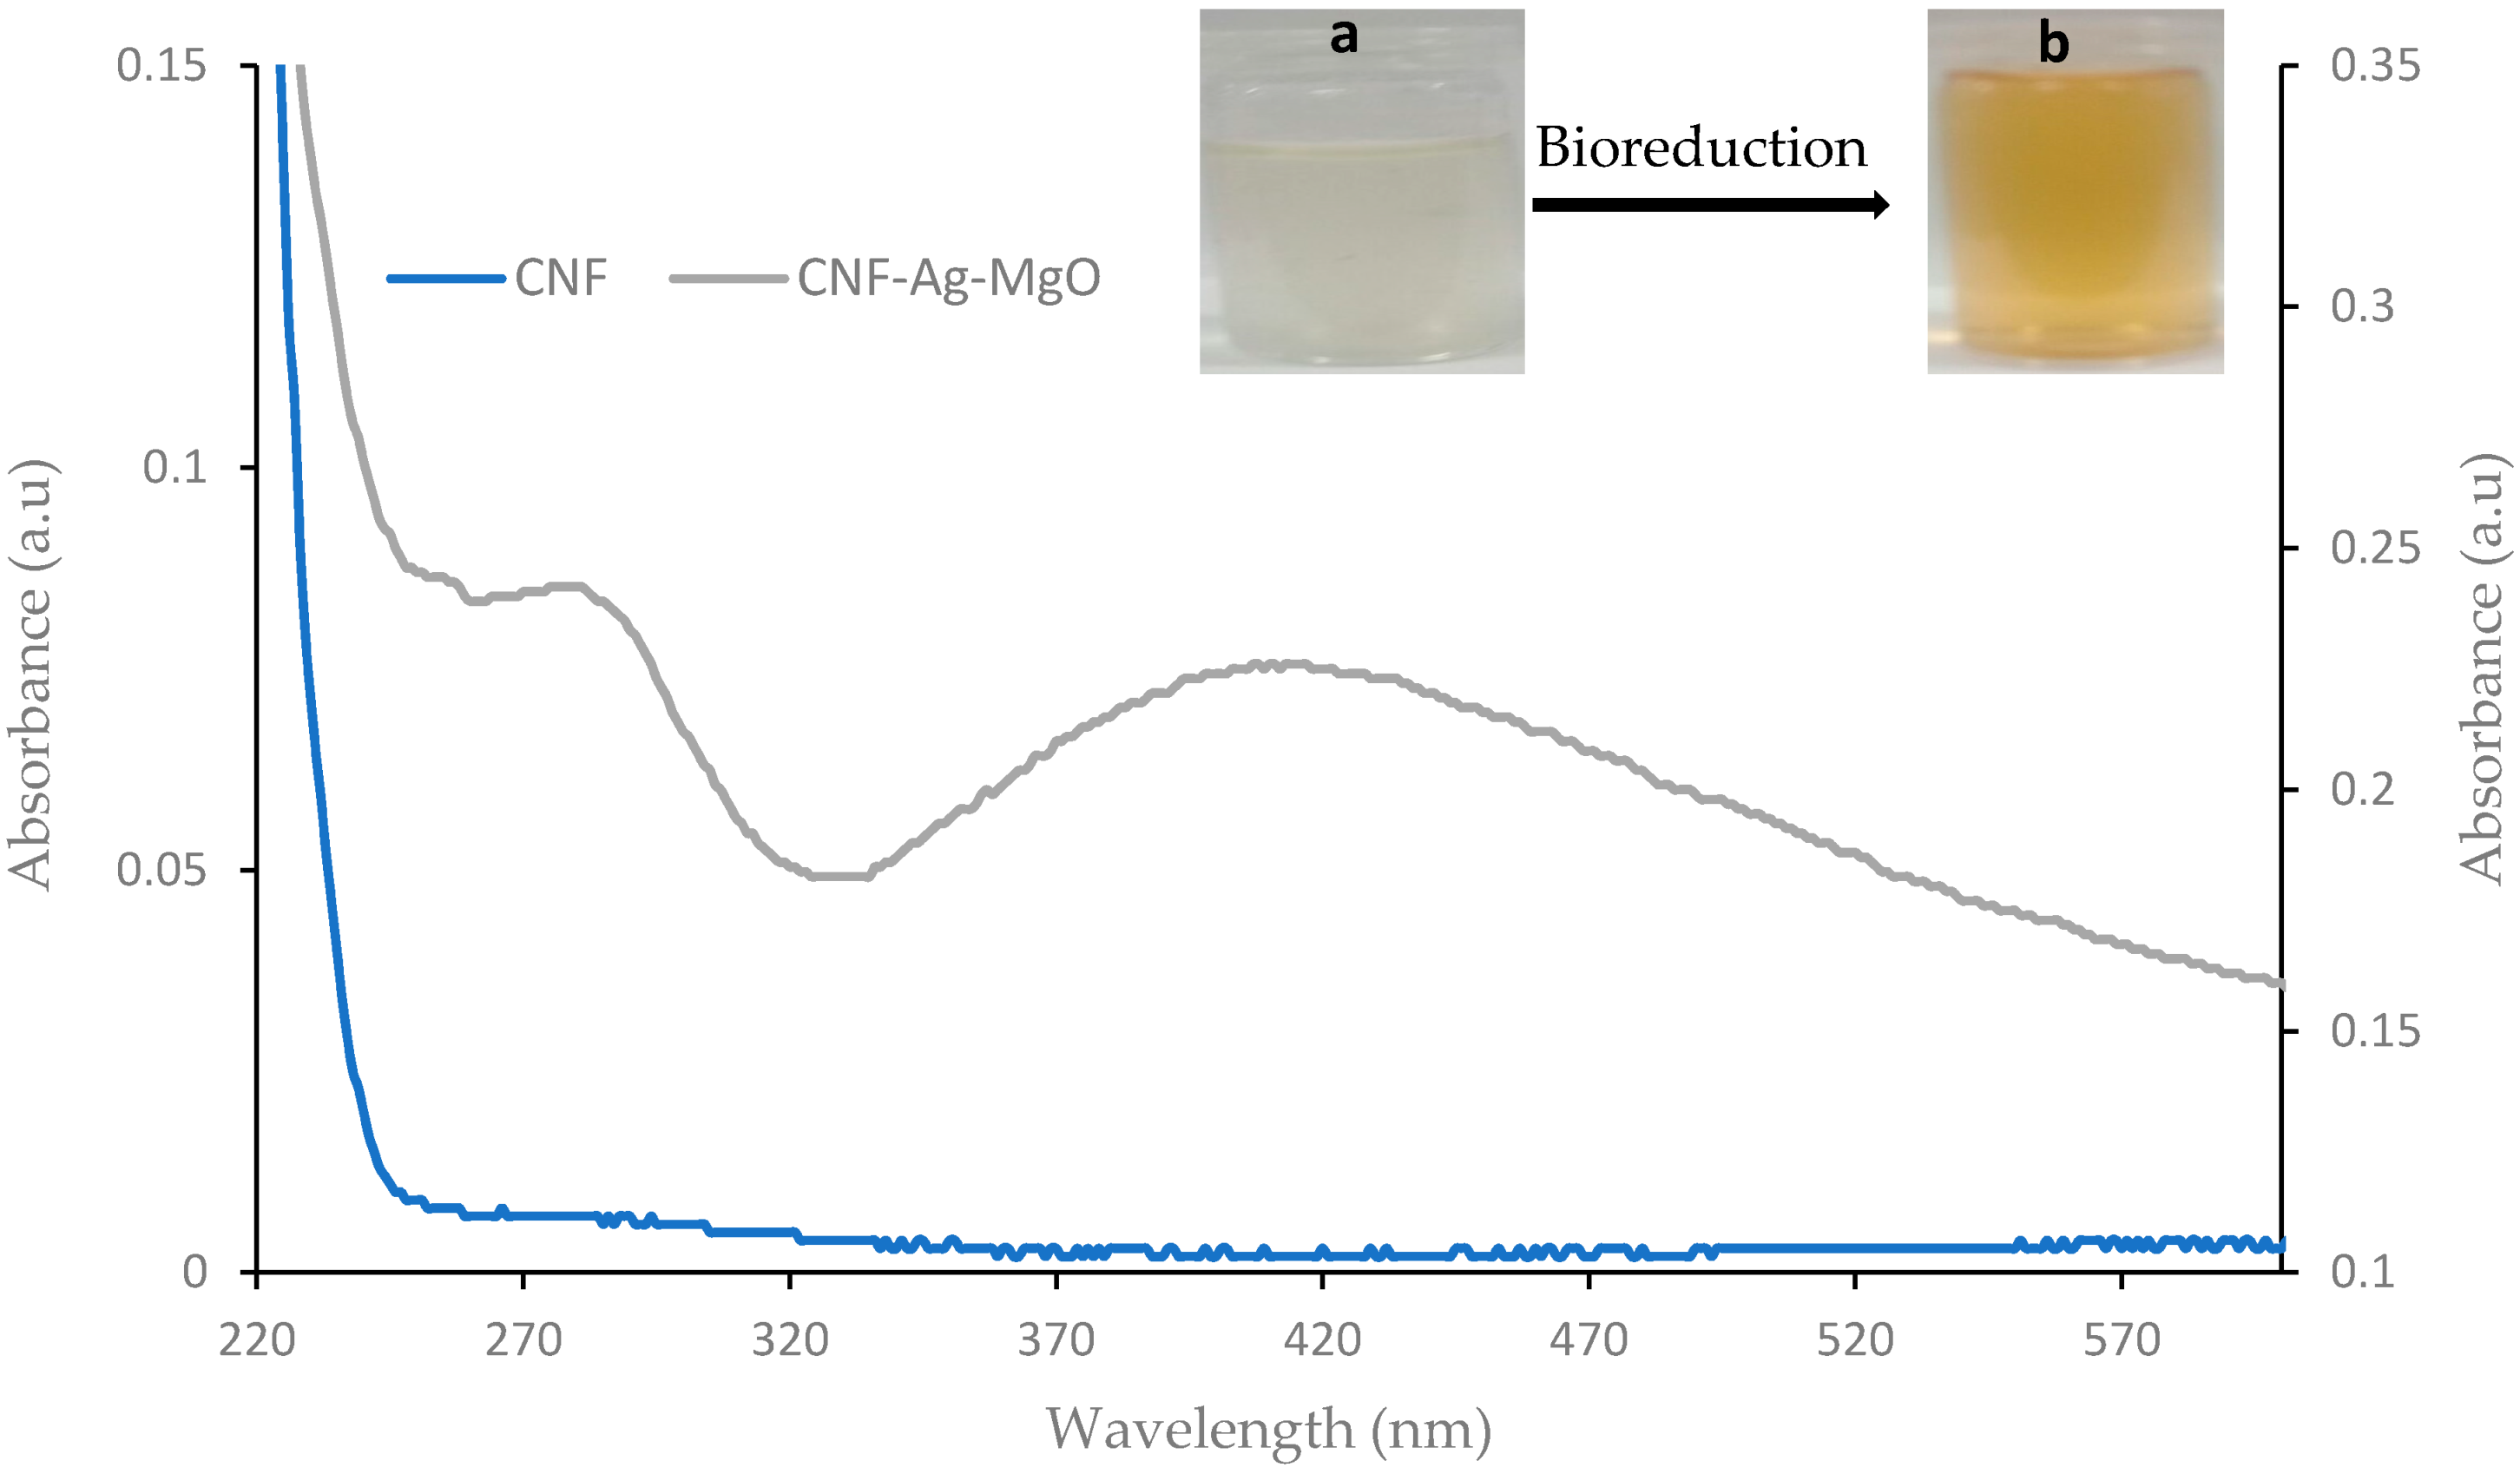
3.2.1. UV-Visible Study

The successful impregnation of the Ag-MgO nanoparticles on the cellulose nanofiber matrix is shown in the UV–visible absorbance spectra (Figure 1). The bioreduction formation of the nanoparticles by aqueous peel extracts of C. paradisi is shown by a change in the color of the reaction solution from colorless to light yellow (inserted image in Figure 1). As shown in the spectra, no visible absorption peak was observed in the bare cellulose nanofiber (CNF); however, two different distinct peaks were observed in the CNF-AgMgO composite. An absorption band is observed in the low UV region range from 270 to 290 nm, typical of MgO, together with a broad band around 420 nm associated with the characteristic absorption of silver nanoparticles [32,33] The change in the reaction mixture color variation is attributed to the surface plasmon resonance of excited electrons and O2− surface anions at the surface of Ag and MgO nanoparticles, respectively, in resonance with a light wave [34,35,36]. The availability and interaction of the bioactive functional species in the C. paradisi peel extracts and that of the cellulose hydroxyl groups with the silver ions may be responsible for the rate of bioreduction, as shown in the optical property of biomolecular capped Ag-MgO nanocomposite into the nanofiber [37,38]. Furthermore, the cellulose fiber matrix used during the synthesis, in addition to contributing as reducing agents, also provided good stability to the CNF-AgMgO composite, thereby preventing agglomeration resulting in uniform nucleation and growth conditions for impregnated nanoparticles [39,40].

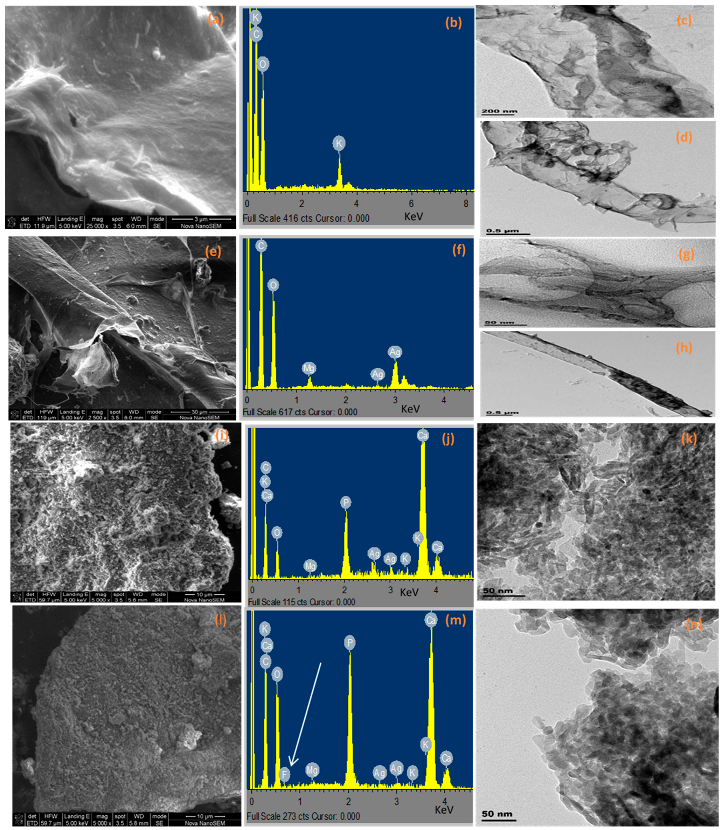
3.2.2. Electron Microscopic Analysis

Figure 2a–n show the SEM images, different size distributions with associated EDS patterns, and the TEM micrographs of the systemically developed composite materials before and after fluoride sorption, respectively. The images of successfully extracted fine and uniform cellulose fibril structure from sawdust and its corresponding compositions are shown in Figure 2a–d. The typical elemental composition of the CNF derived from a sawdust waste constituent is shown on the EDS spectrum (Figure 2b). The obtained fiber is elongated (Figure 2d) with a wide width diameter of about 0.5 μm. Figure 2e showed the SEM image of the synthesized bioreduced CNF-AgMgO nanocomposite from the C. paradisi peel extracts with its corresponding EDS (Figure 2f), revealing the Ag-MgO nanoparticles embedded in the cellulose fiber network. The TEM micrograph (Figure 2g,h) displayed a weblike layout surface structure with a thin, long threadlike individual size of about 30–50 nm in width. It is important to note that the morphologies of CNF and the bioreduced CNF-AgMgO nanocomposite maintain the same elongated, rod like structure, confirming the nanofibrous morphology and the impregnation of the nanoparticles on the surface of the CNF. Figure 2i–n show the different structural modifications of the nHaP impregnated CNF-AgMgO (CNF-AgMgOnHaP) and its corresponding defluoridated CNF-AgMgOnHaP composites. Figure 2i,l represent the SEM images of CNF-AgMgOnHaP and fluoride sorbed CNF-AgMgOnHaP, respectively, and the transformed granulated aggregation of nanoparticles on the cellulose fiber of both composites can be observed. This could be attributed to the very irregular surface of the incorporated nanohydroxyapatite powder after drying the composite [41]. The presence of the inherent elemental distribution around the cellulose matrix of the synthesized CNF-AgMgOnHaP adsorbent is shown in Figure 2j, and the aggregation of the adsorbent at a size distribution range of 50 nm is presented in Figure 2k. The corresponding morphological structure of the sorbed fluoride-CNF-AgMgOnHaP composites is presented in Figure 2l–n. The presence of elemental fluorine in the EDX spectrum (Figure 2m) suggested the potential of the material towards deflouridation.

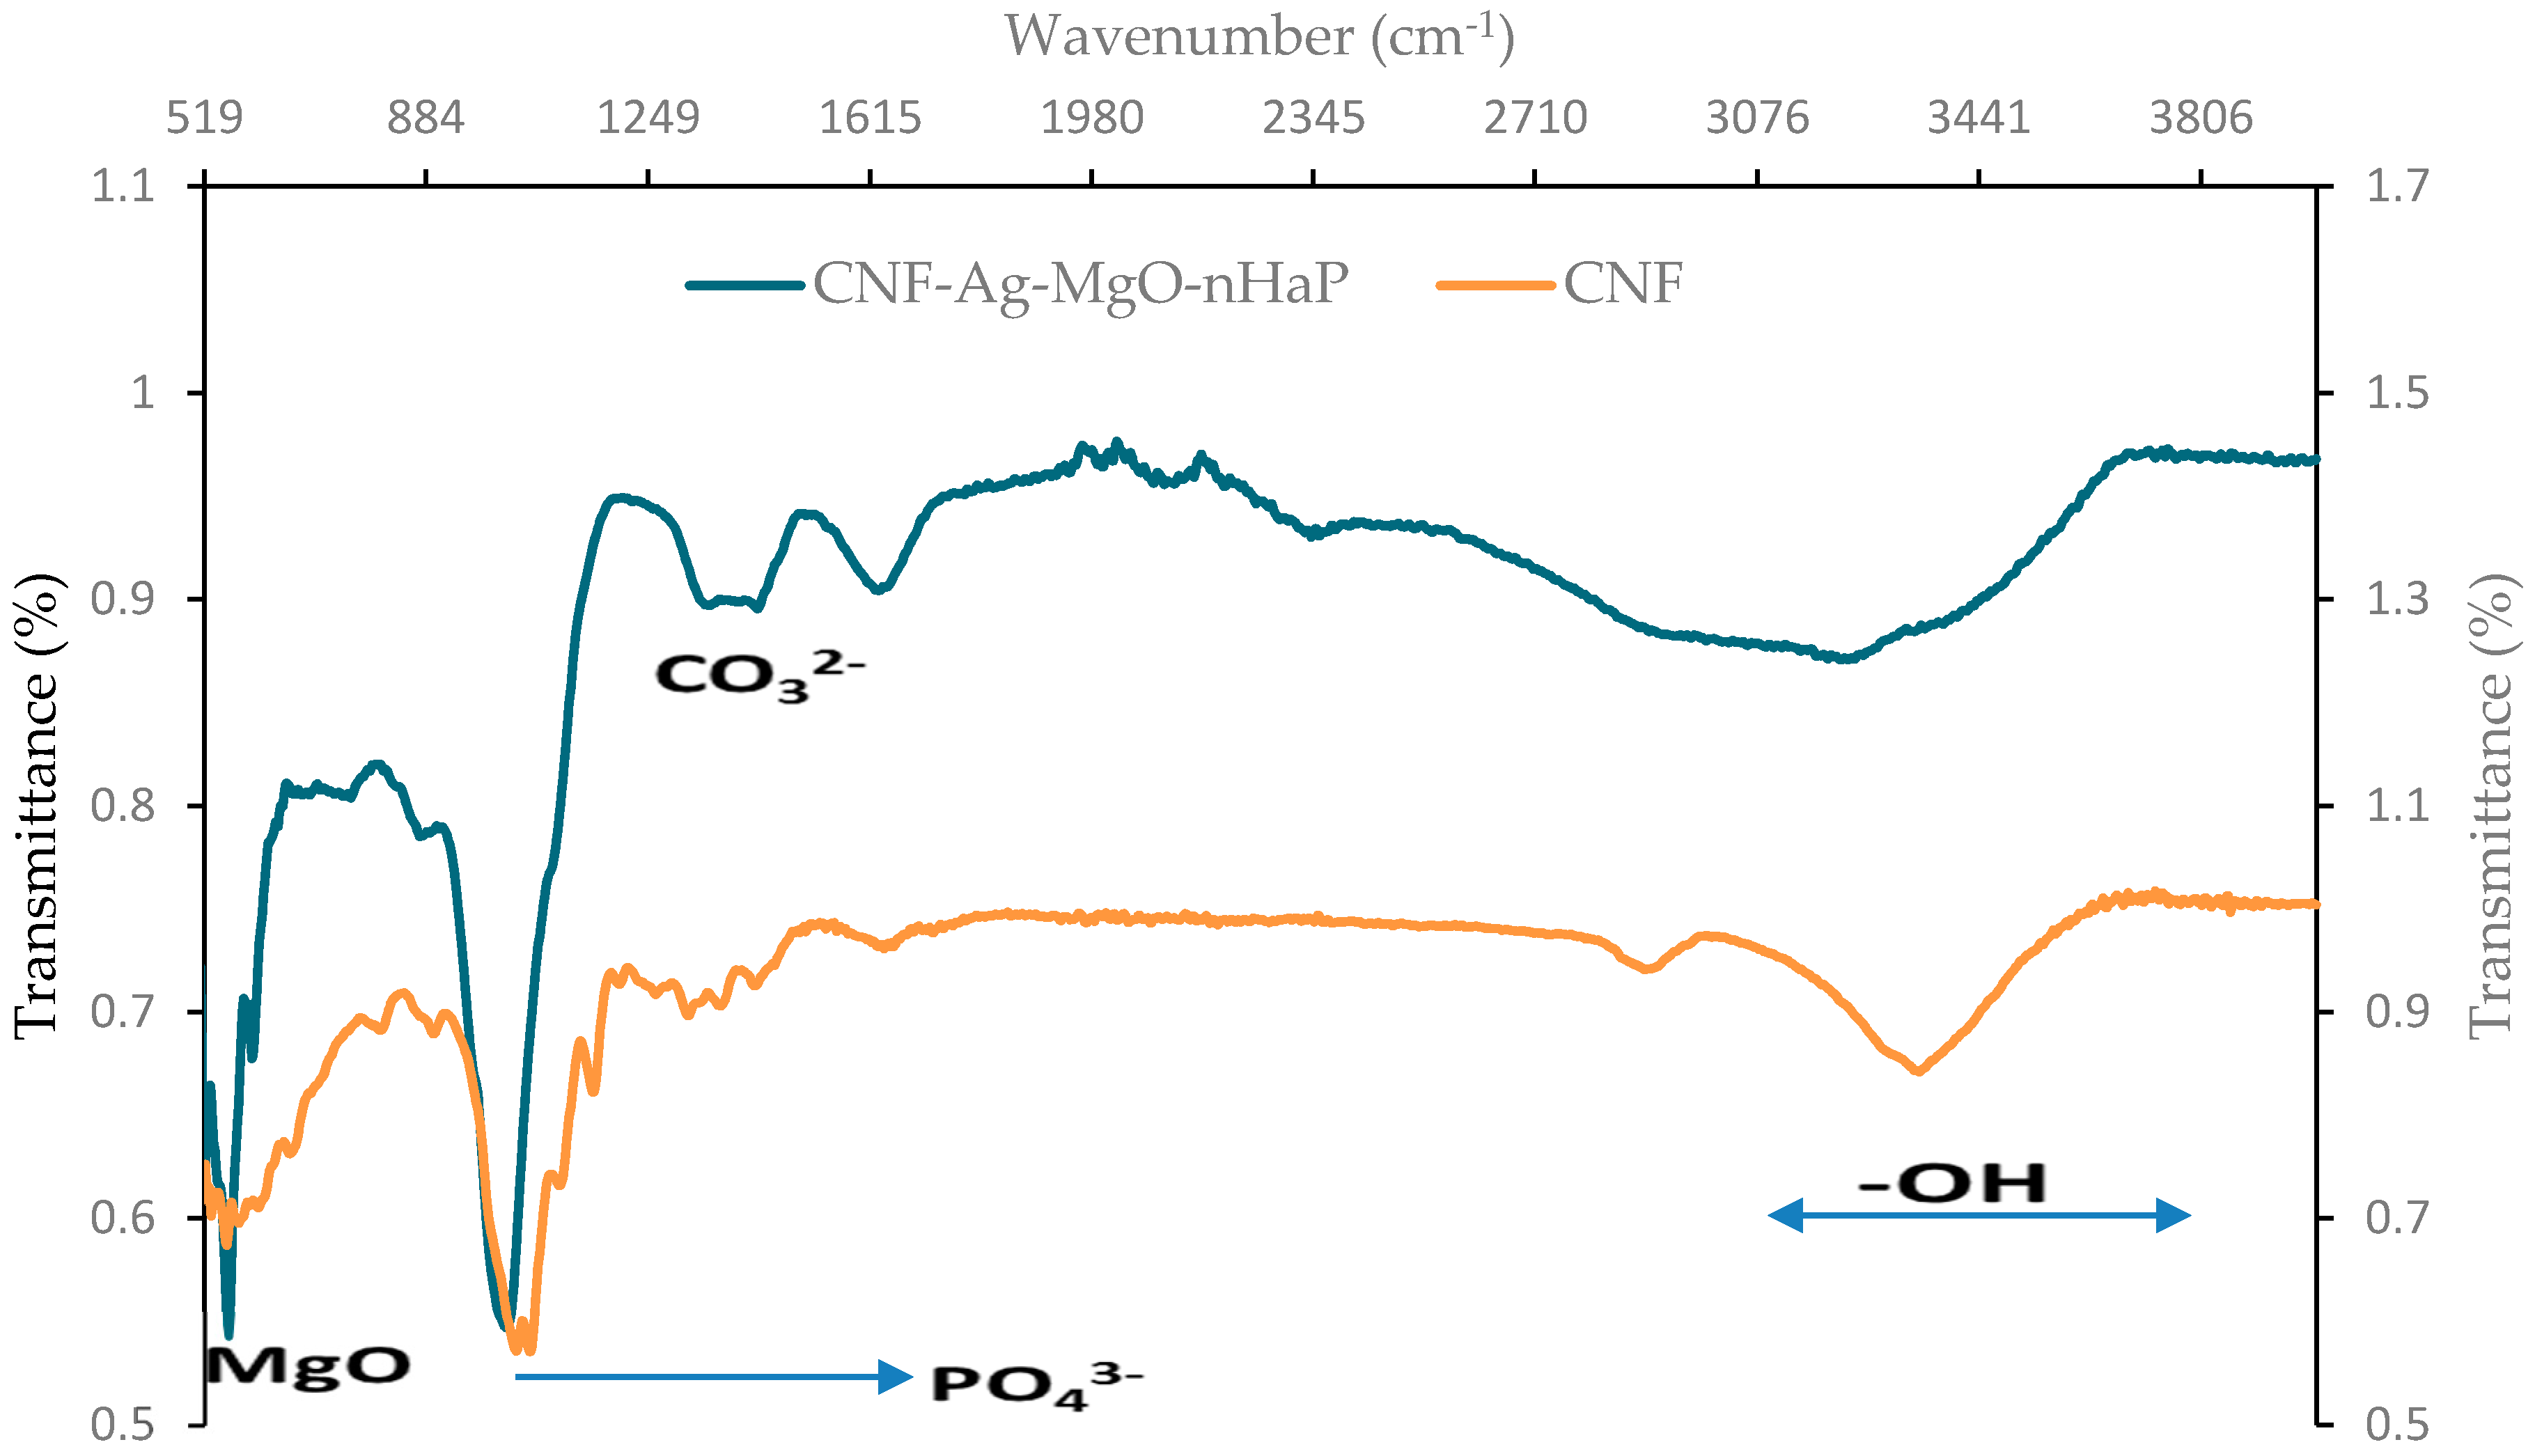
3.2.3. FTIR Spectroscopy

Figure 3 shows the transition and bond formation between the cellulose nanofiber from the source (sawdust) and the CNF-AgMgOnHaP matrices. The major characteristic functional group peaks observed in the CNF are found at 3343, 2904, 1640, 1425–1433, 1320–1335, 1162, 1054–1052, and 895–585 cm−1, while the spectrum of the CNF-AgMgOnHaP composite showed adsorption bands at 3229, 1634, 1432–1353, 1017, 893, 595, and 558 cm−1. In both spectrums, the presence of strong stretching vibration derived from the -OH group is seen at 3343 cm−1 at the CNF, which became broader and shifted to the lower range of 3230–3229 cm−1 in the CNF-AgMgOnHaP composite. The broadness of the band in the composite may be attributed to the contribution of OH groups in the matrix through the oxidation of the cellulose in the bioreduction of the impregnated nanoparticles across the composite [42]. The bands at 2904, 1320–1335, and 1140–1117 cm−1 represent C-H symmetrical stretching, CH2 wagging vibration, an in the plane -CH bending mode, and stretching vibration from C-O and C-O-C groups, respectively, characteristics of natural fiber [43]. Characteristic peaks at around 1436–1450, 1032–1020, 912–656, 598–474 cm−1 assigned to a vibrational mode of CO32−, the asymmetric phosphate group, PO43− stretching and bending modes, and Mg-O-Mg deformation of the Mg-O absorption, respectively, featured in the CNF-AgMgOnHaP composite spectra [44,45,46]. Therefore, the result obtained from the FTIR spectrometry suggests the presence of nanohydroxyapatite (nHaP) and MgO species impregnation within the CNF matrix, with a considerable amplification in intensities.

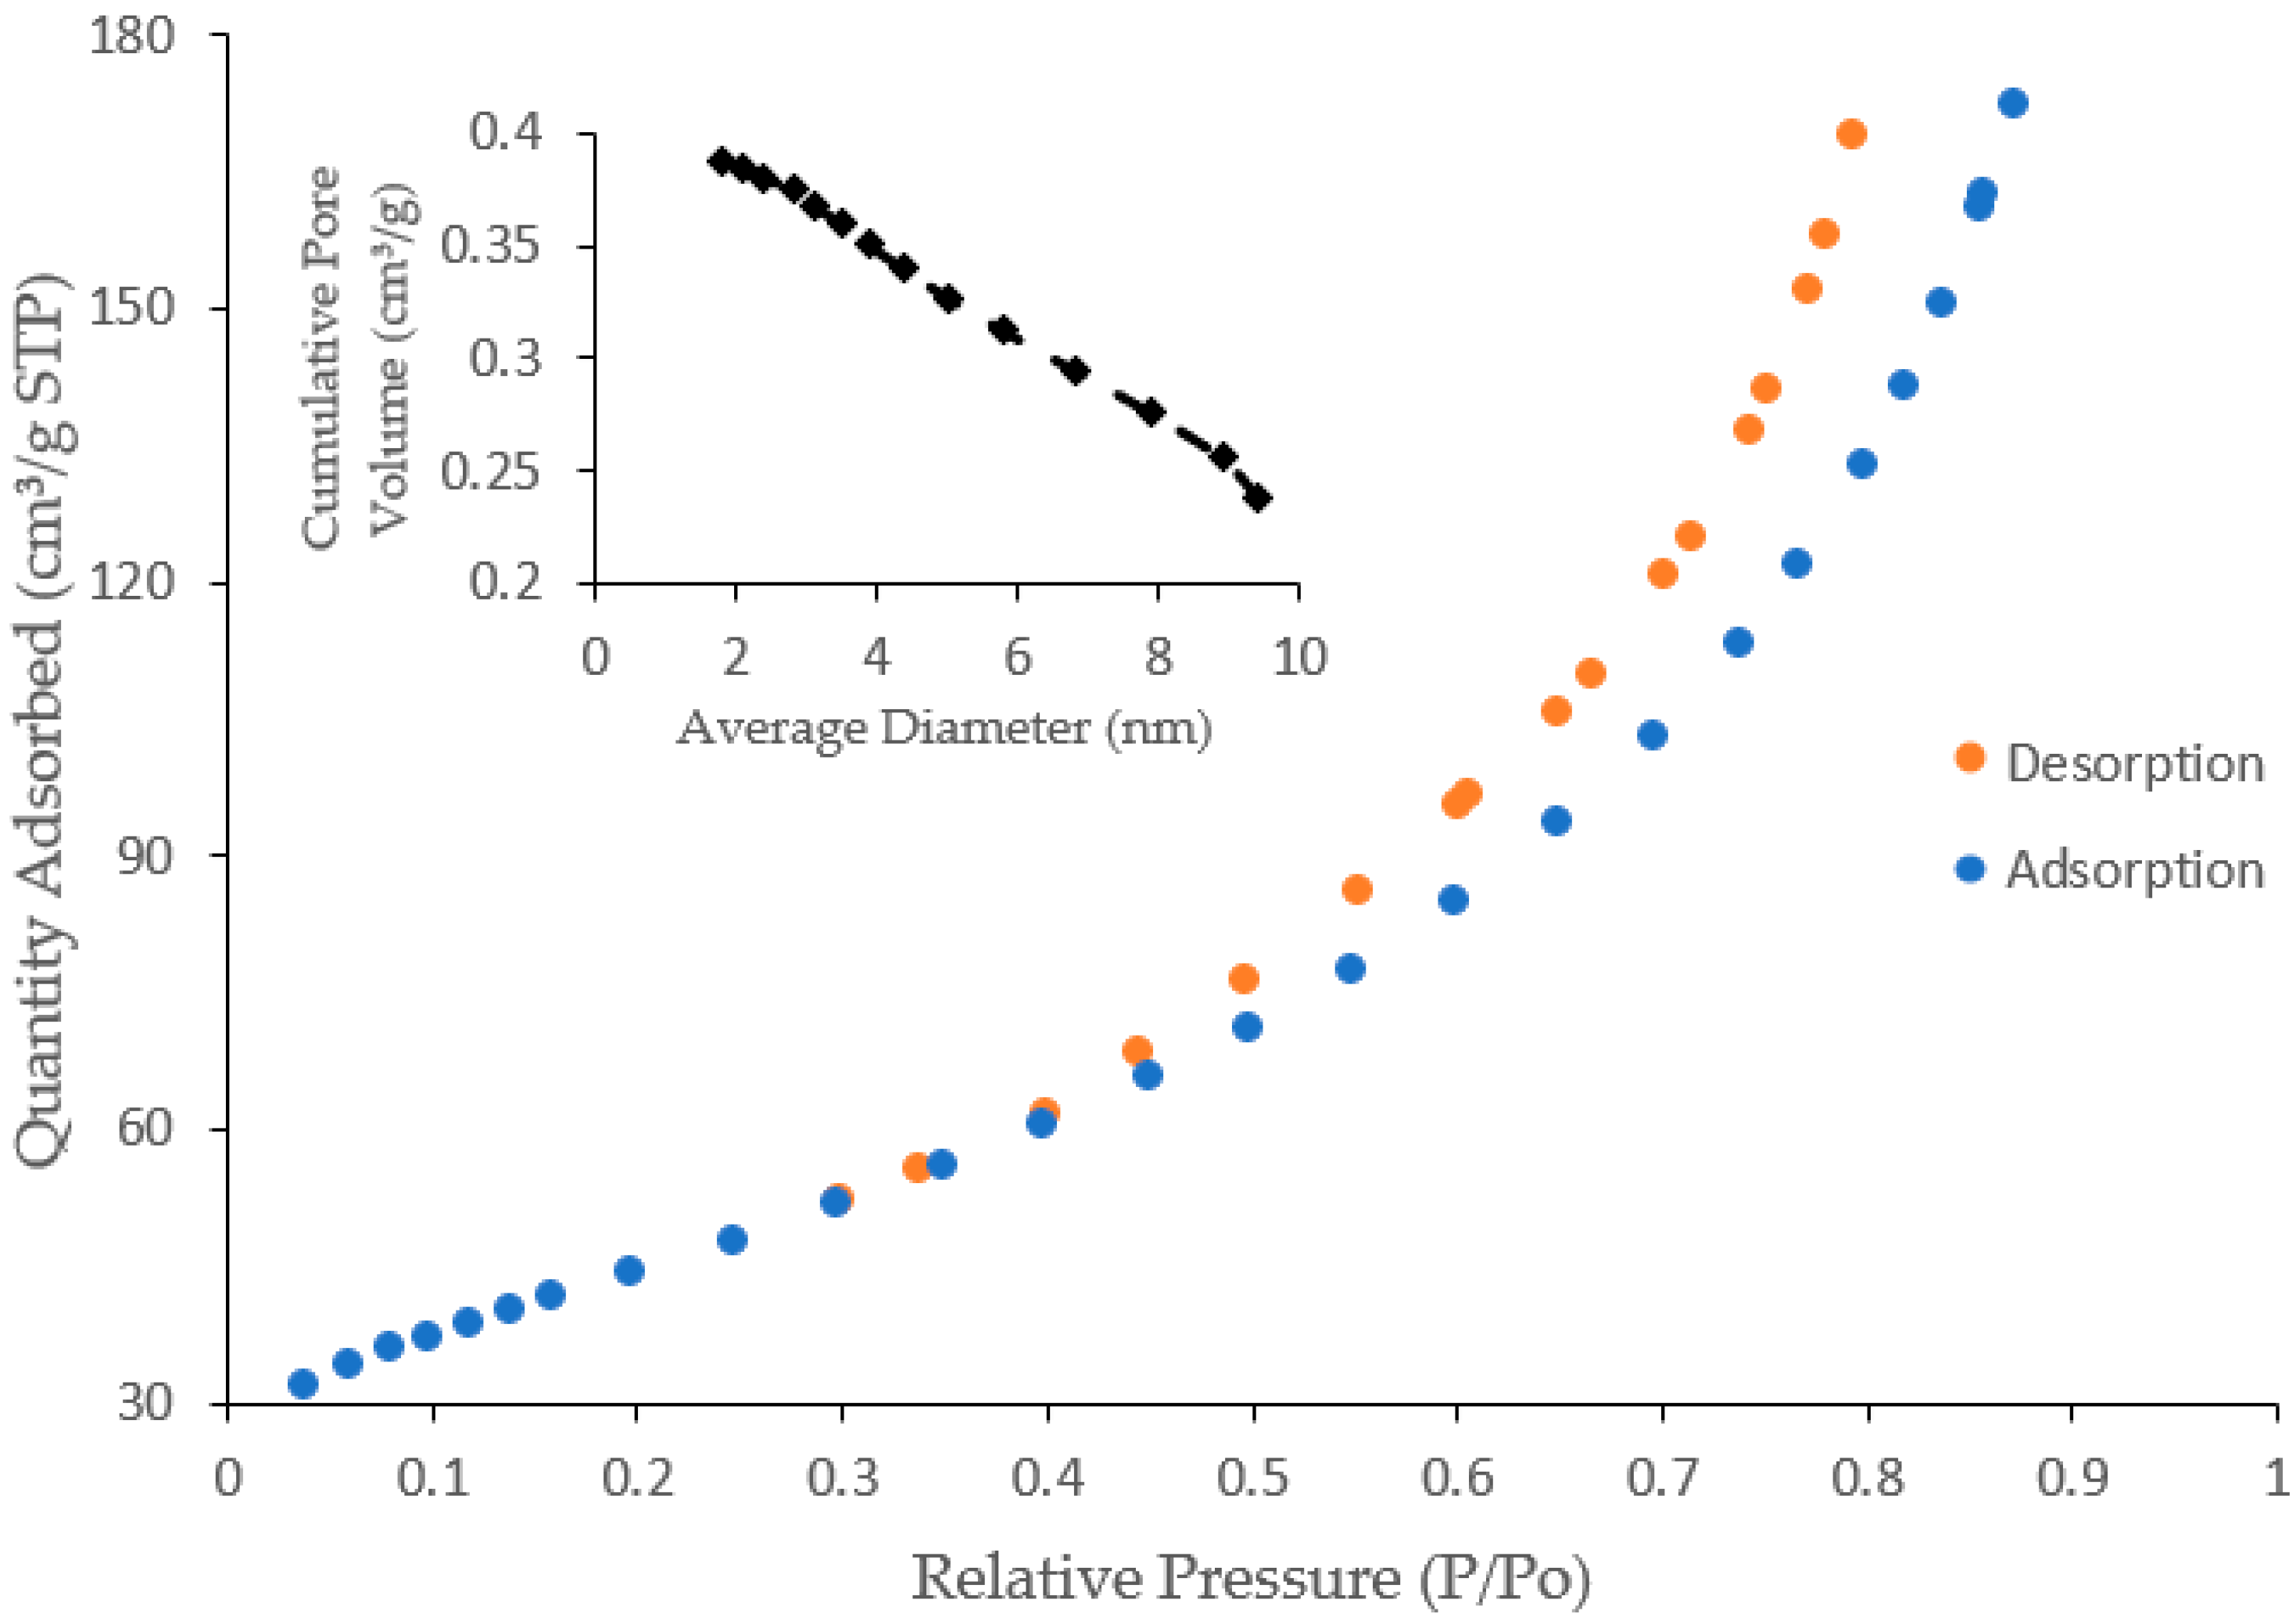
3.2.4. Specific Surface Area by Brunauer–Emmett–Teller (BET)
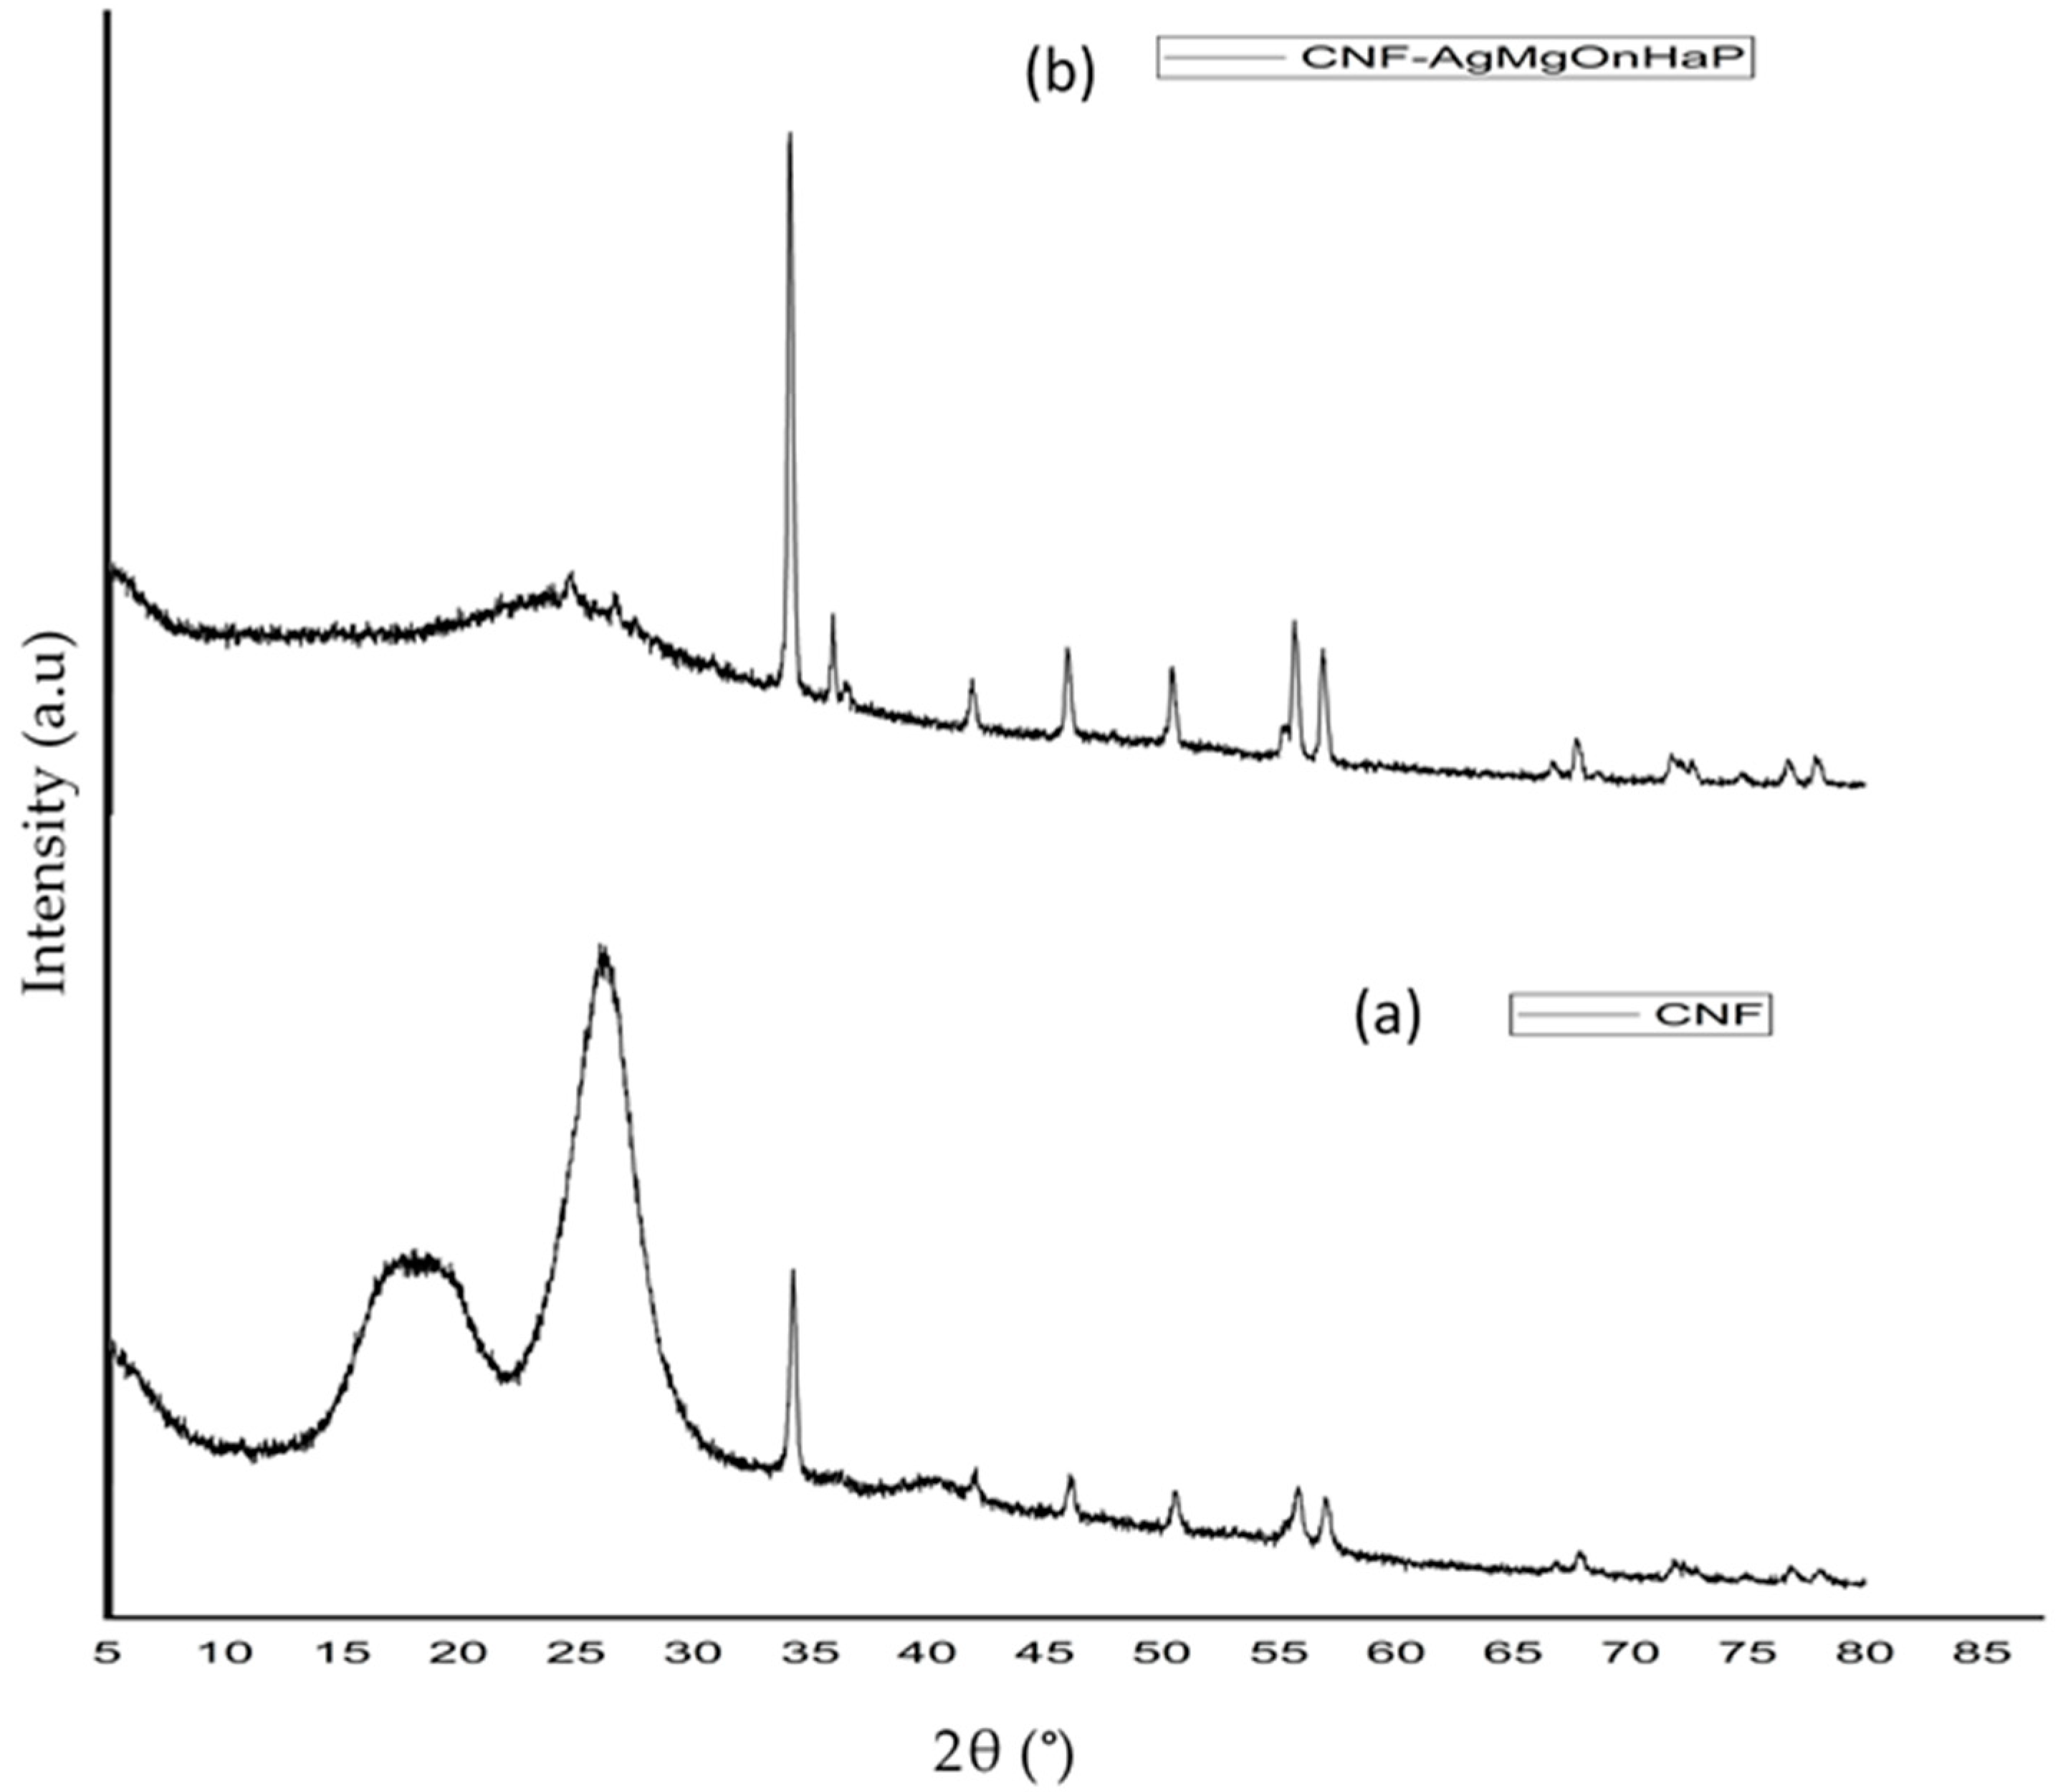
The specific surface area of the CNF-AgMgOnHaP adsorbent was examined through the BET nitrogen adsorption–desorption measurements at an ambient temperature of 22 °C and the results tabulated in Figure 4 and Table 2, respectively. As shown in Figure 4, the composite isotherms followed Type I classification. However, the composite average pore width was found to be 9.5541 nm, demonstrating the characteristics of micro-mesoporous materials [47]. The CNF-AgMgOnHaP is characterized by a BET surface area of 160.17 m2/g with a micropore and mesopore area of 5.46 m2/g and 196.12 m2/g, respectively. The increase in the surface area of CNF-AgMgOnHaP composite is attributed to an increase in the availability of many binding functional groups within the matrix, as compared to the specific surface area of soft cellulose pulp (1 and 4 m2/g) [48,49]; apatite materials (36.00 m2/g; 69.68 m2/g) [50,51]; as well as silver and MgO nanoparticles, respectively (56.9 m2/g and 114.03 m2/g) [52,53].

3.2.5. XRD Analysis

Figure 5 displays the XRD patterns between the extracted CNF from sawdust and the CNF-AgMgOnHaP composite. The XRD of the extracted CNF (Figure 5a) depicts intensive XRD diffractograms 2θ peaks at ∼16, ~22.9 (200 planes), and ~34°, which are related to a typical peak pattern structure of the native cellulose I structure (ICDD: PDF database 1999 no: 00-003-0289) [54,55] However, a change in the structural orientation was observed in the CNF-AgMgOnHaP composite diffractogram (Figure 5b). The crystalline phases and intensities observed in the adsorbent XRD spectrum (b) illustrate the presence of different components in the composite compared to that of the CNF (spectrum a). The diffraction peaks at 16.89 (010), 26.33 (210), 32.15 (211), 39.7 (111), 44.4° (200), 46.65, and 49.89° (213) in 2θ revealed the presence of hexagonal carbonate-hydroxyapatite (entry no: 96-9003-551) [56]; triclinic crystal system of silver attached to the phosphate groups (entry no: 96-100-8002) [57]. Characteristic crystal structure peaks for monoclinic Mg within the apatite phase at the 2θ value of 19.36 (100), 31.52 (020), and 53.49° (031) (entry no: 96-231-0425) [58] were also identified (Figure 5b). The typically defined cellulose peaks were also visible in the patterns of the composites. These results suggest that the difference observed in the surface crystallinity between these materials arises because of the impregnated nanoparticles on the CNF polymer matrix morphology.

4. Batch Fluoride Adsorption Experimental Results

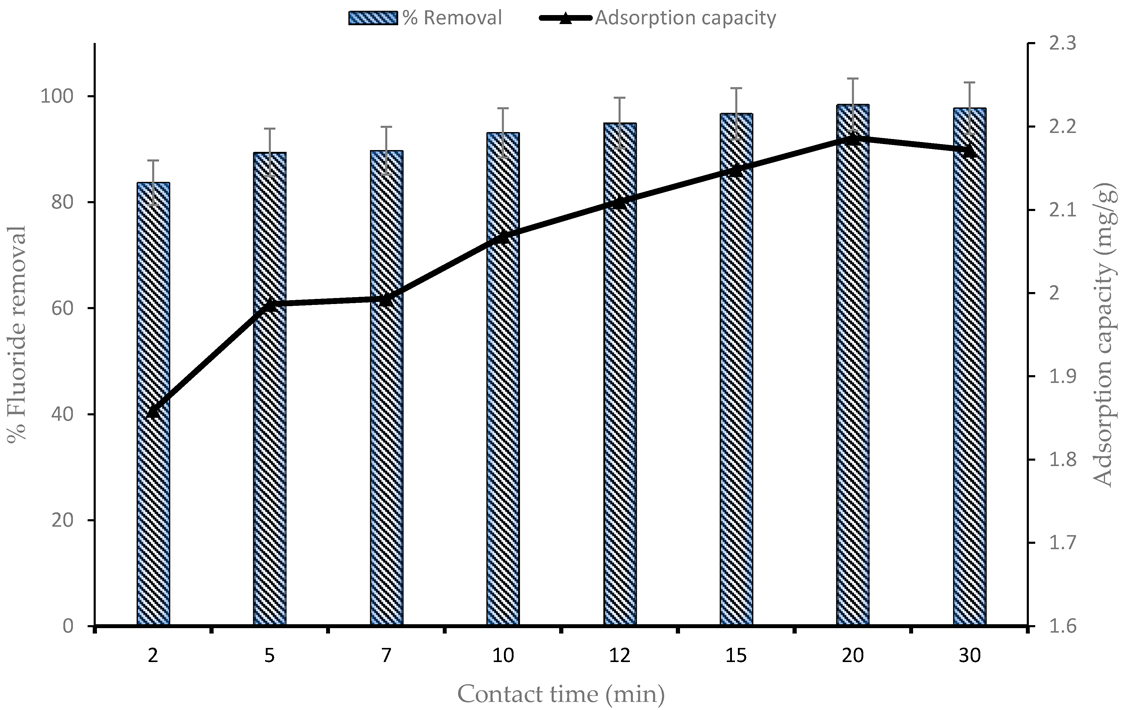
4.1. Effect of Contact Time

The F uptake using the CNF-AgMgOnHaP adsorbent was investigated as a function of contact time, between 0–30 min, using a 0.225 g adsorbent dose per 50 mL of 10 mg/L initial fluoride concentration (Figure 6). The fluoride sorption process increased sharply as the time increased, within the first 10 min of contact time with about 93% of F removal. Subsequently, the adsorption rate became slower with increasing contact time (10–20 min), with no appreciable difference in the percent fluoride removal until complete saturation was achieved. Thus, a contact time of 10 min was chosen as the optimum time for fluoride sorption by the CNF-AgMgOnHaP. The rate of fluoride removal within the rapid equilibration time was due to the presence of free and abundant binding sites across the adsorbent surface. This rapid interaction at the earlier stage suggests the presence and availability of a high amount of hydroxyl groups (supported by FTIR (Figure 3)) within the composite, which leads to high F sorption because of the easy exchange of the fluoride ions with the CNF-AgMgOnHaP surface hydroxyl groups. Furthermore, the improved surface area and wider pore dimensions also accelerated the high fluoride sorption accessibility to the binding sites on the adsorbent surface.

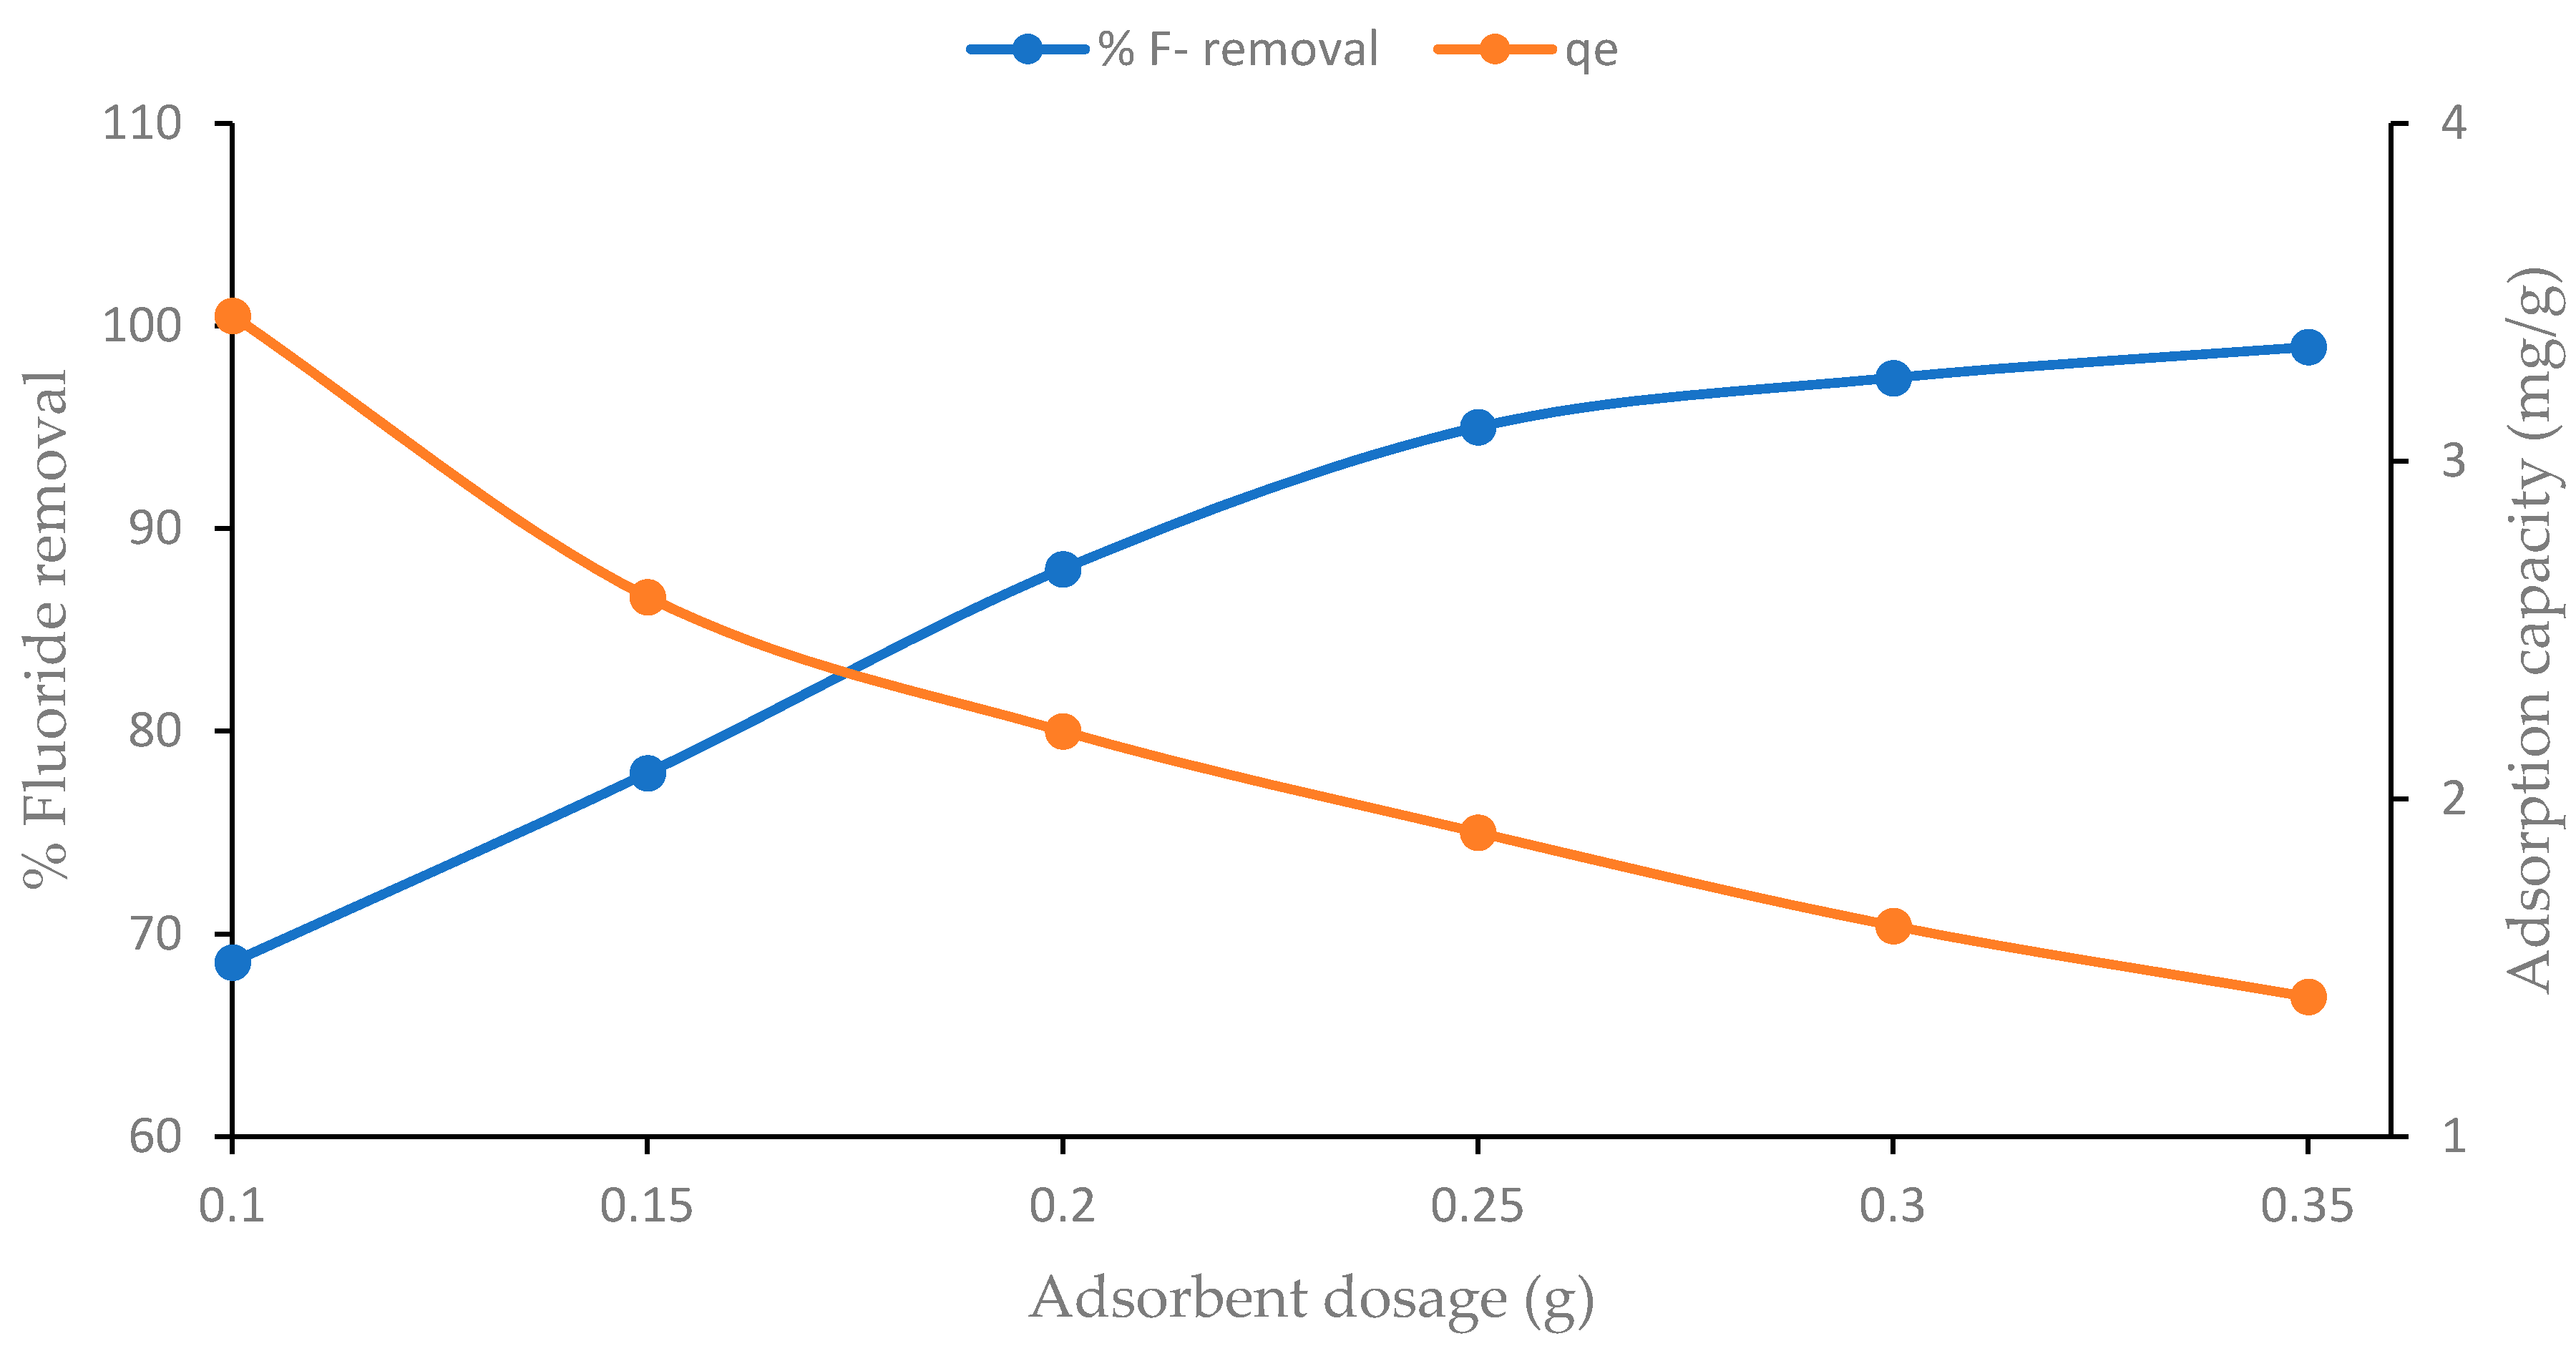
4.2. Effect of Sorbent Dosage

The adsorption efficiency of the F ion by the CNF-AgMgOnHaP dosage was investigated and the result is shown in Figure 7. The F removal efficiency increases with an increase in adsorbent dosage (0.1 to 0.35 g) attaining a constant optimum removal at 0.35 g. This may be attributed to the fact that increasing the dose of CNF-AgMgOnHaP creates more vacant available surface binding sites favoring the fluoride sorption. In addition, the increased structural surface area and porosity of the synthesized adsorbent, as confirmed by the BET analysis (Table 2), may have contributed to the high fluoride sorption capacity.

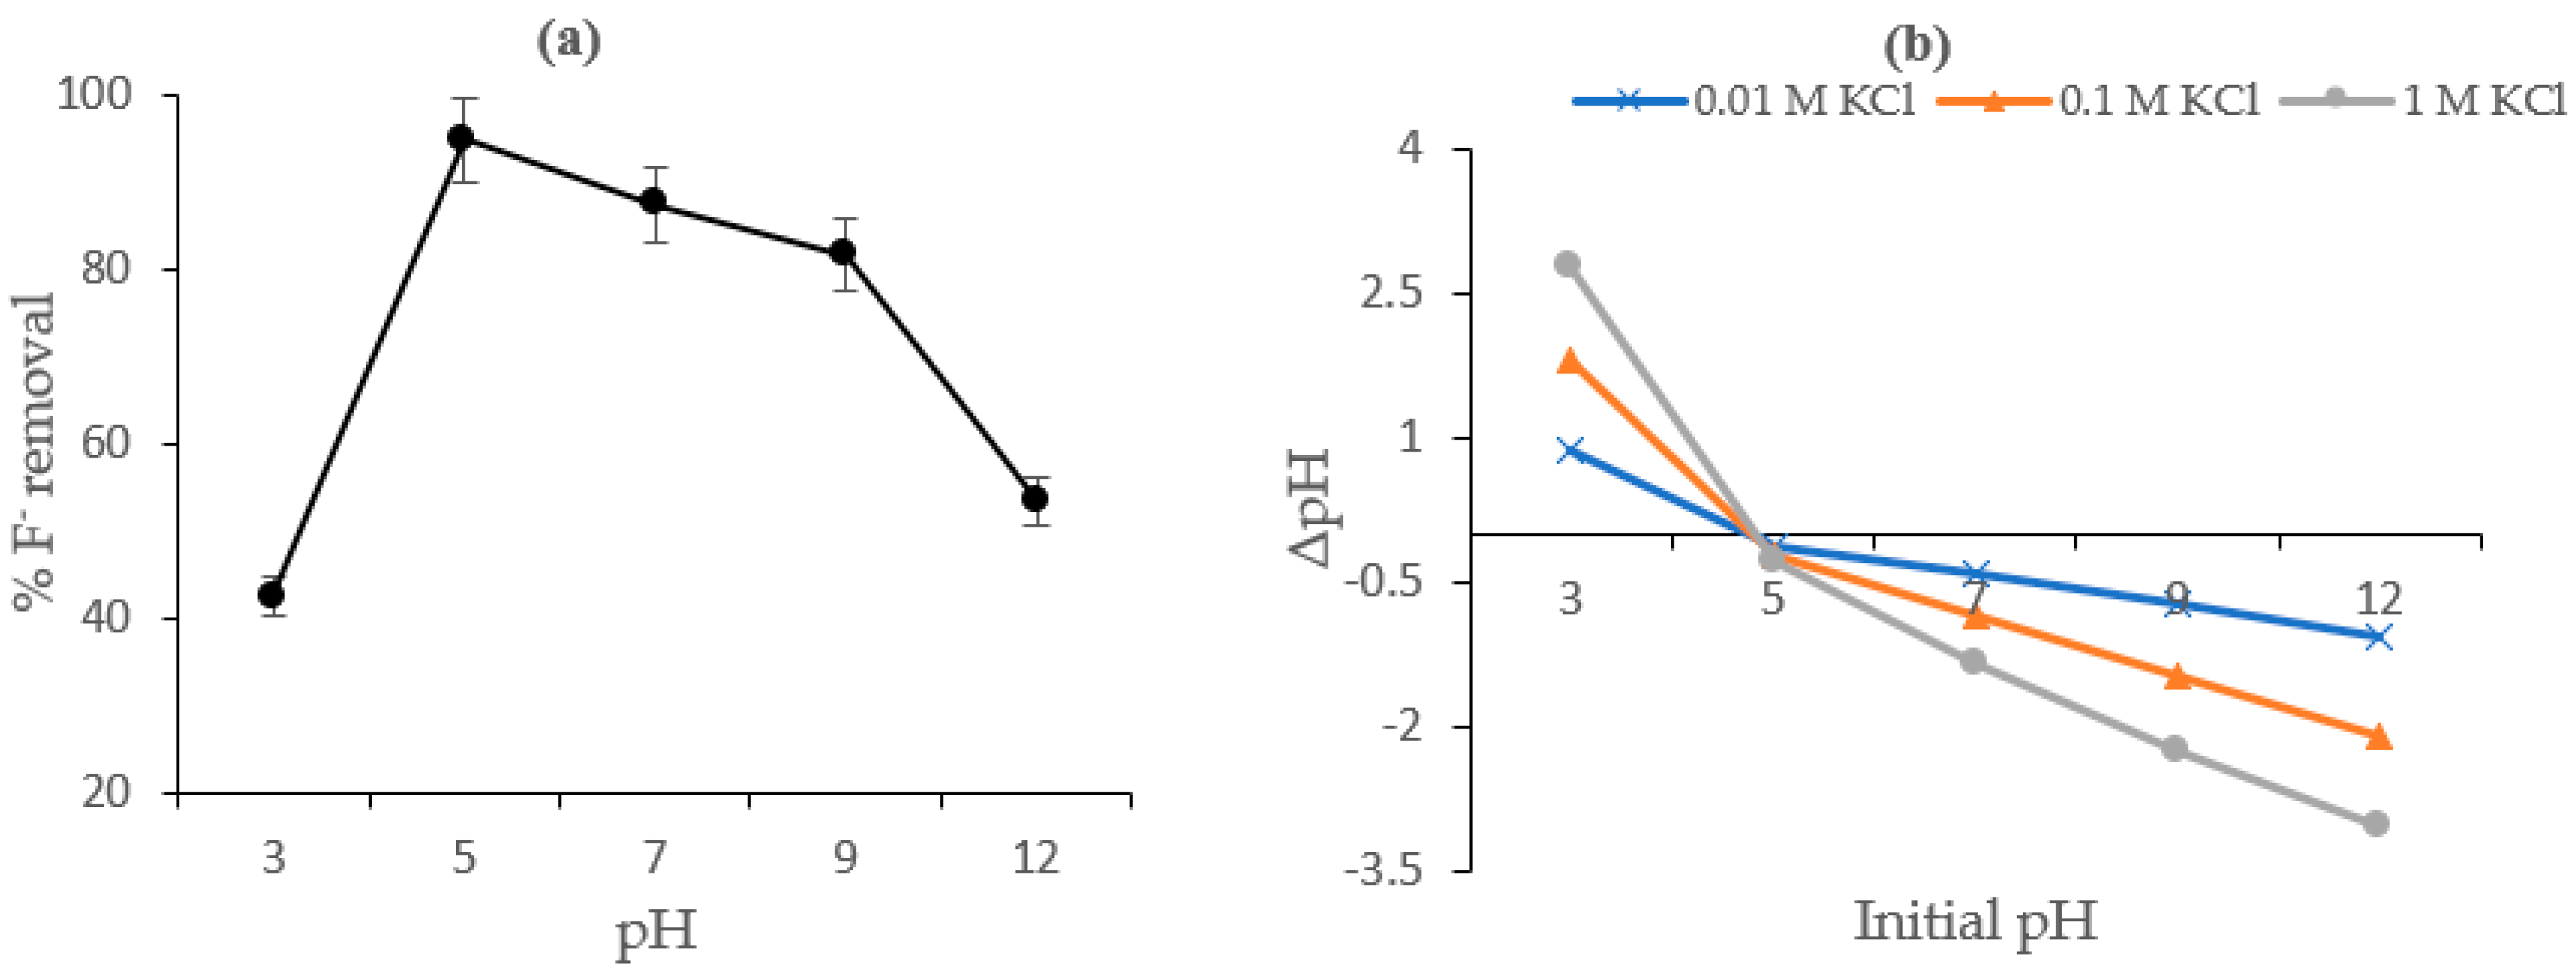
4.3. Effect of pH and Surface Charges on Fluoride Sorption

The effect of initial solution pH (3–12) as it affects the surface charges of the CNF-AgMgOnHaP adsorbent in the removal of fluoride is shown in Figure 8a,b. It is clear from the plot (Figure 8a) that fluoride sorption capacity by the adsorbent was pH dependent and the maximum sorption percentage was observed at pH 5. Thereafter, the rate of removal dropped from 87% at pH 7 to 82% at pH 9, with significant adsorption reduction after pH 9, to pH 12 at 54%. This variation might be attributed to the changes within the solution pH environment which ultimately changes the surface charge and the protonation/deprotonation of the binding functional groups across the CNF-AgMgOnHaP adsorbent, as well as the solubility of fluoride ion species during the process [58,59]. The surface charges distributions of the CNF-AgMgOnHaP adsorbent in fluoride sorption at different initial solution pH values (3–12) were also evaluated by its point of zero charge (pHpzc). The pHpzc is defined as that pH value at which the net surface charge density of an adsorbent is zero [60]. As shown in Figure 8b, the pHpzc value of the CNF-AgMgOnHaP was at ~4.7, which is lower than the optimum pH value of 5. Consequently, the surface of the sorbent becomes negatively charged in the solutions at which the equilibrium pH was greater than pHpzc.
This means that there are abundant negative charges on the surface of CNF-AgMgOnHaP at pH > 4.7 which interact and replace the fluoride ions in solution. One of the main contributing surface groups for a high adsorption of F by the adsorbent is the availability of -OH groups in the cellulose and hydroxyapatite (recognized by FTIR in Section 3.2.3). It is known that both F and -OH are structurally isoelectronic, having a comparable ionic radius, and can easily replace one another through ligand exchange, which ultimately favors F anions’ removal with consequent high sorption capacity and selectivity [3,61]. Besides, the hydrolyzing agent in the isolation of the stabilized cellulose nanofiber, sulfuric acid, reacts with the cellulose surface hydroxyl groups to form sulfate half-esters, which also contributed to the negatively charged surface of the adsorbent, thus, the high adsorption of fluoride by CNF-AgMgOnHaP [62]. Therefore, the interaction between these surface groups and fluoride ions easily facilitates the high fluoride sorption capacity through an ion exchange mechanism, the formation of an ion pair, or through H bonding with the negatively charged surface. A similar pattern of surface exchange mechanisms of fluoride removal was reported elsewhere [63,64].

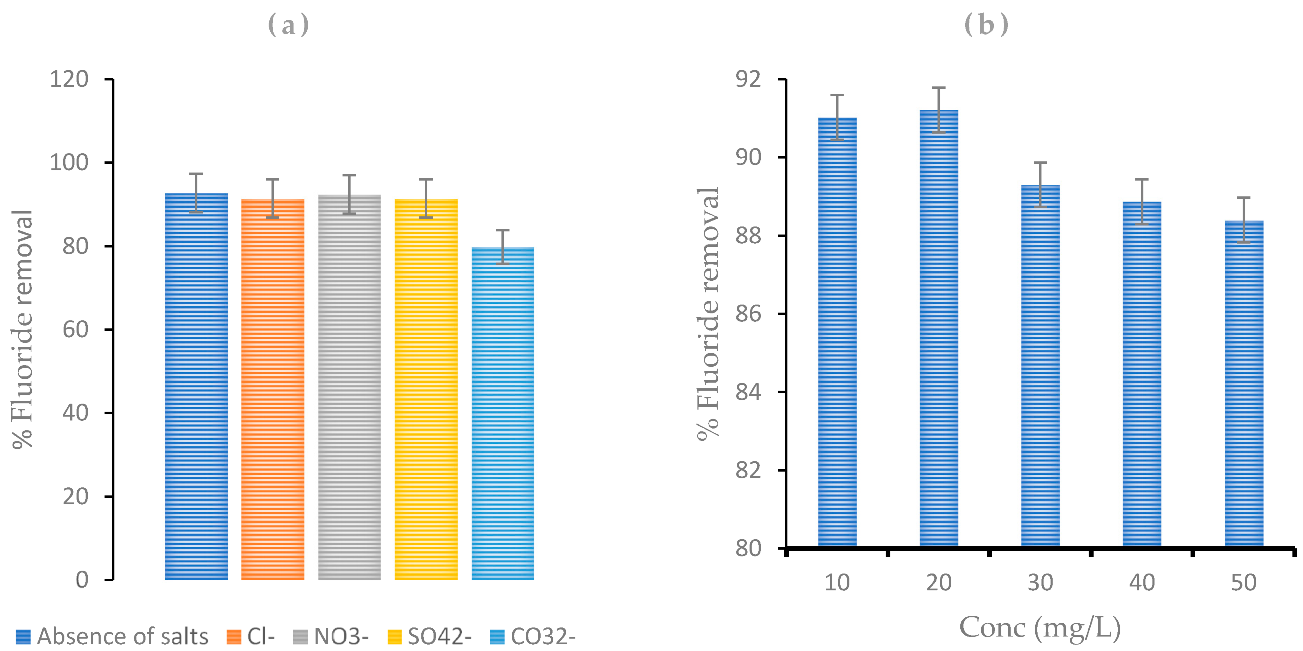
4.4. Effect of Coexisting Ions

The possible interference of coexisting ions (such as Cl, NO3, CO32−, and SO42−), along with fluoride for the active sorption sites in the sorbent material, was examined, and the results are presented in Figure 9a,b. Figure 9a illustrates the variation in F removal efficiency by the adsorbent with the existence of co anions in water. The result showed that the presence of anions such as Cl, NO3, and SO42− had a slight effect on fluoride sorption by CNF-AgMgOnHaP, with NO3 interfering the least when compared with the anion free water. However, the competitiveness of CO32− appeared to have a significant effect in the F uptake for surface binding sites, leading to a reduction in % fluoride removal from ~93% to ~80%. In addition, the effect of co anion composite concentrations (10–50 mg/L), as a function of percentage fluoride removal by the CNF-AgMgOnHaP composite, is depicted in Figure 9b. Evidently, from the plot (Figure 9b), at higher composite anion concentrations, the potential affinity for fluoride by the sorbent reduces. This may be because of the strong hydrolysis contribution by stable CO32− ions surface complex formation, which hinders fluoride ions being sorbed by the CNF-AgMgOnHaP composite.

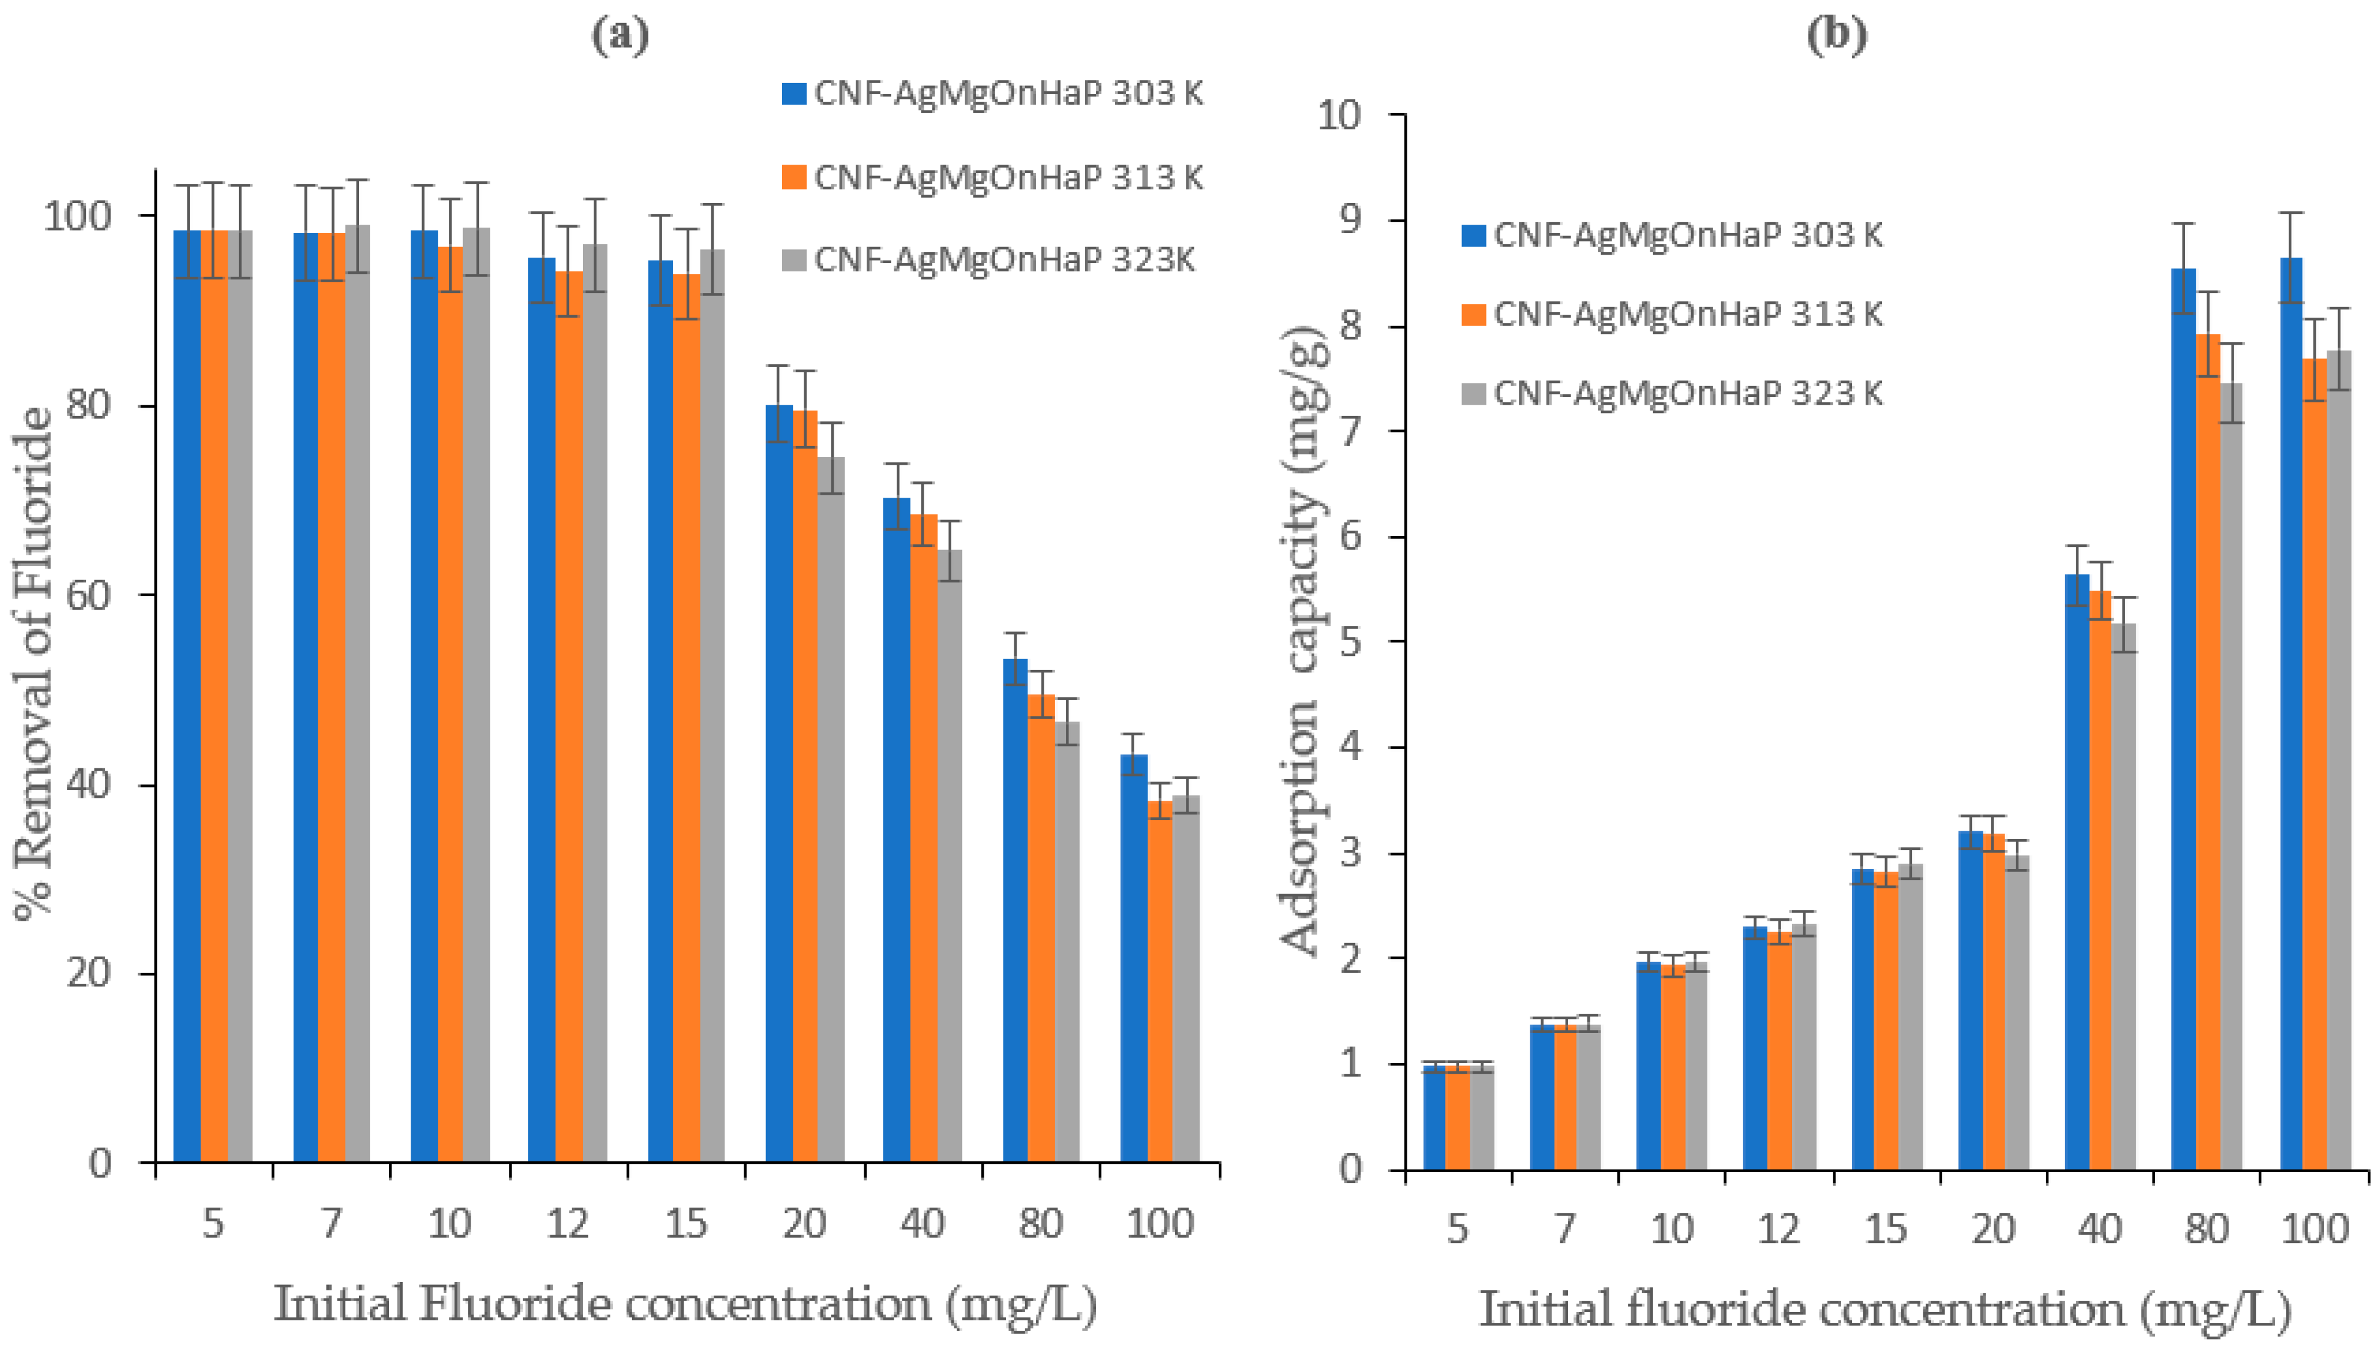
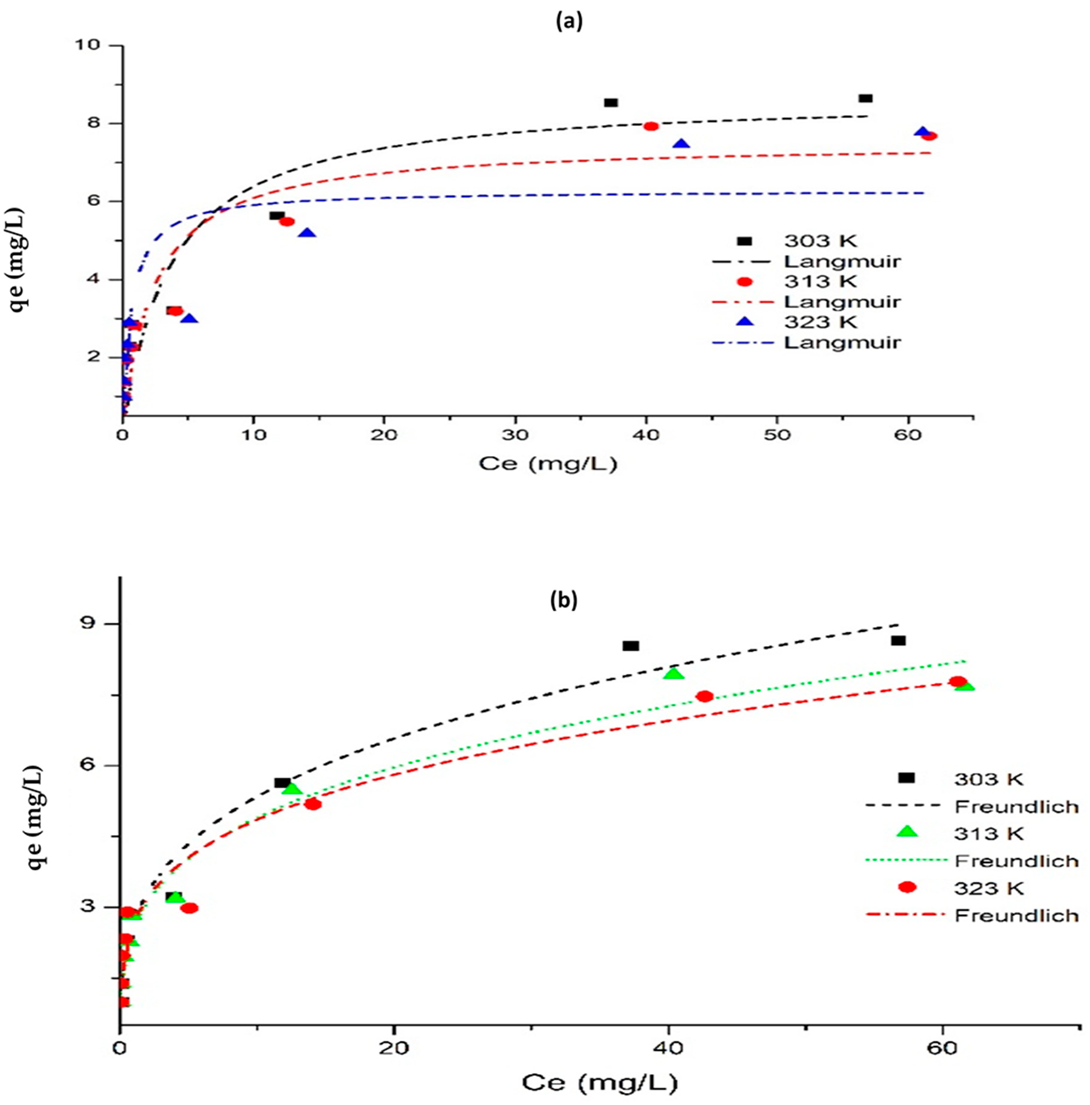
4.5. Effect of Initial Concentration and Adsorption Isotherm

The rate of fluoride uptake by the CNF-AgMgOnHaP composite as a function of initial fluoride concentrations (5–100 mg/L) at different temperatures (303, 313, and 323 K) are shown in Figure 10a,b. As depicted in Figure 10a, the % F removal is found to decrease with increasing initial adsorbate concentration. This may be due to the reduction in active binding sites on the CNF-AgMgOnHaP adsorbent surface leading to its saturation by the sorbed fluoride ion. Furthermore, in contrast to Figure 10a, the F sorption capacity increased gradually as the fluoride concentration increased from 5 to 100 mg/L (Figure 10b). This suggests that, as the concentration increases, the driving force for overcoming the mass transfer resistance between the adsorbate in solution and adsorbent phases increases in the liquid–solid adsorption system [64].
To determine the adsorption interaction and mechanism of the F ions on the CNF-AgMgOnHaP composite surface, the nonlinear forms of Langmuir [65,66] (Equations (3) and (5)), as well as the linear form of Dubinin–Radushkevich [67] (Equations (6)–(9)) isotherm models were used to evaluate the adsorption process.
These equations were used to simply calculate the adsorption parameters because of the usefulness of their model parameters, their clarity, and easy interpretability, as well as to reduce their respective error functions [57,68].
The nonlinear forms of the Langmuir adsorption isotherm model [69] assume a monolayer of F sorption onto the surface of CNF-AgMgOnHaP containing a finite number of uniform adsorption binding sites without the migration of adsorbed molecules on the surface at a fixed temperature, and is given as:
q e = Q m K L C e 1 + K L C e
where Qm (mg/g) is the maximum adsorption capacity, which assumes the complete monolayer of an adsorbent, Ce (mg/L) is the adsorbate equilibrium concentration, q e (mg/g) is the amount of F ion adsorbed at equilibrium, and KL (L/mg) is the Langmuir adsorption equilibrium constant.
The fundamental characteristics of the Langmuir isotherm model can also be calculated in terms of a dimensionless parameter called the separation factor, RL [68] (Equation (4)), denoted as:
R L = 1 1 + k L C i
where Ci (mg/L) is the initial fluoride concentration and KL is the Langmuir equilibrium constant. The RL value is useful in determining if a sorption process is irreversible (RL = 0), linear (RL = l), favorable (0 < RL< 1), or unfavorable (RL > l).
The Freundlich adsorption isotherm [66], which is an empirical model describing the surface heterogeneity of the CNF-AgMgOnHaP sorbent through a multilayer adsorption system, was also applied. It is expressed below as:
q e = K F C e 1 n
where q e (mg/g) is the equilibrium adsorption capacity of the CNF-AgMgOnHaP adsorbent, Ce (mg/L) is the equilibrium concentration, and KF [(mg/g)/(mg/L)n] and 1/n are empirical Freundlich constants describing sorption capacity and intensity parameter, respectively. KF characterizes the strength of adsorption, while n indicates the magnitude of the adsorption driving force or the surface heterogeneity [67]. The adsorption isotherm is favorable when 0 < 1/n < 1, unfavorable when 1/n > 1, and irreversible when 1/n = 1.
The equilibrium adsorption results were also fitted into the linearized form of the Dubinin Radushkevich isotherm model [68], which accounts for the effects of the porous nature of the CNF-AgMgOnHaP adsorbent and the mean free energy (E) of the sorption process. The D-R equations are shown below.
q e = q m a x   e x p ( β D ε 2 )
ε = R T   l n [ 1 + 1 C e ]
The energy E (kJ/mol) of F sorption from Dubinin–Radushkevich is
E = 1 2 β D
The general linearized form of the D-R is in Equation (9):
l n   q e = l n   q m a x β D ε 2
where q m a x (mg/g) is the CNF-AgMgOnHaP adsorption capacity; β D (mol2/kJ2) is the activity coefficient constant related to mean sorption energy; ε is the Polanyi potential; and E (kJ/mol) is the mean adsorption energy. The slope of the plot of ln q e against ε2 gives β D and the intercept gives the adsorption capacity q m a x of CNF-AgMgOnHaP. If the magnitude of E is between 8 and 16 kJ/mol, the adsorption process occurred via chemisorption, while for values where E < 8 kJ/mol, the adsorption process is physisorption.
Figure 11 and Table 3 show the adsorption isotherms plots with the corresponding calculated parameters of the sorbed F on CNF-AgMgOnHaP composite at different temperatures.
As shown in Table 3, the respective values of Qm and KF from the nonlinear plots decrease as the temperature increases, an indication that the adsorption of F by the CNF AgMgOnHaP composite is unfavorable at higher temperatures. The Langmuir constant (KL) values increase with temperature changes, showing the existence of an electrostatic attraction between the F and the CNF AgMgOnHaP surface [69]. The obtained RL values lying between 0 and 1 also confirm the favorability of the adsorption activity across all the operating temperatures. In addition, since n lies between 1 and 10 as shown in Table 3, the physical adsorption of F onto the adsorbent is demonstrated. It is important to note that the experimental maximum adsorption capacities were observed to be similar to the calculated Langmuir maximum adsorption capacities (Qm) for all the temperatures. In addition, the adsorption energies, E (kJ/mol) values, obtained by the linear D-R model generally increased as the temperature increased (Table 3). These values suggested that the physical adsorption mechanism was involved in the F sorption process. Consequently, based on the higher correlation coefficients (Adj. R2) and lower Chi-square (χ2) values comparison (Table 3), it was found that the fluoride sorption onto the CNF-AgMgOnHaP was best described by the Freundlich isotherm model across all the operating temperatures, compared to other models. This suggested that the dominant adsorption mechanism on the adsorbent surface was through multilayer binding sites.

4.6. Adsorption Kinetic
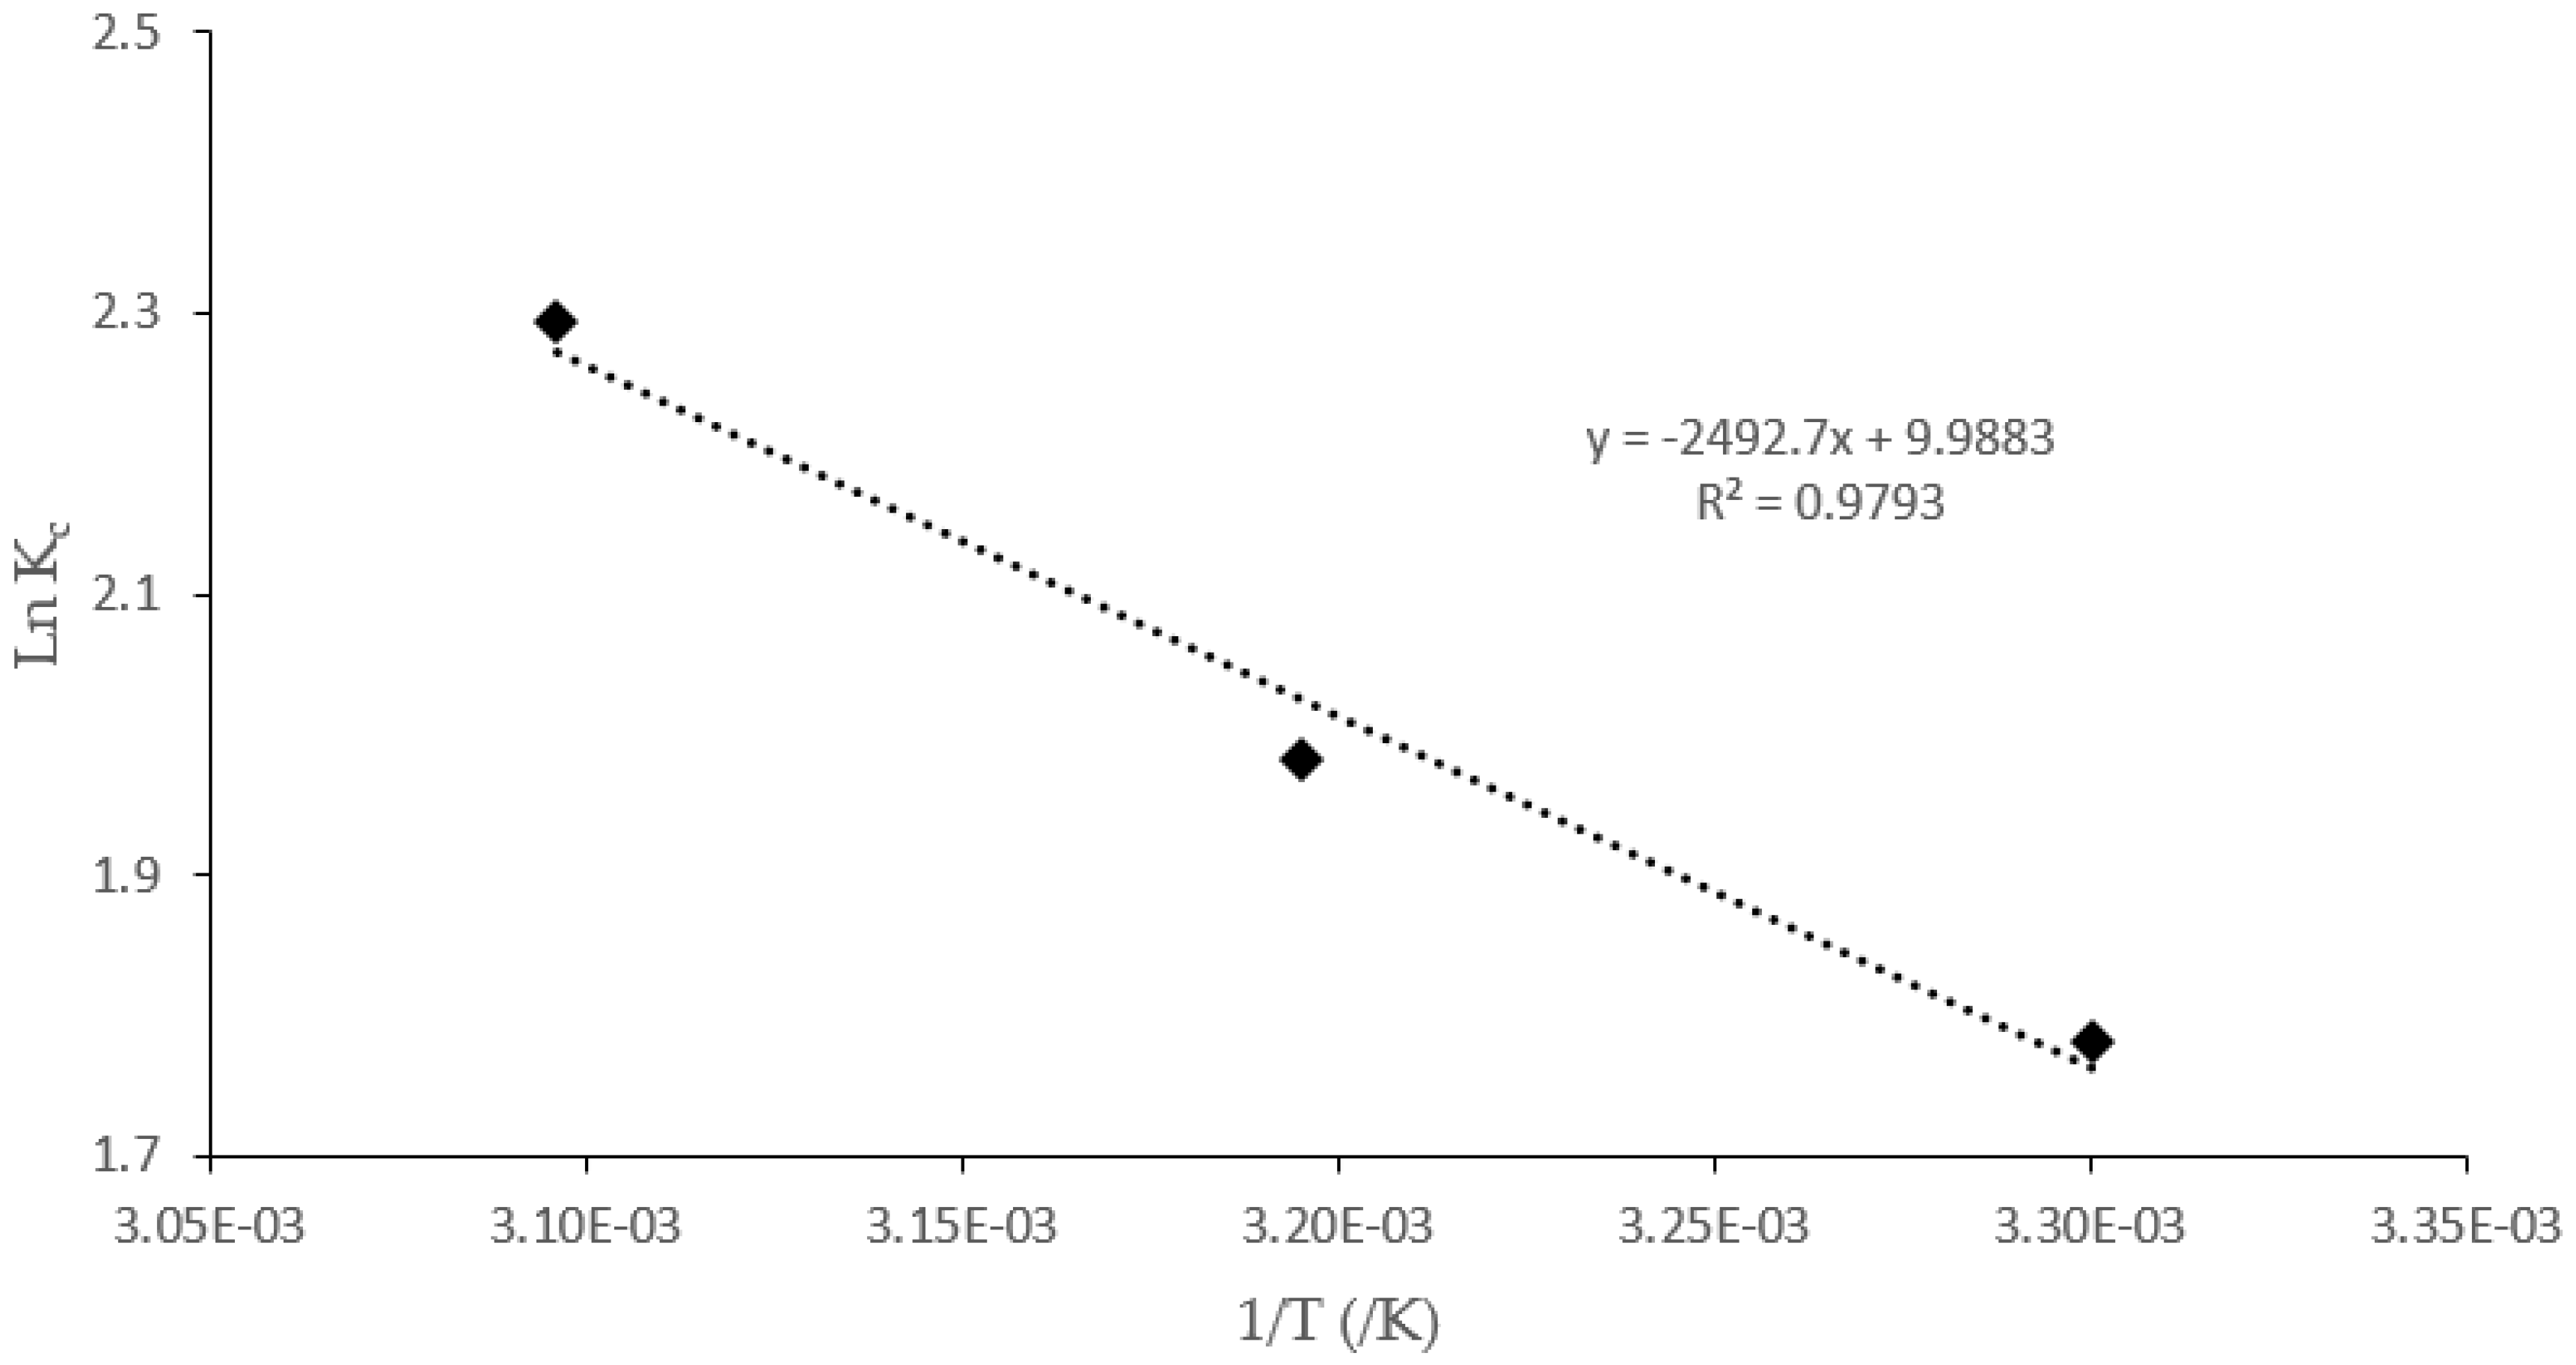
To evaluate the mechanism and time dependence kinetic parameters of F sorption by the CNF-AgMgOnHaP surface, the contact time experimental data (Figure 6) were simulated and fitted to both reaction and diffusion based kinetic models.
The Lagergren [70] pseudo-first-order model can be used for a simple sorption process and its linear equation is stated in Equation (10):
l o g ( q e q t ) =   l o g   q e   K 1 2.303   t
The linearized pseudo-second-order (Equation (11)) model, which is normally used to describe cation exchange and chemisorption reaction mechanisms [71], was also employed and is represented by Equation (11):
t q t = 1 K 2 q e 2 + t q e
The linear form of the intraparticle diffusion model [72] given in Equation (12) was also used to describe the transfer of the solute in the solid/liquid system.
q t   =   k i t 0.5   +   C
where qe and qt are the amounts of adsorbate uptake per mass of CNF-AgMgOnHaP adsorbent (mg/g) at equilibrium and at time t (min), respectively; with K 1 , K 2 and Ki (min−1) representing the rate constant of the pseudo-first-order, pseudo-second-order, and intraparticle diffusion rate constant, respectively.
The normalized standard deviation (S.D. (%)) usually used to describe the applicability of the kinetic model in the fluoride sorption process on the adsorbent was determined using Equation (13).
S   . D .   ( % ) = 100 [ q e e x p q e c a l q e e x p ] 2 N 1
where N is the number of data points, and qe, exp, and qe, cal (mg/g) are the experimental and the calculated equilibrium sorption capacity, respectively.
The calculated corresponding adsorption kinetic parameters from the three different model plots for fluoride sorption are summarized in Table 4. Based on the higher correlation coefficient (R2) and the lowest S.D. and root mean square error (RMSE) values obtained regarding reaction based pathways, the pseudo-second-order model was the most suitable model and best describes the fluoride sorption behavior on the adsorbent surface. This confirmed that the reaction rate was rapid, as observed in Figure 6. This is an indication that the reaction mechanism may have been controlled by chemisorption, which involved the sharing or exchange of ions between the CNF-AgMgOnHaP adsorbent and the sorbed F. This was supported by the XPS (Section 4.8) and pH at various sorbate sorbent pH values (Section 4.3). Equally, the intraparticle diffusion models parameters (Table 4) further showed that the overall kinetic models might not only depend upon the chemical adsorption process but were also governed by an equilibrium diffusion mechanism, through a mass transfer of the adsorbate molecules from the external surface through the pores of the adsorbent [73].

4.7. Thermodynamics

The thermodynamic parameters (Table 5), such as standard enthalpy change (∆), standard free energy (∆), and standard entropy change (∆), were evaluated from the experimental sorption data (303–323 K). These parameters were obtained from the plot of 490 1/T vs. ln Kc (Figure 12) using the following equations (Equations (14)–(17));
Δ G ° = R T   l n   K c
  K c = q e / C e
l n K c = Δ H ° R T + Δ S ° R
Δ G ° = Δ H ° T Δ S °
where R (8.314 J mol−1 K−1) is the gas constant, and T is the absolute temperature (K). The equilibrium constant values, Kc, were obtained by plotting qe/Ce against Ce and extrapolating to zero [74,75].
The calculated thermodynamic parameters are listed in Table 5. The positive value of Δ is an indication that the fluoride sorption process stimulation occurred at a reasonably higher temperature and is, thus, endothermic [76]. This was further displayed by the decrease in the values of Qm and KF, respectively, as well as the increased Ka values from the nonlinear isotherm parameters (Table 3) as the temperature increases. The values of ∆ obtained are all negative across the temperature range, which implies that the fluoride adsorption process occurred favorably and spontaneously with minimal requirements of the adsorption and activation energies [68]. The positive ∆S° values suggest that the F sorption phenomenon was governed by the increasing randomness of the F ions at the CNF-AgMgOnHaP adsorbent–solution interface.

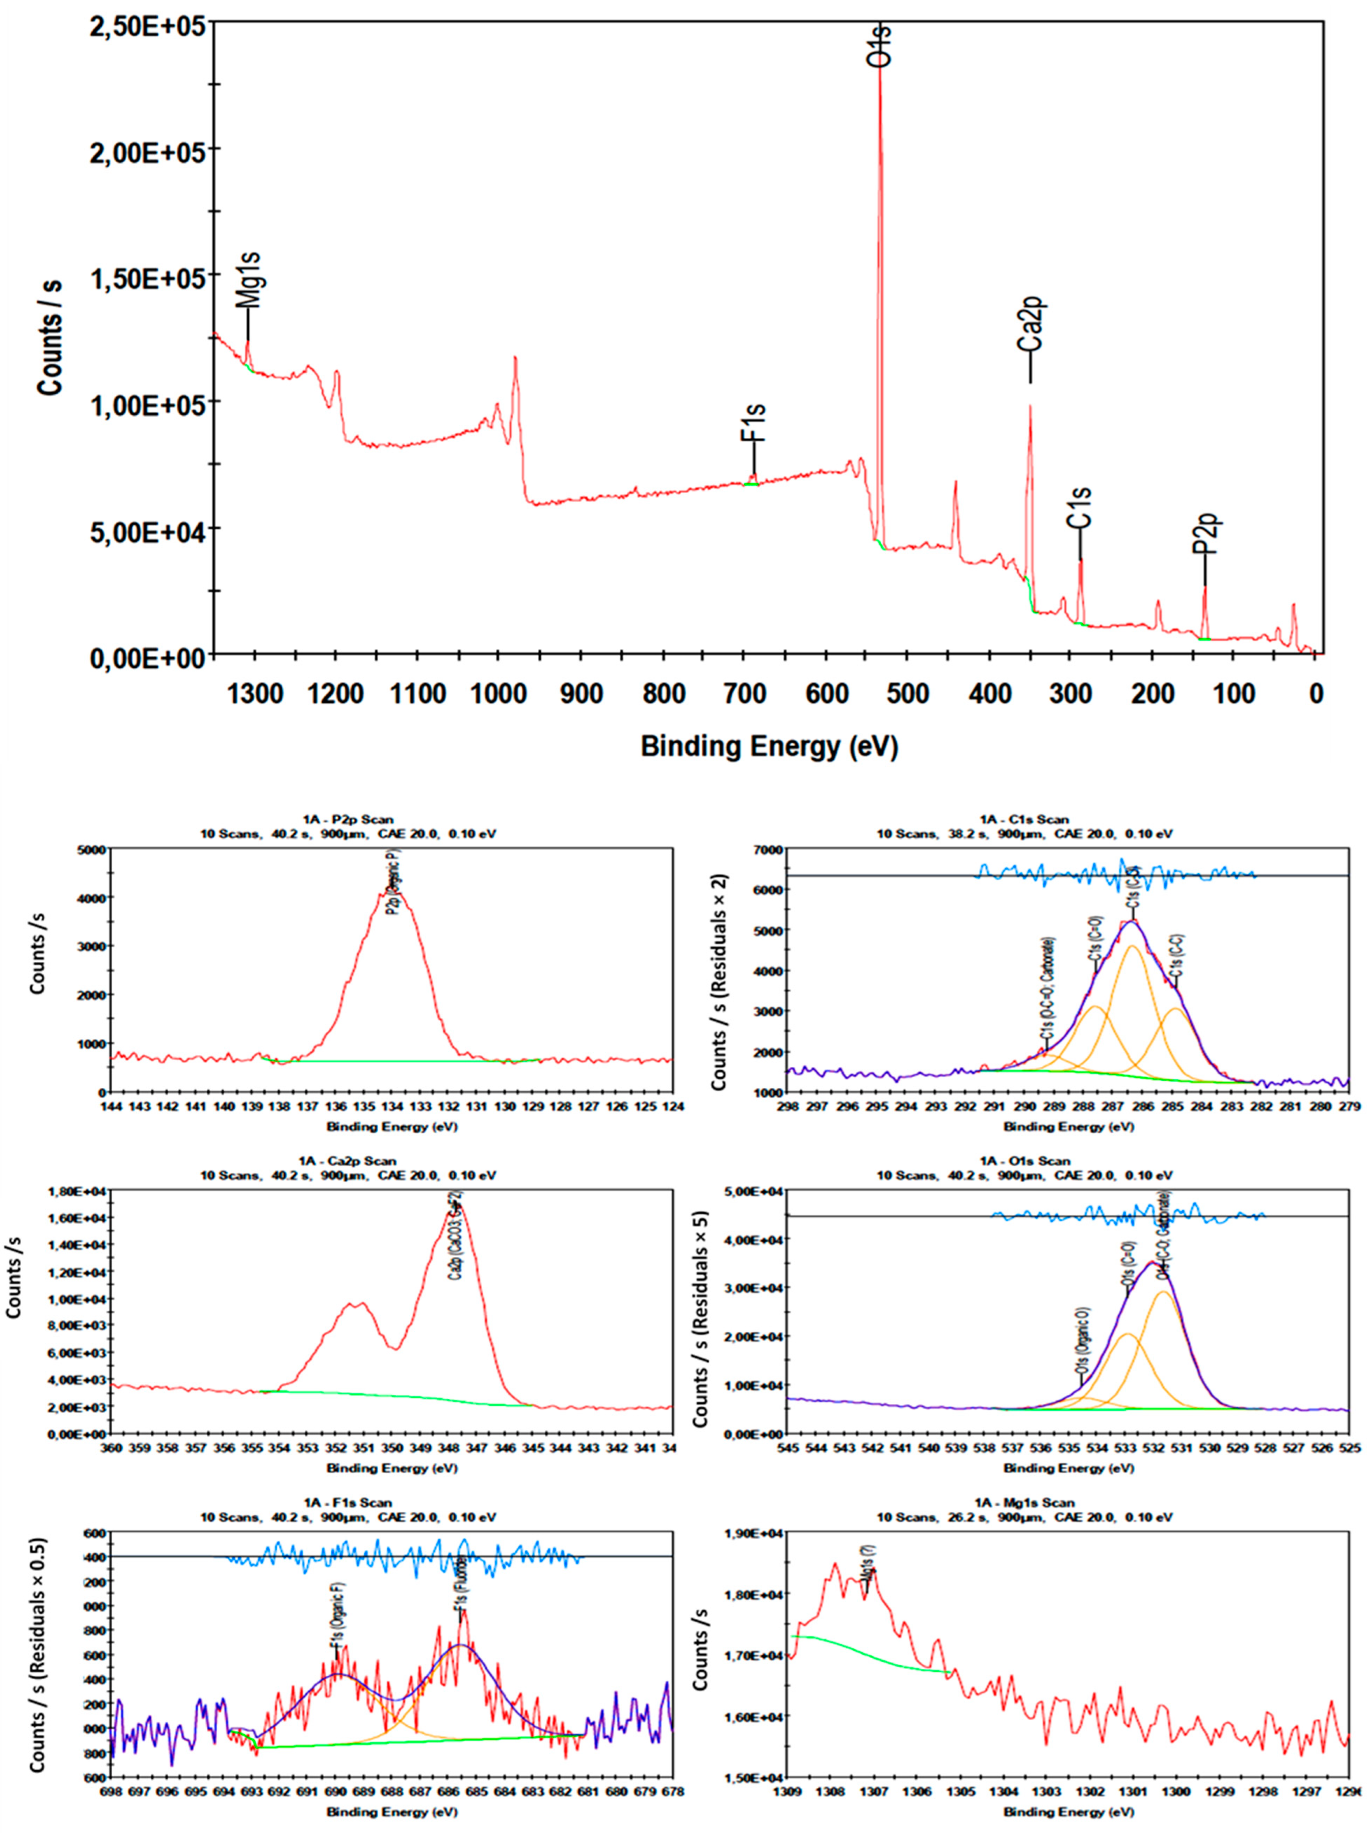
4.8. Surface Chemistry

Figure 13 shows the wide XPS spectral elemental analysis, whose peaks fitted according to the surface composition and chemistry of the fluoride sorbed CNF-AgMgOnHaP adsorbent. The fundamental elements of the adsorbent, as displayed by the XPS spectrum, include carbon, oxygen, calcium, phosphorus, magnesium, fluorine, and traces of silver content. As shown in Figure 13, the C1s (287.1 eV) spectra are resolved into four gaussian peaks assigned to C-C (284.9 eV), the C-O contribution of -OH groups (286.3 eV), C=O (287.6 eV), and O-C=O (289.2 eV) bonding states [77,78], associated with the cellulose nanofiber layer within the composite formation. The peaks of O 1s and Mg 1s, which appeared between 531 and 535 eV (deconvoluted into three major peaks) and 1307.2 eV (single peak), respectively, are a representation of lattice O atoms bonded with carbonyl, Mg atoms, hydroxyl groups, and adsorbed water [78]. The presence of 2p (134.0 eV) and Ca 2p (347.7 eV) were attributed to organic P and Ca-C=O interaction for calcium phosphates in the hydroxyapatite. The fewer related peaks at ~367.8 eV (two lines) corresponded to the characteristic peak of Ag NPs, confirming its existence within the composite. The appearance of an F 1s peak at 685 eV, which was resolved into two peaks at 685.5 and 689.9 eV, attributed to inorganic and organic fluoride, respectively, indicates F ions being bound to the CNF-AgMgOnHaP adsorbent. This was further supported by the possible Ca-F bond, as shown by the Ca 2p (347.7 eV). Thus, the XPS, EDS, FTIR, and solution pH results clearly show that the surface mechanisms of fluoride removal by the CNF-AgMgOnHaP composite could have occurred via ligand exchange and electrostatic attraction between F and the OH, Mg2+ or Mg-OH+ and Ca-OH+ species at the sorbent–sorbate solution interface.

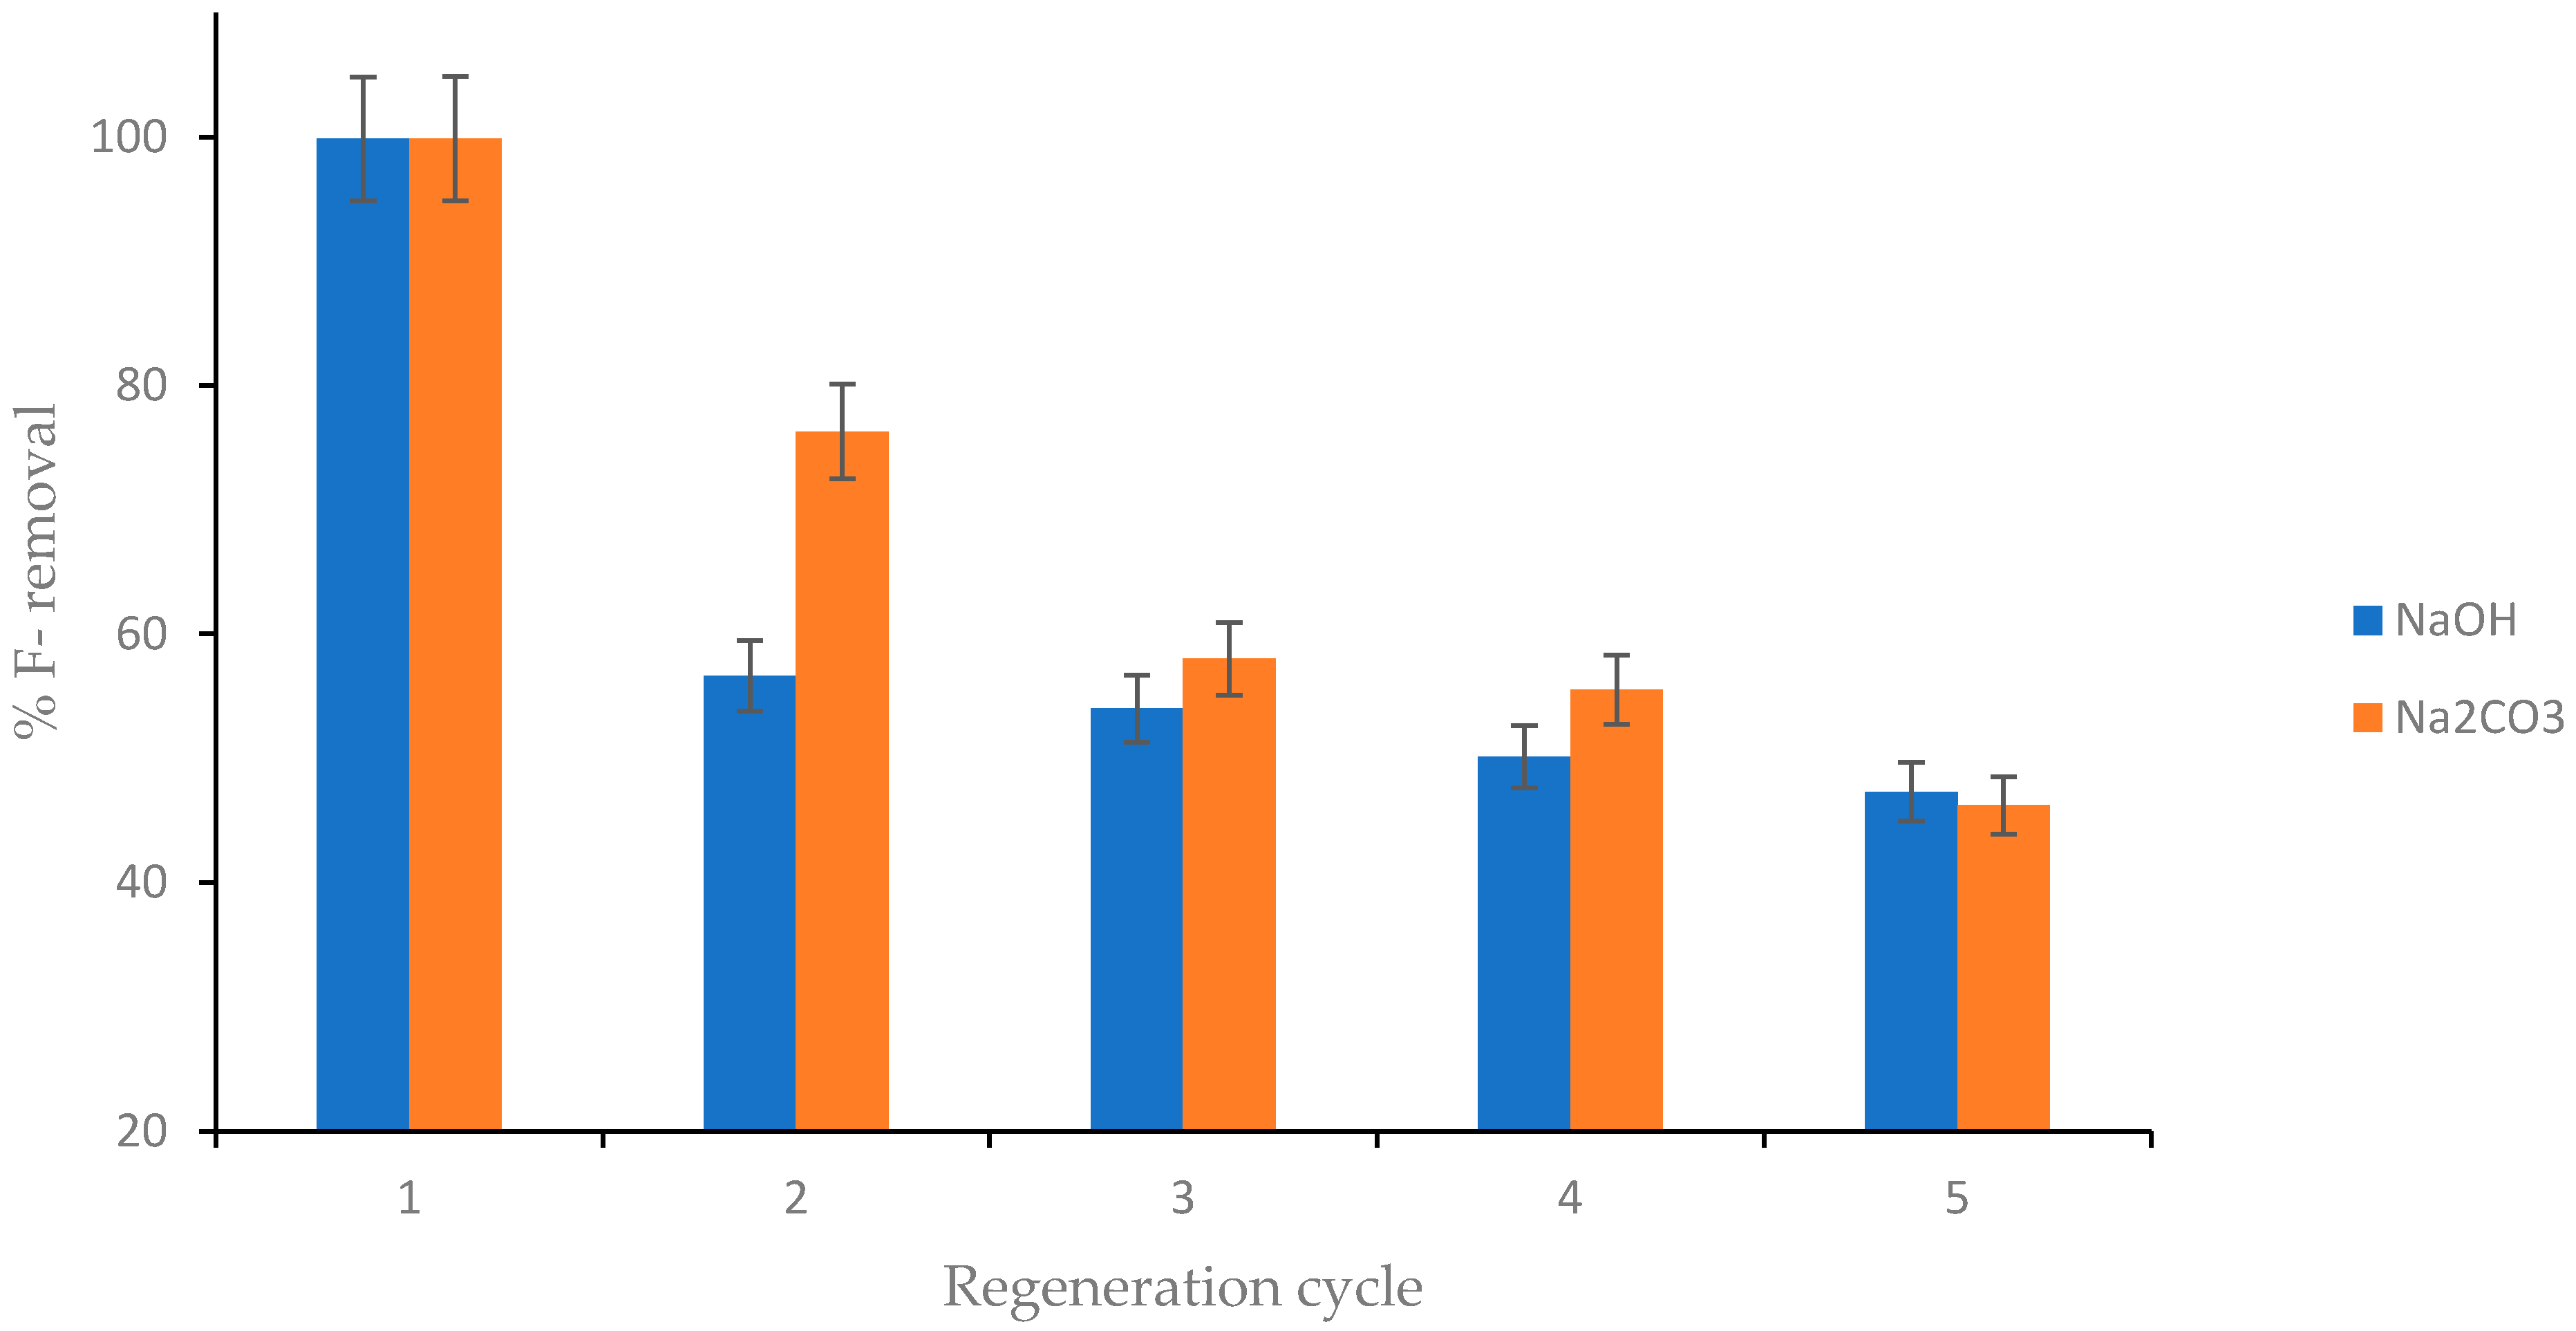
4.9. Regeneration and Reusability of CNF-AgMgOnHaP Adsorbent

Figure 14 depicts the reusability trend against the percent fluoride removal from an aqueous solution at various cycles of defluoridation (1–5) with an adsorbent dose of 0.25 g/50 mL at 25 ± 3 °C. This was carried out based on the analysis of the effects of coexisting anions, which suggested that the capacity of the CNF-AgMgOnHaP adsorbent to remove fluoride in a solution was low in alkaline solution. Therefore, different concentrations of NaOH and Na2CO3 were used in this study. As shown in Figure 14, fluoride removal by a sorbent regenerated with NaOH was observed to be very low when compared to that regenerated with Na2CO3. For both regenerants, the percentage of fluoride removal by the composite decreases (~48% for NaOH and 46% Na2CO3) with an increasing regeneration cycle. It is important to note that the type of surface interaction between the regenerants and the adsorbent determines the reusability property; hence, the provision of better regeneration capability by the adsorbent may have been through electrostatic and chemisorption interactions between the adsorbent and F, which occur naturally in the groundwater [79,80]. Consequently, the regenerated CNF-AgMgOnHaP adsorbent possesses a greater economic potential in the removal and recovery of fluoride ions, even in the presence of a limiting solution parameter.

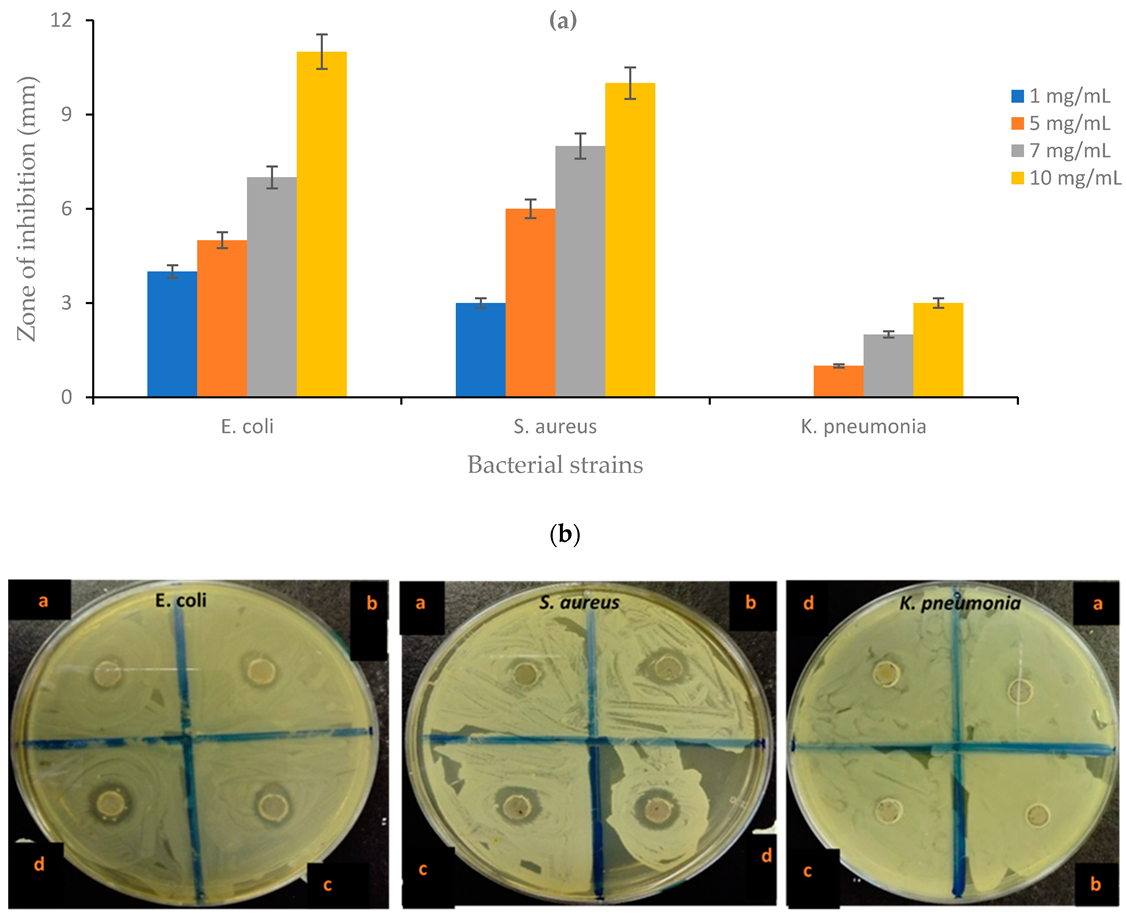
4.10. Antibacterial Activity of the CNF-AgMgOnHaP Adsorbent

Figure 15a,b displayed the observed antibacterial property of the CNF-AgMgOnHaP adsorbent through the values exhibited by the zone of inhibition against Gram-negative and Gram-positive bacterial strains. The diameter of the zone of inhibition was found to increase with an increase in the concentration of the adsorbent (Label: a, b, c, d depicting 1, 5, 7, and 10 mg/L, respectively) (Figure 15b). The observed zone of inhibition showed that the CNF-AgMgOnHaP adsorbent possesses antibacterial activity against all the bacterial strains. However, this antibacterial property varies, with higher antimicrobial potency observed towards E. Coli compared to S. aureus and K. pneumonia.
The antibacterial potency observed by this material depends on several factors, including the synergistic effects of Ag-MgO within the synthesized CNF-AgMgOnHaP composite. It has been established that MgO and Ag based materials have excellent broad spectrum, potent antimicrobial properties and are easily impregnated into cellulosic materials as a stabilizing agent [81,82,83]. The antibacterial property of the CNF-AgMgOnHaP adsorbent may be due to the diffusion of Ag-MgO nanoparticles within the adsorbent through the release of metal ions disrupting the cell wall structure of the bacteria genome in producing intracellular reactive oxygen species (ROS), resulting in microbial cell death [18,84,85]; the Ag-MgO nanocomposite antibacterial activity may also depend on the reducing and capping agents used in the synthesis route, as well as the size and surface properties of the composite [38,86,87]. It is important to emphasize that the Ag ions release, though in low concentration, was affected by the time and rate of dissolution; metal ions release increases as time progresses. Therefore, the adsorbent presents specific antibacterial activity against all the bacteria strains.

5. Comparative Analysis

To prove the systemic integrations of the polymers cum nanoparticles and the role of the active functional groups within the composite structures, the CNF-AgMgOnHaP was compared with similar sorbent materials reported in the literature (Table 6). As shown in Table 6, the CNF-AgMgOnHaP composite has an excellent performance and advantages, such as its disinfection property and highest fluoride removal efficiency, which makes it a suitable material for household water treatment for improved socioeconomic development.

6. Conclusions

A CNF-AgMgOnHaP composite was successfully biosynthesized through the impregnation and dispersion of Ag-MgO and nHap nanoparticles by a simple hydrothermal method. The structural morphology and optical properties provided evidence showing the aggregation of nanoparticles on the biopolymeric cellulose fiber matrix, after modification. The increased surface area of the CNF-AgMgOnHaP composite by BET analysis showed the availability of numerous binding functional groups within the matrix, which aligned with other spectro-analytical results. The sorption of fluoride by the adsorbent was found to strongly depend on the different sorption conditions, with the optimum adsorption conditions determined at 10 min (25 ± 3 °C), 0.25 g adsorbent dose, and pH 5, with a maximum defluoridation capacity of 8.712 mg/g at 303 K. The sorbate–sorbent interaction was well documented by adsorption isotherms and kinetic models and based on the higher correlation coefficients (R2) and lower Chi-square (χ2) values comparison; it was found that the fluoride sorption onto the CNF-AgMgOnHaP was best described by the Freundlich isotherm model across all the operating temperatures. Based on the higher correlation coefficient (R2) and the lowest S.D. and RMSE values obtained with regards to reaction based pathways, the pseudo-second-order model was the most suitable model and best describes the fluoride sorption behavior on the adsorbent surface. However, the overall kinetic results indicated that the mechanisms not only depend on the chemical adsorption process but were also governed by the mass transfer of the adsorbate molecules from the external surface through the pores of the adsorbent. The thermodynamic parameters revealed that the adsorption process of F onto CNF AgMgOnHaP was endothermic and spontaneous. The synthesized composite also provides some antibacterial activity against both Gram-negative and Gram-positive water bacteria strains. Consequently, the synthesized CNF AgMgOnHaP composite can be used as a suitable and viable adsorbent in the simultaneous removal of fluoride and pathogen in drinking water.

Author Contributions

Conceptualization, W.B.A. and M.W.G.; formal analysis, funding acquisition, W.B.A. and M.W.G.; investigation, W.B.A.; methodology, W.B.A.; project administration, M.W.G.; resources, W.B.A. and M.W.G.; software, W.B.A.; supervision, J.A.S. and A.S.; validation, M.W.G.; writing—original draft, W.B.A.; writing—review and editing, W.B.A. and M.W.G. All authors have read and agreed to the published version of the manuscript.

Funding

The authors would like to acknowledge financial support from USAID-PEER Cycle 6-Award No: AID-OAA-A-11-00012; National Research Foundation of South Africa (Grant Nos: 129624).

Institutional Review Board Statement

Not applicable.

Informed Consent Statement

Not applicable.

Data Availability Statement

Not applicable.

Acknowledgments

The authors would also like to thank the University of Venda for providing a platform to carry out the study.

Conflicts of Interest

The authors declare no conflict of interest.

References

  1. WWAP (United Nations World Water Assessment Programme); UNESCO: Paris, France, 2017.
  2. World Health Organization. W.H.O Progress on Drinking Water, Sanitation and Hygiene: 2017 Update and SDG Baselines; World Health Organization: Geneva, Switzerland, 2017. [Google Scholar]
  3. Beard, V.A.; Mitlin, D. Water access in global South cities: The challenges of intermittency and affordability. World Dev. 2021, 147, 105625. [Google Scholar] [CrossRef]
  4. Mumtaz, N.; Pandey, G.; Labhasetwar, P.K. Global fluoride occurrence, available technologies for fluoride removal and electrolytic defluoridation: A review. Crit. Rev. Environ. Sci. Technol. 2015, 45, 2357–2389. [Google Scholar] [CrossRef]
  5. Yadav, K.K.; Kumar, S.; Pham, Q.B.; Gupta, N.; Rezania, S.; Kamyab, H.; Yadav, S.; Vymazal, J.; Kumar, V.; Tri, D.Q.; et al. Fluoride contamination, health problems and remediation methods in Asian groundwater: A comprehensive review. Ecotoxicol. Environ. Saf. 2019, 182, 109362. [Google Scholar] [CrossRef] [PubMed]
  6. Guth, S.; Hüser, S.; Roth, A.; Degen, G.; Diel, P.; Edlund, K.; Eisenbrand, G.; Engel, K.-H.; Epe, B.; Grune, T.; et al. Toxicity of fluoride: Critical evaluation of evidence for human developmental neurotoxicity in epidemiological studies, animal experiments and in vitro analyses. Arch. Toxicol. 2020, 94, 1375–1415. [Google Scholar] [CrossRef]
  7. Singh, J.; Singh, P.; Singh, A. Fluoride ions vs removal technologies: A study. Arab. J. Chem. 2016, 9, 815–824. [Google Scholar] [CrossRef]
  8. Miretzky, P.; Cirelli, A.F. Fluoride removal from water by chitosan derivatives and composites: A review. J. Fluor. Chem. 2011, 132, 231–240. [Google Scholar] [CrossRef]
  9. Edition, F. Guidelines for drinking-water quality. WHO Chron. 2011, 38, 104–108. [Google Scholar]
  10. Loganathan, P.; Vigneswaran, S.; Kandasamy, J.; Naidu, R. Defluoridation of drinking water using adsorption processes. J. Hazard. Mater. 2013, 248, 1–19. [Google Scholar] [CrossRef]
  11. Ashbolt, N.J. Microbial contamination of drinking water and disease outcomes in developing regions. Toxicology 2004, 198, 229–238. [Google Scholar] [CrossRef]
  12. Ramesh, M.; Malathi, N.; Ramesh, K.; Aruna, R.M.; Kuruvilla, S. Comparative evaluation of dental and skeletal fluorosis in an endemic fluorosed district, Salem, Tamil Nadu. J. Pharm. Bioallied Sci. 2017, 9, S88. [Google Scholar] [CrossRef]
  13. Hijnen, W.; Beerendonk, E.; Medema, G.J. Inactivation credit of UV radiation for viruses, bacteria and protozoan (oo) cysts in water: A review. Water Res. 2006, 40, 3–22. [Google Scholar] [CrossRef] [PubMed]
  14. Bitton, G. Microbiology of Drinking Water Production and Distribution; John Wiley & Sons, Inc.: Hoboken, NJ, USA, 2014. [Google Scholar]
  15. Chlorine Chemistry Council; American Chemistry Council. Drinking Water Chlorination: A Review of Disinfection Practices and Issues. Water Cond. Purif. Int. 2006, 68. [Google Scholar]
  16. Momba, M.N.B. Selection and Use of Home Water-treatment Systems and Devices: Report to the Water Research Commission; Water Research Commission: Pretoria, South Africa, 2013.
  17. He, J.; Yang, Y.; Wu, Z.; Xie, C.; Zhang, K.; Kong, L.; Liu, J. Review of fluoride removal from water environment by adsorption. J. Environ. Chem. Eng. 2020, 22, 104516. [Google Scholar] [CrossRef]
  18. Nasker, P.; Mukherjee, M.; Kant, S.; Tripathy, S.; Sinha, A.; Das, M. Fluorine substituted nano hydroxyapatite: Synthesis, bio-activity and antibacterial response study. Ceram. Int. 2018, 4, 22008–22013. [Google Scholar] [CrossRef]
  19. Tian, Y.; Wu, M.; Liu, R.; Wang, D.; Lin, X.; Liu, W.; Ma, L.; Li, Y.; Huang, Y. Modified native cellulose fibers—A novel efficient adsorbent for both fluoride and arsenic. J. Hazard. Mater. 2011, 185, 93–100. [Google Scholar] [CrossRef]
  20. Yadav, K.K.; Gupta, N.; Kumar, V.; Khan, S.A.; Kumar, A. A review of emerging adsorbents and current demand for defluoridation of water: Bright future in water sustainability. Environ. Int. 2018, 111, 80–108. [Google Scholar] [CrossRef]
  21. Ferroudj, N.; Nzimoto, J.; Davidson, A.; Talbot, D.; Briot, E.; Dupuis, V.; Bée, A.; Medjram, M.S.; Abramson, S. Maghemite nanoparticles and maghemite/silica nanocomposite microspheres as magnetic Fenton catalysts for the removal of water pollutants. Appl. Catal. B Environ. 2013, 136, 9–18. [Google Scholar] [CrossRef]
  22. Gitari, W.M.; Izuagie, A.A.; Gumbo, J.R. Synthesis, characterization and batch assessment of groundwater fluoride removal capacity of trimetal Mg/Ce/Mn oxide-modified diatomaceous earth. Arab. J. Chem. 2017, 13, 1–16. [Google Scholar] [CrossRef]
  23. Kalia, S.; Dufresne, A.; Cherian, B.M.; Kaith, B.S.; Avérous, L.; Njuguna, J.; Nassiopoulos, E. Cellulose-based bio-and nanocomposites: A review. Int. J. Polym. Sci. 2011, 2011, 837875. [Google Scholar] [CrossRef]
  24. Gopakumar, D.A.; Manna, S.; Pasquini, D.; Thomas, S.; Grohens, Y. Nanocellulose: Extraction and application as a sustainable material for wastewater purification. In New Polymer Nanocomposites for Environmental Remediation; Elsevier: Amsterdam, The Netherlands, 2018; pp. 469–486. [Google Scholar]
  25. Fu, L.-H.; Xie, Y.-M.; Bian, J.; Ma, M.-G.; Tian, C.-H.; Jin, X.-J. Microwave-assisted rapid synthesis of lignocellulose/hydroxyapatite nanocomposites. Mater. Lett. 2015, 159, 51–53. [Google Scholar] [CrossRef]
  26. Ayinde, W.B.; Gitari, M.W.; Muchindu, M.; Samie, A. Biosynthesis of ultrasonically modified Ag-MgO nanocomposite and its potential for antimicrobial activity. J. Nanotechnol. 2018, 2018, 9537454. [Google Scholar] [CrossRef] [Green Version]
  27. Ayinde, W.; Gitari, W.; Samie, A. Optimization of microwave-assisted synthesis of silver nanoparticle by Citrus paradisi peel and its application against pathogenic water strain. Green Chem. Lett. Rev. 2019, 12, 225–234. [Google Scholar] [CrossRef] [Green Version]
  28. Ayinde, W.; Gitari, W.; Munkombwe, M.; Samie, A.; Smith, J.A. Green synthesis of AgMgOnHaP nanoparticles supported on chitosan matrix: Defluoridation and antibacterial effects in groundwater. J. Environ. Chem. Eng. 2020, 8, 104026. [Google Scholar] [CrossRef]
  29. Kamphunthong, W.; Hornsby, P.; Sirisinha, K. Isolation of cellulose nanofibers from para rubberwood and their reinforcing effect in poly (vinyl alcohol) composites. J. Appl. Polym. Sci. 2012, 125, 1642–1651. [Google Scholar] [CrossRef]
  30. Mandal, A.; Chakrabarty, D. Isolation of nanocellulose from waste sugarcane bagasse (SCB) and its characterization. Carbohydr. Polym. 2011, 86, 1291–1299. [Google Scholar] [CrossRef]
  31. Poinern, G.E.J.; Ghosh, M.K.; Ng, Y.-J.; Issa, T.B.; Anand, S.; Singh, P. Defluoridation behavior of nanostructured hydroxyapatite synthesized through an ultrasonic and microwave combined technique. J. Hazard. Mater. 2011, 185, 29–37. [Google Scholar] [CrossRef]
  32. Athar, T. Synthesis of MgO Nanoparticles via Sol–Gel Method. Mater. Focus 2013, 2, 493–496. [Google Scholar] [CrossRef]
  33. Karthiga, P. Preparation of silver nanoparticles by Garcinia mangostana stem extract and investigation of the antimicrobial properties. Biotechnol. Res. Innov. 2018, 2, 30–36. [Google Scholar] [CrossRef]
  34. Mulvaney, P. Surface plasmon spectroscopy of nanosized metal particles. Langmuir 1996, 12, 788–800. [Google Scholar] [CrossRef]
  35. Sterrer, M.; Berger, T.; Diwald, O.; Knözinger, E. Energy transfer on the MgO surface, monitored by UV−induced H2 chemisorption. J. Am. Chem. Soc. 2003, 125, 195–199. [Google Scholar] [CrossRef]
  36. Stankic, S.; Sterrer, M.; Hofmann, P.; Bernardi, J.; Diwald, O.; Knözinger, E. Novel optical surface properties of Ca2+-doped MgO nanocrystals. Nano Lett. 2005, 5, 1889–1893. [Google Scholar] [CrossRef] [PubMed]
  37. Barud, H.S.; Regiani, T.; Marques, R.F.; Lustri, W.R.; Messaddeq, Y.; Ribeiro, S.J. Antimicrobial bacterial cellulose-silver nanoparticles composite membranes. J. Nanomater. 2011, 2011, 721631. [Google Scholar] [CrossRef] [Green Version]
  38. Kuppusamy, P.; Yusoff, M.M.; Maniam, G.P.; Govindan, N. Biosynthesis of metallic nanoparticles using plant derivatives and their new avenues in pharmacological applications–An updated report. Saudi Pharm. J. 2016, 24, 473–484. [Google Scholar] [CrossRef]
  39. Xiong, R.; Lu, C.; Zhang, W.; Zhou, Z.; Zhang, X. Facile synthesis of tunable silver nanostructures for antibacterial application using cellulose nanocrystals. Carbohydr. Polym. 2013, 95, 214–219. [Google Scholar] [CrossRef] [PubMed]
  40. Kolarova, K.; Samec, D.; Kvitek, O.; Reznickova, A.; Rimpelova, S.; Svorcik, V. Preparation and characterization of silver nanoparticles in methyl cellulose matrix and their antibacterial activity. Jpn. J. Appl. Phys. 2017, 56, 06GG09. [Google Scholar] [CrossRef] [Green Version]
  41. Mujahid, M.; Sarfraz, S.; Amin, S. On the formation of hydroxyapatite nano crystals prepared using cationic surfactant. Mater. Res. 2015, 18, 468–472. [Google Scholar] [CrossRef] [Green Version]
  42. Maryan, A.S.; Montazer, M.; Harifi, T. Synthesis of nano silver on cellulosic denim fabric producing yellow colored garment with antibacterial properties. Carbohydr. Polym. 2015, 115, 568–574. [Google Scholar] [CrossRef]
  43. Fan, M.; Dai, D.; Huang, B. Fourier transform infrared spectroscopy for natural fibres. Fourier Transform.-Mater. Anal. 2012, 3, 45–68. [Google Scholar]
  44. Koutsopoulos, S. Synthesis and characterization of hydroxyapatite crystals: A review study on the analytical methods. J. Biomed. Mater. Res. 2002, 62, 600–612. [Google Scholar] [CrossRef]
  45. Balamurugan, S.; Ashna, L.; Parthiban, P. Synthesis of nanocrystalline MgO particles by combustion followed by annealing method using hexamine as a fuel. J. Nanotechnol. 2014, 2014, 841803. [Google Scholar] [CrossRef] [Green Version]
  46. Prabhu, S.M.; Elanchezhiyan, S.S.; Lee, G.; Khan, A.; Meenakshi, S. Assembly of nano-sized hydroxyapatite onto graphene oxide sheets via in-situ fabrication method and its prospective application for defluoridation studies. Chem. Eng. J. 2016, 300, 334–342. [Google Scholar] [CrossRef]
  47. Hwang, N.; Barron, A.R. BET surface area analysis of nanoparticles. Connex. Proj. 2011, 39, 445–446. [Google Scholar]
  48. Lu, L.; Lu, D.; Chen, L.; Luo, F. Removal of Cd (II) by modified lawny grass cellulose adsorbent. Desalination 2010, 259, 120–130. [Google Scholar] [CrossRef]
  49. Banavath, H.N.; Bhardwaj, N.K.; Ray, A.K. A comparative study of the effect of refining on charge of various pulps. Bioresour. Technol. 2011, 102, 4544–4551. [Google Scholar] [CrossRef]
  50. Akram, M.; Alshemary, A.Z.; Goh, Y.F.; Ibrahim, W.A.; Lintang, H.O.; Hussain, R. Continuous microwave flow synthesis of mesoporous hydroxyapatite. Mater. Sci. Eng. 2015, 56, 356–362. [Google Scholar] [CrossRef]
  51. Mohammad, N.F.; Othman, R.; Yeoh, F.Y. Controlling the pore characteristics of mesoporous apatite materials: Hydroxyapatite and carbonate apatite. Ceram. Int. 2015, 41, 10624–10633. [Google Scholar] [CrossRef]
  52. Maliyekkal, S.M.; Antony, K.; Pradeep, T. High yield combustion synthesis of nanomagnesia and its application for fluoride removal. Sci. Total Environ. 2010, 408, 2273–2282. [Google Scholar] [CrossRef]
  53. Hou, S.; Li, J.; Huang, X.; Wang, X.; Ma, L.; Shen, W.; Kang, F.; Huang, Z.-H. Silver nanoparticles-loaded exfoliated graphite and its anti-bacterial performance. Appl. Sci. 2017, 7, 852. [Google Scholar] [CrossRef] [Green Version]
  54. Wada, M.; Heux, L.; Sugiyama, J. Polymorphism of cellulose I family: Reinvestigation of cellulose IVI. Biomacromolecules 2004, 5, 1385–1391. [Google Scholar] [CrossRef]
  55. Klemm, D.; Heublein, B.; Fink, H.P.; Bohn, A. Cellulose: Fascinating biopolymer and sustainable raw material. Angew. Chem. Int. Ed. 2005, 44, 3358–3393. [Google Scholar] [CrossRef]
  56. Fleet, M.E.; Liu, X.; King, P.L. Accommodation of the carbonate ion in apatite: An FTIR and X-ray structure study of crystals synthesized at 2–4 GPa. Am. Miner. 2004, 89, 1422–1432. [Google Scholar] [CrossRef]
  57. Averbuch, P.; MT, A.P. Structure Cristalline D’un Tripolyphosphate Acide Mixte Zinc-Argent Nonahydrate: Zn2Ag0.62H0.38P3O10. 9H2O. Acta Crystallogr. 1976, B32, 2270–2274. [Google Scholar] [CrossRef]
  58. Calvo, C. The crystal structure of α-Mg2P2O7. Acta Crystallogr. 1967, 23, 289–295. [Google Scholar] [CrossRef]
  59. Samadi, N.; Hasanzadeh, R.; Rasad, M. Adsorption isotherms, kinetic, and desorption studies on removal of toxic metal ions from aqueous solutions by polymeric adsorbent. J. Appl. Polym. Sci. 2015, 132, 41642. [Google Scholar] [CrossRef]
  60. Chen, H.; Zhang, Z.; Wang, X.; Chen, J.; Xu, C.; Liu, Y.; Yu, Z.; Wang, X. Fabrication of magnetic Fe/Zn layered double oxide@ carbon nanotube composites and their application for U (VI) and 241Am (III) removal. ACS Appl. Nano Mater. 2018, 1, 2386–2396. [Google Scholar] [CrossRef]
  61. Tran, H.N.; Wang, Y.F.; You, S.; Chao, H.P. Insights into the mechanism of cationic dye adsorption on activated charcoal: The importance of π–π interactions. Process Saf. Environ. Prot. 2017, 107, 168–180. [Google Scholar] [CrossRef]
  62. Swain, S.; Mishra, S.; Patnaik, T.; Patel, R.; Jha, U.; Dey, R. Fluoride removal performance of a new hybrid sorbent of Zr (IV)–ethylenediamine. Chem. Eng. J. 2012, 184, 72–81. [Google Scholar] [CrossRef]
  63. Voisin, H.; Bergström, L.; Liu, P.; Mathew, A.P. Nanocellulose-based materials for water purification. Nanomaterials 2017, 7, 57. [Google Scholar] [CrossRef]
  64. Nayak, B.; Samant, A.; Patel, R.; Misra, P.K. Comprehensive understanding of the kinetics and mechanism of fluoride removal over a potent nanocrystalline hydroxyapatite surface. ACS Omega 2017, 2, 8118–8128. [Google Scholar] [CrossRef] [Green Version]
  65. Langmuir, I. The constitution and fundamental properties of solids and liquids. Part I Solids J. Am. Chem. Soc. 1916, 38, 2221–2295. [Google Scholar] [CrossRef] [Green Version]
  66. Freundlich, H. Over the adsorption in solution. J. Phys. Chem. 1906, 57, 1100–1107. [Google Scholar]
  67. Dubinin, M. The equation of the characteristic curve of activated charcoal. Doklady Akademii Nauk SSSR 1947, 55, 327–329. [Google Scholar]
  68. Tran, H.N.; You, S.-J.; Hosseini-Bandegharaei, A.; Chao, H.-P. Mistakes and inconsistencies regarding adsorption of contaminants from aqueous solutions: A critical review. Water Res. 2017, 120, 88–116. [Google Scholar] [CrossRef]
  69. Tran, H.N.; You, S.-J.; Chao, H.-P. Fast and efficient adsorption of methylene green 5 on activated carbon prepared from new chemical activation method. J. Environ. Manag. 2017, 188, 322–336. [Google Scholar] [CrossRef]
  70. Lagergren, S.K. About the theory of so-called adsorption of soluble substances. Sven. Vetenskapsakad. Handingarl 1898, 24, 1–39. [Google Scholar]
  71. Ho, Y.; Ng, J.; McKay, G. Kinetics of pollutant sorption by biosorbents. Sep. Purif. Methods 2000, 29, 189–232. [Google Scholar] [CrossRef]
  72. Weber, W.J.; Morris, J.C. Equilibria and capacities for adsorption on carbon. J. Sanit. Eng. Div. 1964, 90, 79–108. [Google Scholar] [CrossRef]
  73. Machado, F.M.; Bergmann, C.P.; Lima, E.C.; Royer, B.; de Souza, F.E.; Jauris, I.M.; Calvete, T.; Fagan, S.B. Adsorption of Reactive Blue 4 dye from water solutions by carbon nanotubes: Experiment and theory. Phys. Chem. Chem. Phys. 2012, 14, 11139–11153. [Google Scholar] [CrossRef]
  74. Viswanathan, N.; Pandi, K.; Meenakshi, S. Synthesis of metal ion entrapped silica gel/chitosan biocomposite for defluoridation studies. Int. J. Biol. Macromol. 2014, 70, 347–353. [Google Scholar] [CrossRef]
  75. Biggar, J.; Cheung, M. Adsorption of picloram (4-amino-3, 5, 6-trichloropicolinic acid) on panoche, ephrata, and palouse soils: A thermodynamic approach to the adsorption mechanism. Soil Sci. Soc. Am. J. 1973, 37, 863–868. [Google Scholar] [CrossRef]
  76. Summaira, S.; Zhenggang, X. Facile preparation of metal-organic frameworks-8 (ZIF-8) and its simultaneous adsorption of tetracycline (TC) and minocycline (MC) from aqueous solutions . Mater. Res. Bull. 2021, 141, 111372. [Google Scholar]
  77. Bomben, K.; Moulder, J.F.; Sobol, P.E.; Stickle, W.F. Handbook of X-ray Photoelectron Spectroscopy: A Reference Book of Standard Spectra for Identification and Interpretation of XPS Data; Physical Electronics: Eden Prairie, MN, USA, 1995. [Google Scholar]
  78. Rouxhet, P.G.; Genet, M.J. XPS analysis of bio-organic systems. Surf. Interface Anal. 2011, 43, 1453–1470. [Google Scholar] [CrossRef]
  79. Newberg, J.T.; Starr, D.E.; Yamamoto, S.; Kaya, S.; Kendelewicz, T.; Mysak, E.R.; Porsgaard, S.; Salmeron, M.B.; Brown, G.E., Jr.; Nilsson, A. Formation of hydroxyl and water layers on MgO films studied with ambient pressure XPS. Surf. Sci. 2011, 605, 89–94. [Google Scholar] [CrossRef]
  80. Akharame, M.O.; Fatoki, O.S.; Opeolu, B.O. Regeneration and reuse of polymeric nanocomposites in wastewater remediation: The future of economic water management. Polym. Bull. 2019, 76, 647–681. [Google Scholar] [CrossRef]
  81. Vivekanandhan, S.; Christensen, L.; Misra, M.; Mohanty, A.K. Green process for impregnation of silver nanoparticles into microcrystalline cellulose and their antimicrobial bionanocomposite films. J. Biomater. Nanobiotechnol. 2012, 3, 20556. [Google Scholar] [CrossRef]
  82. Kim, M.K.; Sundaram, K.S.; Iyengar, G.A.; Lee, K.-P. A novel chitosan functional gel included with multiwall carbon nanotube and substituted polyaniline as adsorbent for efficient removal of chromium ion. Chem. Eng. J. 2015, 267, 51–64. [Google Scholar] [CrossRef]
  83. Rafique, M.; Sadaf, I.; Rafique, M.S.; Tahir, M.B. A review on green synthesis of silver nanoparticles and their applications. Artif. Cells Nanomed. Biotechnol. 2017, 45, 1272–1291. [Google Scholar] [CrossRef]
  84. Tang, Z.-X.; Lv, B.-F. MgO nanoparticles as antibacterial agent: Preparation and activity. Braz. J. Chem. Eng. 2014, 31, 591–601. [Google Scholar] [CrossRef]
  85. Cai, Y.; Wu, D.; Zhu, X.; Wang, W.; Tan, F.; Chen, J.; Qiao, X.; Qiu, X. Sol-gel preparation of Ag-doped MgO nanoparticles with high efficiency for bacterial inactivation. Ceram. Int. 2017, 43, 1066–1072. [Google Scholar] [CrossRef]
  86. Horie, M.; Fujita, K.; Kato, H.; Endoh, S.; Nishio, K.; Komaba, L.K.; Nakamura, A.; Miyauchi, A.; Kinugasa, S.; Hagihara, Y. Association of the physical and chemical properties and the cytotoxicity of metal oxidenanoparticles: Metal ion release, adsorption ability and specific surface area. Metallomics 2012, 4, 350–360. [Google Scholar] [CrossRef]
  87. Lu, Z.; Rong, K.; Li, J.; Yang, H.; Chen, R. Size-dependent antibacterial activities of silver nanoparticles against oral anaerobic pathogenic bacteria. J. Mater. Sci. Mater. Med. 2013, 24, 1465–1471. [Google Scholar] [CrossRef] [PubMed]
  88. Gao, S.; Sun, R.; Wei, Z.G.; Zhao, H.Y.; Li, H.X.; Hu, F. Size-dependent defluoridation properties of synthetic hydroxyapatite. J. Fluor. Chem. 2009, 130, 550–556. [Google Scholar] [CrossRef]
  89. Yadav, A.K.; Abbassi, R.; Gupta, A.; Dadashzadeh, M. Removal of fluoride from aqueous solution and groundwater by wheat straw, sawdust and activated bagasse carbon of sugarcane. Ecol. Eng. 2013, 52, 211–218. [Google Scholar] [CrossRef]
  90. Yu, X.; Tong, S.; Ge, M.; Zuo, J. Removal of fluoride from drinking water by cellulose@ hydroxyapatite nanocomposites. Carbohydr. Polym. 2013, 92, 269–275. [Google Scholar] [CrossRef]
Figure 1. UV–Vis spectrum of CNF-AgMgO synthesized using C. paradisi peel extracts as a reducing agent at 40 ± 2 °C.
Polymers 14 00890 g001
Figure 2. SEM, EDS and TEM of (ad) CNF derived from sawdust waste; (eh) CNF-AgMgO composite, (ik) CNF-AgMgOnHaP adsorbent before fluoride sorption; (ln) CNF-AgMgOnHaP adsorbent after fluoride sorption.
Polymers 14 00890 g002
Figure 3. The FTIR spectra of CNF and CNF-AgMgOnHaP adsorbent.
Polymers 14 00890 g003
Figure 4. BET Nitrogen adsorption–desorption isotherms and pore size distribution curve.
Polymers 14 00890 g004
Figure 5. XRD patterns of (a) CNF from sawdust (b) CNF-AgMgOnHaP composite.
Polymers 14 00890 g005
Figure 6. Effect of contact time on CNF-AgMgOnHaP adsorbent. (Experimental conditions: dosage, 0.225 g; volume, 50 mL; initial concentration, 10 mg/L; pH, neutral; temperature, 298 K and shaking speed, 250 rpm).
Polymers 14 00890 g006
Figure 7. Effect of sorbent dose on the removal of F ions by CNF-AgMgOnHap composite (contact time of 10 min, initial F concentration of 10 mg/L at 50 mL solution volume, pH of 5, shaking speed of 250 rpm).
Polymers 14 00890 g007
Figure 8. (a) Effect of initial solution pH; (b) pHpzc of CNF-AgMgOnHaP (adsorbent dose: 0.25 g volume of solution: 25 mL, contact time: 24 h at 150 rpm).
Polymers 14 00890 g008
Figure 9. Effect of (a) co anions (0.25 g at 10 mg/L of fluoride ion with 100 mg/L of the respective individual coexisting anion); (b) co anion composite concentration on fluoride sorption by CNF-AgMgOnHaP composite (adsorbent dose: 0.25 g, 10 mg/L, contact time 10 min at 250 rpm).
Polymers 14 00890 g009
Figure 10. Effect of initial fluoride concentration on CNF-AgMgOnHaP adsorbent at different temperatures.
Polymers 14 00890 g010
Figure 11. Nonlinear isotherms by (a) Langmuir and (b) Freundlich methods, for the sorption of fluoride by CNF-AgMgOnHaP composite at 303 K, 313 K, and 323 K.
Polymers 14 00890 g011
Figure 12. Here, ln Kc as a function of reciprocal adsorption temperatures.
Polymers 14 00890 g012
Figure 13. Wide scan XPS spectra of CNF-AgMgOnHaP adsorbent after fluoride adsorption.
Polymers 14 00890 g013
Figure 14. Percent fluoride removal as a function of defluoridation cycle using 0.01 M NaOH and 0.1 M Na2CO3 as regenerates (initial fluoride concentration: 10 mg/L, volume of solution: 50 mL, adsorbent dosage: 0.25 g contact time: 30 min at 250 rpm).
Polymers 14 00890 g014
Figure 15. (a) Graphical representation and (b) photographic plate of antibacterial activity by the CNF-AgMgOnHaP composite against E. coli, S. aureus, and K. pneumonia at different concentration ranges.
Polymers 14 00890 g015
Table 1. Optimization of CNF % weight in the CNF-AgMgOnHaP adsorbent for F removal.
CNF (w/w %)Average Equilibrium Fluoride Concentration (Ce) (mg/L)% Fluoride Removal
103.30766.93
301.36486.36
500.47695.24
700.34396.57
1000.09699.04
Table 2. BET Surface analysis parameters of CNF-AgMgOnHaP adsorbent.
BET ParameterMethodsValues
Surface areaBET surface area160.17 m2/g
Langmuir surface area 220.45 m2/g
t-Plot external surface area 154.71 m2/g
Pore Area
Micropore areat-Plot micropore area5.46 m2/g
Mesopore areaBJH adsorption 196.12 m2/g
BJH desorption223.89 m2/g
Pore volume
Micropore volumeSingle point adsorption0.38 cm3/g
Single point desorption0.38 cm3/g
Mesopore volumeBJH adsorption0.39 cm3/g
BJH desorption0.40 cm3/g
Pore size
Adsorption average pore width4 V/A by BET9.55 nm
Desorption average pore width4 V/A by BET9.53 nm
Mesopore size BJH adsorption 7.91 nm
BJH desorption 6.91 nm
Table 3. Isotherm parameters for the sorption of fluoride by CNF-AgMgOnHaP composite.
Temperature (K) 303313323
Non-LinearLangmuir isotherm
Qm (mg/g) 8.7157.526.286
KL (L/mg) 0.2750.4261.566
RL0.270.190.06
Adj. R20.8130.8450.709
Red. χ21.6321.0851.879
RSS11.427.5913.16
Freundlich isotherm
KF [(mg/g)/(mg/L)n] 2.6862.5472.671
n3.3453.5193.853
Adj. R20.9730.9730.952
Red. χ20.3080.1880.308
RSS2.1581.3182.158
LinearDubinin–Radushkevvich
βDR (mol2/kJ2) 4.00 × 10−83.00 × 10−83.00 × 10⁻⁸
qmax (mg/g)5.0464.4484.804
E (kJ/mol) 3.5354.0834.083
R20.7490.6980.759
Table 4. Kinetic model parameters for adsorption of F by CNF-AgMgOnHaP.
ModelValues
Pseudo-first order
qcal (mg/g)0.84
k1 (min−1)0.23
R20.89
RMSE0.24
S. D. (%)63.53
Pseudo-second order
qcal (mg/g)2.24
k2 (g/min mg)0.67
R20.99
RMSE0.082
S. D. (%)18.21
Intraparticle diffusion
C1 (mg/g)1.64
C2 (mg/g)1.62
C3 (mg/g)1.9
Ki1 (mg/g.min0.5)0.16
Ki2 (mg/g.min0.5)0.14
Ki3 (mg/g.min0.5)0.064
R211
R220.99
R231
Table 5. Fluoride adsorption thermodynamic parameters.
Temperature (K)Δ (KJ/mol)Δ (J/mol K)Δ (kJ/mol)
20.7383.05
303 −4.44
313 −5.27
323 −6.10
Table 6. Comparative analysis of CNF-AgMgOnHaP to other materials.
Sorbent MaterialsF Sorption Capacity (mg/g)Optimized ConditionMicrobial Removal PotentialReference
HaP nanorods1.493 h. pH 7; 7 g/LNil[88]
Sawdust raw1.73pH 6, 0.5 g/25 mLNil[89]
Cellulose–hydroxyapatite4.2pH 6.5.Nil[90]
Ag/MgOnHaP2.1560 min; pH 6; 0.3 gYes[26]
AgMgOnHaP@CSn6.8640 min; pH 7; 0.25 gYes[28]
CNF-AgMgOnHaP8.710.25 g; 10 min; pH 5YesThis study
Publisher’s Note: MDPI stays neutral with regard to jurisdictional claims in published maps and institutional affiliations.

