1. Introduction
With the emergence of additive manufacturing technologies alongside the integration of CAD/CAE software systems, the trend of 3D printing is nowadays rapidly expanding from artisanal fabrication toward large-scale production of high-performance functional components intended to replace the conventionally manufactured parts for various and different demanding applications. Additive manufacturing (AM) virtually involves building up layer upon layer of material, making it possible to create much lighter but stable structural components with complex geometries that are excessively difficult or even impossible to be processed through the use of conventional subtractive fabrication methods. Besides, the actual AM techniques and their specific features ensure sustainable conservation of the environment and its resources by an effective recycling system that keeps materials in use for as long as possible. The main features of distinct AM techniques, different AM plastic materials, and their applications, along with the importance of studying the effects of process parameters on the characteristics of 3D printed parts, are presented in detail by Lee et al. [
1], Mousavi Nejad et al. [
2], Vanaei et al. [
3], Schmidt et al. [
4], Starr et al. [
5], and Wu et al. [
6].
Within the whole range of technologies based on the principles of additive manufacturing, the selective laser sintering (SLS) is among the most versatile approaches that typically use laser energy as a heat source to locally melt and fuse the polymer powder particles, such as, but not only, nylon or polyether ketone [
7]. Known also as laser beam powder bed fusion (LB-PBF), it has the ability to produce relatively large parts with good mechanical properties [
8] and higher dimensional accuracy [
9], especially compared with nozzle-based polymer deposition systems [
10]. Moreover, the advantage of freedom design in components and production, afforded by the nature of the SLS process, enables the effective handling of internally nested shapes without extra supporting structures and the possibility to print multiple parts in the same volume [
11]. In this respect, it is worth mentioning that Polyamide 12, also called by the acronym PA12, is an environmentally friendly polymer widely used for sintering applications due to its easy melting using lasers, compared with other polymers [
12,
13,
14,
15,
16,
17,
18]. In its bulk form (i.e., powder), it can be found under different commercial names, from which the most popular are PA 2200 (from EOS, Krailling, Germany), Duraform PA (from 3D-Systems, Rock Hill, SC, USA), or Nylon 12 (from Formlabs, Somerville, MA, USA).
Data reported in the literature reveals that the mechanical properties of PA12 manufactured by SLS may vary broadly depending on the process parameters and the anisotropy, the latter being directly linked to the particular direction about which the 3D build orientation was carried out. As recently highlighted well in the paper [
19] published by Lammens et al., the PA12 SLS material response to tensile loading and the specific issues related to acquiring qualitative and reproducible results are critically analyzed, emphasizing the effects of material anisotropy. The specimens were manufactured with an EOS P 395 printing platform from PA2200 powder using a mixture recycled/virgin ratio of 50/50 and an alternate x–y scanning pattern. Based on digital image correlation and post-processing of standard tensile tests, accurate strain measurements within the elastic-plastic range up to the final failure were obtained. Their results proved a significant viscous contribution in the isotropic elastic response with orthotropic failure properties.
Earlier studies in PA12 sintering have tried to analyze and compare the directional mechanical properties of test specimens [
20,
21,
22,
23]. The pioneering work of Ajoku et al. [
22] is particularly relevant to the topic under discussion here since it addresses the effects of building orientation on the mechanical properties of AM PA12 SLS under tensile, compression, and three-point bending tests. The specimens manufactured using virgin powder were produced with a laser-sintering machine (3D Systems Vanguard SI), about three distinct orthogonal build orientations about x-, y- and z-axes relative to a fixed x-printing direction were tested to assess their directional strength and stiffness response under static loading conditions. By looking specifically at their bending response results, a maximum difference of 9.4% in the ultimate strength and 7% in the flexural elasticity modulus was reported. However, neither characteristic stress-strain curves nor load-deflection plots intended to characterize graphically the directionally dependent nonlinear material response were provided. All the same, they described in detail the so-called end-vector-effect, which typically occurs due to different degrees of laser beam exposure between the start and the end of each sintered scan layer. Essentially, according to authors, it occurs for thin sections whose dimensions along printing direction are small, as the short bursts of energy experienced at the turning points lead to sintered parts that are much more dense at the boundary surfaces than to the core regions. Caulfield et al. [
23] studied the effects of energy density level (which combines the influences of laser power magnitude with the hatch spacing and beam speed) within the SLS process on the mechanical response of polyamides manufactured using a DTM Sinterstation 2500
plus with DuraForm TM Polyamide powder. No information about the powder mixing ratio (recycled to virgin) was specified. They concluded that the specimens manufactured using high energy density levels exhibit a more ductile behavior than those obtained at low energy densities. Variations of mechanical properties and the specific failure modes of AM specimens built along 0° and 90° orientations (i.e., x- and z-axes) were also addressed in their work, emphasizing the results of standard tensile test data. Greater elasticity modulus and tensile strength values were reported along the primary x-axis than the secondary z-axis. In addition, the yield strength of specimens of 90° orientation exhibit a pronounced dependence on the energy level than the specimens with 0° orientation. For the broad range of energy density tests, it was concluded that the specimens built with 0° orientation had less elongation at fracture, and higher ultimate tensile strength relative to specimens with 90° build orientation.
More recently, Hofland et al. [
24] used the PA 2200 powder with a recycled/virgin mixture ratio of 50/50 to manufacture specimens with 0° and 90° build orientations. Based on their standard tensile tests carried out according to ISO-527-2, they demonstrated that the directional dependence of mechanical properties becomes more pronounced with the increase of energy input. Phillips et al. [
25] have performed three-point bending tests on specimens made of three different additive manufacturing techniques: FDM, SLS, and Polyjet. The SLS specimens were produced in a ProX 500 SLS machine using Duraform ProX PA12 powder with a recycled/virgin mixture ratio of 15/85. Printing direction was alternated layer by layer between the horizontal x and y-axes. Their results indicate that each 3D printing technique produces distinct and asymmetric responses when comparing tension to compression loading regimes. Based on the obtained stress-strain curves, they calibrated some specific material models intended to be used in numerical simulations. However, they did not report any statistical data for bending strength and flexural modulus values.
As briefly reported above, although many works have been completed to date to investigate the mechanical properties of additively manufactured PA12 SLS materials, especially under tensile and/or compression tests, apparently little interest has been given to their anisotropic flexural properties [
26].
Appendix A (see
Table A1) summarizes the most representative flexural properties reported so far in the scientific literature [
22,
27,
28,
29,
30,
31,
32]. It includes relevant information about the SLS platform and powder type, print orientation, laser power magnitude, layer thickness, and not the last, the employed testing standard and specimen dimensions. One should note that the derived AM composites based on PA12 SLS are not included in the table as they are beyond the scope of this study.
Since the directionally-dependent flexural properties are impetuously needed during the structural design phases, the lack of available material data can create technical issues when employing the up-and-coming AM technologies to produce part geometries subjected predominantly to simple bending. In such a context, it is worth mentioning that when a specimen made of longitudinally printed PA12 undergoes bending, failure is not likely to occur within the small deflection range. Thus, the elementary bending theory of beams becomes inadequate due to finite deformations and changes in the directions of reaction forces at the supporting rollers. As far as the authors’ knowledge, neither further references have been found linking the influence of large deflections to the response of PA12 specimens under three-point bending tests, nor empirical research was undertaken on the mechanical behavior of Polyamide material when processed on a benchtop industrial SLS platform (Formlabs Fuse 1) using a Nylon 12 sintering powder.
To address the literature research limitations mentioned above, in this paper, a comprehensive experimental investigation of static bending properties of PA12 specimens made of Nylon 12 sintering powder, and processed with a Formlabs Fuse 1 SLS platform, is considered. On account of this, the effects of flatwise (i.e., 0°), upright (i.e., 90°), and 45° flat-to-upright build orientations on the bending response of PA12 produced by SLS, under the three-point bending test, are considered in line with the effects of large deflections on the experimentally measured bending properties. The main statistical parameters associated with the elasticity modulus in flexure and bending strength, the specific flexural failure modes, and the strength reliability for the build orientations in question will be analyzed.
3. Results
3.1. Load-Deflections and Bending Stress-Strain Curves
Three typical samples of load-deflection curves recorded in the framework of three-point bending tests of flatwise printed PA12 SLS specimens are shown in
Figure 3a, whereas several curves acquired for the 45° flat-to-upright and upright built specimens are presented in
Figure 3b.
As may be seen, for the flatwise built oriented specimens, the maximum deflection exceeded 12 mm, which is considerably larger than the thickness of the specimen. On the contrary, the 45° flat-to-upright and the upright orientated specimens failed at much lower bending deflections of approximately 2 to 4 mm. Moreover, since large flexural deflections are sustained without fracture, a considerable shifting movement of flatwise printed specimens at the cylindrical supports was observed during each bending test.
In the figures above, the difference between the shapes of flexural load-deflection curves obtained for each specific build orientation (i.e., flatwise, 45° flat-to-upright, and upright) of PA12 SLS material under analysis may be distinguished. Thus, in the case of flatwise oriented specimens, the applied load is almost linearly proportional to the deflection only in the initial loading stage (see
Figure 3a). Then the curve becomes nonlinear, and the load reaches its maximum in a plateau region, with an average maximum value of 80 N corresponding to a deflection of 10 to 12 mm. Although such a plateau signifies the occurrence of excessive plasticity, it finishes suddenly at a knee point that identifies the onset of specimen shifting upon the cylindrical supports of the three-point bending fixture. Next to the knee point, the load-deflection curve exhibits another steep trend increase followed by a leveling off and a slight decrease, indicating a new level of plasticity during the specimen shifting regime. After stopping the test, the specimen deflection recovered rapidly with about 60–70% from the maximum deformation.
A completely different response was exhibited by the specimens built with 45° flat-to-upright and upright orientation (see
Figure 3b). That is, the 45° flat-to-upright specimens display a load-softening behavior with a primarily nonlinear elastic ascending branch up to the first flexural cracking load (equal to an average of 35 N reached at a deflection about half the specimen thickness). At this point, a sudden drop of load occurs (of 10% to 30%), followed by a slightly ascending post-elastic step region with all subsequent load values smaller than the first critical one. Then, a final descending trend until the final fracture (occurring at an average deflection value less than 5 mm) closes the curve. On the other hand, the upright specimens show a typical load-hardening behavior, with an initial nonlinear elastic ascending branch up to the first cracking load (equal to an average of 30 N at a deflection value which equals about the specimen thickness), identified through a slightly sudden drop of load (of 5% to 10%), followed in a first instance, by an ascending post-elastic region with a maximum load higher than the first critical one. Subsequently, it decreases smoothly until the final bending fracture (corresponding to an average deflection of 7 mm).
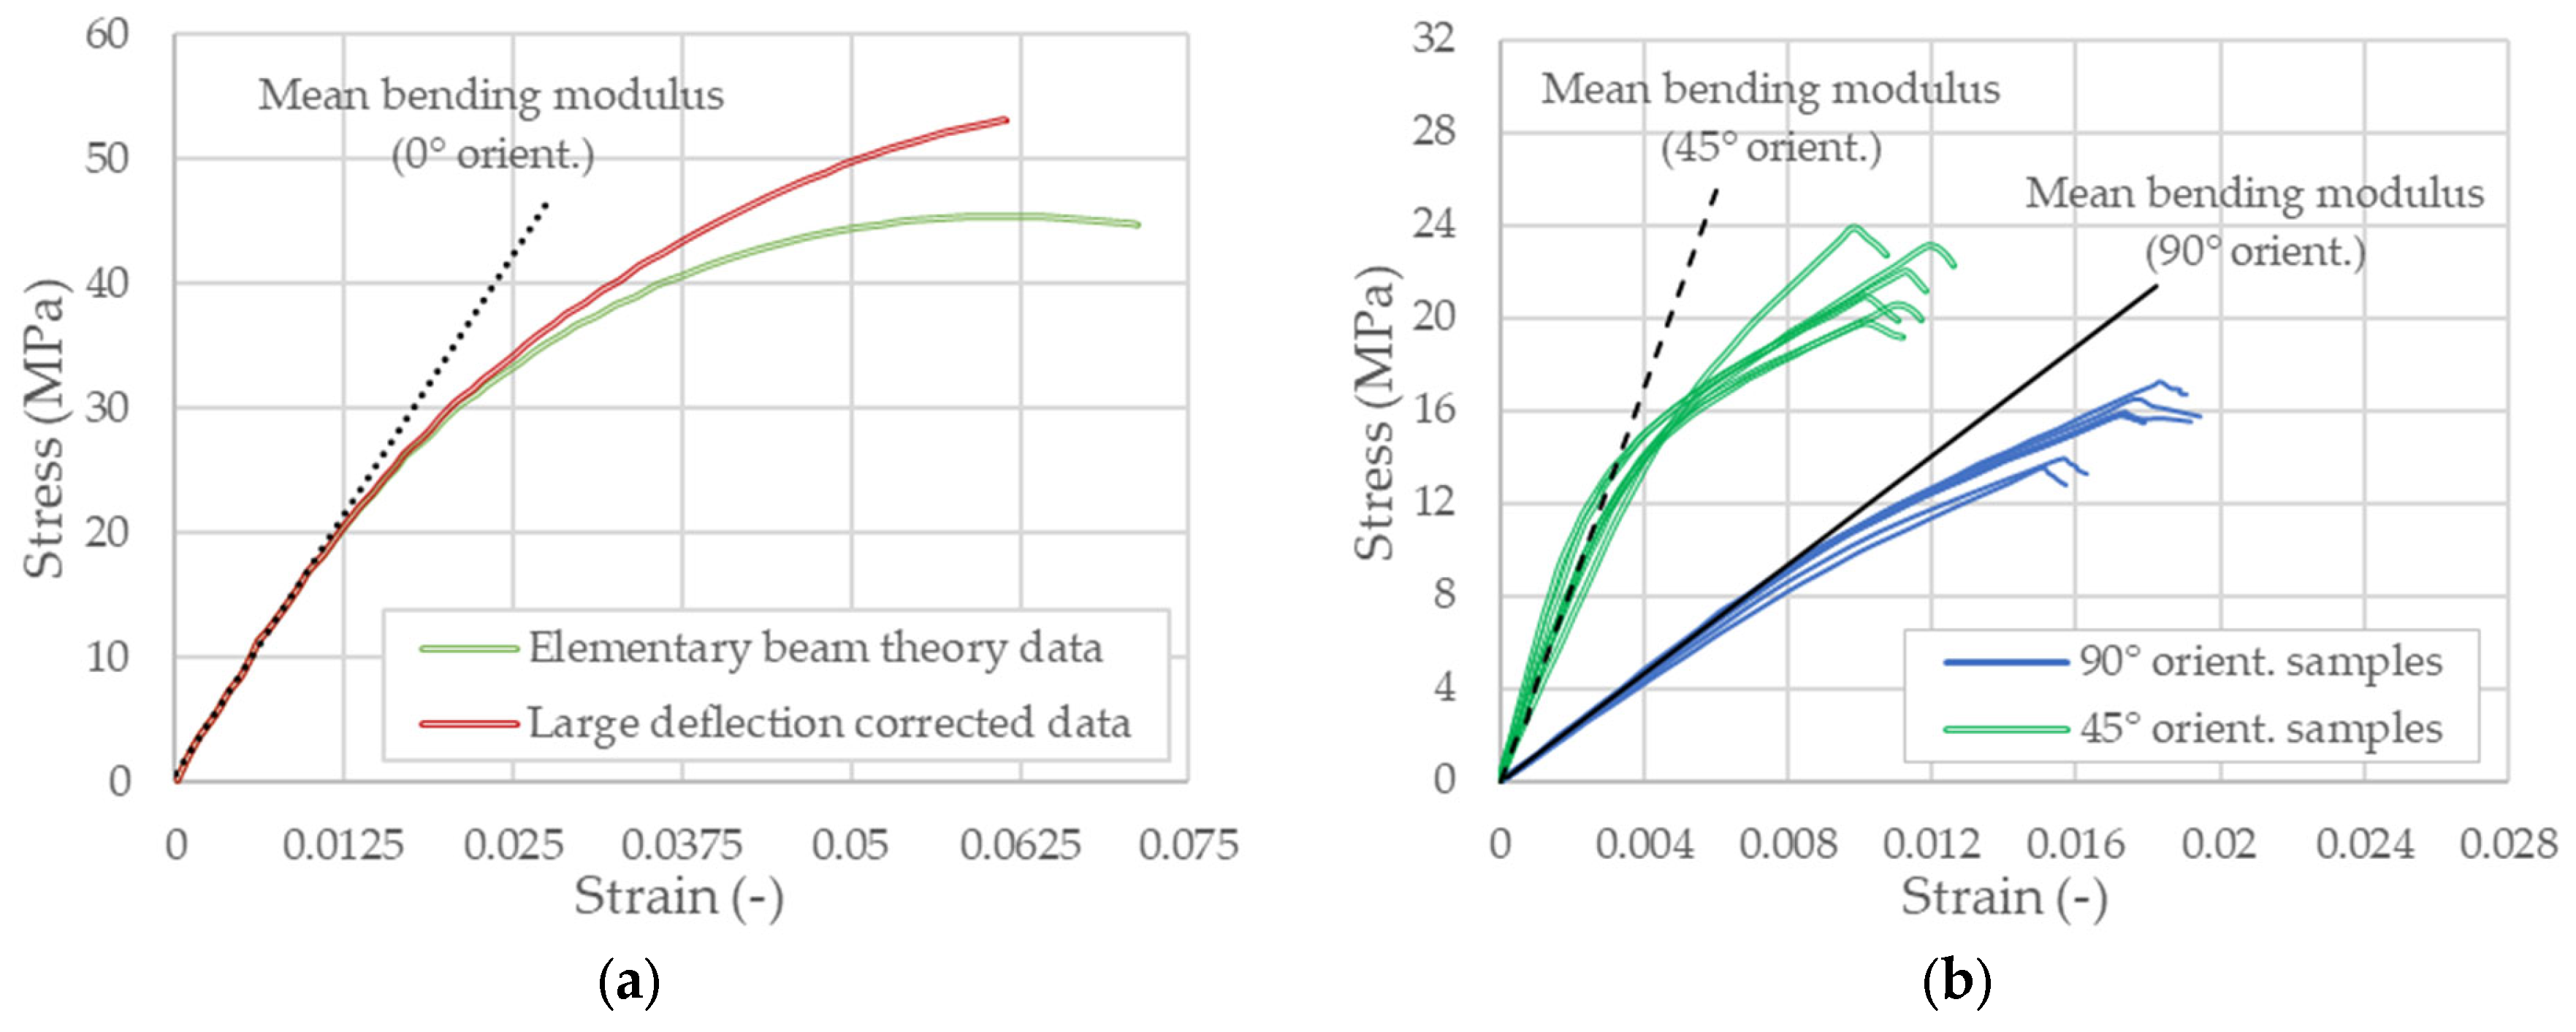
Equation (2) was employed to obtain the strain from the deflection based on the elementary beam theory. However, the influence of large displacements on both the strain and bending stress was considered using Equations (3) and (4).
Figure 4a shows the typical
and
curves obtained for a flatwise PA12 specimen. These curves are similar in the small strain region, while the discrepancy between the results becomes significant in the large strain region.
Figure 4b shows all the three-point bending stress-strain curves obtained for both 45° flat-to-upright and upright specimens. Since the strains are typically minor, no differences exist between the elementary beam theory results and those based on the large displacement formulation. However, a significant difference in the stiffness response can be observed, with a lower value but a minor deviation from linearity up to the fracture onset in the case of upright oriented specimens compared to the specimens built with 45° flat-to-upright orientation.
Directly related to the shape of load-deflection curves reported above, the characteristic failure modes for the build orientations of PA12 SLS in the adopted three-point bending test conditions are shown in
Figure 5.
As for the three-point bending tests performed on flatwise build orientated specimens indicated in
Figure 5a, it is worth noting that no fracture was observed in these specimens, even for excessive deflections. Such a non-breakability was not reported so far; nonetheless, some dissimilarities against the data reported in literature could result from different printing parameters. More remote, all the specimens having 45° flat-to-upright and upright building orientation underwent a much smaller deformation at failure, indicating a reduced ductility and a fracture plane that follows the layerwise microstructure of the two involved printing directions (see
Figure 5b,c).
3.2. SEM Evaluation
Scanning electron microscopy analysis was employed using an SEM Hitachi S-3400 N type-II (Hitachi, Tokyo, Japan) to determine the specific micro-mechanisms of failure and, particularly, the existence of printing flaws that could condition the three-point bending test results.
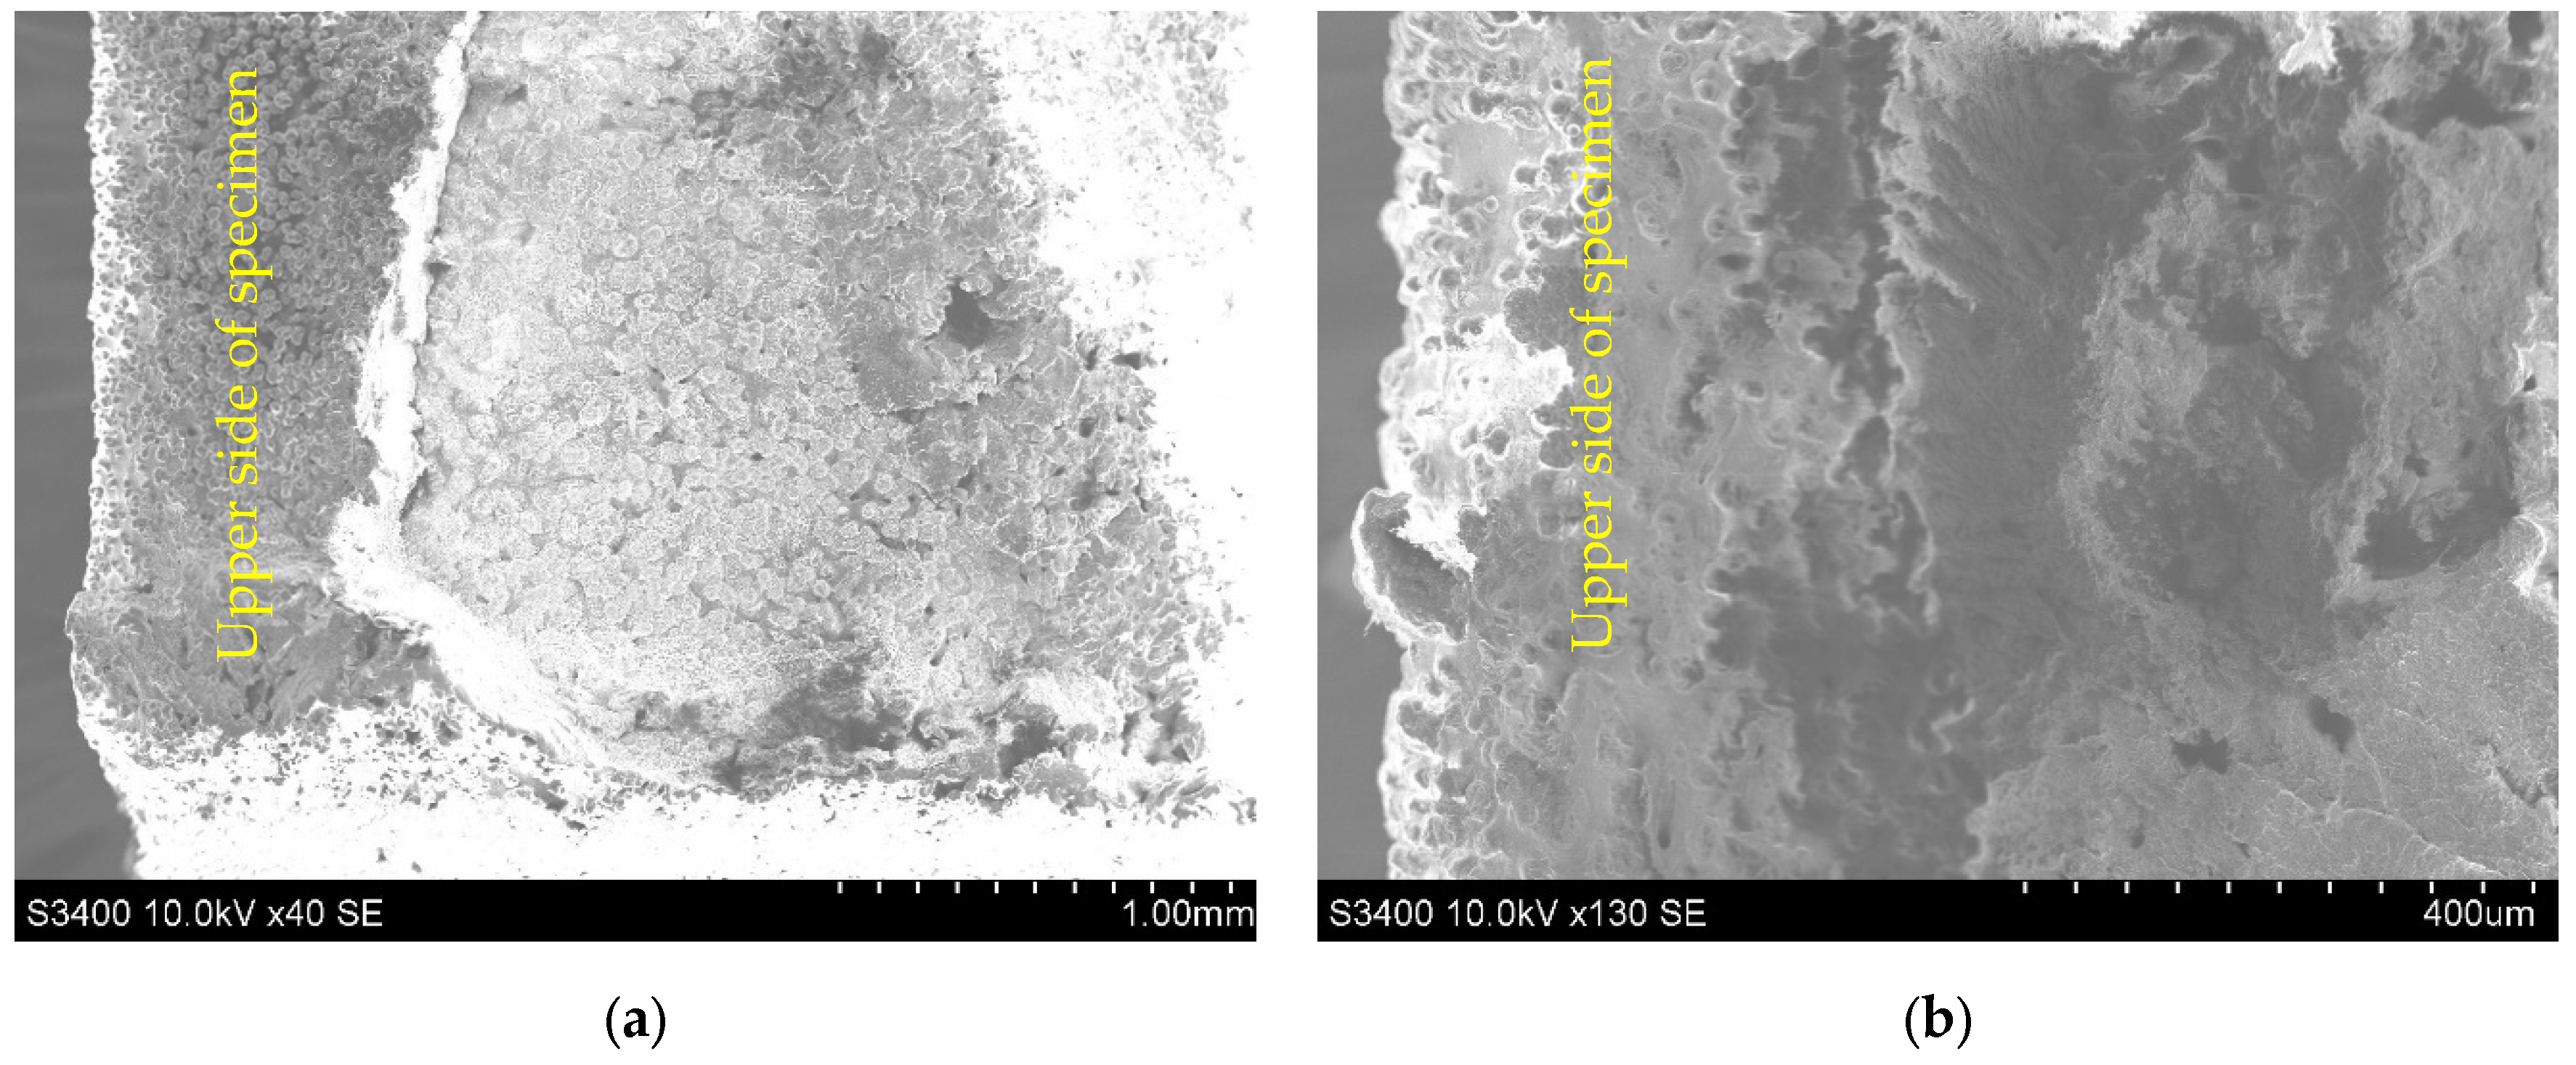
Figure 6 shows the SEM images acquired from the lateral side of a flatwise oriented specimen in the permanent deformed state obtained after stopping the bending test. Due to the specimen retraction back when removing the applied load, only the state of permanent deformation was seized, as the elastic portion of the strain is being recovered.
As with static flexure loading, the flatwise oriented specimens under the three-point bending test show that the midspan region near the bottom tension area (see
Figure 6a) has a different and relatively rougher surface compared to the upper compressed region (see
Figure 6b). Moreover, there is evidence of increased delamination in the tension area instead of the compressed one that typically distorts like a plissé shade or accordion on the microscopic images.
The relatively smooth fracture surfaces of X45 flat-to-upright and upright standing specimens exhibit nearly similar fractographic features (see
Figure 7a,b). In particular, in the case of X45 flat-to-upright specimens, a cleavage step fracture occurs, which indicates a composite underwent quasi-brittle fracture.
As shown in
Figure 7b, at high resolution, it is confirmed that bending induces craze formation followed by tearing of the ligaments. On the other hand, the intergranular fracture between layers predominantly took place, and the granulated nature of PA12 SLS micro-structure is displayed, with the sizes of granules being similar with that of the original powder. These types of directionally-dependent fracture behavior under different loading conditions have also been observed in other PA12 AM materials processed via selective laser sintering [
15,
28,
42,
43].
3.3. Bending Strength and Flexural Modulus
The obtained results of bending strength and modulus of elasticity in flexure for the three particular build orientations of PA12 SLS are reported in
Table 1. The following statistical descriptive parameters were calculated with SPSS software according to ESDU 91041b [
44]: the mean value, the two-sided 95% confidence interval for the mean value, the standard deviation, and the coefficient of variation. One sample was excluded from the analysis as an extreme outlier for each build orientation in question.
The XY orientation (flatwise) showed the highest bending strength among the three tested build-orientations, while the lowest average bending strength value was obtained for the ZY orientation (upright standing). The highest flexural modulus was achieved by the 45X orientation (flat-to-upright). The ZY orientation (upright standing) had the lowest mean value of flexural modulus of elasticity. The highest statistical dispersion of bending strength, expressed by the coefficient of variation, was obtained for the ZY orientation (upright), while the highest dispersion of flexural modulus was obtained for the 45X orientation (flat-to-upright).
Kolmogorov-Smirnov and Shapiro-Wilk tests were performed to measure the probability that each build orientation sample of PA12 SLS comes from a population with normal distribution [
45]. In this endeavor, the values of K–S and S–W statistics in line with their related significance levels (
p) were determined to establish the compliance of test results with a normal distribution. The following statistical assumptions were considered: the level of significance (
), the null hypothesis H0: i.e., the population of the dependent variable from which the samples were extracted follows a normal distribution (for
), and the alternative hypothesis Ha: i.e., the population from which the sample was extracted does not follow a normal distribution (for
).
Table 2 summarizes the results of the normality check performed in SPSS. It can be observed that both the Kolmogorov-Smirnov test and the Shapiro-Wilk test data suggest that bending strength and flexural modulus follow a normal distribution for each build orientation of PA12 SLS under analysis.
In the next stage, a one-way analysis of variance (ANOVA with one variable) was carried out to study the strength and elasticity statistics of PA12 SLS under three-point bending tests. In particular, Levene’s test was employed to analyze the homogeneity of variance within the three build orientations groups for each dependent variable. Virtually, the null hypothesis H0 assumes that the variances in the three orientation groups are homogeneous (p > α), while they are heterogeneous for the alternative hypothesis Ha, (p < α = 0.05). The results related to bending strength variable indicate homogeneous variances in the three orientation groups (p = 0.218 > α = 0.05), whereas the data calculated for the modulus of elasticity in flexure return the heterogeneity of variances (p = 0.003 < α = 0.05) between the groups (based on the mean and trimmed mean values). In addition, the ANOVA test results show that the level of probability between the building orientation groups for both dependent variables (p < α = 0.05) rejects the null hypothesis and supports the alternative one (i.e., at least two mean values differ from each other).
Although the ANOVA test shows the overall significance of three-point bending test results, it does not specify where the actual differences lie. Therefore, after running the ANOVA one-way analysis, Tukey’s HSD and Games-Howell tests have been considered to evaluate which mean value of the three build orientation groups (compared with each other) are different as it compares all possible pairs of means. Reasonable differences between the results of bending strength and flexural elasticity modulus were obtained for the assumed significance p-level of 0.05.
3.4. Reliability of Bending Strength
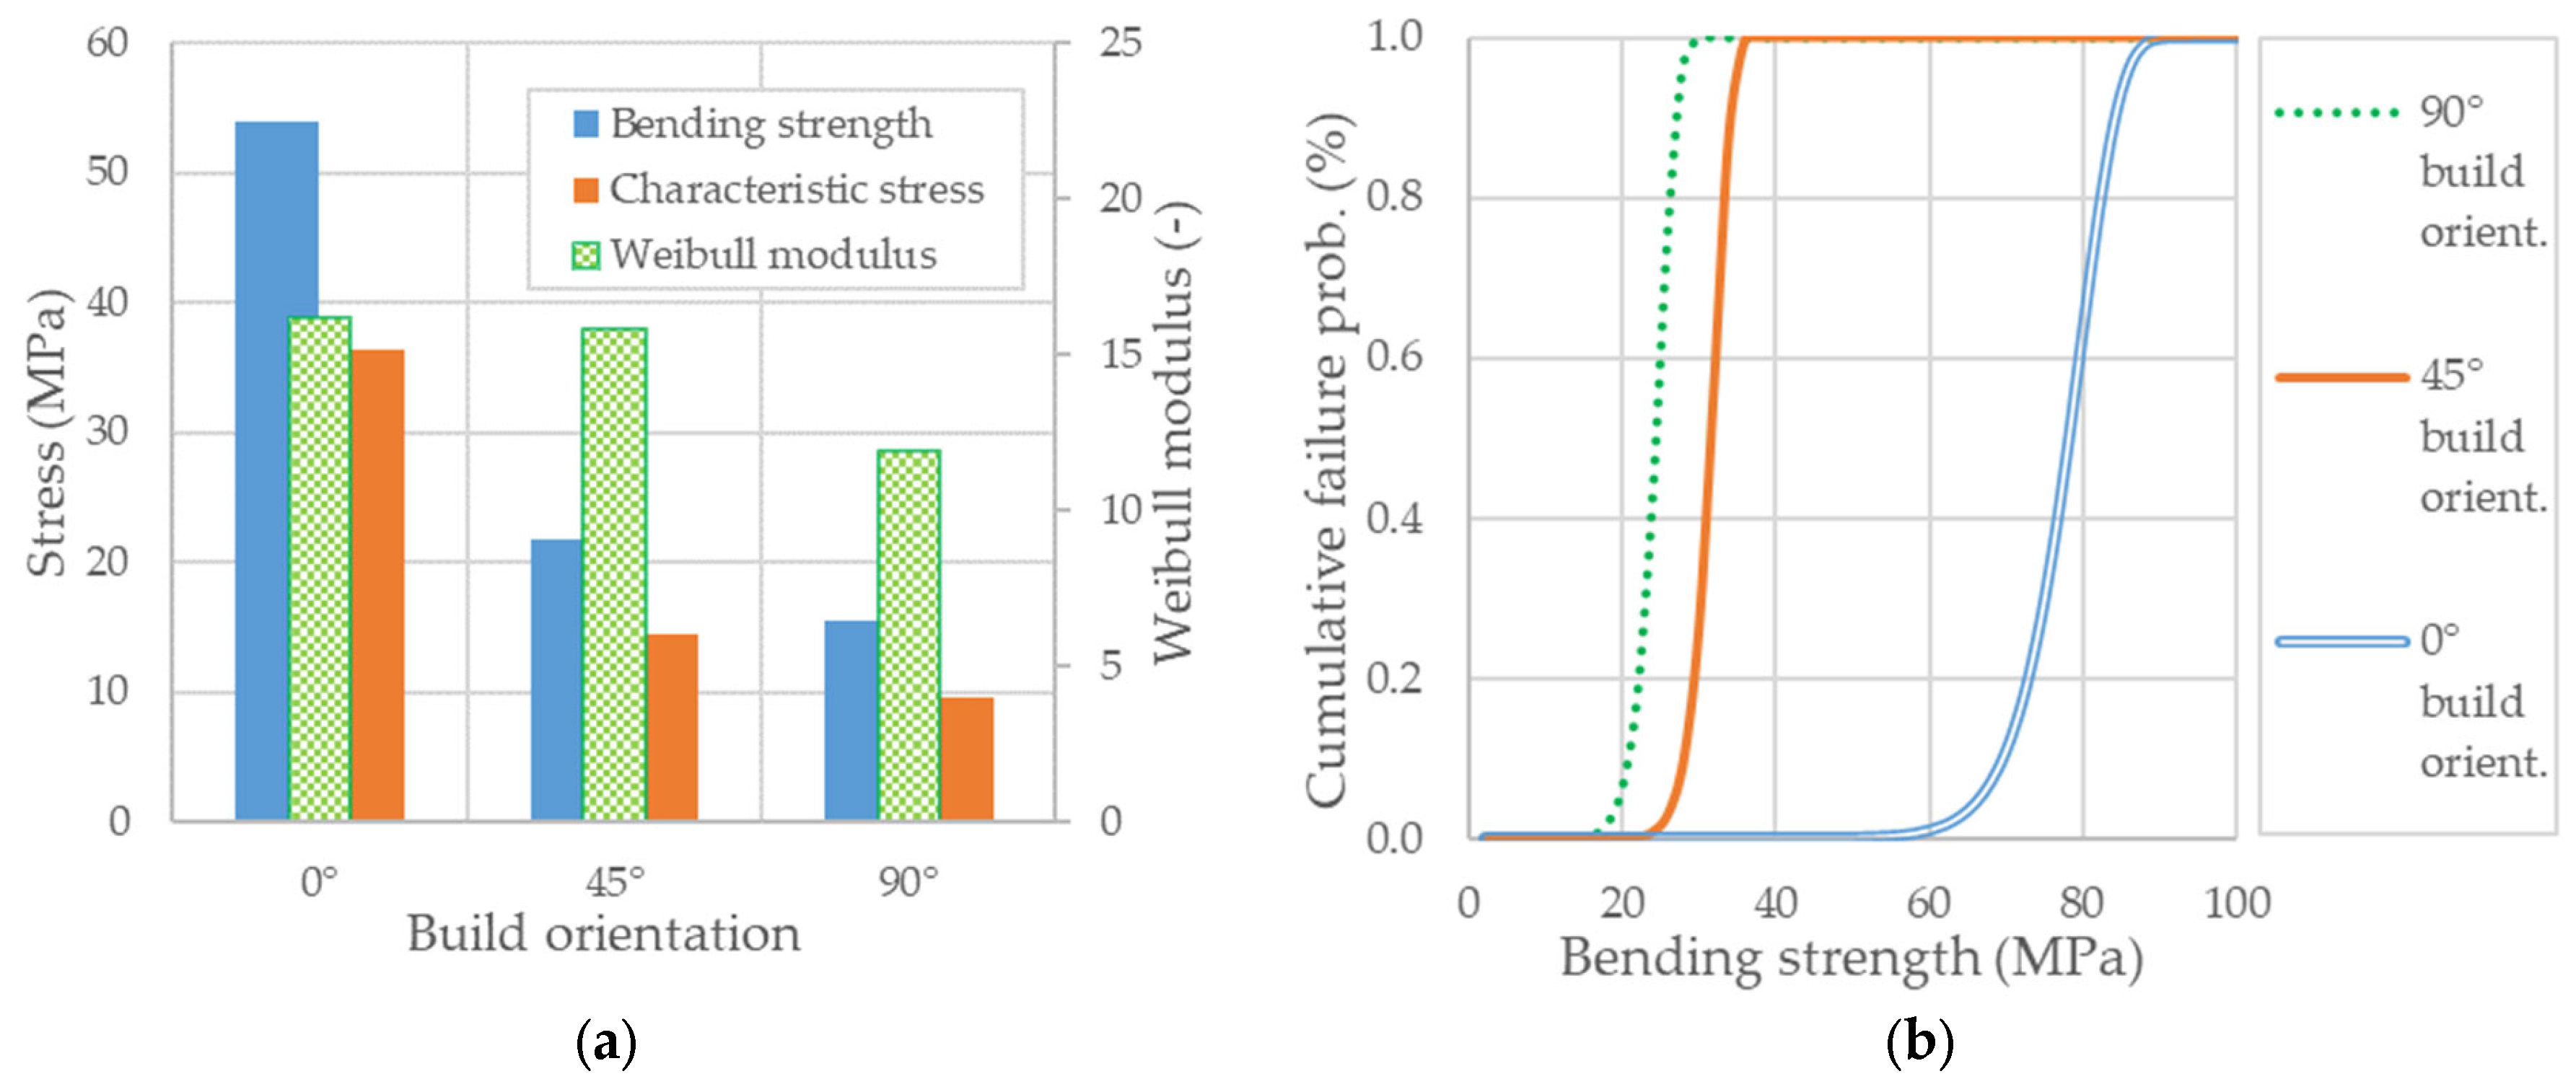
The Weibull moduli and the values of characteristic strengths obtained through the linear regression analysis are shown in
Figure 8. The best-fit straight lines with the slightest errors measured on the ordinate axis return the data necessary to evaluate failure probabilities for each additively manufacturing build orientation in question.
In the above figure, one may notice that the experimental data related to flatwise oriented specimens, calculated by incorporating the effects of large displacements, exhibits the highest Weibull modulus of 16.2 with a correlation coefficient of 0.93. It appears that, for this orientation, the large deflection corrected data shows the lowest dispersion of bending strength. On the other side, the lowest Weibull modulus of 11.9 with a correlation coefficient of 0.93 was determined for the case of upright build orientation. However, the differences between the Weibull modulus of flexural strength for the three tested PA12 build orientations were not very large but pretty significant as the difference between the highest and the lowest value equals 4.3.
4. Discussion
The commercial datasheet of Nylon 12 material property data provided by the manufacturer of the presently used 3D printer machine specifies some reference values for the ultimate tensile strength, bending strength, and flexural elasticity modulus, regardless of a particular build orientation or powder refresh rate. Neither specific printing parameters nor details regarding the testing conditions are recommended to benchmark these testimonial values. However, it is apparent that the flexural strength performance of SLS printed Nylon 12 is superior to its tensile strength. In point of fact, this difference seems reasonable as it could be associated with internal flaws that are prone to occur within the additively manufactured parts or specimens. It is known that in the selective laser sintering process, small interface gaps often arise due to uneven heat distribution, lack of an adequate laser power supply, and/or inadequate temperature control. Besides, from the point of view of test specificity, while only half of the specimen experiences tension when undergoing bending loads, it carries out tension over the entire cross-section area in the case of standard tensile testing, which implies an increased probability of internal flaws, resulting in more likely failure initiation locations, and consequently, a lower value of tensile strength. In this regard, one should also note that compared to the standard tensile tests, which typically provide essential information about the mechanical behavior of metals, the bending tests are specifically more helpful in predicting the mechanical properties and failure modes of AM polymeric materials, especially for those designed to carry and transfer the out-of-plane loads. All the same, it turned out that most of the studies so far have focused on the tensile properties of AM PA12 SLS [
19,
20,
21,
23,
24,
43]. In particular, the three-point bending test seems to have significant advantages compared to the ordinary tensile test because it uses smaller coupons that are easier to handle, requires less time to test, lower testing machine capability, and not least, additional tabs are not needed to prevent the possible damages at the clamping grips [
46]. On the other hand, it has the disadvantage that the applied load acts at the midspan of the specimen resulting in a spatially complex stress state, which is rather undesirable from the point of view of results interpretation.
Once the three-point bending static responses of Nylon 12 (PA12) laser sintered specimens were obtained experimentally, their benchmarking with the representative reference data from the scientific literature is rational. Thus, following a systematic and up-to-date literature review, the available bending properties corresponding to different printing parameters of PA12 SLS produced specimens are reported in
Appendix A (
Table A1). Based on the data presented in this table, some differences in bending strength and flexural elasticity modulus may be observed from one study to another. Nevertheless, a direct link between the values cannot be made due to the technological heterogeneity of the employed SLS platforms as well as different printing variables such as energy level, layer thickness, printing speed, and the volume ratio of reused to virgin powder. On top of that, due to the apparent lack of directionally dependent data in this review table, a need was felt to investigate the effect of building orientation on the flexural properties of PA12 specimens, additively manufactured using a benchtop industrial SLS platform (Formlabs Fuse 1), as it has not yet been studied so far. Hence, three-point bending tests were conducted to provide valuable insights into their strength and stiffness performance under the combined influence of tensile, compression, and shear stresses.
There is a significant build orientation-dependent anisotropy in bending strength and flexural elasticity modulus. The X45 flat-to-upright specimens consistently performed the best in terms of modulus of elasticity in flexure. In contrast, the flatwise-oriented specimens showed superior bending strength but a low modulus elasticity in flexure compared to X45 flat-to-upright specimens. The weakest values of both bending strength and modulus of elasticity in flexure were obtained for the upright standing oriented specimens. This behavior is the apparent consequence of the layered-like additively manufacturing approach as it comes with the so-called intra- and inter-layer powder packing capabilities along with the specific printing parameters of any selective laser sintering process [
19,
22,
27,
30,
47,
48]. That is, for relatively short scanning vector lengths, the subsequent adjoining 3D printed lines fuse firmly together within the same layer of sintered material and lead to an adequate intra-layer powder packing, as they do not have enough time to cool down before fusing a new line. As the length of the scanning vector increases, the time for cooling down may become large enough to generate an inappropriate intra-layer powder packing. After all, the time required to start processing a new layer is generally sufficient to allow for a certain degree of solidification in the previously completed underlayer, resulting in the formation of small interface gaps due to poor bond adhesion between the superimposed layers. These interface gaps between the subsequent sintered layers were also called “grooves” by Coy et al. [
27], as they act as stress risers that create potential weak areas and, consequently, lead to inter-layer powder packing difficulties. In this regard, one may recognize that the directionally dependent anisotropy of elasticity modulus in flexure can be mainly attributed to intra-layer powder packing difficulties in the horizontal plane, while the bending strength dependent anisotropy is owing to the aversive effects of inter-layer powder packing in the vertical plane. Thus, by orienting the specimens at 45° simultaneously avoids both the weak orientation of the inter-layer interface against the main direction of normal stresses, as observed in the upright standing specimens and, the unfavorable influences of poor intra-layer powder packing in the horizontal plane, as it was particularly distinguished in the flatwise manufactured PA12 specimens. However, the mean value of bending strength for X45 flat-to-upright specimens is significantly lower than that obtained in the case of flatwise manufactured specimens.
Although both the load-deflection and stress-strain curves obtained under three-point bending loading conditions provide essential information about the mechanical behavior of additively manufactured PA12 SLS materials, previous publications omitted to present in detail these diagrams. Thus, it was shown that the general trend of bending stress-strain curves differs quite a lot from the actual tensile stress-strain curves reported in the literature. This observation confirms both the thesis of an accentuated anisotropy in bending compared to pure tensile loading as well as the fact that the directional dependence of bending properties is robustly imparted by the printing build orientation rather than a specific behavior of PA12 raw material. In this regard, for the case of flatwise oriented specimens, comparisons have shown that the elementary beam theory as per ISO 178 [
36] gives significantly lower bending strength predicted values than those determined by the equation provided by ISO 14125 [
37] owning to large deflection effects. Contrarily, the bending stress-strain curves of X45 flat-to-upright and upright oriented specimens are not sensitive to the effects of geometric nonlinearities. Nevertheless, the deflection does not influence the measurement of bending elasticity modulus.
One-way factorial analysis of variance (ANOVA) and post hoc tests were carried out to statistically analyze the bending strength and modulus of elasticity in flexure for the three build orientation groups of PA12 SLS specimens (i.e., 0° flatwise, 45° flat-to-upright and 90° upright standing, respectively). The normal distribution of variables was assessed through Kolmogorov-Smirnov and Shapiro-Wilk tests. All data were normally distributed and expressed as the mean plus/minus standard deviation, with a value of
p less than 0.05 considered statistically significant. In addition, Tukey HSD was used to identify if one mean value differs significantly from another. Although the method is not statistically robust, being sensitive to the condition that the mean values must follow a normal distribution, many researchers claim it is meaningful since it avoids Type II errors (i.e., reject the equality when they are not different) [
49]. In order to ensure that there is complete equality in the variances of the differences among the variations of related groups, Levene’s test was considered as is commonly utilized to examine the plausibility of homoscedasticity for data from at least three samples [
50].
In general, the polymeric AM materials exhibit significant scattering of mechanical properties data, and therefore it is difficult to determine reliable bending strength values only by testing several independent specimens. In this respect, the presence of printing flaws in AM PA12 SLS specimens suggests the employment of a two-parameter Weibull equation, which allows predicting failure probability in terms of Weibull modulus and characteristic strength. While the former can be seen as an intrinsic material property associated with the width of data distribution and consequently describes the scatter of its bending strength, the latter is a scale parameter intended to measure the strengths of different orientations of AM PA12 SLS material, tested under similar conditions.
For the three particular PA12 SLS build orientations under discussion here, the calculated Weibull moduli and characteristic strengths are believed to have representative values under the reserve of unchanged printing parameters specified in
Section 2.1. Indeed, it needs to keep in mind that the bending response of such materials may vary significantly depending on the process conditions, platform type, the source of PA12 powder, and not the last, the finishes of part surfaces.
The previous section showed that with the change of build orientation from 90° to 0°, the Weibull modulus appears to be on a growth trend (see also
Figure 9a). Thus, a higher value indicates a lower strength dispersion, which means that the three-point bending fracture mechanism is transiting from ductile in the case of flatwise built orientation to quasi-brittle for upright standing oriented specimens. Such a response is desirable as the AM build orientations that exhibit large Weibull moduli are more predictable and less likely to break at much lower stress than the measured mean values. Moreover, as
Figure 8 illustrates, according to decreasing strength, the parameters
(i.e., the Weibull modulus) and
(i.e., the characteristic strength) appear to be correlated, meaning that the lower bending strength exhibits less scatter, which shows a more consistent—or a more uniform—flaw population. For all that, the validity of the Weibull approach can be proved by verifying its ability to scale the strength values obtained for a particular testing configuration to another one or a different specimen size. It is beyond the scope of this work to address this issue, but its implications in terms of probabilities of failure for the case of AM parts made of PA12 SLS are worth being further explored. Despite this, a straightforward application is best illustrated in
Figure 9b, which displays the cumulative failure probability distribution as a function of the characteristic stress according to the analytical expression (A6).
As the characteristic strength in
Figure 9a indicates the location of the cumulative distribution function relative to the abscissa axis one may expect its movement along, depending on the specimen size or testing procedure, due to a relevant change in the highly stressed volume of material. Since the structural design methodologies for AM parts made of PA12 SLS materials may require specific information relative to a certain level of failure probability as a function of the characteristic stress, such a procedure based on Weibull statistics could provide an appropriate and valuable solution.
5. Conclusions
There is a significant build orientation-dependent anisotropy in bending strength and flexural elasticity modulus. The X45 flat-to-upright specimens consistently performed the best in terms of modulus of elasticity in flexure. Contrarily, the flatwise-oriented specimens showed superior bending strength but a low modulus elasticity in flexure relative to X45 flat-to-upright specimens. The weakest values of both bending strength and modulus of elasticity in flexure were obtained for the upright standing oriented specimens.
The directionally dependent anisotropy of elasticity modulus in flexure can be attributed mainly to intra-layer powder packing difficulties in the horizontal plane. Quite the reverse, the bending strength-dependent anisotropy appears to be directly linked to the aversive effects of inter-layer powder packing in the vertical plane.
The general trend of bending stress-strain curves relative to the build orientation differs quite a lot from the actual tensile stress-strain curves reported in the literature. This observation confirms both the thesis of an accentuated anisotropy in bending compared to pure tensile loading as well as the fact that the directional dependence of bending properties is robustly imparted by the build orientation rather than a specific behavior of PA12 raw material.
In the case of flatwise oriented specimens, comparisons have shown that the elementary beam theory gives significantly lower bending strength predicted values than those considering the effect of large deflections.
Nylon 12 SLS exhibit significant scattering of mechanical properties data, and therefore it is difficult to determine reliable bending strength values only by testing several independent specimens. In this respect, the presence of printing flaws in AM specimens made of PA12 SLS suggests the employment of a two-parameter Weibull equation, which allows predicting failure probability in terms of Weibull modulus and characteristic strength.


