1. Introduction
Polyampholytes (PAs) are polymers carrying positive and negative charges along their sequence. Most proteins are PAs. There is a special class of proteins which does not have a well-defined ground state. These intrinsically disordered proteins (IDPs) [
1] are well-described by PA models [
2,
3]. The PAs-IDPs analogy also holds for disordered sequences in proteins with intrinsically disordered regions (IDRs) [
4]. In high salt conditions, as implicitly considered below, or for large net charges, polyampholytes adopt open configurations provided their backbone is not too hydrophobic. The presence of charges of both signs along the sequence confers a specific translocation behavior to PAs and IDPs compared to the more widely studied polyelectrolytes [
5,
6,
7,
8,
9,
10,
11], e.g., DNA, carrying negative charges only.
In nature, charged polymers (proteins, RNA) are imported in or exported from the cell nucleus by translocation through a nuclear pore [
12]. Nuclear translocation is promoted by helpers [
13] (importins, exportins) acting on (binding to) specific subsequences (labels) and is highly selective. Translocation through a single pore has been implemented in the laboratory [
8], where translocation is typically driven by an electric field, mainly to study DNA sequence.
The pores found in nature are classified into two types depending on their structure: symmetric ones such as porins, and asymmetric ones such as
-hemolysin and porin F (OmpF).
-hemolysin is related to diseases such as staphylococcus infection and is widely used for in vitro experiments. Typically such experiments apply electric potentials much larger than the cell transmembrane potential of ∼50–70 mV.
-hemolysin is a heptamer associated around the pore axis and its axial structure is rather complex (see
Figure 1a). It has a (positively) charged
cis protrusion, which favors the presence of (negatively) charged biopolymer sequences in the vicinity of the pore entry. The
trans edge is negatively charged. Two regions, the
cis vestibule and a
trans channel stem, are separated by a narrow constriction, about 3 nm long and 1 nm wide, which is essentially polar. Translocation dynamics of negatively charged particles [
14] and polymers (polyelectrolytes) through the
-hemolysin has been addressed [
15,
16,
17]. Simulation studies include the influence of pore charge [
18], heterogeneity in charge distribution [
19], polymer rigidity [
20], solvent conditions [
21] and temperature [
8].
The structure of the
-hemolysin pore is known at the scale of single residues. Realistic numerical simulations have been undertaken to elucidate the pore conductivity for small ions (Na
, K
, Cl
) especially for
-hemolysin, which is an asymmetric pore. The equilibrium concentrations of the salt ions along the pore axis were recorded and the associated free energy profile was obtained in [
22,
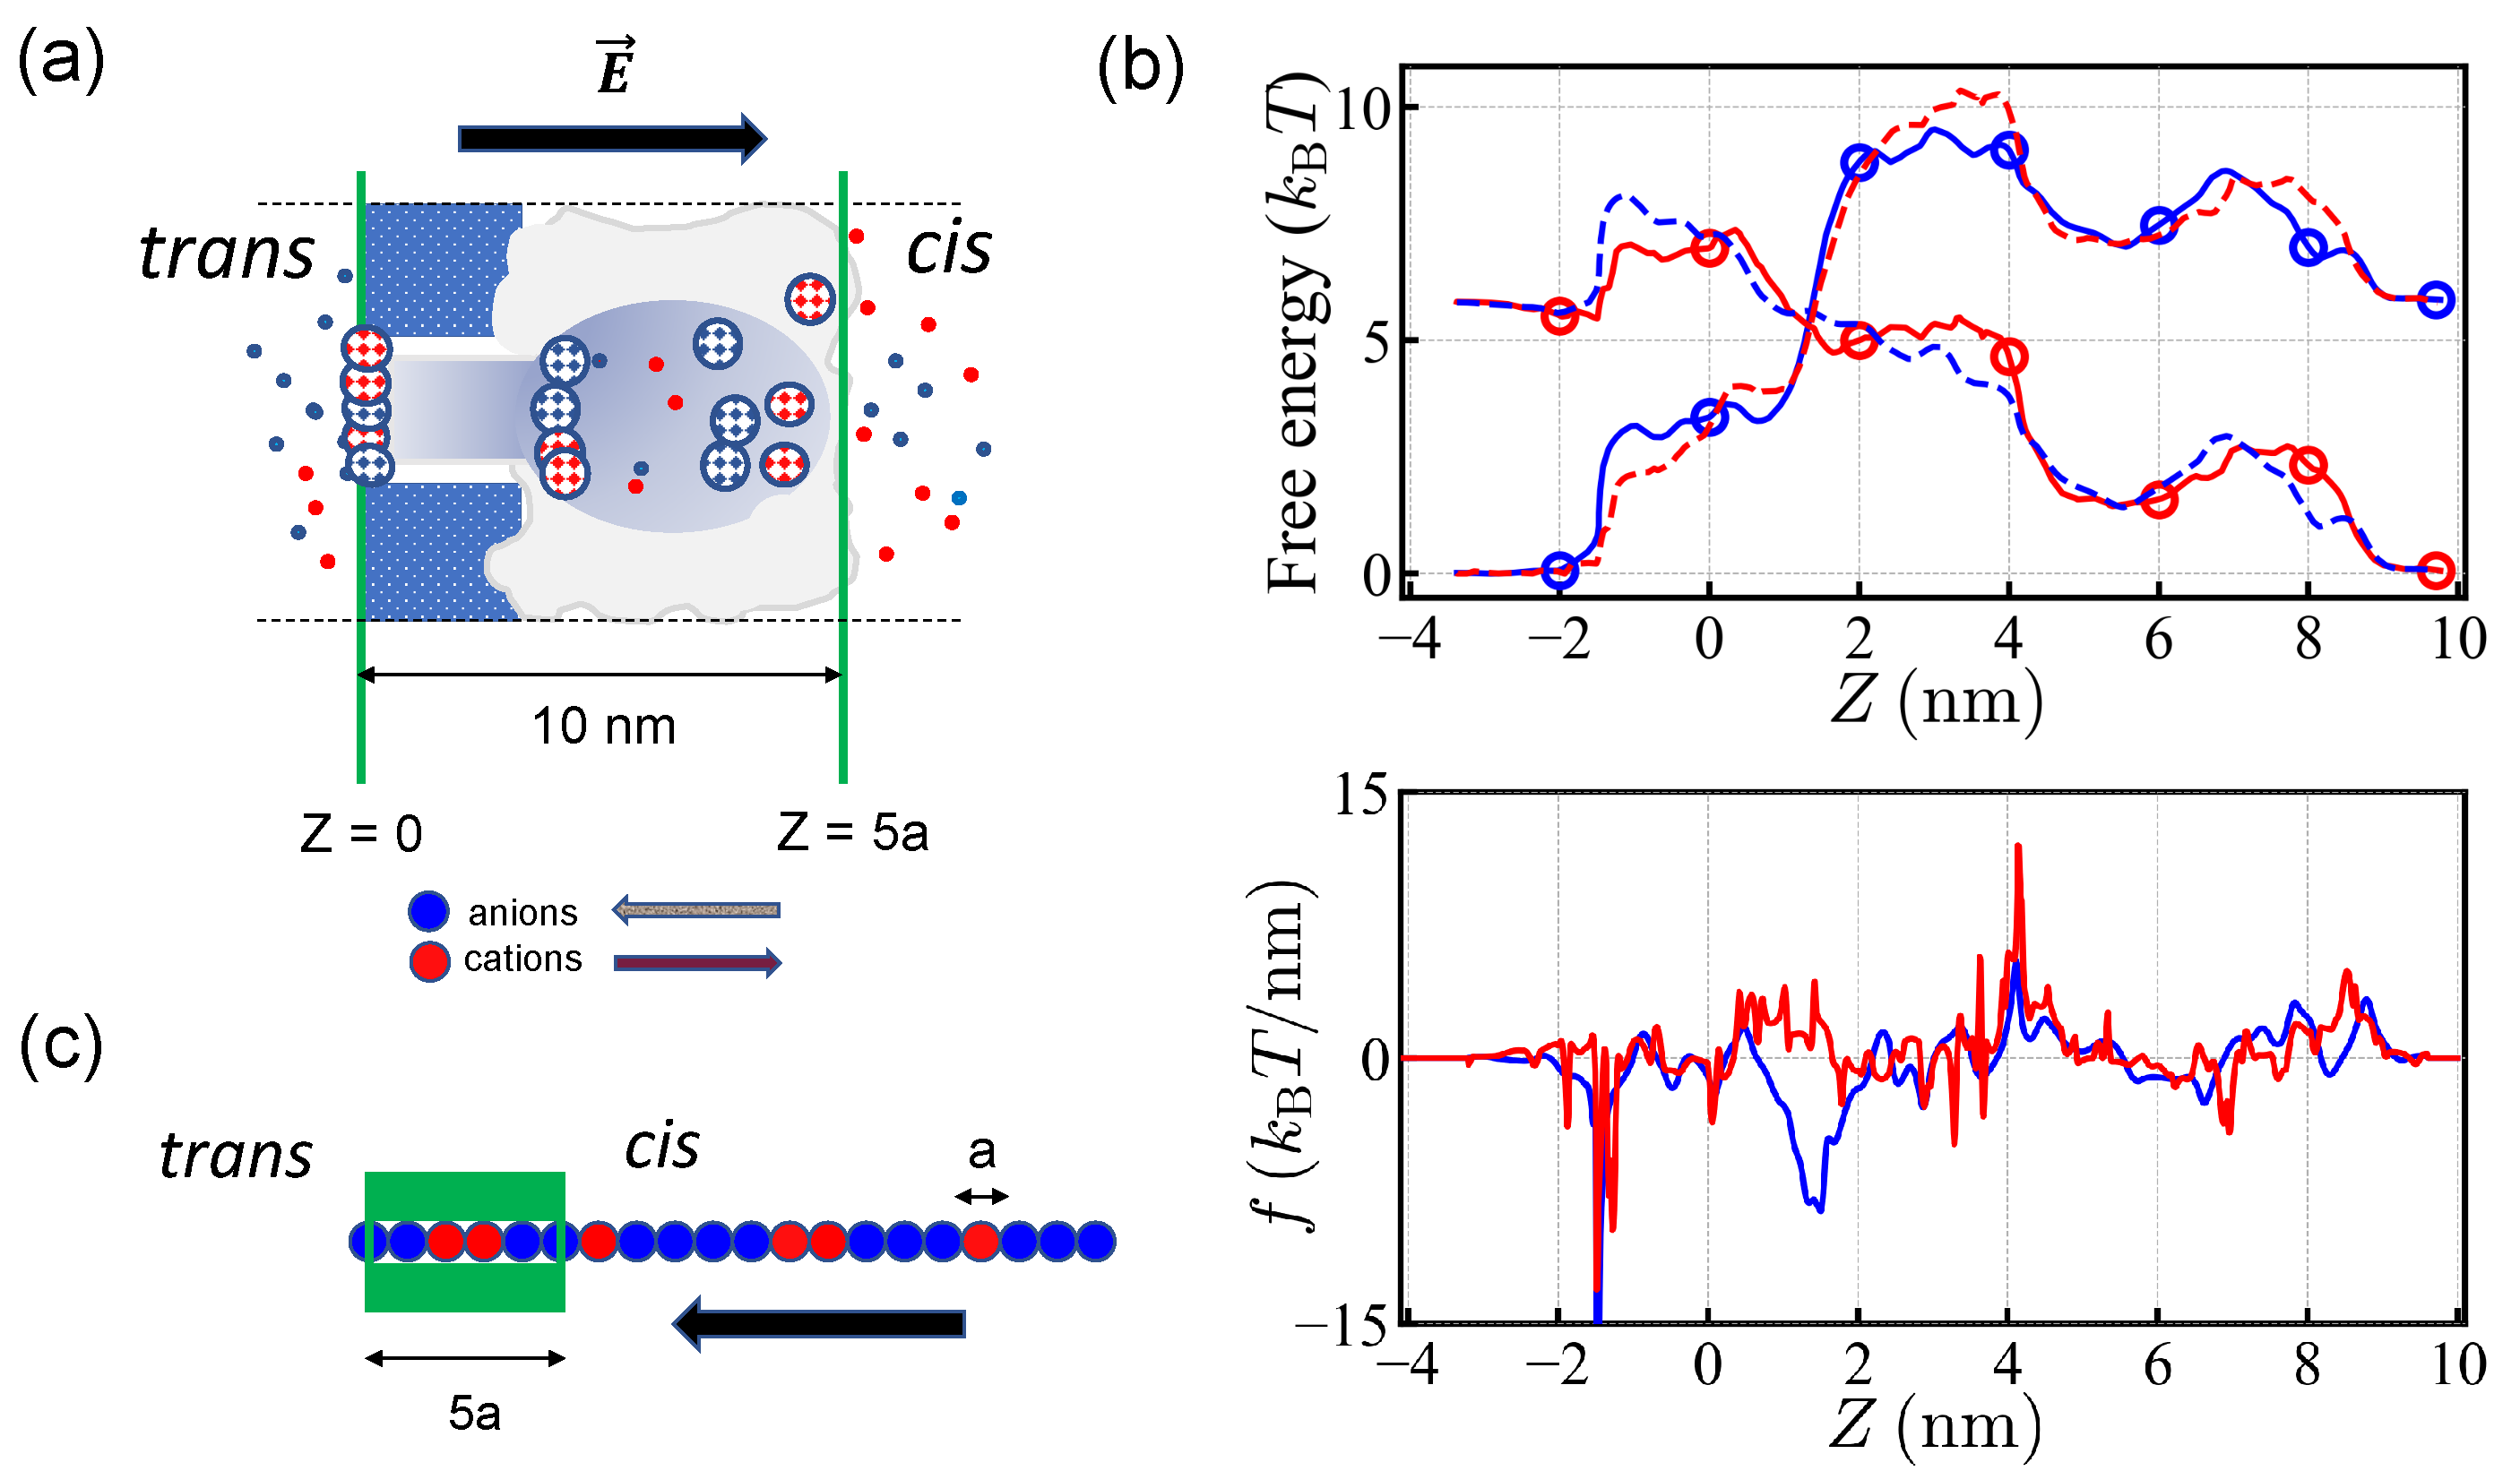
23]. The arrangement of the fixed charges located in pore walls entails a complex free energy profile (
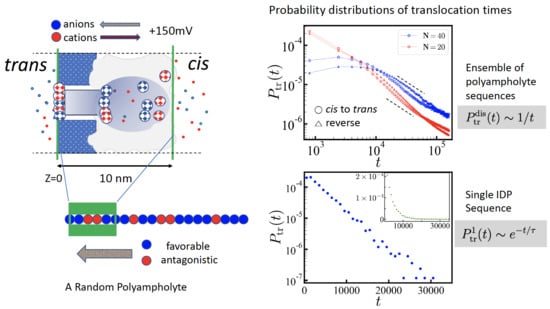
Figure 1b). Under the electric potential of +150 mV, applied to the
trans side with respect to the
cis side, positive charges tend to move from the
trans side to the
cis side while negative charges tend to move from the
cis side to the
trans side. (See,
Figure 1a.) Due to the polarity and geometry of
-hemolysin, the free energy profiles are not symmetric under the inversion of translocation direction. Note that there is a free energy barrier for both types of charges moving from the
cis side to the
trans side. The translocation force is localized at the edge of the
trans side for negative charges moving in the
cis-to-
trans direction, while positive charges moving in the reverse direction experience more or less uniform force over the extended pore.
Considering that the pore is a nanometer wide at the constriction, the polymer undergoing translocation is basically threaded monomer by monomer. Usually proteins can only translocate upon denaturation (not in their native state). Similarly, bulky ramified polymers [
24,
25], soft nanoparticles [
26], vesicles [
27] or associated micelles are sterically hindered [
28] and either have to adopt energetically costly conformation or dissociate.
In previous studies, we addressed the effect of the charge disorder (randomness in charge arrangement along the sequence) in long sequences [
29], by means of analytical theory, and the influence of the globular structure of PAs on their translocation through a point-like pore (of monomeric length) [
30]. It was shown that a disorder in PA slows down the translocation dynamics driven by the overall favorable net charge.
In this work, the pore is modeled by a one-dimensional asymmetric free energy profile for anions and cations extending over several monomer sizes in length (
Figure 1b). For an extended pore such as that considered here, the translocation force is correlated inside the pore as long as the content of the pore is not renewed. Furthermore, for short sequences, even physical quantities that self-average asymptotically, such as the translocation velocity, remain noisy.
We adopt the simple picture that the charges inside the pore experience the driving force endowed by the free energy of small ions and the polymers are basically one-dimensional sequence of charges (
Figure 1c). This amounts to ignoring the variation of the extra entropy penalty of the polymeric sequence engaged for translocation and is reasonable as long as the pore is filled. It is also expected that the small ion distribution is disturbed by the electrical current. Similarly, the free energy of the polymeric charges may be influenced by translocation. Here we stick to the established static free energy profile.We also neglect the interactions between polymeric charges and the variation of the polymer density along the pore, which may matter in the
cis vestibule where the polymer could coil. We consider open PAs, a situation expected at high ionic strength (molar) for backbones in theta or a good solvent. Such high ionic strength is often used in translocation experiments to ensure proper small ion conductivity.
The translocation of polyelectrolytes [
6,
7] in vitro is ensured by an external electric field. A theoretical study reports that the trapping of short polyelectrolytes may happen by dielectric trap and delay the translocation dynamics [
31]. In contrast, the success of the translocation of the PA chains is strongly influenced by the charge sequence comprising antagonistic blocks and the translocation time is mainly determined by the disorder in the charge sequence.
We perform Monte Carlo (MC) simulations for the ensemble of sequences obtained by exact enumeration for N = 20 ( sequences) and for an ensemble of random sequences for N = 40. Exact enumeration addresses all sequences. This is important because a few specific sequences can strongly influence the statistics (moments of the translocation/rejection time distributions). We analyze the role of the net charge and disorder along the charge sequences under the realistic translocation potential profile of the -hemolysin pore, when PAs are engaged into the asymmetric pore in either direction.
Most of the current work adopts the standpoint of statistics for disordered systems. We show the emergence of universal asymptotic features for the translocation statistics including the translocation time distribution. We provide a criteria for the successful translocation of a charge sequence. From the standpoint of proteins it is shown that IDPs sequences typically belong to the class of more easily translocating sequences.
In the following sections, we present the theory, the simulation model and results. Our MC results are rationalized by analytical arguments.
2. Theory
The translocation dynamics and the statistics of long sequences through a point-like pore have been addressed previously. These predictions for long sequences with a point-like pore will prove useful to rationalize our numerical findings. We present a short summary of earlier works [
29,
32] together with predictions for the escape time distributions of trapped sequences.
We assume that the charge statistics is uncorrelated along the chain. Each site carries a charge
q, either
or
, independently, with an average
and a variance
(Note that
). Furthermore, the pore accommodates the charge one by one and is solely characterized by the translocation potential
U, expressed in units of
. The translocation motion of the chain results from a competition among thermal noise, the drift controlled by the force acting on the average charge per site
and potential barriers faced by antagonistic blocks. The height of the
typical barrier
built along a sequence due to
n random charges increases with the charge fluctuation
as
. The typical barrier due to the disorder in charge sequence is hence relevant for sequences longer than
, defined via
. Because the drift makes the energy decrease linearly with
n, the drift formally allows us to overcome the typical barrier when long enough part of the sequences,
, are already translocated. From the total energy barrier
, the crossover length
is defined as
(by setting
). The typical barrier
never becomes relevant if
, because the drift dominates over the disorder already in the thermal regime. The only parameter of the translocation process can be defined as
. At the adopted qualitative level, the disorder along a long sequence matters for
. For an overall favorable translocation condition,
, considered below, the scaling prediction for
,
, suggests that the disorder along a long charge sequence matters more at larger translocation potentials
U. A quantitative theory [
29,
32] leads to the more precise definition of
:
. The expression of
, obtained from Gaussian statistics for the charge per site, coincides with the above scaling estimate for
with the prefactor set to 2;
Let
n be the length of the translocated part of the sequence at time
t. In the absence of drift (
), the translocation follows the ultra slow Sinai dynamics [
33]
, see details in [
34,
35,
36]. A similar slow regime is expected for
in the disorder-dominated creep regime (
). In the creep regime, the velocity does not behave well and
. In the driven regime, at a lower disorder (
), the velocity behaves well and
. However, the fluctuation,
, stays anomalous. At a very low disorder (
), both the velocity and diffusion constant are well defined but depend on
. Ultimately, each engaged sequence is either translocated or rejected, albeit the waiting time may be arbitrarily long. The ratio of rejection probability to translocation probability is given by the splitting probability discussed in
Appendix A. Disorder favors rejection even with favorable charge conditions. For Gaussian statistics, the average of the ratio of rejection probability to translocation probability over the disorder formally diverges for
and rejection strongly prevails.
If a sequence remains engaged in the channel for a long time, we consider it to be trapped [
37] and it has to escape through energy barriers opposing both translocation and rejection. The distribution of sojourn times under a random uncorrelated force (the time distributions discussed here are not self-averaging) is discussed in [
32]. At long times it behaves as
. The distribution of relaxation times
under a random uncorrelated force decays as a power law asymptotically,
Qualitatively, this power law is the derivative of the one for the related sojourn probability. It can be loosely understood as the waiting time distribution in front of the trapping barrier. The translocation time distributions and the rejection time distributions are escape time distributions from traps built up along the sequences. In line with the regimes for the translocation dynamics, the power-law tail is integrable for , the first moment of the distribution is well defined for and the second moment for . Note that the sojourn time distribution decays as an inverse power of in the Sinai regime ( = 0). Long-time translocation/rejection may involve multiple trapping. The power law is nonetheless expected for the translocation time distribution and the rejection time distribution when the dominant events are escapes from single trapping or when the translocation/rejection time is essentially prescribed by the deepest trap.
The power-law tail of the relaxation time distribution is integrable but, as mentioned above, formally, higher moments of the relaxation time distribution are not defined at a high disorder. Indeed the power law for an infinite sequence stems from the distribution of barriers of all heights. Strictly speaking, for a chain of finite length, the higher moments are well-behaved because of the cut off of the power law, as an effect of the finite sequence. Unfortunately, the translocation time involving the typical barrier is given by for and is difficult to reach in simulations even for finite sequences, resulting in trapped states. If we distinguish three final classes, translocated, rejected and trapped, the last class should be almost empty for a precise determination of the translocation statistics. For a finite sequence, the barrier height distribution is cut and the very tail of the time distribution is strongly depleted. In turn, the “experimental” waiting time must be long enough to reach deep in the cut-off regime to obtain the average translocation time of disordered sequences.
The large energy barriers are developed from blocky sequences. For , the symmetric diblock occurs with probability and, if properly engaged, faces the barrier in both directions of translocation and rejection. This sole sequence hence contributes ∼ to the average translocation time, which, provided , can be very large. It is as large as the ∼ monomeric diffusion times for U = 6 and N = 20. The situation is less dramatic for sequences with a favorable net charge. For a favorable net charge Q, the contribution of diblock sequences to the average translocation time decays exponentially with N provided . For U = 6 this criterion gives . We distribute the sequences in classes with a prescribed net charge to study this issue.
3. Model: Monte Carlo Simulation
In the Monte Carlo (MC) simulations, we modeled the PA as a one-dimensional chain and explored the influence of the net charge and of the charge blocks in the PA sequences on their translocation.
The length of the
-hemolysin pore spans about 10 nm. Assuming that the effective monomer size carrying a unit charge (for protein it may cover 3-4 amino-acids) is about
2 nm, the translocation channel was modeled to be 5
a long and thus 5 monomers can be put in the pore at the same time. During the translocation process, the 5 monomers were positioned 0, 2, 4, 6, and 8 nm away from the edge of the pore (
Figure 1).
We considered MC hopping moves (of the whole chain) by the step size of monomeric length
a. For each MC step, the possible move was randomly chosen to be
or
. The prescribed move was accepted following the standard Metropolis algorithm. As shown in
Figure 1c, the 5 monomers were deployed in the pore at the start of each run of the simulations, the head monomer being at the edge of the
trans side when engaging from the
cis side to the
trans side. For the direction from the
trans side to the
cis side, which is referred as the reverse direction below, we deployed the head monomer at the edge of the
cis side. This initial condition circumvented the discussion of the entry mechanism given in [
38,
39,
40]. The successful translocation meant that the tail of the chain left the pore completely. If the entire chain was retracted out of the pore, it was considered as rejection.
We took free energy values given for two types of charges at each site as shown in
Figure 1b (see, also
Table 1). For each step, the free energy difference of the whole chain was evaluated as the translocation process proceeded. The potential drop of
U = 150 mV was applied over the pore [
22] so that the free energy loss (gain) was ∼6
per translocated favorable (antagonistic) charge. The applied polarity favored the translocation of anions. As noted earlier, the free energy profiles for anions and cations almost exactly exchange upon a change of polarity. We expected the translocation to be almost unchanged under the simultaneous changes of the polarity
and sequence
. The free energy difference of the (MC) moves determined the translocation motion of a sequence and ultimately its probability of translocation/rejection.
The entropy of the polymer was expected to be somewhat different from that of small ions due to its connectivity. Nonetheless, as long as the pore remained filled, the corresponding entropy change was not relevant. We also assumed that the free energy changes outside of pore can be neglected.
We first considered PA chains composed of N = 20 monomers carrying either types of charges or . We enumerated all possible sequences, and for each sequence 100 independent trials for translocation were conducted. To explore the influence of the sequence length, we also tested the translocation times for N = 40, for which we created independent random sequences. The number of sequences was large enough to sample the bulk of the translocation/rejection time distributions investigated in this contribution. We introduce the finite waiting time, that is, or MCT. The translocation dynamics can be ultra-slow for some blocky sequences. The sequences qualified for successful translocation should satisfy a certain rule in charge arrangement.
4. Results and Discussion
We obtained the probability distribution functions (PDFs) of translocation times
and rejection times
from the global ensemble of all
sequences, which satisfies
= 0 by symmetry. We measured the number of translocated sequences within the given binning time,
=
MC time steps (MCT), for both
cis-to-
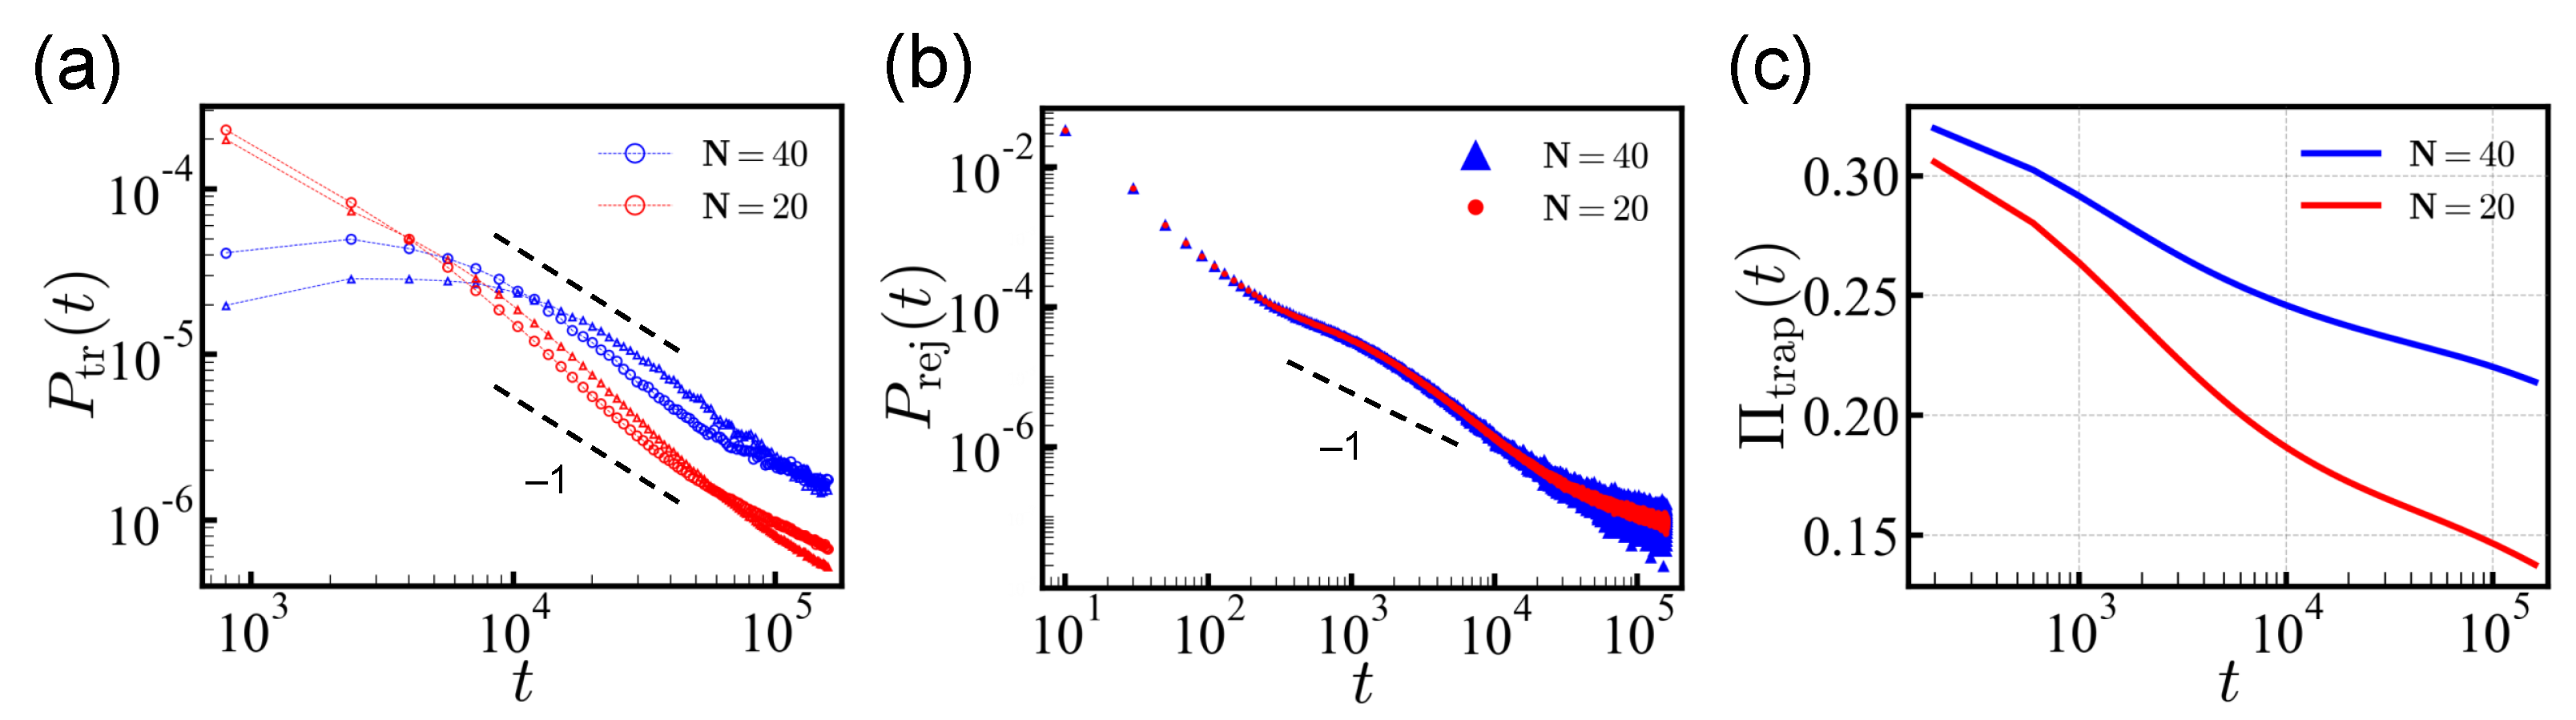
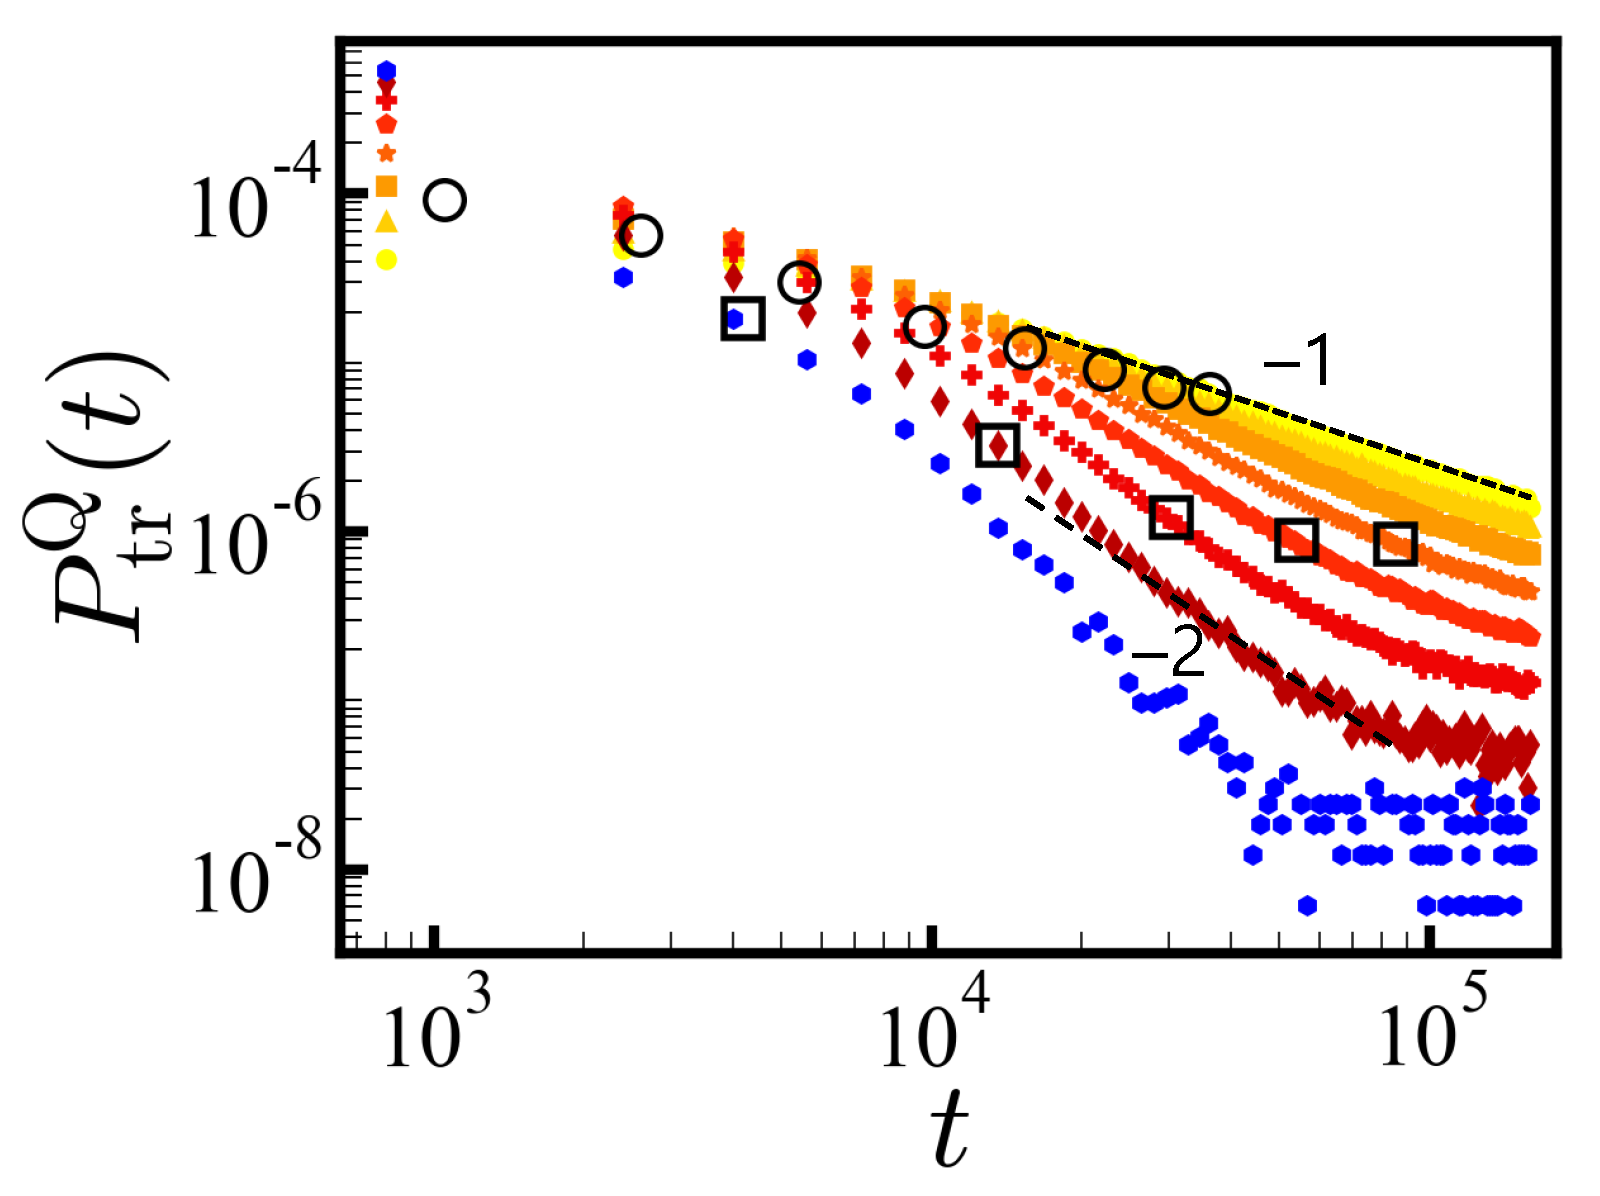
trans and the reverse directions, and the distribution was normalized by the total number of successful attempts. As predicted from theory, we found that the power-law tail
indeed prevailed asymptotically. (
Figure 2a) For
N = 20, the PDF
deviated from the power law for
MCT (more pronounced for the
cis-to-
trans direction) and dropped more quickly because of the finite-length effect. As we show later, the deviation from the
behavior was due to the relatively fast translocating sequences carrying large net charges
Q. These effects appeared over a limited intermediate time interval and the PDF recovered
behavior for long times,
MCT.
We also show the translocation times of
independent random sequences of
N = 40 in
Figure 2a. The PDF
of
N = 40 also follows
for times
MCT. At short times, the sequences with
N = 40 show a markedly flat translocation distribution in contrast to the
N = 20 case. The highly charged sequences with the shorter length
N = 20 translocate typically without significant barrier. However, for the longer sequences,
N = 40, significant barriers can be developed more frequently. In addition, sequences of the same charge density
carry a doubled net charge and are statistically less common in the ensemble of
N = 40 as compared to
N = 20. This is because the standard deviation of the total net charge (
Q) distribution only increases sub-linearly, as
.
The rejection probability is also shown in
Figure 2b. The rejection time distribution
has two regimes: The short-time behavior, which is determined by the sequence of five head monomers, and the long-time behavior that is governed by the distribution of energy barriers against rejection. Once the chain is trapped, the move in either
cis/trans direction requires to overcome similar energy barriers, and results in a power-law tail similar to
.
For the translocation of
N = 20, with the waiting time
=
MCT, the population of successfully translocated/rejected sequences was 9.3% (9.1%)/76.9% (74.6%), in the
cis-to-
trans (reverse) direction, respectively. (note that there were 16% of sequences with a neutral net charge and 43% each with a favorable/antagonistic net charge) Some sequences, 13.8% (16.3%), were found to be trapped in the pore. As shown in
Figure 2c, the population of the trapped sequences
only decreases logarithmically over time, and some sequences remain undetermined even after a long simulation time. Here we classified the trapped sequences separately.
For translocations in the cis-to-trans (reverse) direction of longer N = 40 sequences, the proportion of successful translocation became considerably smaller ∼1.6% (1.0%) but the rejection rate was almost the same with = MCT. A significant fraction of sequences ∼21.4% (24.4%) remained undetermined.
Despite the qualitative similarity in translocation behavior, when moving from the
cis-to-
trans side, there were less cases of trapping and slightly more cases of both translocation and rejection. For the longer waiting time
=
MCT, the successful translocations were 11.4% (10.9%) of the total population of
N = 20 for the
cis-to-
trans (reverse) direction and the trapped sequences decreased to 9.7% (12.1%). The results are summarized in
Table S1 in Supplementary Materials.
The translocation behavior was mostly determined by the charge arrangement in sequences, and for all times, the statistical errors in the translocation/rejection probability was negligibly small, ∼0.03%–0.07%, as reflected in the digit. However, the disorder in the charge sequences caused large variance among sequences in translocation times. We discuss this point further below. (See
Figure 3 and
Figure 4.)
Because some quantities, such as average translocation times, are not well defined due to the unresolved sequences, we compared the time required for a population of the same size to translocate in each direction (
Table 2). Clearly, translocation is more efficient in the
cis-to-
trans direction. This is because a large translocation force is localized when engaging in the
cis-to-
trans direction. See also
Figure 1b for the translocation force.
A large favorable net charge
Q promotes translocation. We classified the sequences according to their net charges. The translocation behavior was qualitatively similar in both directions, so we present results obtained in one direction only unless explicitly mentioned. Results for both directions of translocation are shown in
Supporting Information (SI) as a supplement. Hereafter and in
SI, we represent
and
for favorable and antagonistic types of charges from the view of translocation.
In
Figure 3, we show the PDFs of translocation times (in the reverse direction) in log–log scale for each
Q separately (
N = 20) with
=
MCT (for
cis-to-
trans, see SI). For the ensembles of sequences with net charge
Q, the average translocation force increases with
Q resulting in a steeper decay of the PDF of translocation times. Each PDF
follows the power law
with
at times before the finite size effect sets in. The larger the net charge, the steeper the slope
is, as discussed in the theory section. A fit of the exponent
obtained from the Gaussian statistics needs to set
to
and apply uncorrelated charge statistics. This is reasonable at low
Q and indeed works fairly up to
Q = 8 for
N = 20 (see
Figure 3 and Equation (
1)), and up to
Q = 16 for
N = 40 (not shown). The subensemble of
Q = 12 shows a
decay. Formally, the
= 1 criterion for infinite chains and a point-like pore separate the disorder-dominated regime from the driven regime where the first moment of the PDF is well defined.
Since most of the large
Q sequences are either translocated or rejected in a short time, for long times, the global dynamics shown in
Figure 2 is dominated by the flux of small
Q sequences that are slowly translocating.
For each ensemble of net charge
Q, we obtained
with
=
MCT from the successfully translocated sequences. The average value of
decreased with increasing
Q as indicated by the circles in
Figure 3. Aforementioned, this average translocation time must be taken with care as long as trapped sequences are present. The released sequences after the given waiting times may greatly affect the average translocation time.
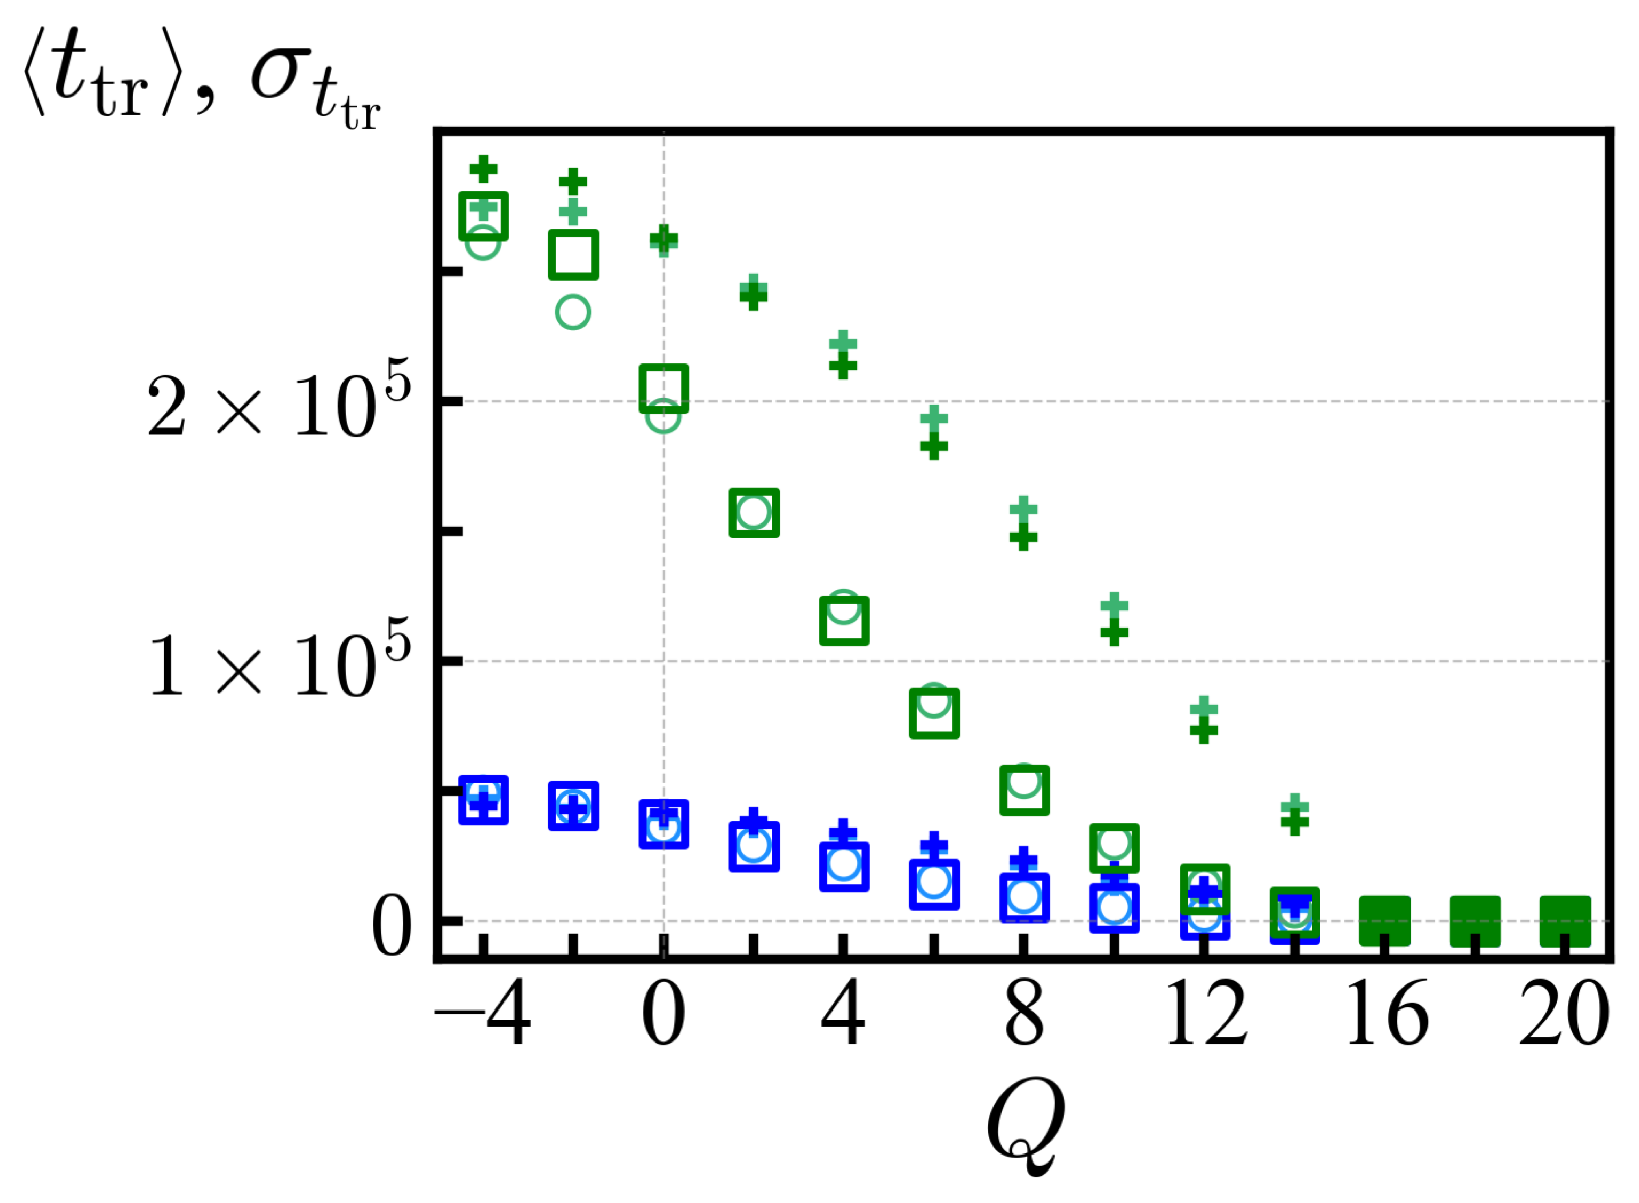
In
Figure 4, we show the average translocation time
and its standard deviation
for each ensemble of net charge
Q with
N = 20, obtained with
=
and
MCTs. Those
Q values with vanishing trapped sequences and a steep decay of the PDF (say with a long-time slope steeper than
,
) provide a reliable estimate of the average translocation time and those cases are represented by filled symbols in
Figure 4. For
, the large standard deviation
reflects the presence of large antagonistic blocks, and the statistics of translocation time as measured here is influenced by the waiting time. For
, the mean translocation time
is independent of the waiting times
and converges to a value much smaller than
. The criterion
corresponds to the value of net charges where the large free energy barrier of diblock sequence does not dominate the average
(see
Section 2). Translocation is selective with respect to the specific arrangement of the sequence (see also
Table 3 below). On this account, the standard deviation
for
Q = 16 remains larger than the sequence average
, e.g.,
180 (300) MCT and
500 (960) MCT for the
cis-to-
trans (reverse) direction. For
Q = 18, the disorder resides in the position of a single antagonistic charge and does not contribute much to
. Further discussions are available in
Appendix B.
Below we discuss the control parameters for translocation, rejection and trapping.
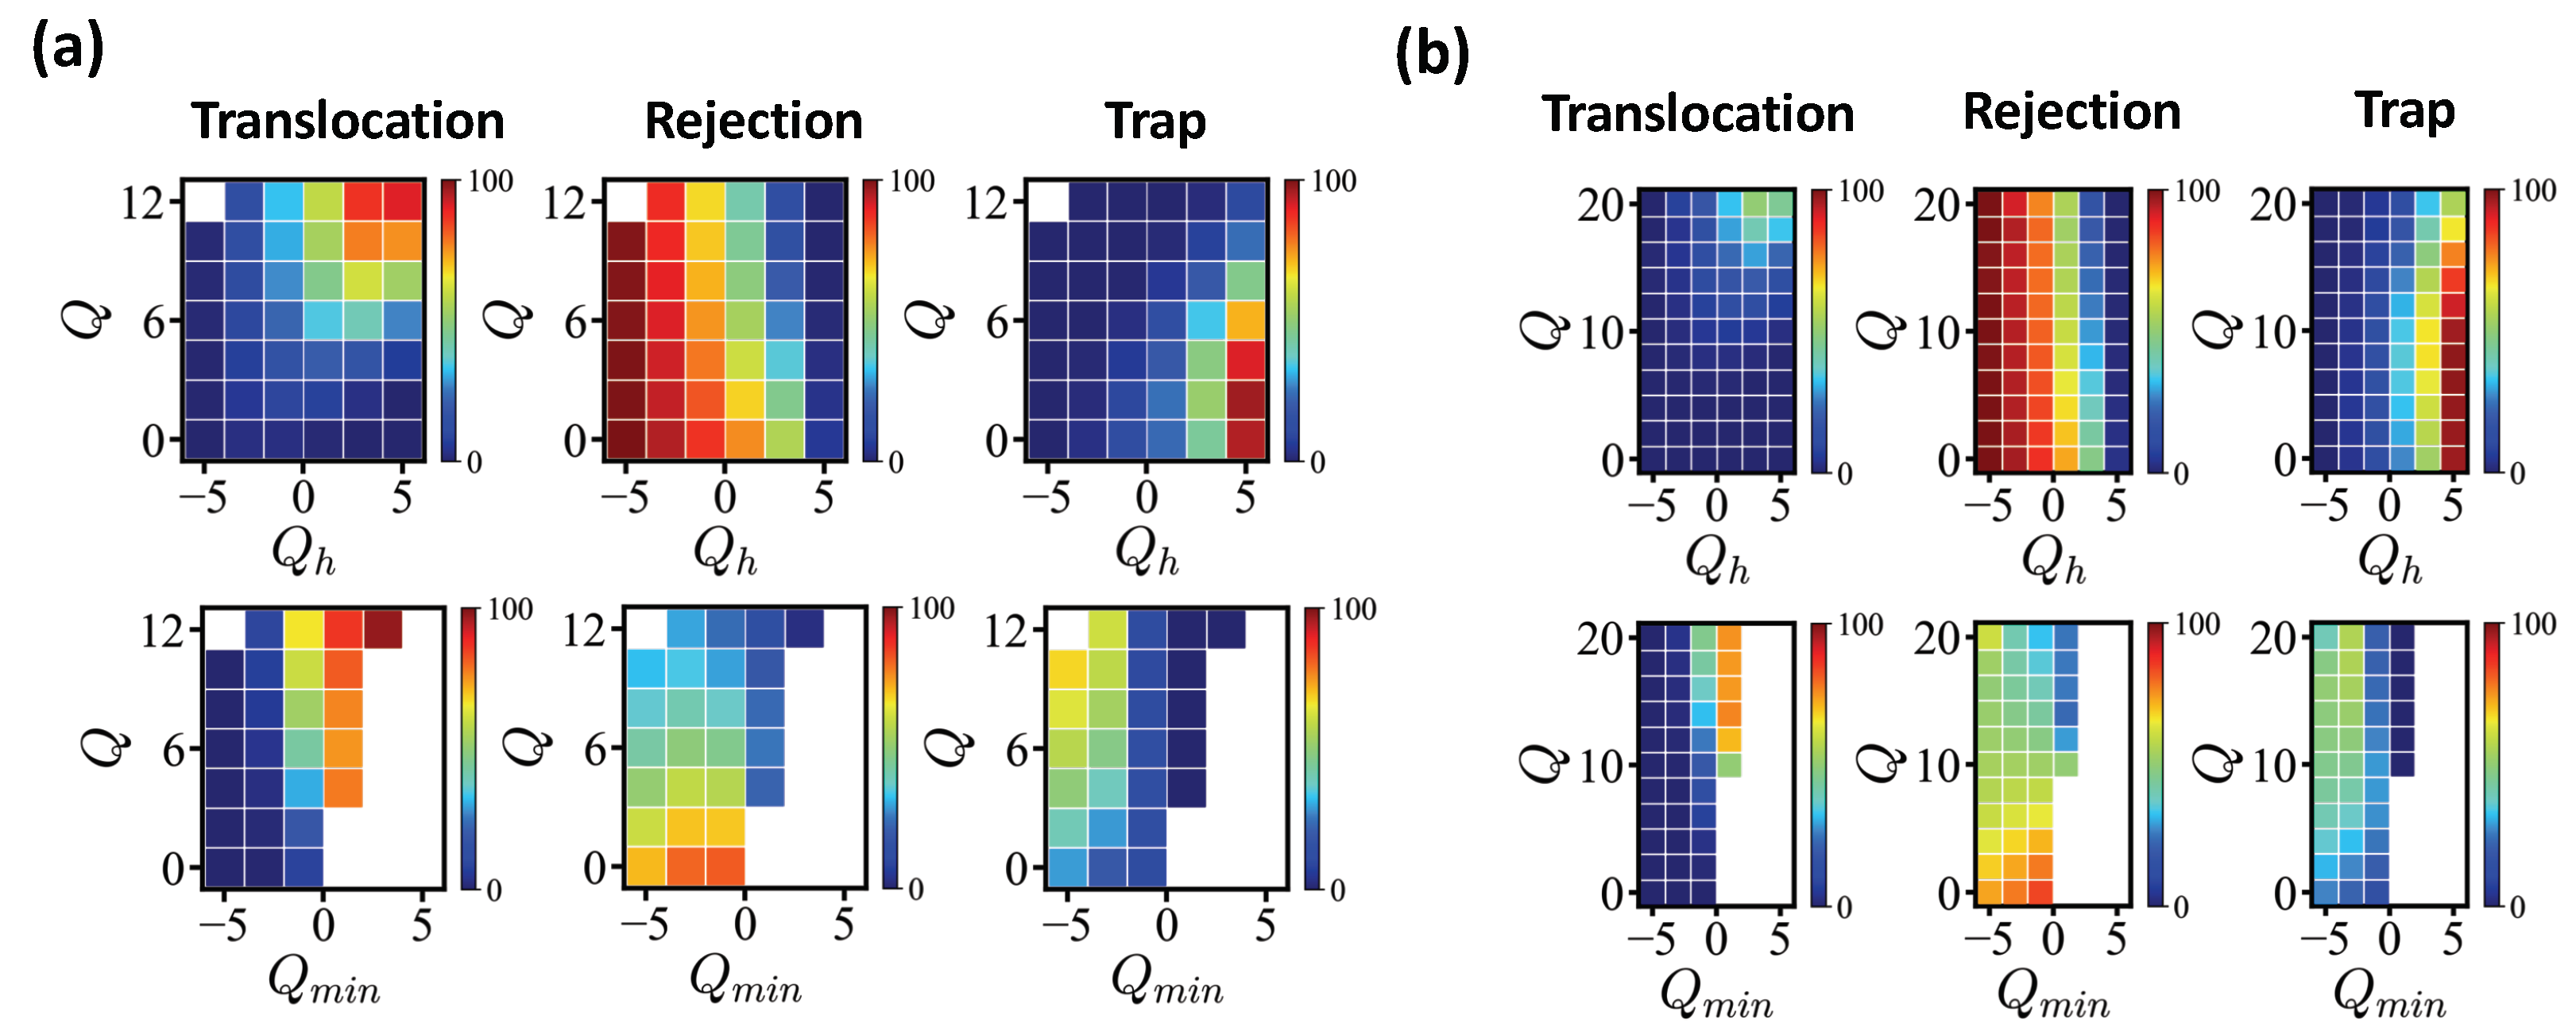
We investigated the influence of the head sequence on translocation/rejection.
Figure 5 (a) shows the fractions of translocated/rejected/trapped sequences for exactly enumerated
N = 20 sequences with
=
MCT. As shown in the figure, the entry is first filtered by the net charge of the head sequence
, counting the net charge of the first five monomers of the translocating edge. Sequences carrying
are mostly rejected and the larger the
, the less likely a sequence is rejected. Once a sequence succeeds in entering, a sequence with a sufficiently large total net charge manage to translocate. Sequences with
(
) show translocation rate more than 50%. Less charged sequences are often trapped, at least for the given simulation time (data with
=
MCT are qualitatively similar). The translocation rate shows strong correlation with the number of antagonistic charges in the pore. We introduced as a control parameter the minimum net charge
measured for a block of pore length
along the sequence. If there are more antagonistic charges in the pore, the energy barrier increases accordingly. Sequences with
mostly pass successfully. Under this operational criterion, the formation of any high-energy barrier is not allowed. This is a sufficient but not a necessary condition (see for example
Table 3).
We also conducted the same analysis for
N = 40 sequences (
Figure 5b), where we showed
Q ranging from 0 to 20. The same waiting time
=
MCT applied. Similar to short sequences, the rejection was mainly controlled by the head sequence and the condition
held for a successful translocation. Only highly charged sequences (
20) reached a translocation rate of more than 50%.
We compared the influence of and for N = 20 and N = 40, with the same = 1/2. The rejection rates were 55.16%, 16.64% and 0.26% for N = 40 with = 1, 3 and 5 of favorable head sequences. The impact of favorable was somewhat reduced compared to N = 20, where the corresponding rejection rates were 44.61%, 14.84% and 0.38%. The successful translocation rates were considerably reduced to 32.71%, 50.00%, and 45.54% for N = 40 compared to 54.15%, 77.42% and 75.77% for N = 20 with the same = 1, 3 and 5. These rates were reproduced with statistical errors ∼0.003–0.008%. The number of digits shows the accuracy of the data. As the chance to build a higher energy barrier was expected to grow significantly with the sequence length, the proportion of trapped/rejected states also increased significantly for N = 40, compared to N = 20.
Furthermore, we noted that the sequences with the largest value of = 5 and with moderate net charges were mostly trapped (>95%) for both lengths due to the longer antagonistic block followed by. For sequences with and = 5, the fraction of trapped sequence was over 50% for N = 40 and ∼24% for N = 20.
For the given values of = and , the translocation rates were 81.38%, 60.53%, and 7.30% for N = 20 and 75.00%, 46.04%, and 3.60% for N = 40, respectively. Summarizing, the net charge of head block had a stronger impact on short sequences, but the success rate was mainly governed by the largest energy barrier, reflected by .
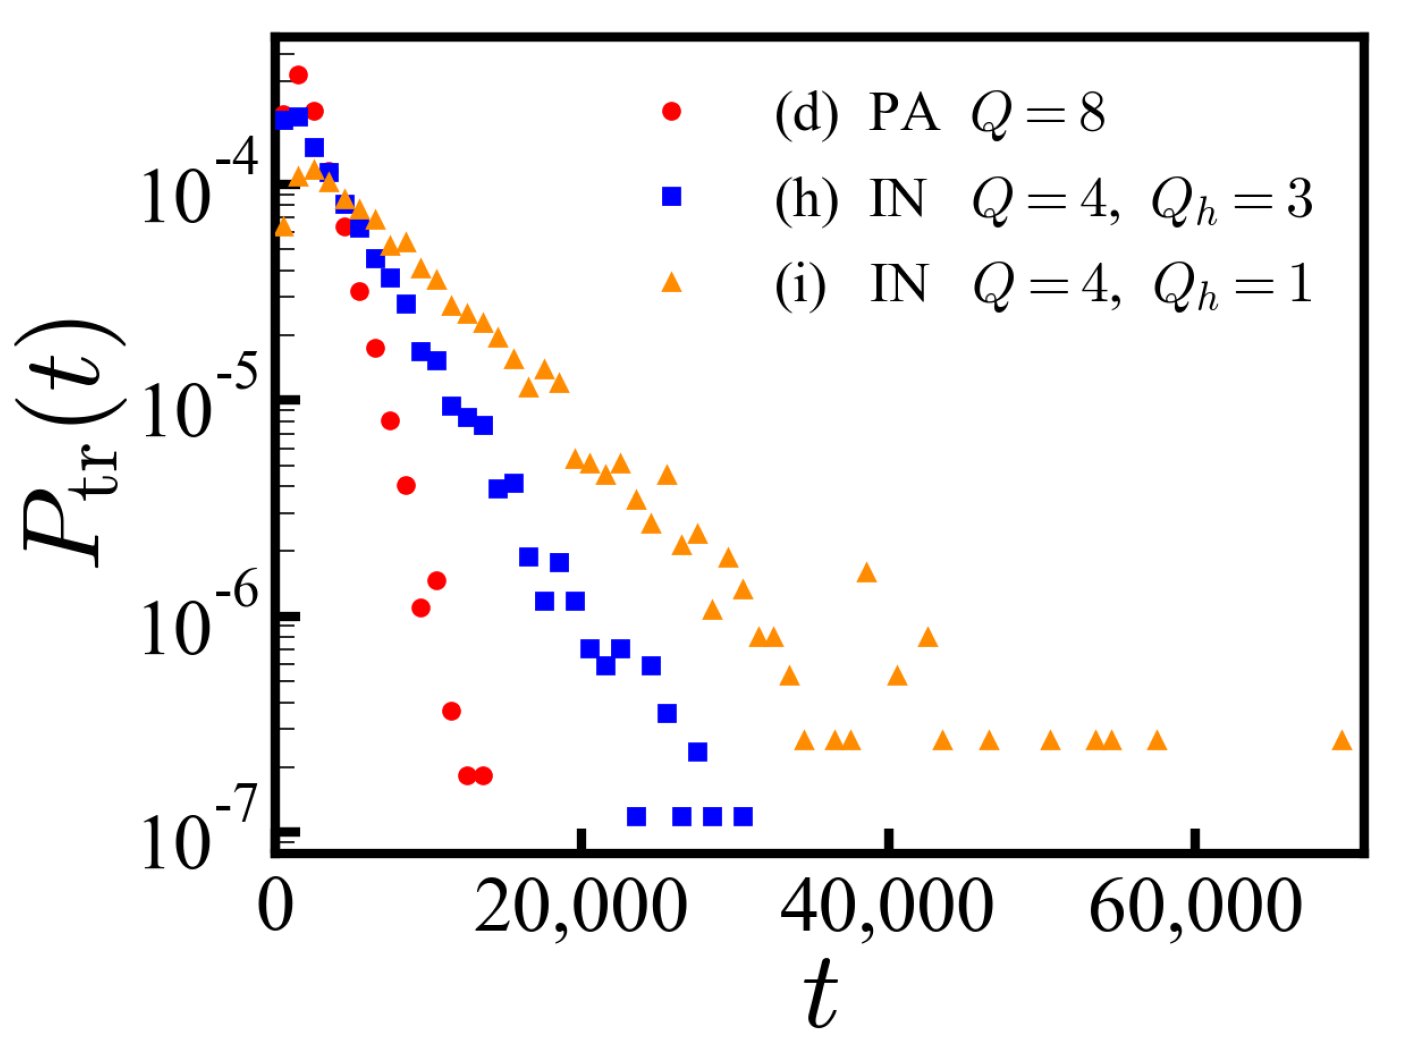
For the quantitative analysis, we compared the translocation behavior of several specific sequences with the prescribed net charge
Q = 8 in
Table 3. The average translocation time
and standard deviation
were obtained from 10,000 different trials for the given sequence, and
and
denote the thermal averages and corresponding standard deviations. For each given sequence, the translocation statistics was well-defined and
, which contrasted with the noisy statistics of translocation times in the ensemble of disordered sequences. We may recall the translocation time statistics (
cis-to-
trans) for the subensemble of sequences with
Q = 8, where we found the sequence average
8900 MCT and
23,500 MCT. The fastest translocating sequence was the regular sequence with a large
value. A block of two consecutive antagonistic charges (-1-1) corresponded to
= 1. When comparing sequences with traps with
= 1, the translocation time increased approximately in proportion to the number of traps. Note also that, despite the same condition of
Q and
, the translocation time also depended on the position of antagonistic blocks. For the sequences carrying a block of three antagonistic charges, (-1-1-1), they translocated successfully when
was favorable, whereas they tended to be trapped when
was less favorable.
The last two sequences in
Table 3 represent the sequence of protein IN from each end. We show only the charged residues ignoring neutral residues for simplicity, labeling the antagonistic charge type as
. The PDF of translocation times for a specific IDP sequence (h) shows an exponential decay as a function of time (
Figure 6), where we expect
. The statistic is well defined in contrast to the ensemble of disordered sequences. The exponential decay is less obvious for sequence (i) engaging from the opposite end.
5. Conclusions
We investigated the role of the disorder in the charge-sequence of polyampholyte chains on their translocation behavior. We considered an -hemolysin pore under an electric field which is a widely used setup in in vitro experiments. By means of Monte Carlo simulations incorporating a realistic translocation potential profile along the pore, the translocation behavior (translocation vs. rejection) was recorded for all 2 sequences comprised of 20 charged monomers by exact enumeration. The results were compared with those of an ensemble of random sequences comprised of 40 charges. In contrast to polyelectrolytes carrying one type of charges, the translocation dynamics of PAs are conserved by the disorder in the charge sequences. Even if PA has a net charge favorable for translocation, antagonistic barriers can be built up due to charge fluctuations along the sequence, leading to the PA trapping. The probability distributions of translocation/rejection times revealed a net charge dependence, power-law tails, and pore structure dependence. The short-time behavior in part depended on the initial conditions yet rejection was mainly controlled by the charge distribution of the head-sequence. Late-time translocation/rejection was governed by the escape from a trapped state over an antagonistic free energy barrier and the tails of both rejection and translocation time PDF were characterized by a power-law decay. Our findings were rationalized by the sojourn time probability in the potential created by a random uncorrelated force.
The slowly decaying power-law tail of the translocation time distribution makes the determination of the moments a difficult task. Numerically, the estimates of the moments will, in many cases, be influenced by the waiting time. For a subensemble of sequences with a large net charge, it is possible to estimate the average translocation time in the simulation, despite the noisy statistics in translocation times with an estimated standard deviation as large as the average.
With the translocation potential at hand, inverting the polarization is (almost) equivalent to reversing the sign of the charges along the sequence. However, inverting the direction of translocation and the polarization or the sign of the charges along the sequence is not equivalent, which reflects the asymmetric pore structure. Translocations in both directions remain, to a large extent, qualitatively similar, but the efficiency of translocation is different. Furthermore, the asymptotic laws are approached differently. This is also expected for other asymmetric pores.
In this contribution, we did not address concentration effects, including PA aggregation. PAs are less likely to aggregate at high salt concentrations (∼2 M) commonly used for translocation experiments. The formation of (binary) complexes before/after translocation can inhibit/promote translocation. This is reminiscent of importins/exportins in nuclear translocation.
We also devised simple criteria for the high translocation rate of a sequence. The head block filling the channel should be favorable or neutral to avoid immediate rejection. If every block filling the pore, which arises along the sequence, is also favorable or neutral, translocation is almost ensured as no high barrier can develop. This sheds some light on the selectivity of the translocation process.
In view of this work, we reconsider the two IDP sequences presented in [
2,
29]: The weekly charged IN and the highly charged PRoT
. Considering only charged residues, the IN protein counts 16 charges with a net charge of
; its six positive (antagonistic) charges are dispersed along the sequence with the longest blocks of two consecutive positive charges. The PRoT
protein counts 63 charges with a net charge of
. The 10 positive charges are dispersed along the sequence with longest blocks of three consecutive positive charges. Each IDP sequence exhibits well-defined translocation statistics. IDPs seem to disperse their minority charge along the sequence, which allows their plasticity. Typical IDP sequences do not comprise long (antagonistic) charge blocks and belong to the class with fast translocation/rejection, as introduced in our study.


