Article

Polymeric Insulator Conditions Estimation by Using Leakage Current Characteristics Based on Simulation and Experimental Investigation

by
Ali Ahmed Salem
1,*,
Kwan Yiew Lau
1,*,
Zulkurnain Abdul-Malek
1,
Nabil Mohammed
2,
Abdullah M. Al-Shaalan
3,
Abdullrahman A. Al-Shamma’a
3 and
Hassan M. H. Farh
4
1
Institute of High Voltage and High Current, School of Electrical Engineering, Universiti Teknologi Malaysia, Johor Bahru 81310, Malaysia
2
Department of Electrical and Computer Systems Engineering, Monash University, Wellington Rd., Clayton, VIC 3800, Australia
3
Electrical Engineering Department, College of Engineering, King Saud University, Riyadh 11421, Saudi Arabia
4
Department of Building and Real Estate, Faculty of Construction and Environment, Hong Kong Polytechnic University, Hung Hom, Kowloon 999077, Hong Kong
*
Authors to whom correspondence should be addressed.
Polymers 2022, 14(4), 737; https://doi.org/10.3390/polym14040737
Submission received: 29 December 2021 / Revised: 27 January 2022 / Accepted: 29 January 2022 / Published: 14 February 2022
(This article belongs to the Special Issue Advanced Polymer Composites for Electrical Insulation)

Abstract

:
The current work contributes an estimate of the time-frequency characteristics of a leakage current in assessing the health condition of a polluted polymeric insulator. A 33 kV polymer insulator string was subjected to a series of laboratory tests under a range of environmental conditions, including pollution, wetting rate (WR), non-soluble deposit density (NSDD), and non-uniform distribution pollution (FT/B). The temporal and frequency features of the leakage current were then extracted and used as assessment indicators for insulator conditions based on laboratory test findings. Two indices were generated from the leakage current waveform in the time domain: the curve slope index (F1), which is determined by measuring the inclination of the curve between two successive time peaks of the leakage current, and the crest factor indicator (F2). The frequency domain of the leakage current signal was used to calculate the other two indices. These are the odd harmonic indicators derived from the odd frequency harmonics of the leakage current up to the 9th component (F3) and the 5th to 3rd harmonics ratio (F4). The findings showed that the suggested indicators were capable of evaluating insulator conditions. Finally, the confusion matrix for the experimental and prediction results obtained with the proposed indices was used to assess which indicator performed the best. Therefore, the analysis suggests an alternative and effective method for estimating the health condition of a polluted insulator through leakage current characteristics obtained in the time and frequency domains.

1. Introduction

The insulator is one of the most significant components used in power transmission systems for holding and insulating electrical wires from towers. In this respect, it should be noted that several environmental elements, such as the kind of material, moisture, and the level of contaminants, have a significant impact on the efficacy of the outdoor insulator. Consequently, the continuation of pollutants deposited on the surface of insulators renders the insulators susceptible to significant leakage current flow. As a result, the insulator surface experiences widespread discharge activity [1,2,3,4]. These discharges can develop into an unwanted flashover that may disrupt an electrical grid [5,6,7,8]. Therefore, monitoring the condition of insulators has a significant effect on the power system stability [9,10]. The assessment of outdoor insulator properties and long-term efficiency is thus an important area of research in the science establishment [11,12,13,14].
The leakage current (LC) monitoring method has several advantages. It considers a variety of environmental factors such as ambient temperature, moisture, contamination, and rain [15]. Additionally, the leakage current may simply be checked online regularly. Leakage current computation and analysis, as one of the online tests performed for contaminated insulators, has piqued the interest of numerous researchers. The author of [16] has utilized a microwave-disapproved device to measure the LC on dry insulator surfaces. However, this technology is expensive and may be too expensive for low-cost power systems. The authors of [17] proposed a device that captures electromagnetic radiation from a partial discharge to monitor the leakage current of contaminated insulators. Although this system is not affected by flashover, it has not yet been tested in the field, where considerable electromagnetic interference caused by coronae and other effects on high voltage cables is expected. Moreover, another interesting aspect of the contaminated insulator LC tracking approach is the ability to create an effective correlation between the leakage current and the insulator status when the insulator is in operation. In this scenario, several academics have offered different approaches to assess the state of insulators [15,18,19,20]. By extracting information on the components of the LC, it is possible to improve LC-based monitoring. The authors of [21] proposed measuring the degree of contamination using LC summary statistics, which offer the mean, peak, and standard deviation values. They made it clear that these factors allow them to measure the size and density of contamination on the insulator surface. Another study [19] calculated insulator pollution conditions by monitoring the shift angle between the leakage current and applied voltage signals. As per the results in [19], shift angle alterations are a helpful signal for assessing contaminants and moisture variations between clean and dry settings. Other strategies may be used to anticipate insulators’ pollutant incidence. This is only one of several approaches that have been developed in the field of insulators. Aside from that, a method known as leakage current component extraction, which has been used by various other studies [22,23,24], is a popular methodology that may assist in forecasting the pollution incidence of an insulator. In this procedure, the Fast Fourier Transform (FFT) and wavelet transform are employed to examine the leakage current signal in the frequency domain. Overall, the findings demonstrate that contamination on the insulator increases leakage current harmonic components, particularly the odd harmonics. Furthermore, the results indicate that pollution increases the 1st and 3rd harmonics as well as the total harmonic distortion (THD) [25]. According to the results in [26], the harmonics in question are the first and third components of an AC system with a frequency of 50 Hz. Consequently, the study found that increasing these harmonics causes an increase in the total harmonic distortion (THD), which varies depending on the degree of pollution and applied voltage harmonics.
Recently, the pre-flashover circumstances of polymeric insulators under polluted environments were explored by utilizing a mix of analytical formulations based on the hybrid genetic algorithm and particle swarm optimization (HGA-PSO) method [26]. The results demonstrated that, under various pollution and pre-flashover scenarios, the relationship between the discharge resistance and the leakage current of experimental specimens were similar to those obtained through analytical formulations in the literature. There was a close connection between genuine experimental data, circuit analytical modeling from prior studies, and the HGA-PSO system. In [27], the time-frequency domain surface leakage current (SLC) signals of an 11 kV polymeric insulator with a polluted surface were analyzed through hyperbolic window Stockwell transform (HST). The authors of [27] concluded that the suggested HST-based feature extraction approach could be used for polymeric insulator status monitoring.
It is highly advantageous to have an indicator that reflects the status of the insulators, as proposed in [15,19]. The authors of [28] used the basic assumption of the frequency components of the leakage current to construct the related indices throughout the context of this issue. When calculating flashover accidents, the indicator which determines the ratio of the 3rd to 5th harmonics of the leakage current and THD was used. The reported results for glass and polymeric insulators revealed a strong relationship between the extent of contamination and the reading of this indicator. Nonetheless, a literature survey revealed that no attempt had been made to compare the conditions of the insulators using different indices that take into account the time signal slope and frequency harmonics up to the 9th component for the leakage current. Compared to the leakage current indicator (3rd/5th) proposed in [28], this approach is expected to produce a more dependable estimate.
The current work aimed to estimate the polymeric insulator condition under different environmental circumstances based on leakage current characteristics in the time and frequency domains extracted experimentally. To simulate the natural medium of insulators during service, the environmental parameters pollution level (SDD), wetting rate (WR), non-soluble deposit density (NSDD), and the non-uniform distribution of pollution (FT/B) were taken into account. The results of the proposed leakage current indicators under the influence of environmental conditions were extracted experimentally. To assess the performance of these indicators, the confusion matrix for experimental data and prediction results using the suggested indices was employed.

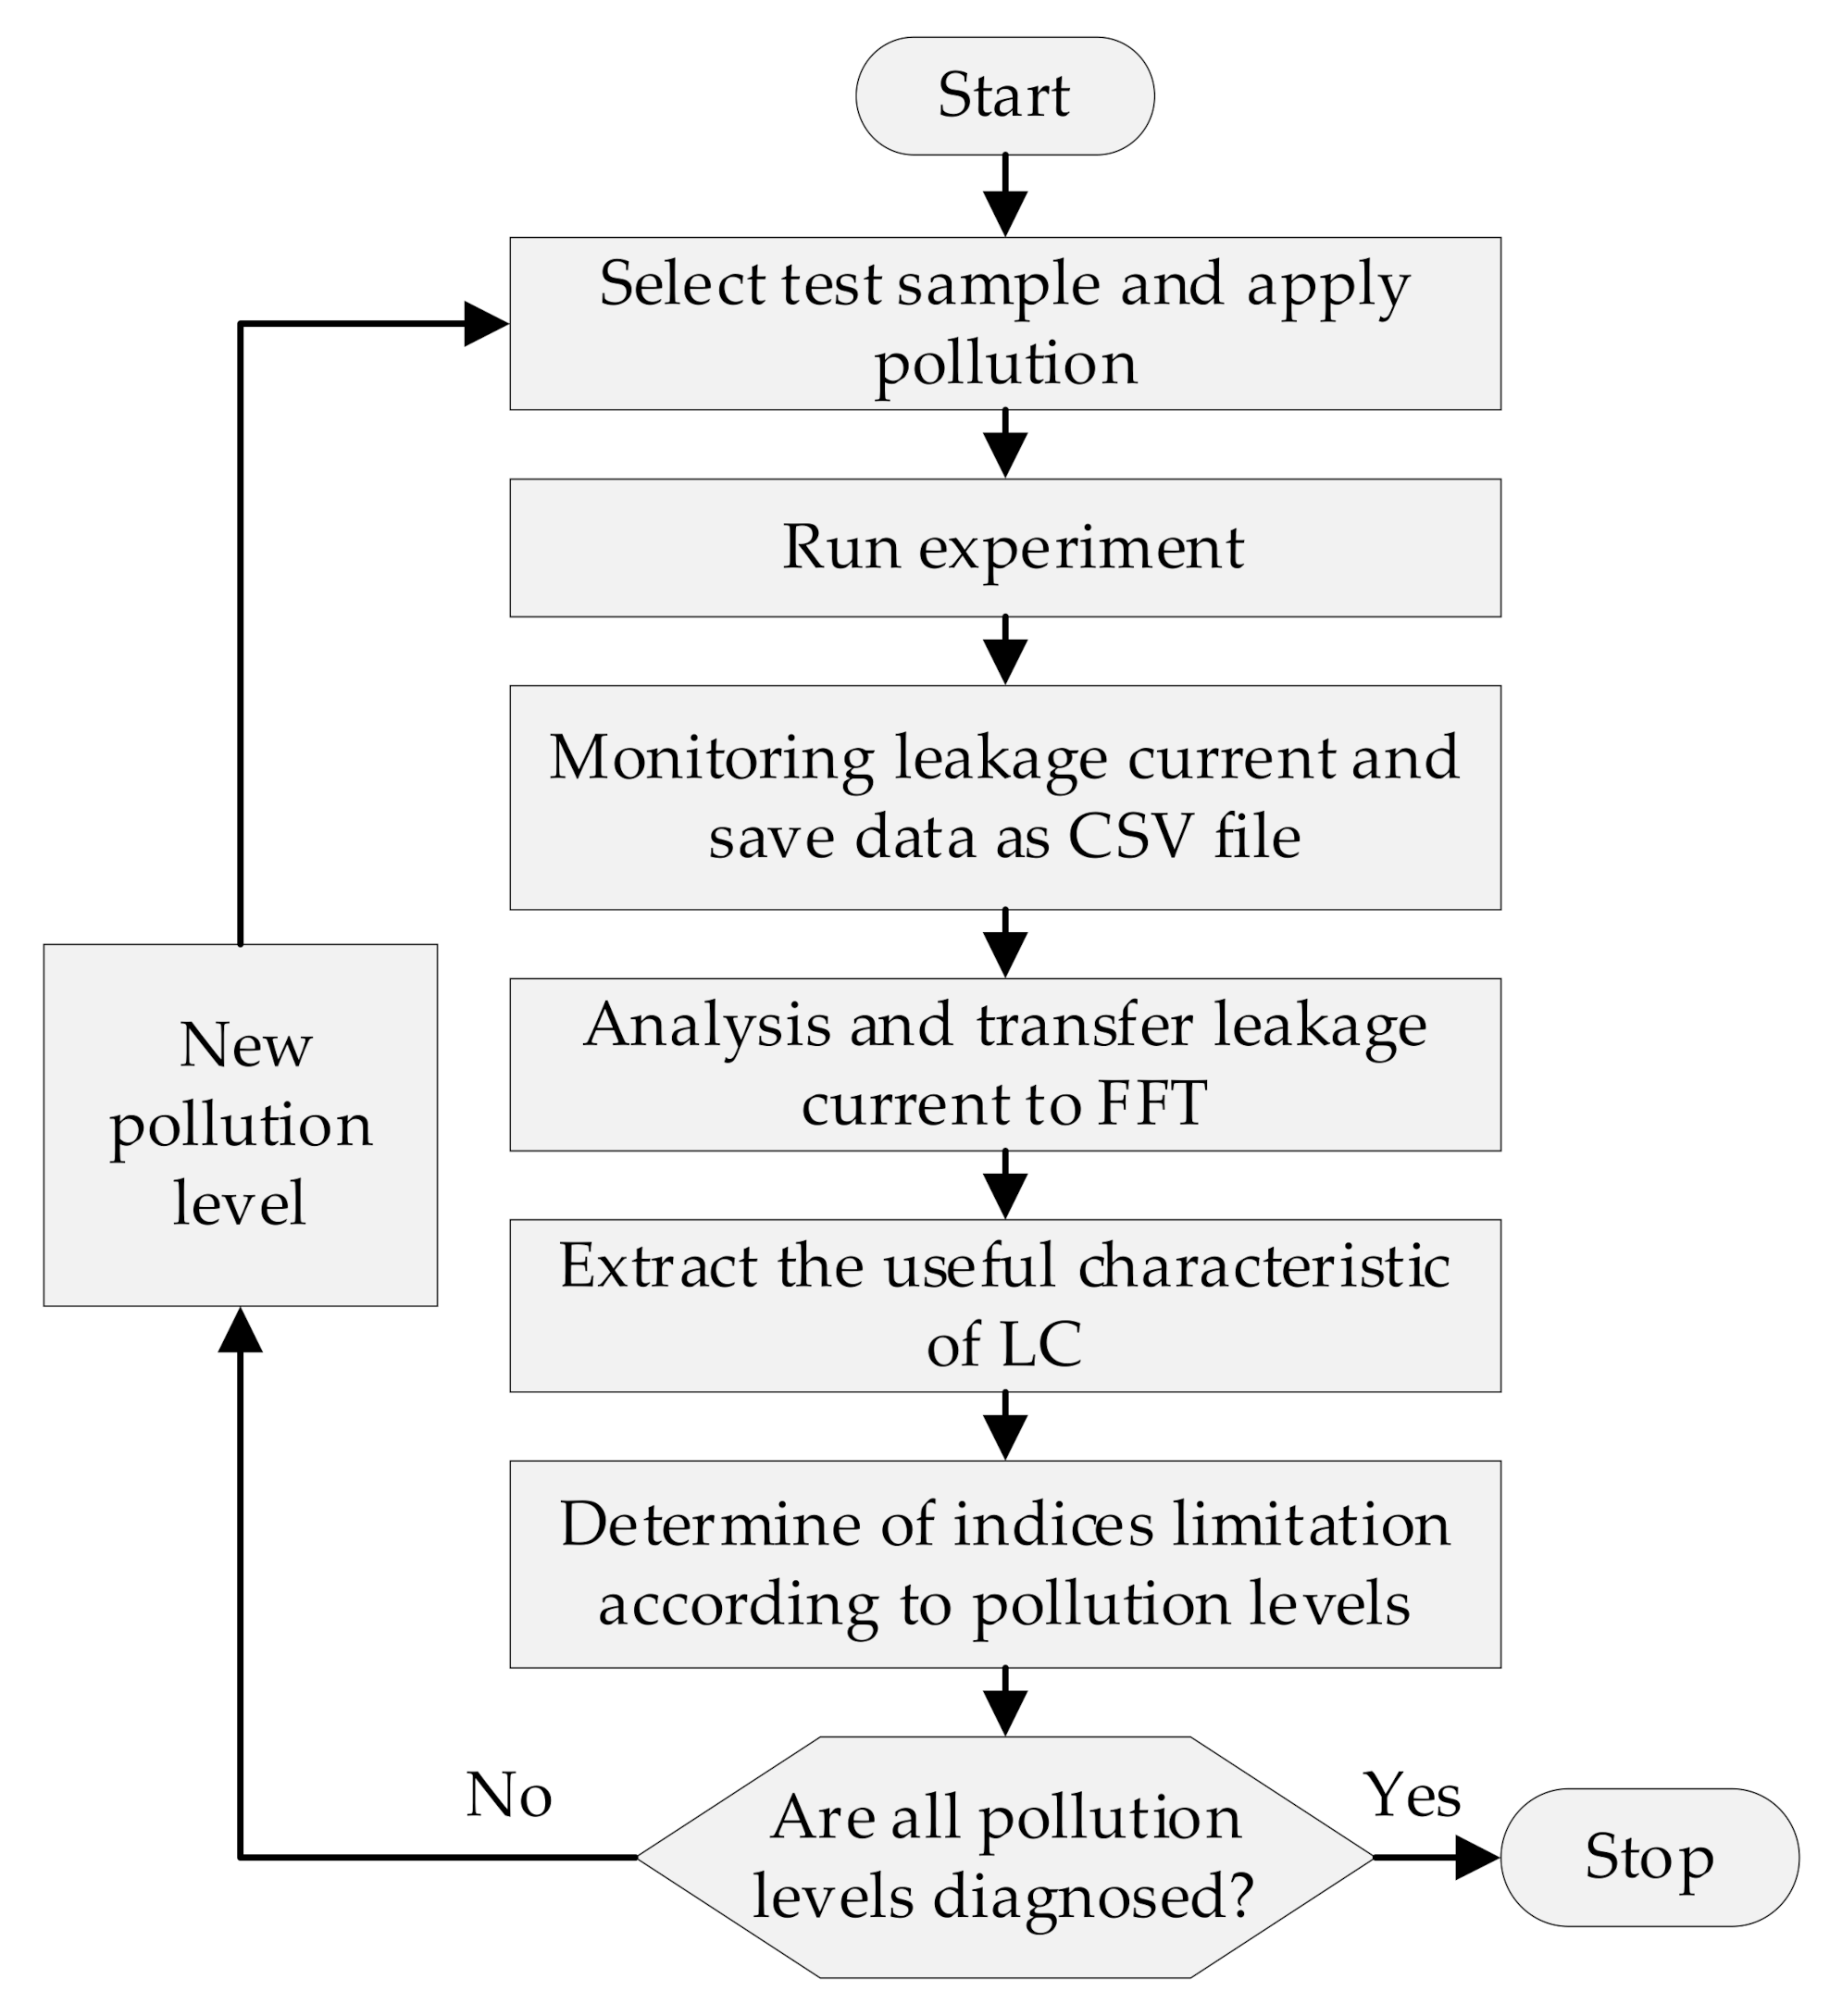
2. Materials and Methods

2.1. Test Sample

The investigated polymer insulators were obtained from the “Transmission Division of Malaysian National Power (TNB)” in order to conduct the experiment. Figure 1 illustrates the main shape of the chosen insulator. Table 1 details the insulator’s characteristics.

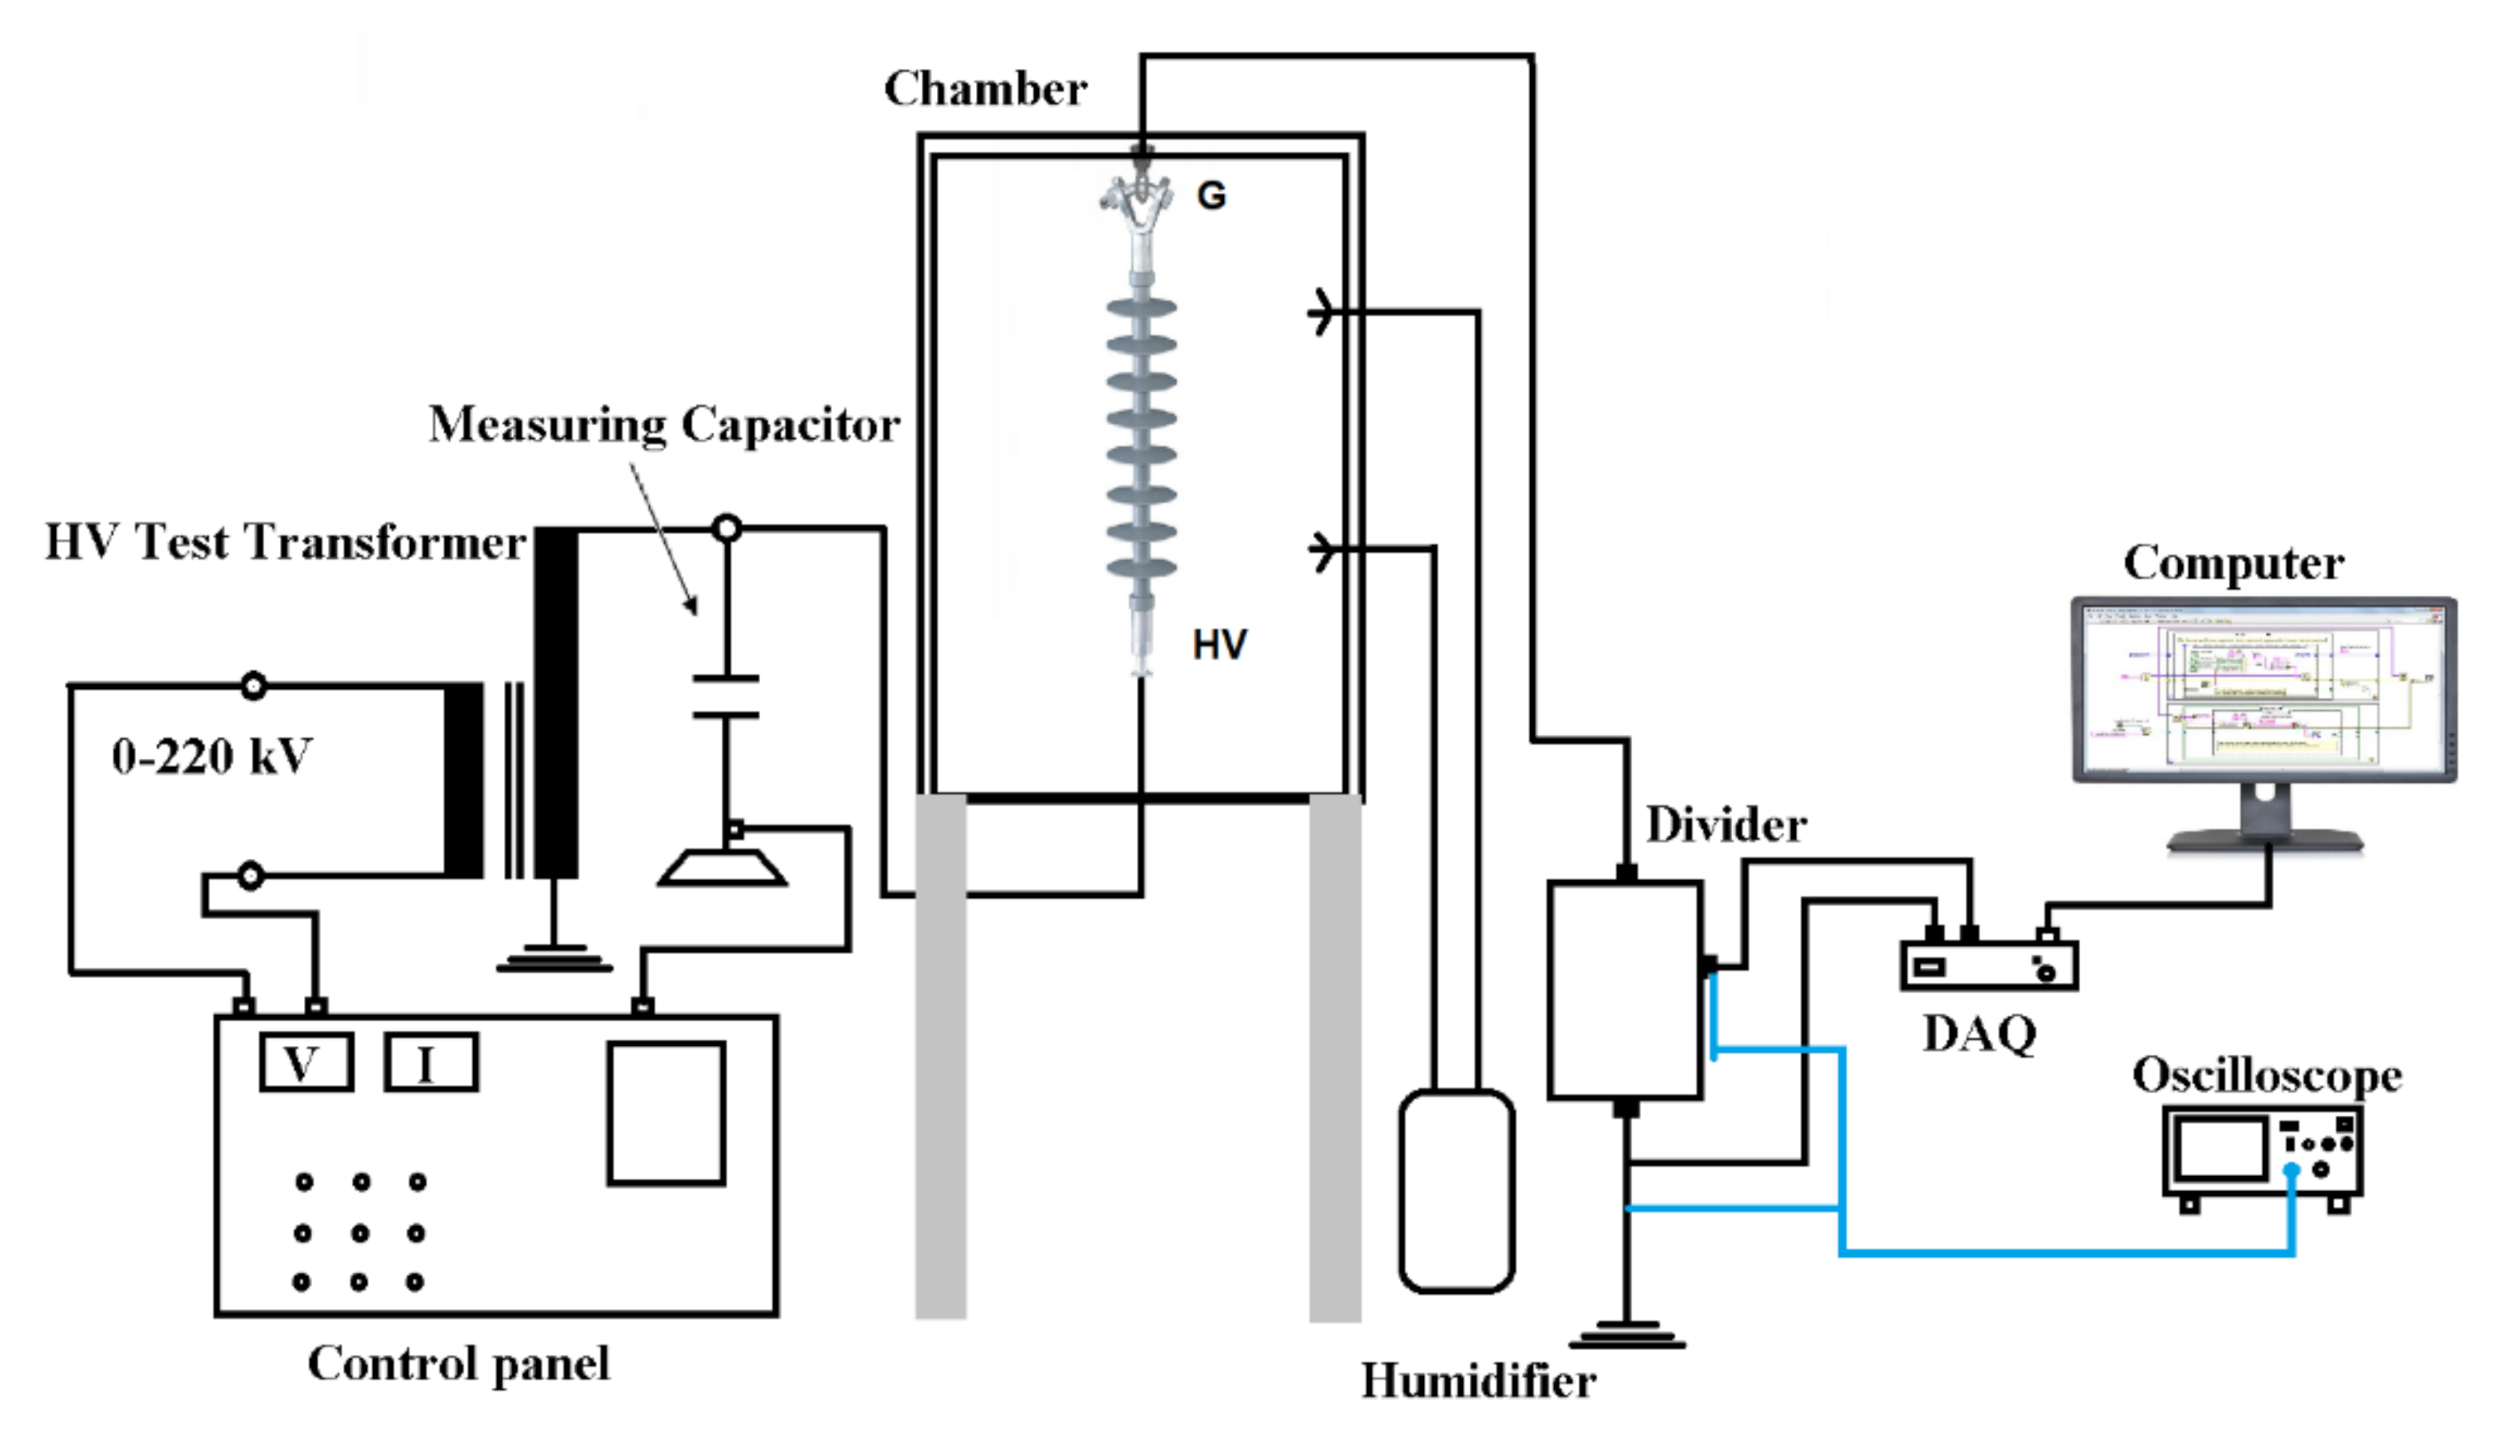
2.2. Experimental Setup

This experimental setup follows the IEC 60507 standard [29]. All studies were carried out in a 50 cm × 50 cm × 75 cm polycarbonate sheet-walled artificial test chamber. Four inlets were constructed on the test chamber wall to soak the tested insulators. The high-voltage insulator experiment setup circuit diagram is demonstrated in Figure 2. The experiment circuit consists of a high-voltage single-phase transformer (230 V/100 kV, 5 kVA, 50 Hz), a capacitor divider (100:25,000 pf), a sample test inside the chamber, a leakage current monitoring system, a steam generator with a wetting rate controller, and a voltage divider (1000:1) by resistors used to measure the leakage current.

2.3. Pollution and Wetting Process

Before the test was carried out, alcohol was used to remove traces of grease and dirt from all specimens. After that, the insulator samples were naturally dried for 1 day. The pollutants were deposited on the surface of the insulator using the solid layer technique [30,31,32,33]. The sodium chloride salt (NaCl) was used as Soluble Deposit Density (SDD) and the kaolin represents the Non-Soluble Deposit Density (NSDD). One liter of water was used to dissolve the sodium chloride salt and kaolin. To determine the SDD value, the electrical conductivity value of the contamination solution at room temperature was measured using a conductivity meter. The IEC 60507 standard [29] was followed to calculate SDD as in Equation (1):
E S D D = ( 5.7 × σ 20 ) 1.03 × V A
where σ20 is the conductivity of the pollution solution at 20 °C, V is the solution volume, and A represents the area of the insulator surface. The NSDD is calculated using Equation (2):
N S D D = [ ( w s w i ) × 10 3 ] A
where ws and wi are the filter paper containing pollution in dry conditions. In this work, three levels of SSD and NSDD values were estimated corresponding to light, medium, and heavy pollution, as listed in Table 2. The specimen was then contaminated and hung vertically on the artificial climate chamber handle, where the contaminated insulators were left to dry naturally for around 24 h. During the experiment, the test room pressure was constant, the same as the laboratory’s atmospheric pressure of ~99.5 kPa. The test chamber temperature was around 28 °C, which would have been the indoor temperature as in Johor Town. The rain method was used in the wetting process. Eight slots distributed regularly in the chamber wall were used to wet the tested insulators. The flow rate of the fog was controlled by the control panel located outside the HV test room. This controller was utilized to adjust the flow rate of the water and air pressure, which help to control the wetting rate of the contaminated insulators. Three levels of wetting rates were chosen: 3 l/h, 6 l/h, and 9 l/h, which were used to simulate the wetting of insulators in various climates.
The polymer insulator was tested under uniform and nonuniform pollution distribution. In non-uniform pollution, three different pollution ratios of the upper to the lower side of ESDD (FT/B) were chosen to be 1/5, 1/10, and 1/15. During the nonuniform application of contamination, the upper and bottom surfaces of the insulator are contaminated separately to obtain SDDT and SDDB, while the overall SDD can be fulfilled by [5,34,35]:
E S D D = S D D T × A T + S D D B × A B A T + A B
where AT and AB are the areas of the top and bottom surfaces of the insulator, respectively.

2.4. Monitoring of Data

Referring to the experimental setup in Figure 2, the applied voltage was measured using a capacitive divider voltage and oscilloscope in the control panel. For the leakage current, the monitoring system of the LC consists of a DAQ card, PC, and oscilloscope. Because the allowable input voltage range of DAQ is ±10 V, a downscaling voltage divider (10,000:1) was used. Data were transferred from the DAQ to a PC, then saved as a CSV file, and displayed on a LabVIEW graphical user interface. For correct measurements, the oscilloscope was also used to verify the DAQ reading of data. The leakage current data stored were analyzed in the frequency domain using MATLAB software.

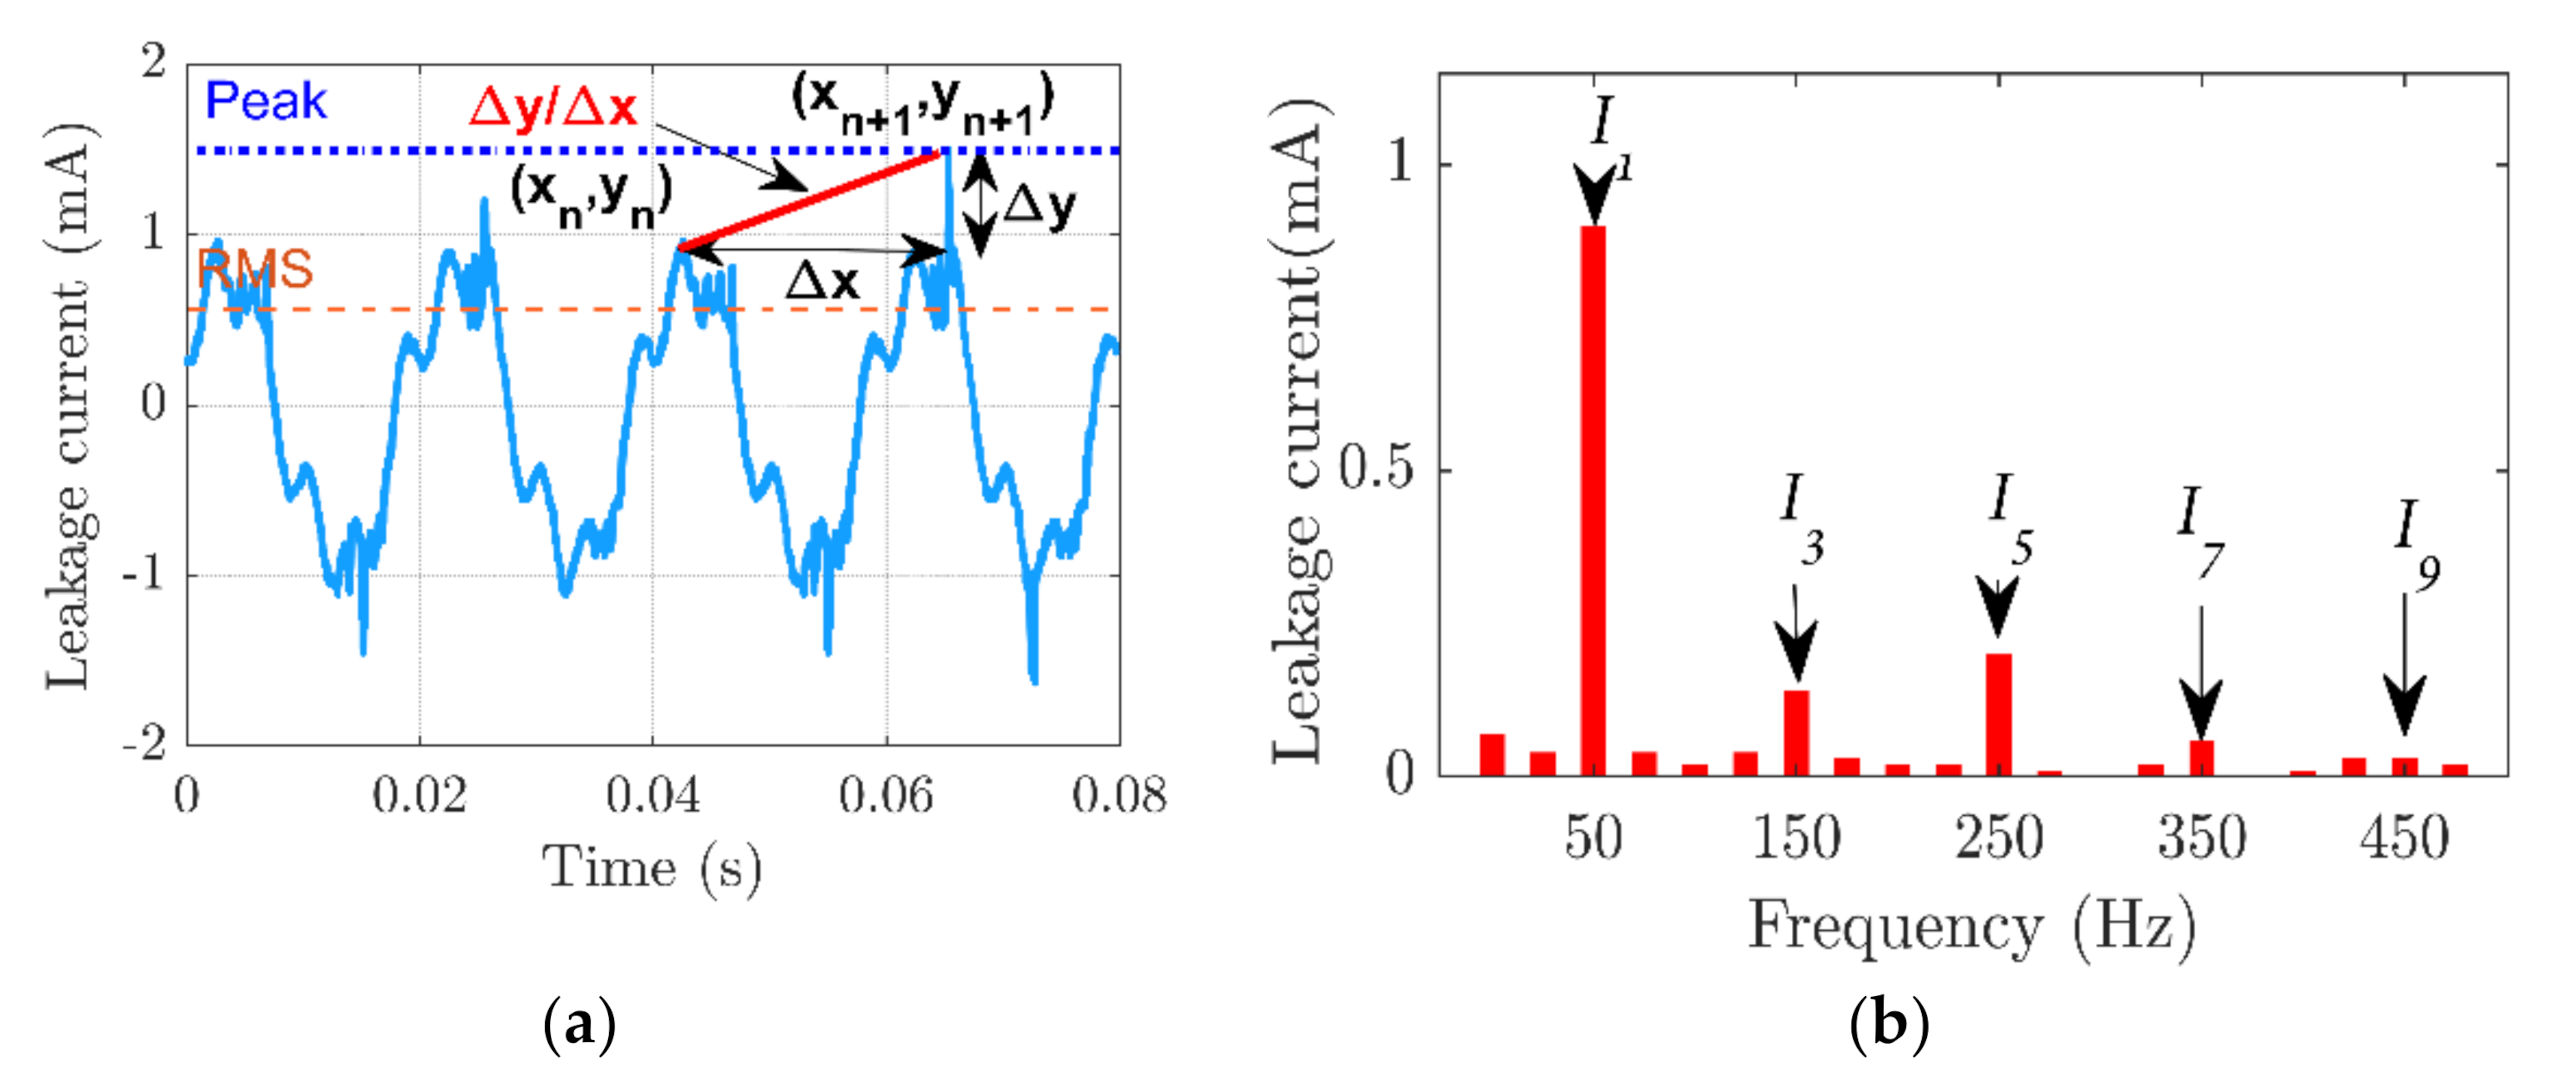
2.5. Leakage Current Features

One way to develop new tools for diagnosing the safety state of contaminated insulators is to extract advantageous features from leakage current data. The frequency domain and time domain of the LC signal may be used to obtain these features. In this research, four indices for leakage current are recovered in both the temporal and frequency domains. Figure 3 depicts the insulator condition diagnostic procedure utilizing leakage current features.
Indicators for insulator states were derived from leakage current characteristics in time and frequency domains. The slope of the line connecting two successive peaks of the leakage current signal was used to calculate the first indicator, F1. The second indicator, F2, is based on the crest factor, which was computed by dividing the peak to RMS ratio of the leakage current waveforms by two. The third, F3, and fourth, F4, indicators were determined by utilizing the odd harmonics of the leakage current under 500 Hz. The proposed indicators were expressed as follows:
F 1 = n = 1 m y n y n 1 x n x n 1 = 0 m Δ y n Δ x n
F 2 = I p e a k I R M S
F 3 = n I n I 3                n = 5 , 7 , 9
F 4 = I 5 I 3         
where ∆yn represents the difference in the leakage current between adjacent peaks at the nth point of time, ∆xn represents the time between these peaks, Ipeak is the peak value of the leakage current, IRMS is the root mean square of the leakage current, I3 is the third harmonic of the leakage current, I5 is the fifth harmonic of the leakage current, In is the nth order harmonic, and n represents the odd-order harmonic numbers. Figure 4 depicts the leakage current characteristics in the time and frequency signals used to calculate the proposed indicators.

3. Results and Analysis

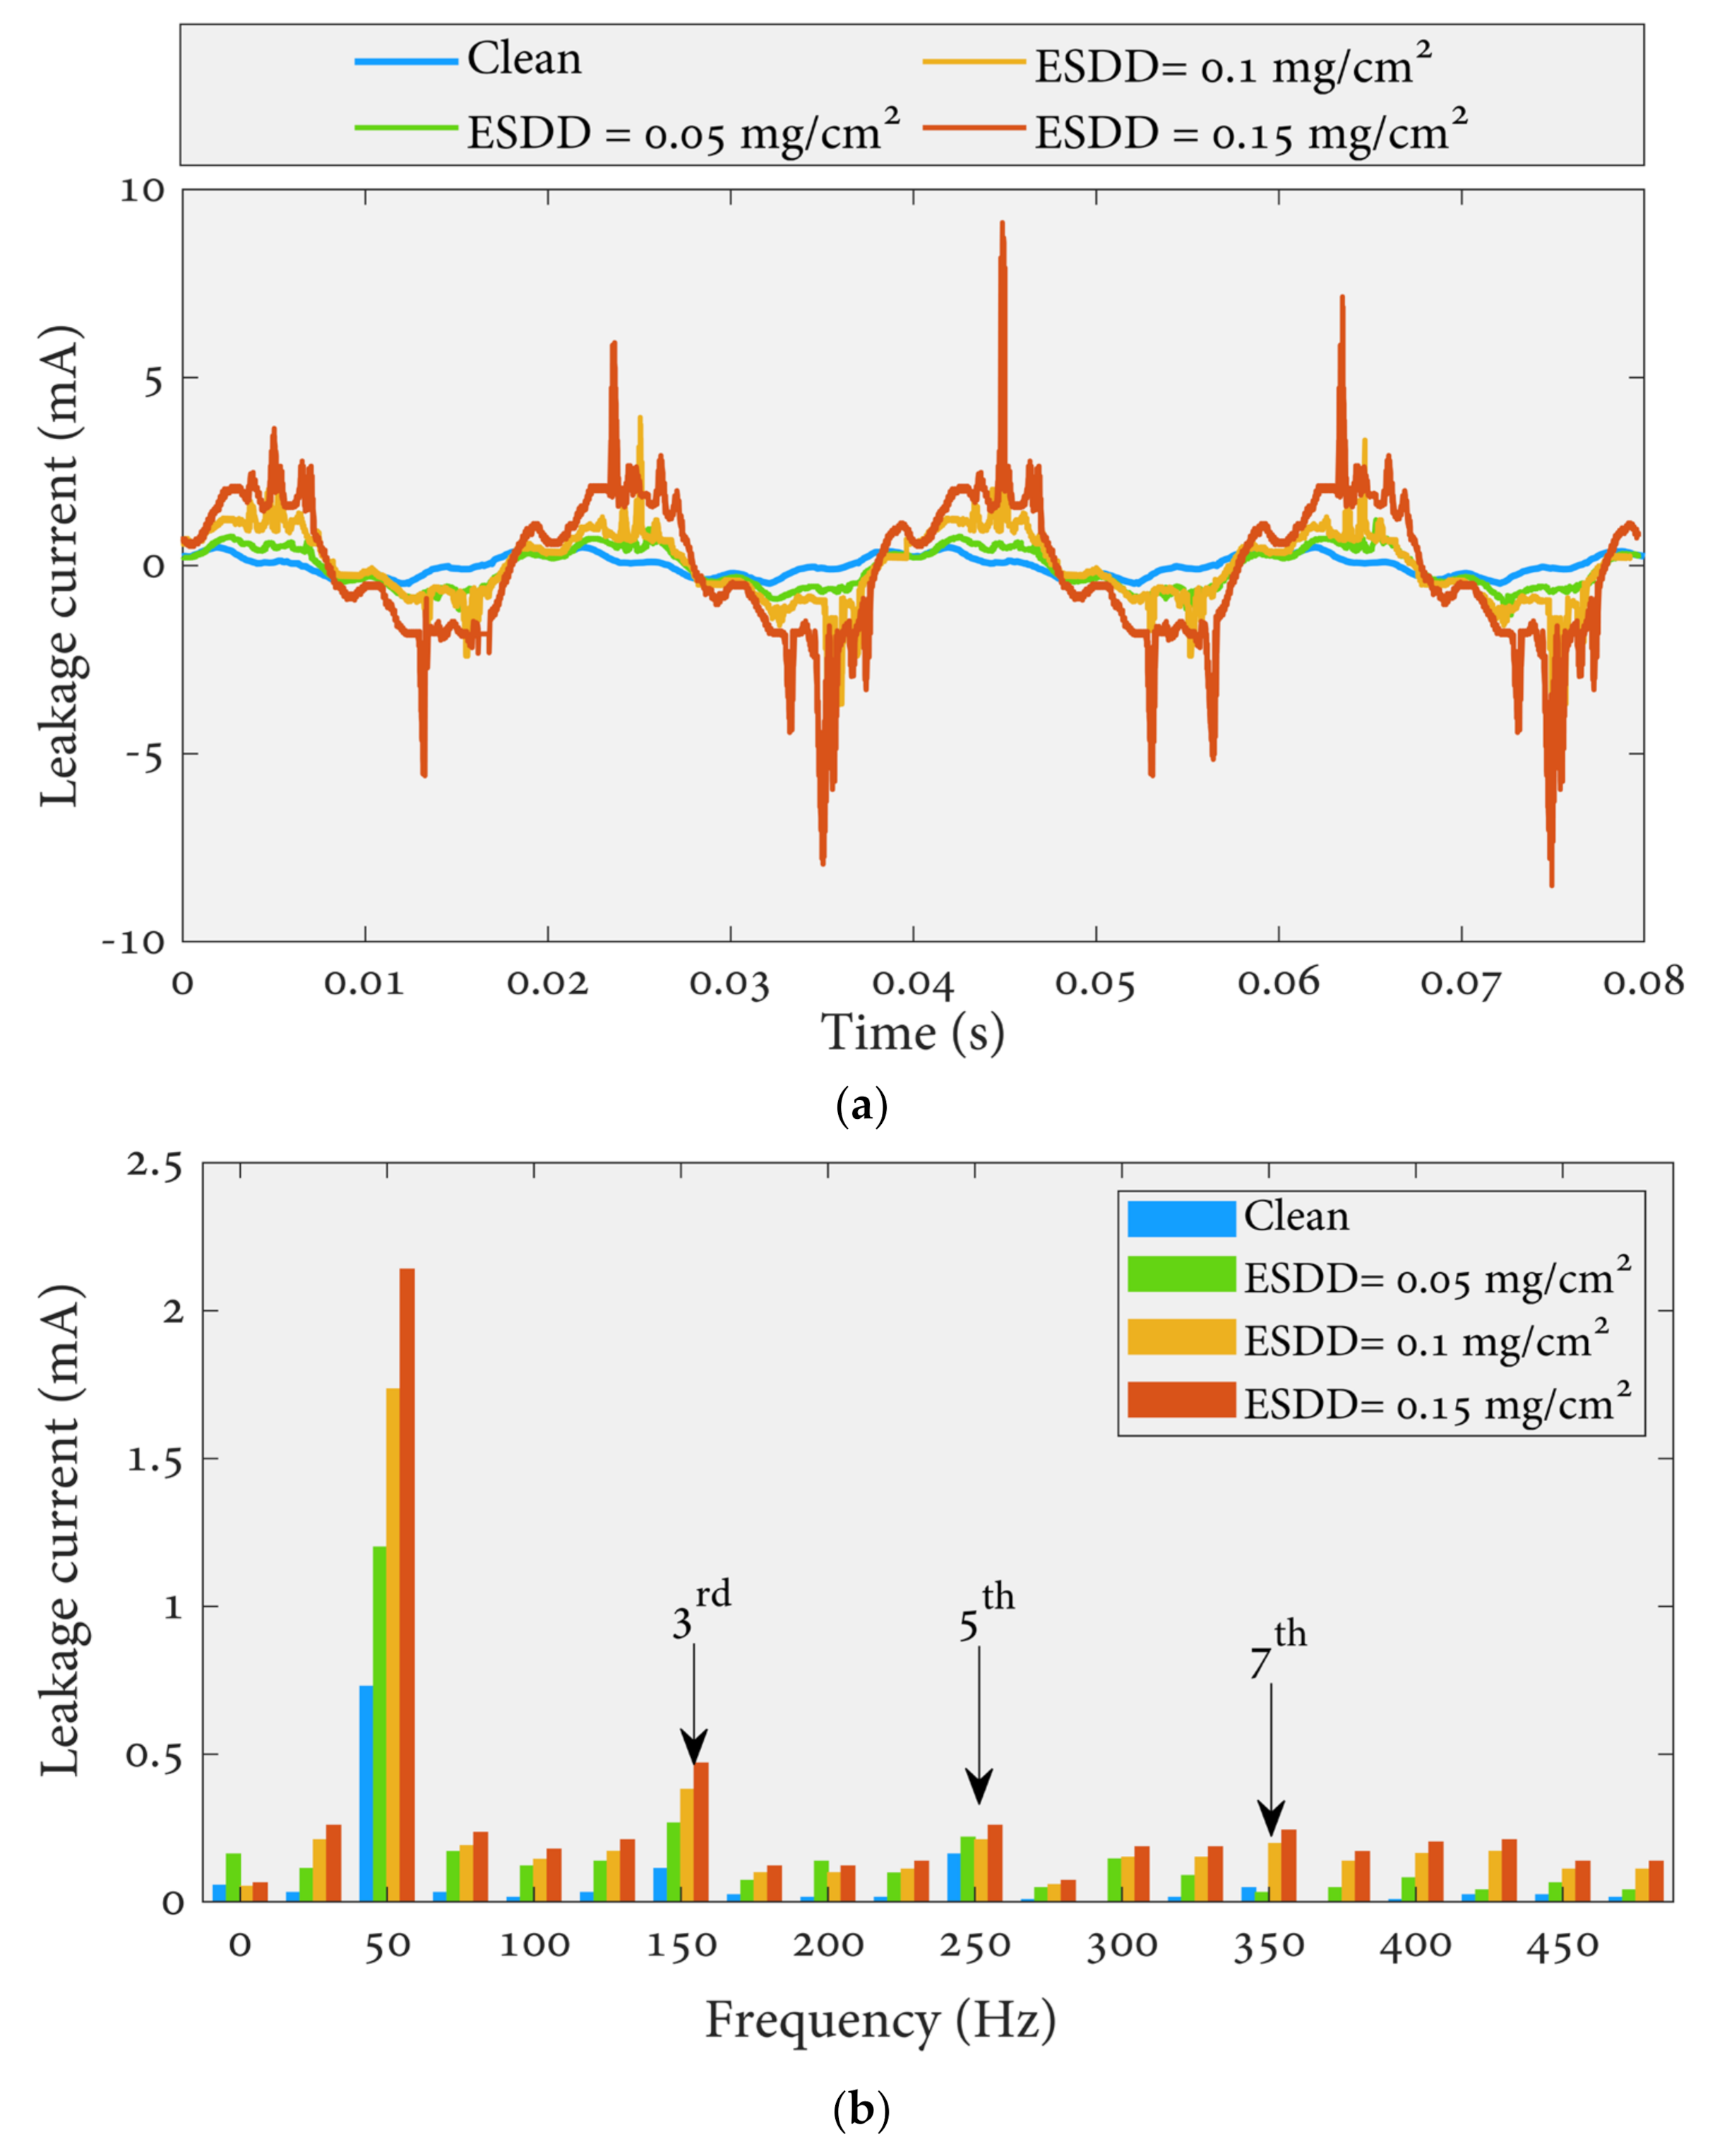
3.1. Leakage Current Findings

The leakage current waveform in the time domain was measured and converted to FFT using MATLAB software. Some leakage current results in time and frequency domains under different uniform pollutions, 0.15 mg/cm2 of NSDD, and 3 l/h of wetting rate are depicted in Figure 5.
Figure 5 shows a significant increase in the leakage current due to increased pollution severity under certain NSDD, wetting rate, and FT/B. The possible explanation for the current rising is the formation of a film due to pollution and wetness, which increases the conductivity along the surface of the insulator. As a result, an easy path was produced for the flow current in the form of positively and negatively charged ions between insulator electrodes. Under heavy pollution conditions, occasional spot-arcing was observed, especially in the presence of wetness. When the arcing was occurring, the leakage current signal became severely warped. Meanwhile, an increase in the leakage current was followed by an increase in the harmonic values. On the other hand, a significant difference in the components (3rd, 5th, 7th, and 9th) can be noticed when increasing the pollution degree on the surfaces of the insulators. The 3rd harmonic will rise to exceed the 5th, 7th, and 9th, with an apparent increase in the 7th and 9th, as reported in Figure 6. Furthermore, during arcing activity on the surface of the insulator, the third harmonic component is often considerably high [36].
Table 3 illustrates the measured leakage current components values under uniform contamination for all conditions proposed in Table 1. The experimental results showed no signs of a flashover in clean and light pollution conditions. The leakage current increased slightly as the wetting rate increased when the clean insulators were tested under different wetting conditions. This means that wetting on the insulator surface has a noticeable ability to raise the flow charges from the HV electrode to the ground electrode.
According to Table 3, the leakage current value on a clean surface of the insulator is minimal, around 0.183 mA, and predominantly capacitive, with a phase change angle of about 90°. In a clean and dry scenario, the fifth harmonic component is always greater than the third component. Figure 6 shows the leakage current results of the polluted insulator with the change of the uneven contamination (FT/B), equivalate soluble deposit density (ESDD), wetting rate (WR), and non-soluble deposit density (NSDD). Overall, it can be seen from test data in Figure 6 that the leakage current is expected to grow substantially as the pollution levels (ESDD), NSDD, and wetting rate rise. Variations in leakage current amplitude increased as the ESDD, NSDD, and WR increased and Pu/Pl decreased. In dry conditions, surface conductivity is thought to be at its lowest. Accordingly, the effect of increasing the ESDD and NSDD on leakage current and its components under dry conditions was also slight. The linear fit was utilized to estimate the association between leakage current and SDD, NSSD, and the wetting rate at various (FT/B) values (Figure 6). The slope and intercept of linear model details are shown in Figure 7.

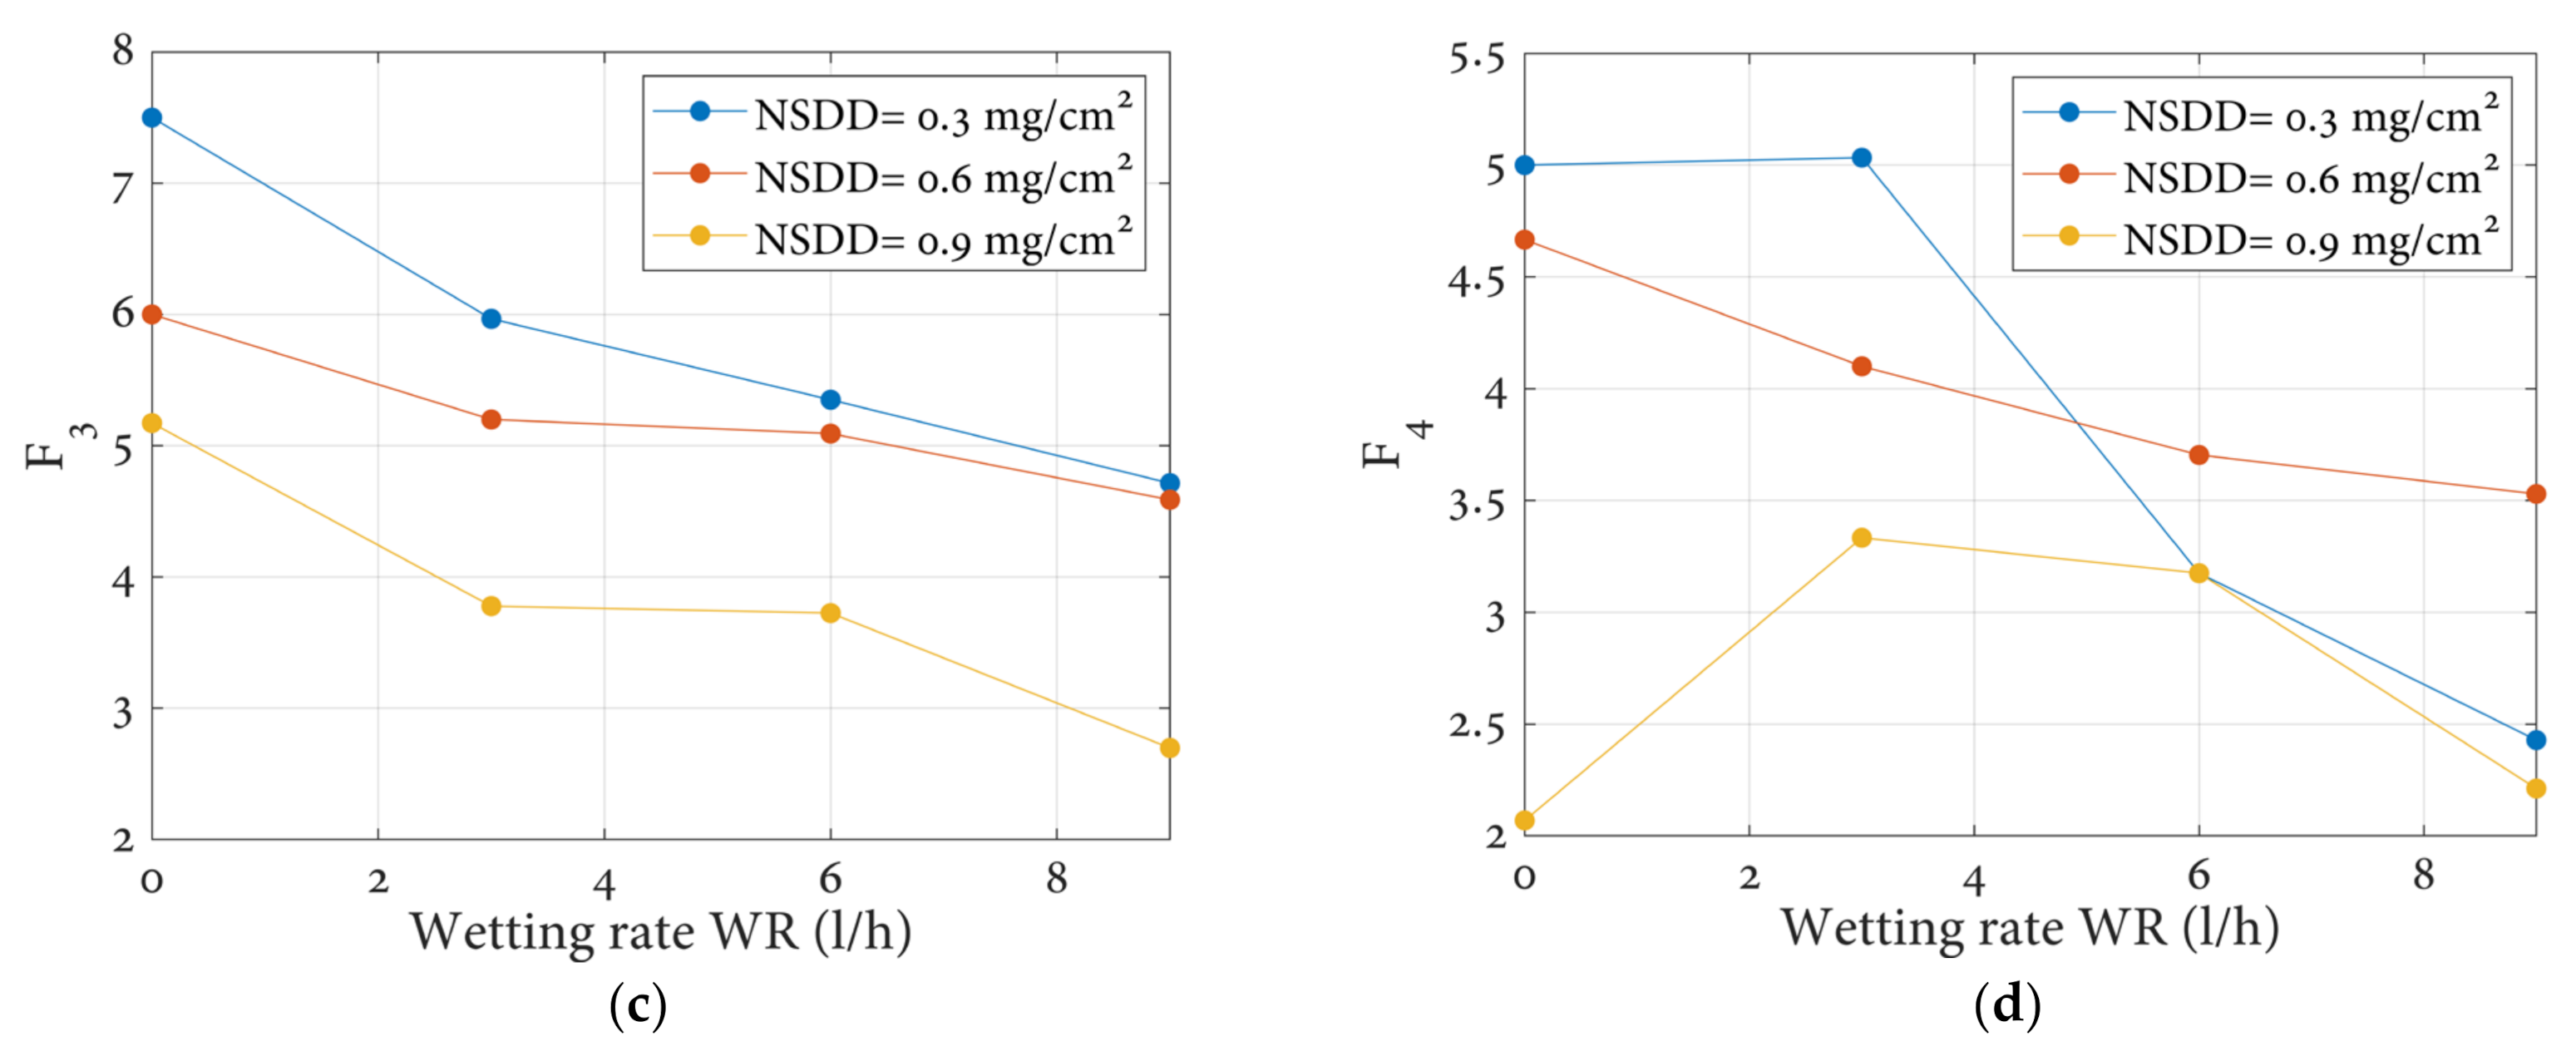
3.2. Leakage Current Indicators Results

As previously stated, the leakage current value changes slightly as the wetting rate changes under clean conditions; similarly, the time and frequency characteristics of the leakage current will change. Figure 7 shows the leakage current indices of the clean insulator under different wetting rates. Each indicator has a special behavior when changing the wetting rate and NSDD. According to Figure 7, it can be concluded that:
(1)
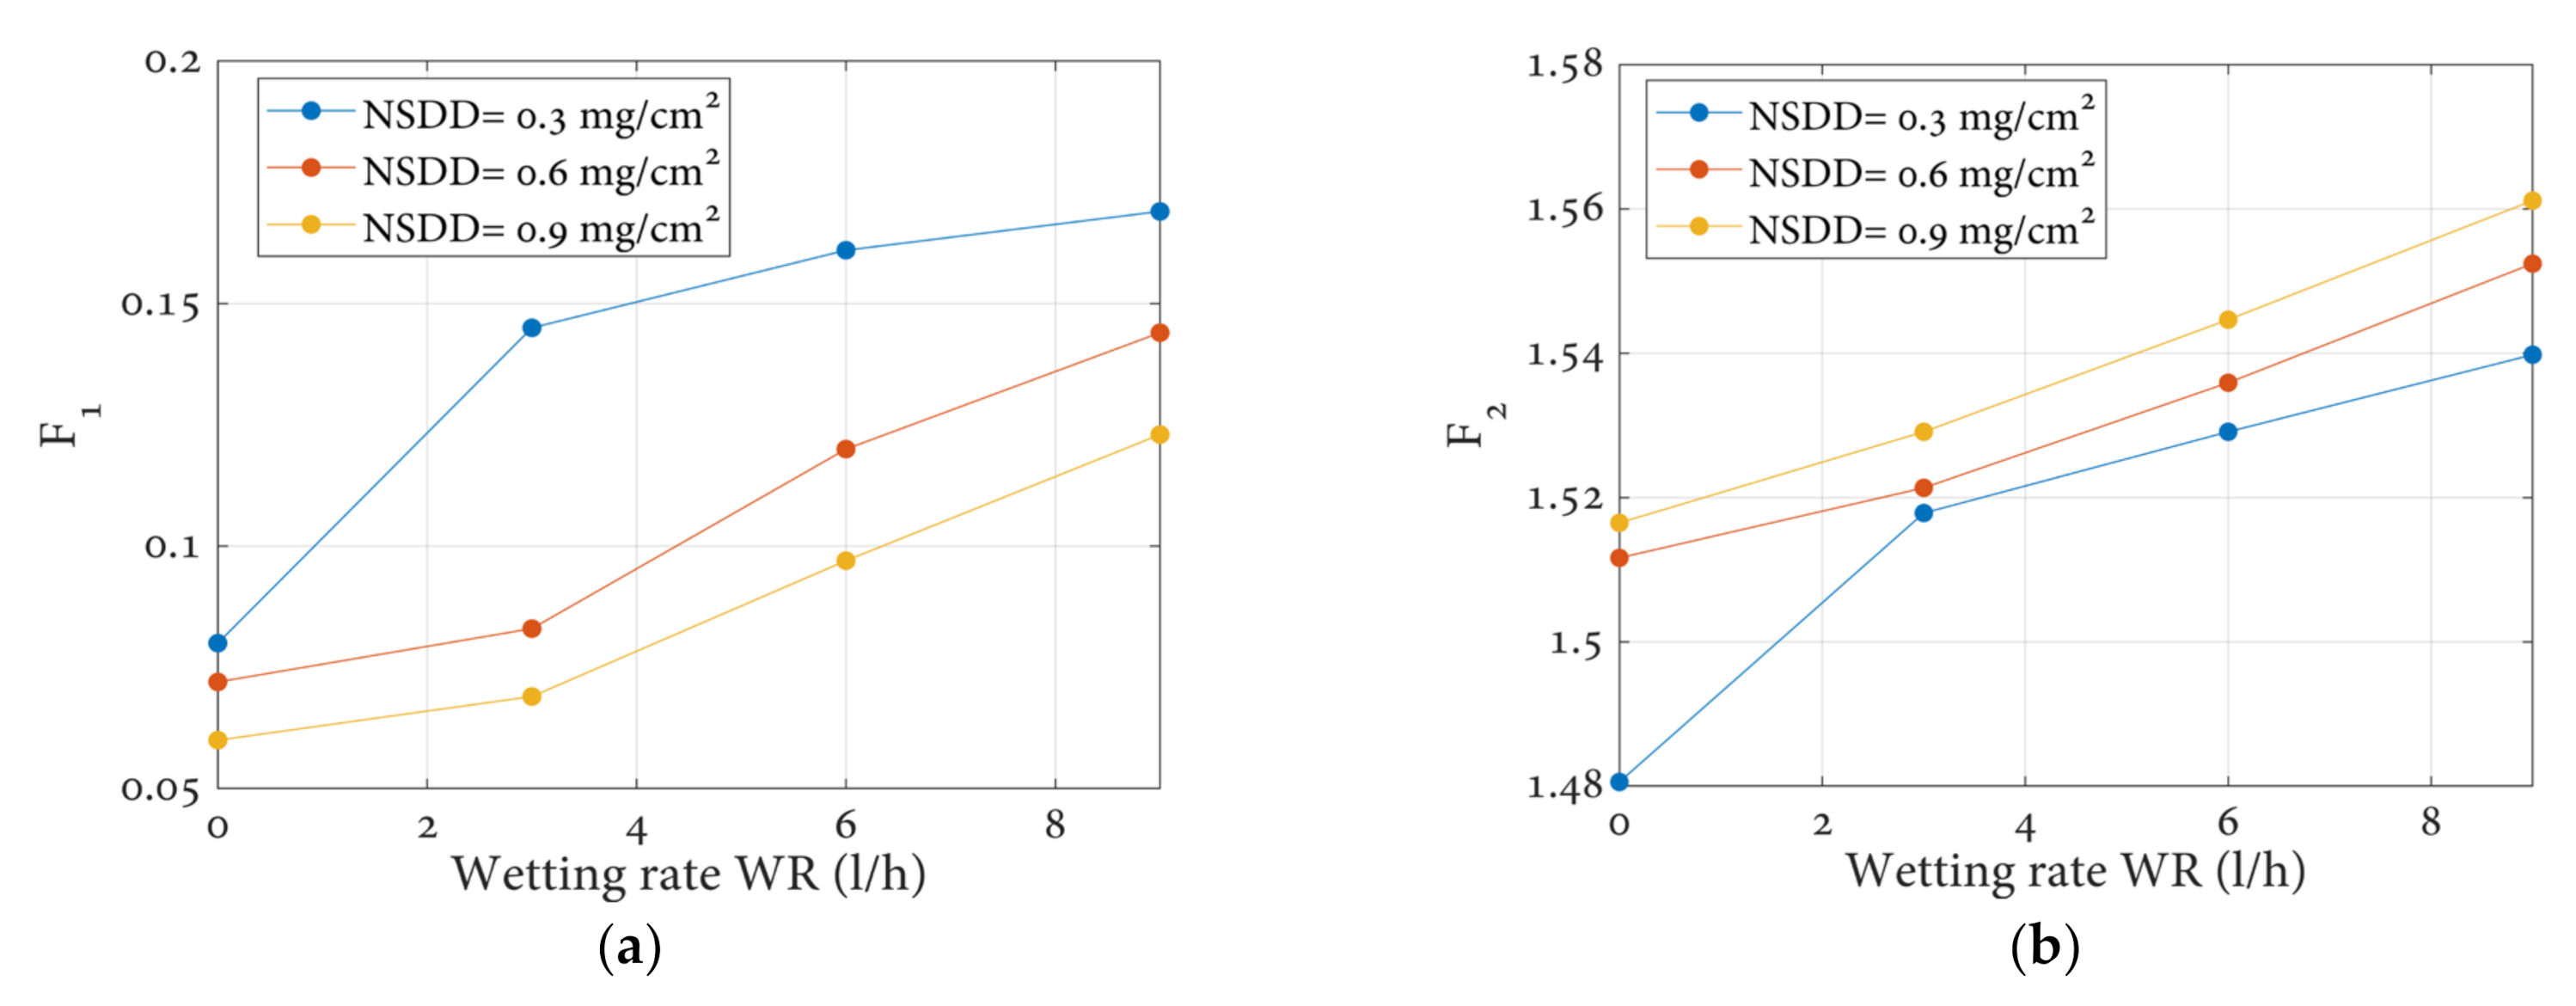
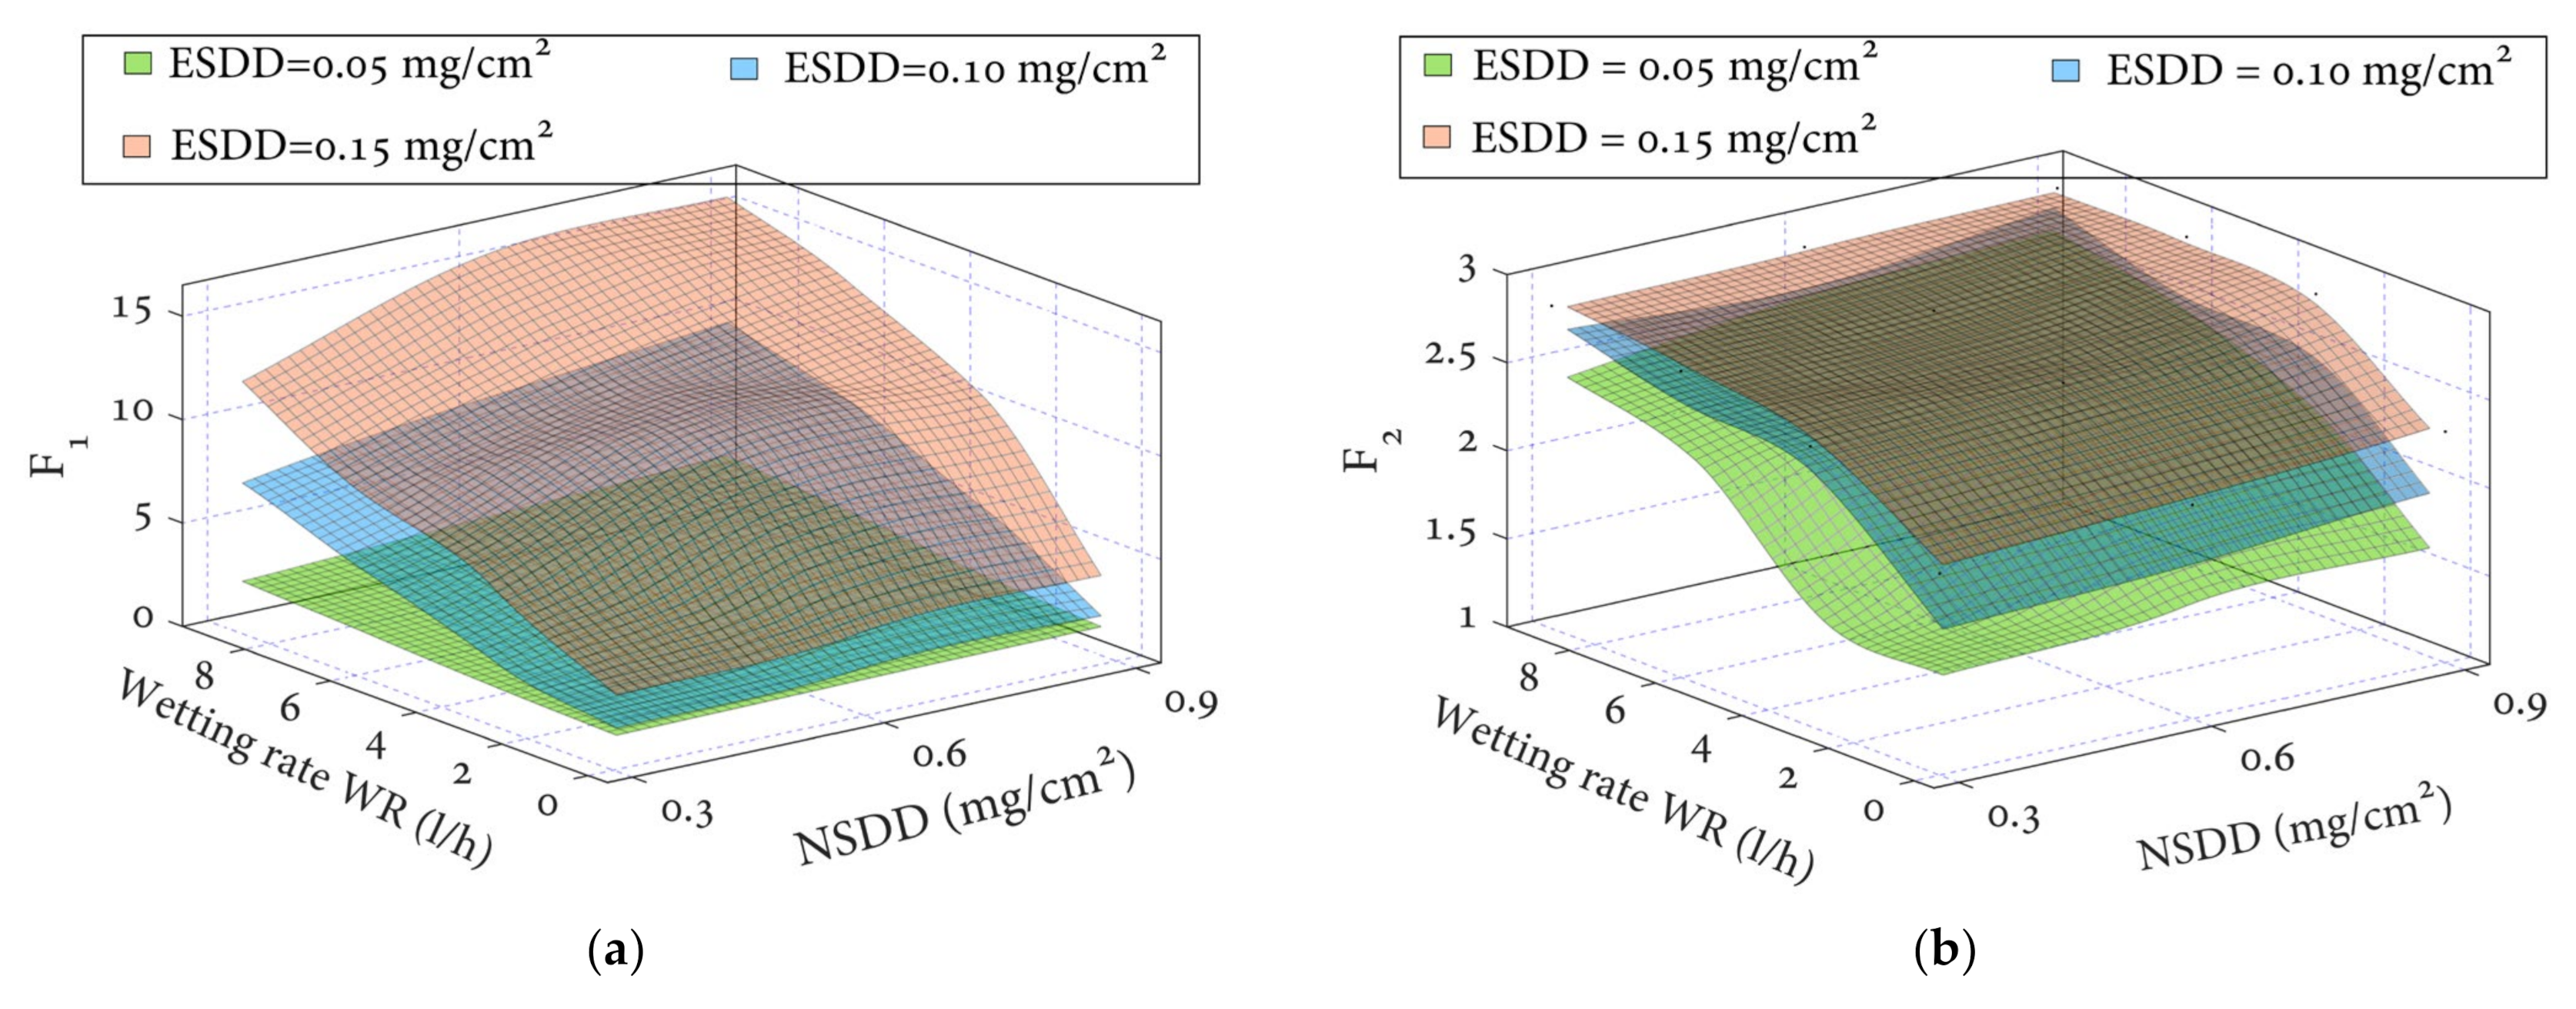
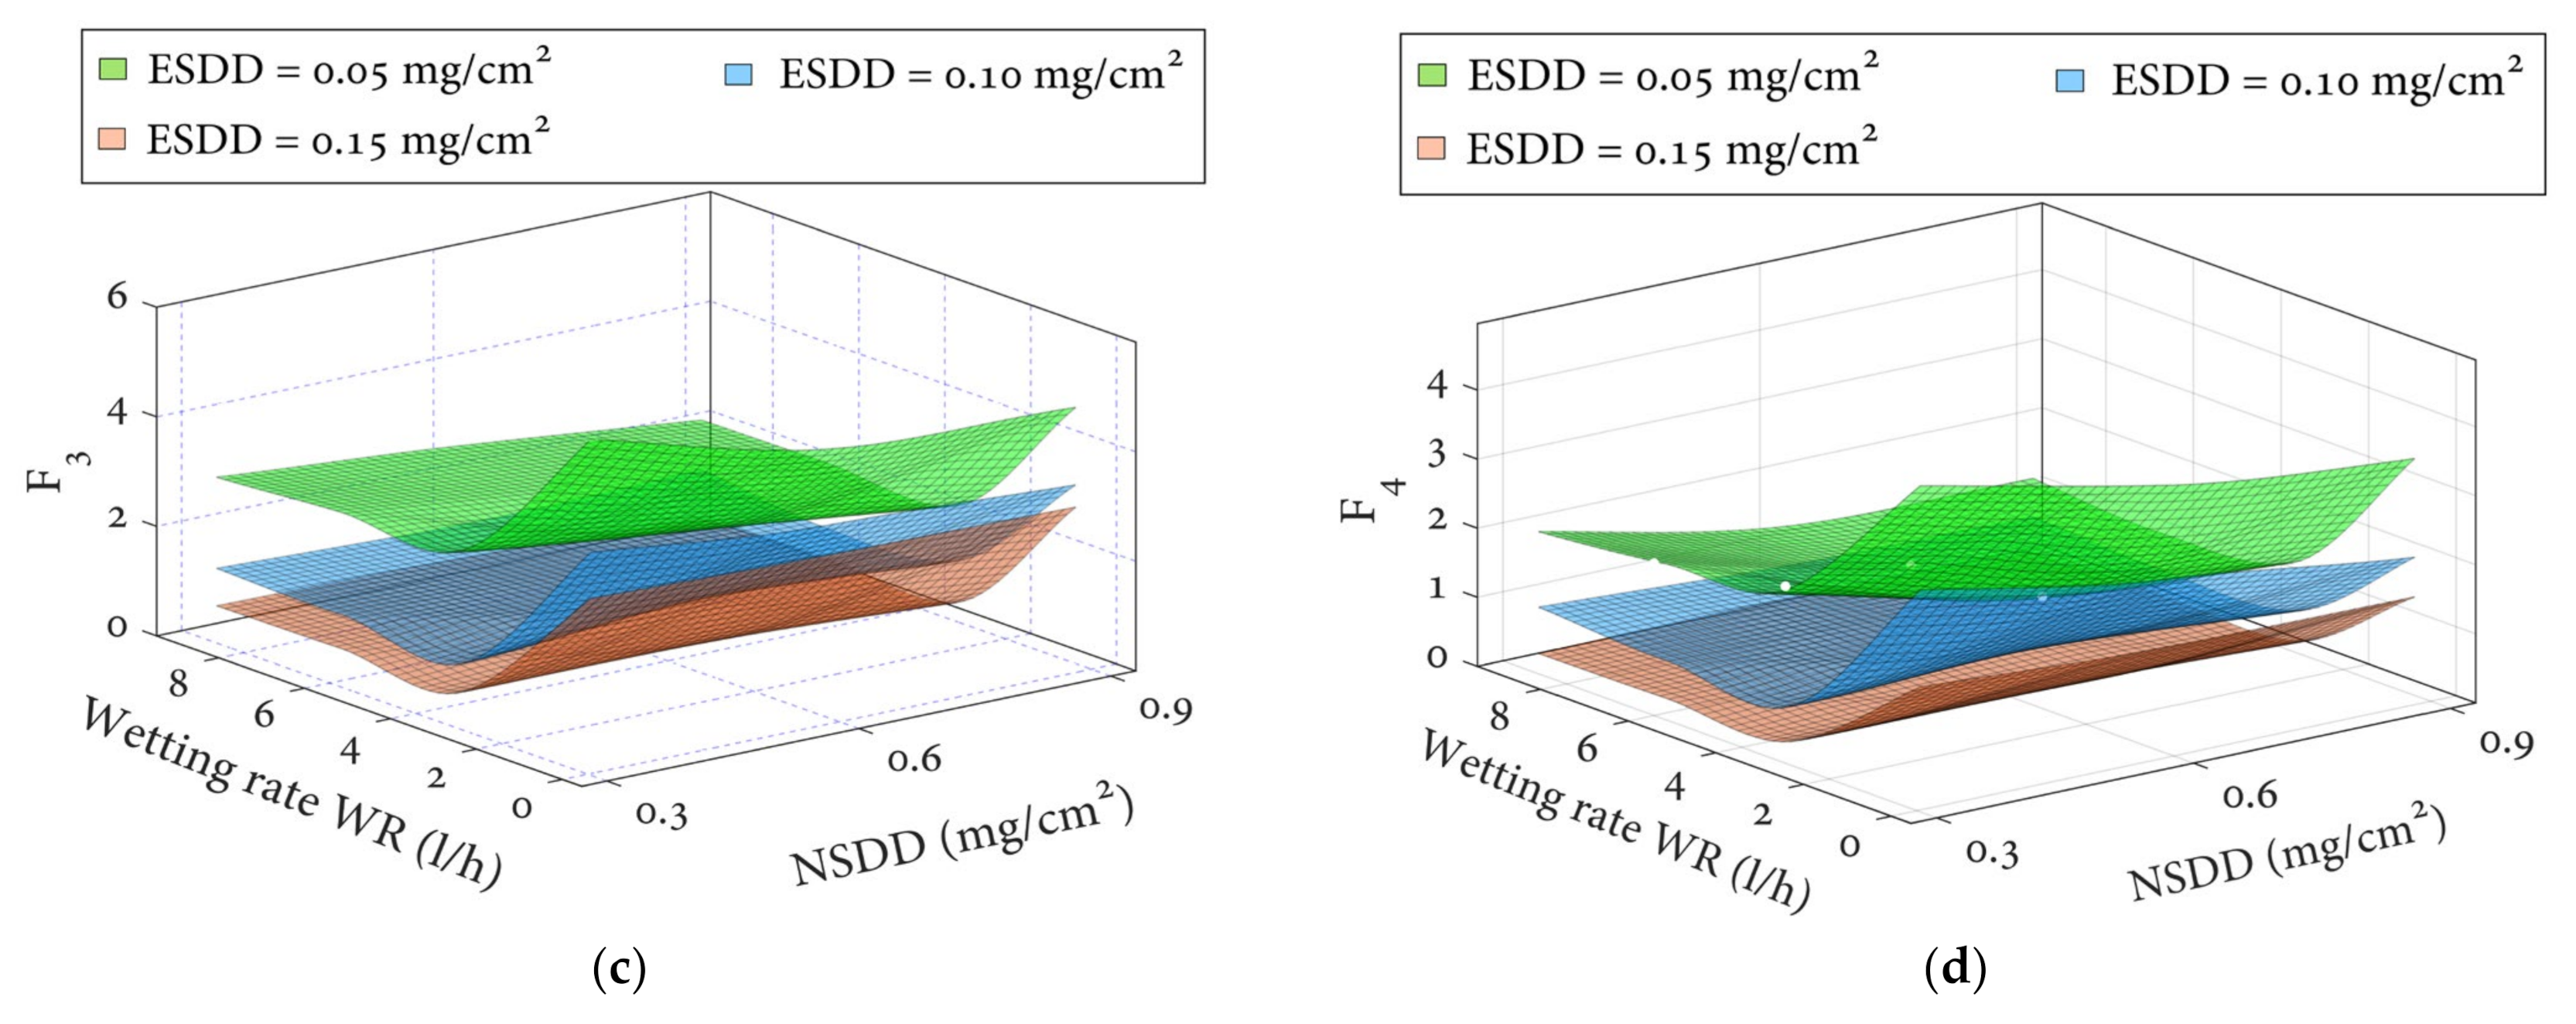
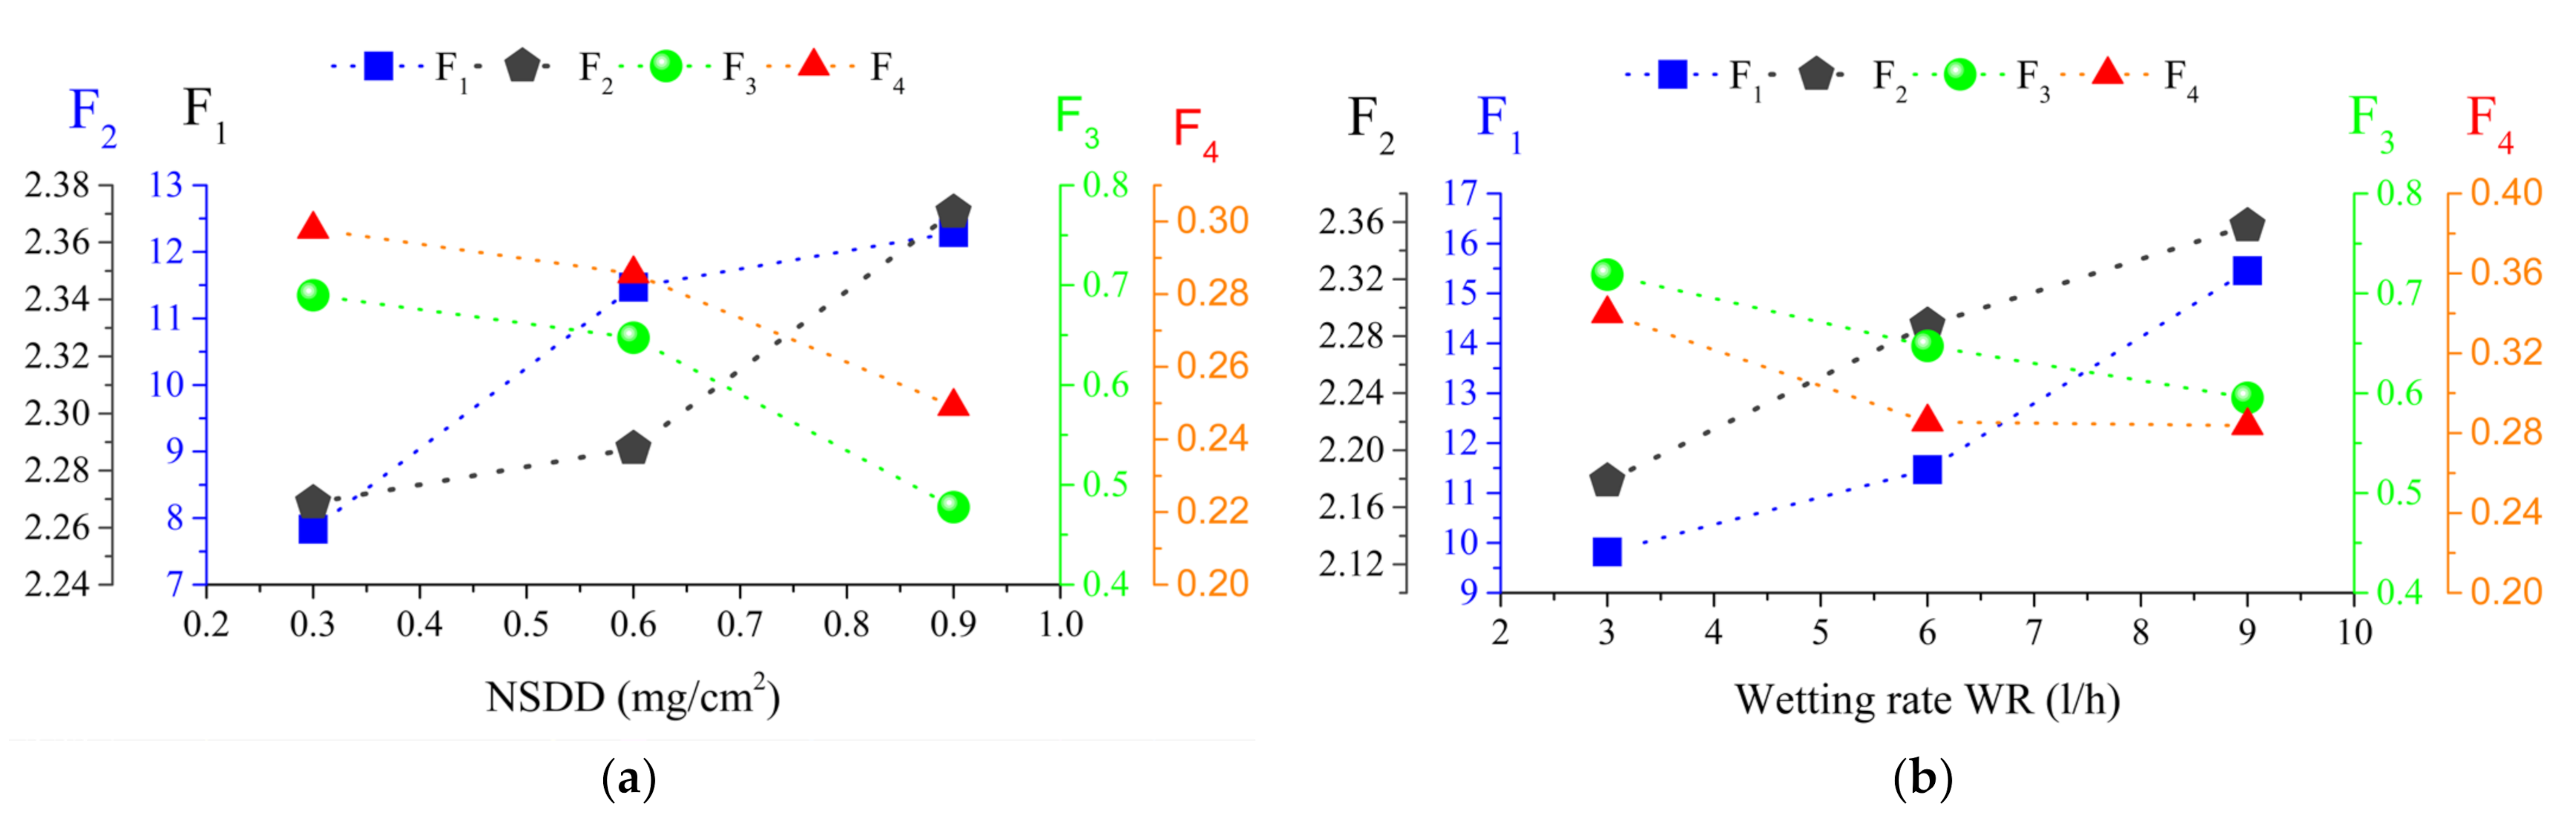
With an NSDD change at the same wetting rate, WR, there is a considerable influence on the presented indicators.
(2)
The F1 and F2 indices increase with the increase of both the wetting rate and NSDD. It can be seen that when the WR increases from 3 l/h to 9 l/h under a certain NSDD of 0.3 mg/cm2, the F1 increases from 0.08 to 0.17 and F2 increases from 1.516 to 1.56.
(3)
The F3 and F4 decrease with the increase of both wetting rate, WR, and NSDD. It can be observed that when the WR increases from 3 l/h to 9 l/h under a certain NSDD of 0.3 mg/cm2, the F2 decreases from 7.51 to 4.74 and F4 decreases from 5.09 to 2.47.
(4)
At a particular wetting rate, the F4 is strongly impacted by harmonics in the leakage current waveform and becomes inaccurate as a monitoring indication, as seen in Figure 8d. In comparison, while the F1, F2, and F3 remain fairly stable under constant wetting rate regardless of harmonics in the leakage current signal, increasing the wetting rate causes an increase in the F1 and F2 and a decrease in the F3, making them more reliable indices for monitoring the insulator state than the F4.

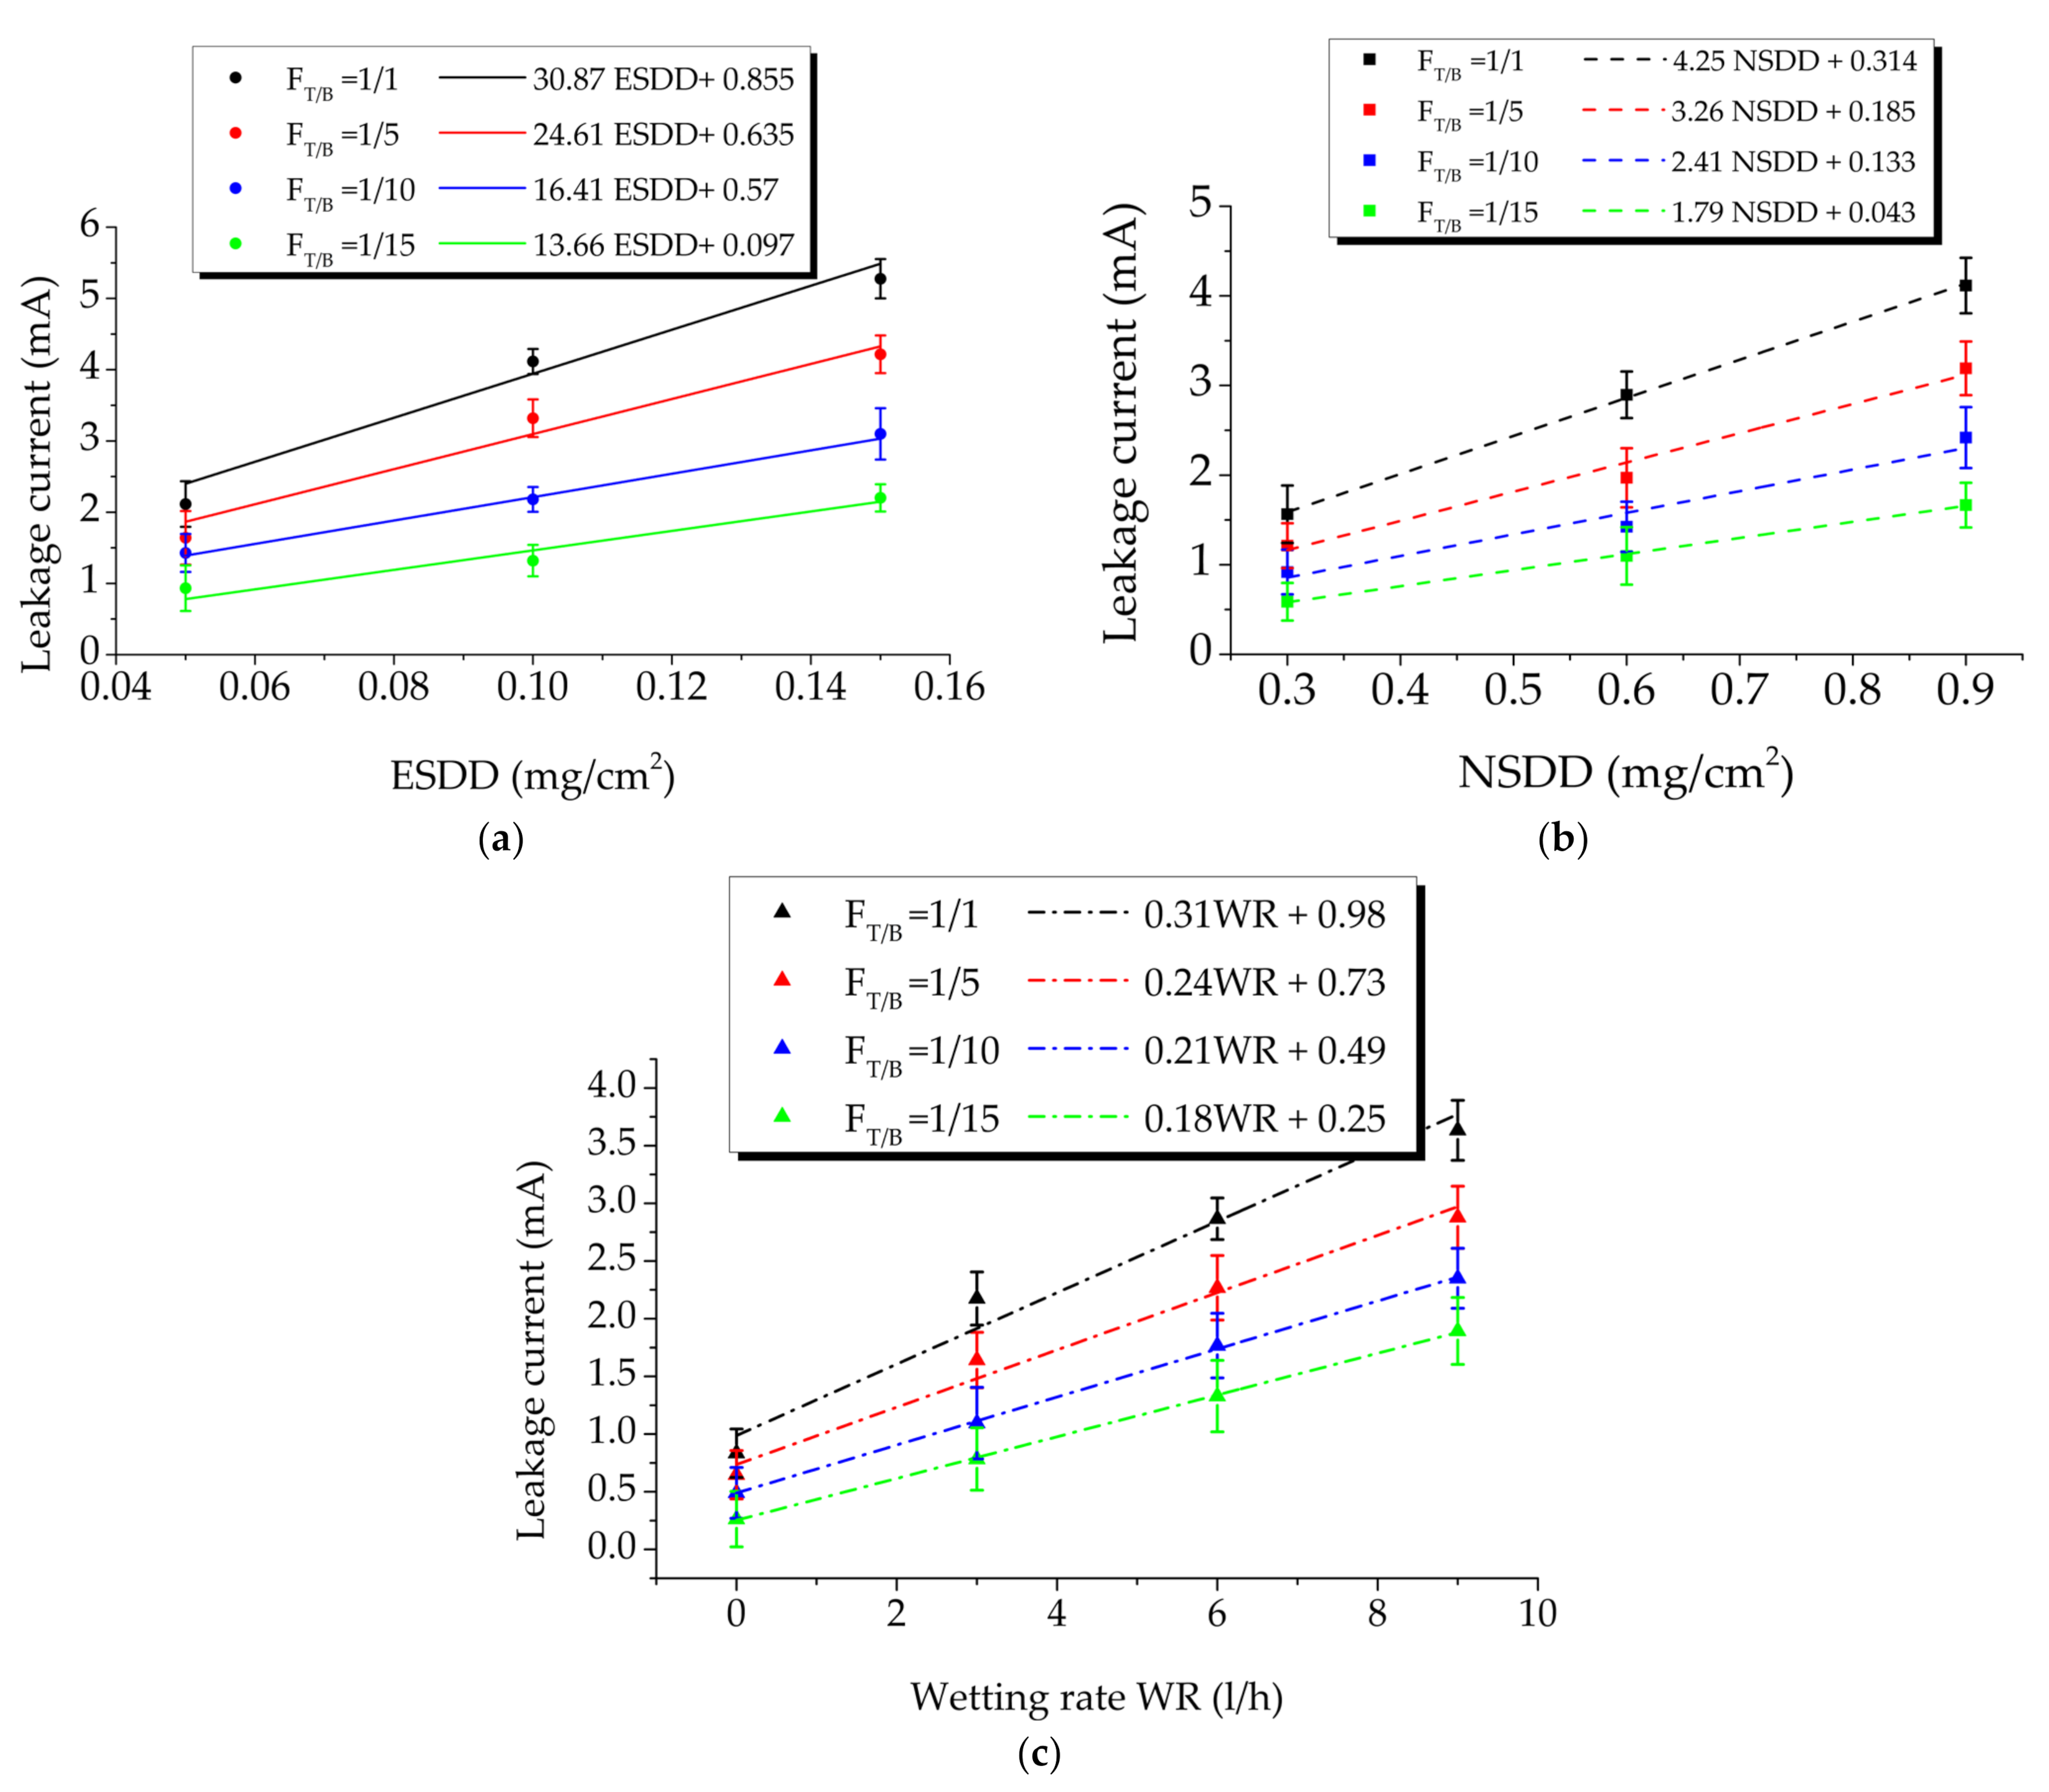
3.3. Indices Trend under the Effect of Pollution Components

The leakage current indicators were studied at various levels of the pollution layer components listed in Table 2 (ESDD, NSDD, WR, and FT/B). Figure 8 and Table 4 demonstrate that the leakage current indices F1 and F2 of the investigated insulators rise with increasing SDD, WR, and FT/B. Under the same conditions, however, the insulator indices F3 and F2 decrease as the SDD increases. For instance, when the NSDD = 0.6 mg/cm2, WR = 6 l/h, and FT/B = 1, the F1 value is 1.09, 6.93, and 11.46 mA whenever ESDD is 0.05, 0.10, and 0.15 mg/cm2, respectively. It can be seen that when the ESDD is raised from 0.05 to 0.12 and 0.2 mg/cm2, the F1 increases by 84.17% and 90.4%, respectively. Whereas, when the ESDD is 0.05, 0.12, and 0.2 mg/cm2, the corresponding F3 is 2.99, 1.24, and 0.64 mA, respectively. It can be noted that the F1 decreases by 58.6% and 48.83%, respectively. The results show that the indicator F1 changes significantly at high ESDD levels. The slopes of the F2, F3, and F4 values are identical across the three ESDD levels.
Variations in the indices are similar to the previous situation with pollution variation. The test results in Table 4 show that for constant ESDD, WR, and FT/B, if the NSDD increases, the F1 and F2 will increase while the F3 and F4 will decrease. Figure 9a depicts the F1–F4 versus NSDD curves for ESDD = 0.15 mg/cm2, WR = 6 l/h, and FT/B = 1/1 to help explain the association between NSDD and the proposed indices. The relationship between the proposed indices F1–F4 and the wetting rate, WR, for a polymer insulator under ESDD = 0.15 mg/cm2, NSDD = 0.9 mg/cm2, and FT/B = 1/1 and different wetting rates, WR, is shown in Figure 9b.
It is worth noting that increasing the wetness rate WR (l/h) produces a drop in F3 and F4 and an increase in F1 and F2. For example, when ESDD = 0.2 mg/cm2, NSDD = 0.6 mg/cm2, and FT/B = 1/1, F1 rises by 14.6% and 16.8%, respectively, when the WR increases from 3 to 6 and 9 l/h. In contrast, when the WR is increased from 3 to 6 and 9 l/h, the F3 decreases by 9.3 percent and 15.7 percent, respectively.
Figure 9c demonstrates the connection between the suggested indices F1–F4 and FT/B for polluted polymer insulators with ESDD = 0.15 mg/cm2, NSDD = 0.9 mg/cm2, and WR = 9 l/h. It can be seen that increasing the FT/B produces a drop in the F1 and F2 while increasing the F3 and F4. This suggests that insulation under uniform pollution levels is more severe than under non-uniform pollution situations.

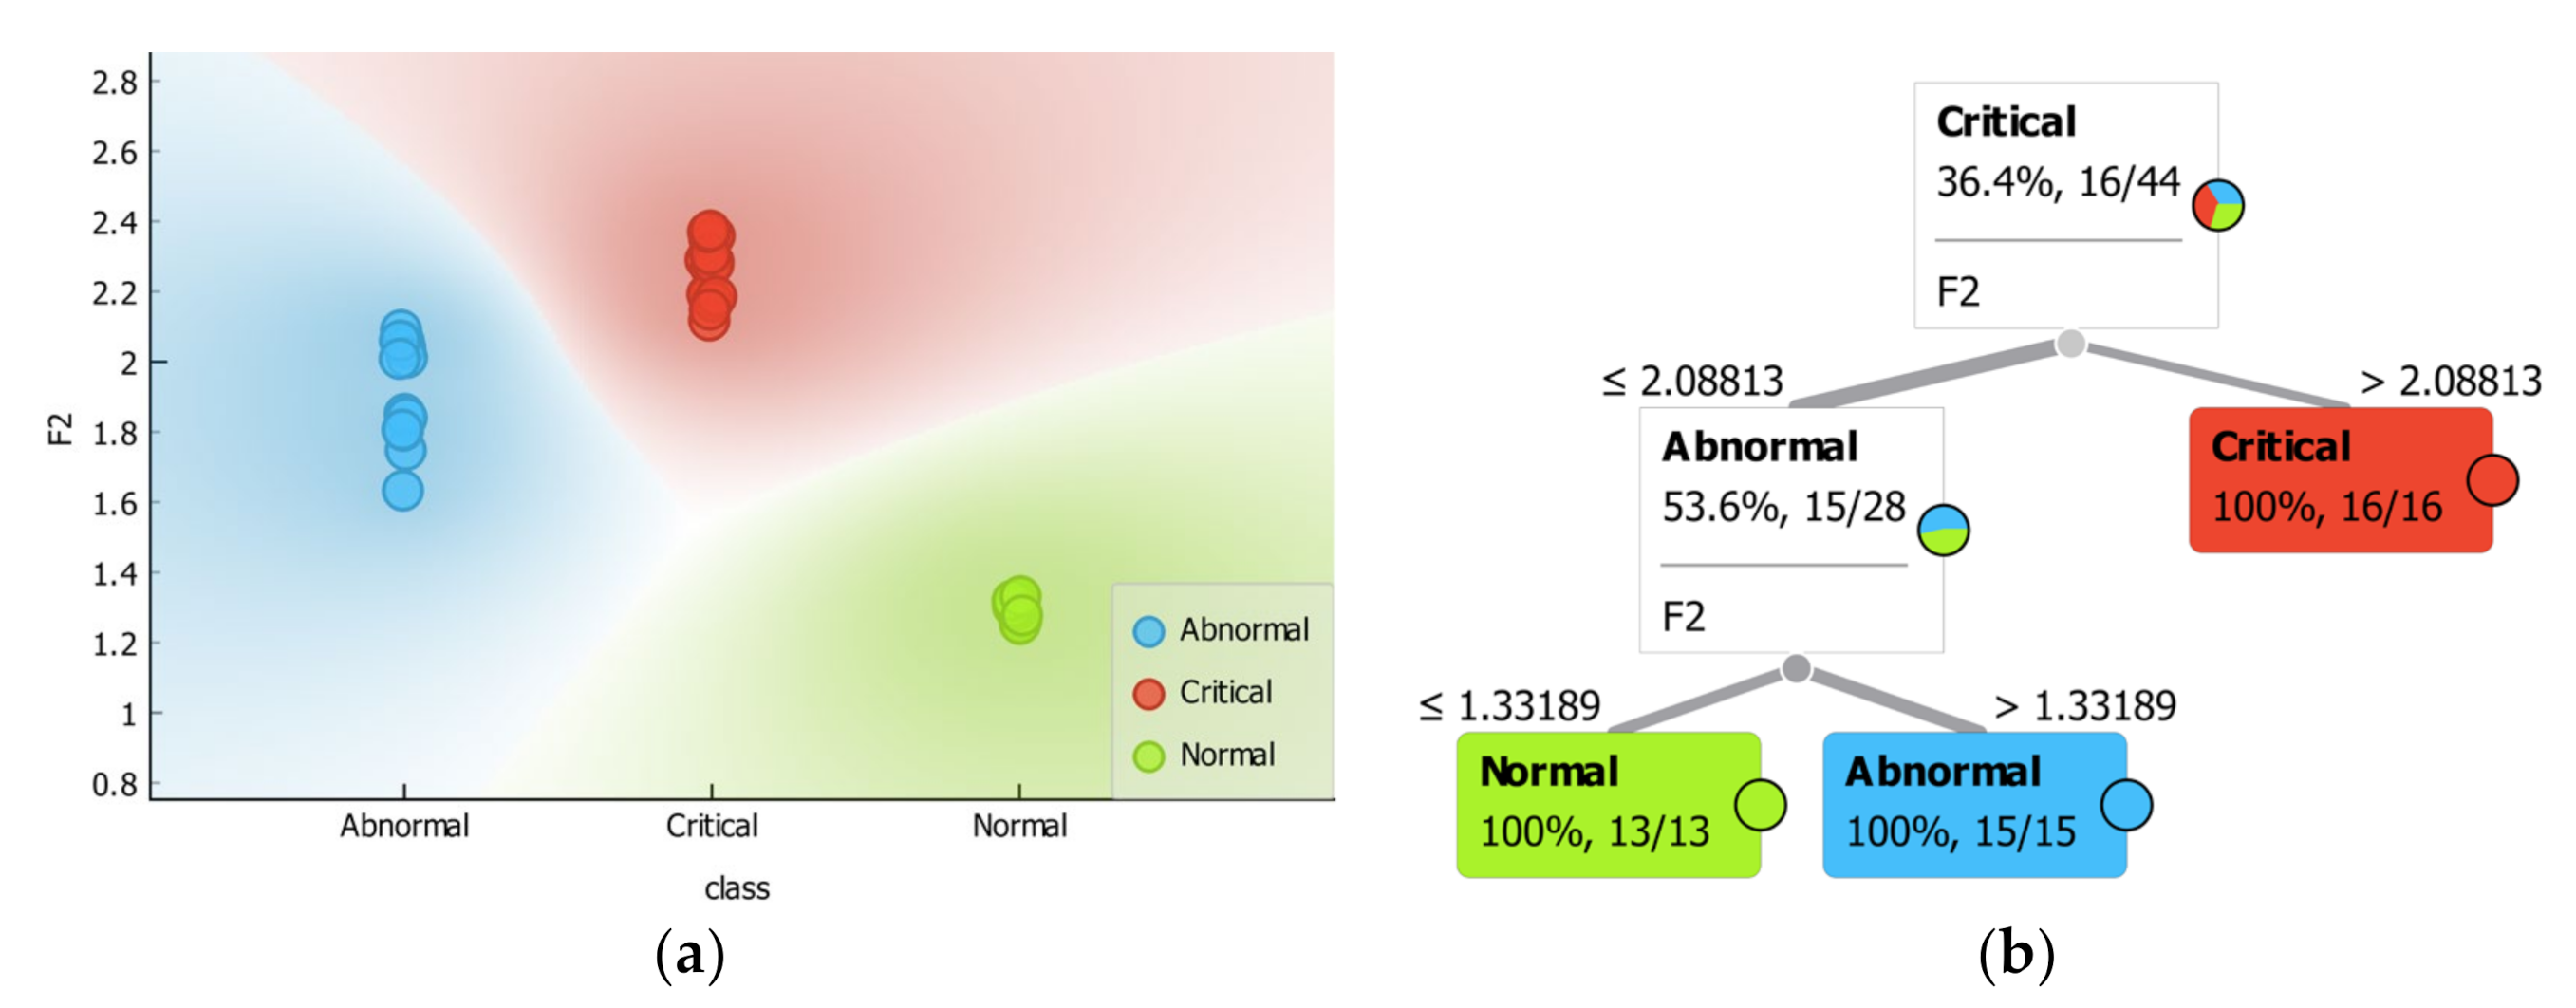
3.4. Insulator Condition Based on Indices Ranges Based on the Test Data

In this part, the insulator condition was characterized based on the range of the indicators recovered experimentally that correlate to the levels of ESDD, NSDD, WR, and FT/B. The experimental results show that the F1 and F2 rise when increasing the ESDD, NSDD, and WR and decreasing FT/B. In contrast, the indices F3 and F4 drop when the ESDD, NSDD, and WR increase and FT/B decreases. The proposed indicator ranges were estimated using classification tree methods. As an example, Figure 10 depicts the decision boundaries and trained decision tree for indicator F2. Table 5 shows the insulator condition prediction based on the indicator’s values extracted experimentally. Accordingly, Table 4 and Table 5 demonstrate that:
(1)
In the clean and light pollution scenarios, the suggested indicator values were observed in the normal range, with a WR less than 3.8 l/h and an NSDD less than 0.45 mg/cm2. The probability of a discharge occurring in this scenario is almost non-existent.
(2)
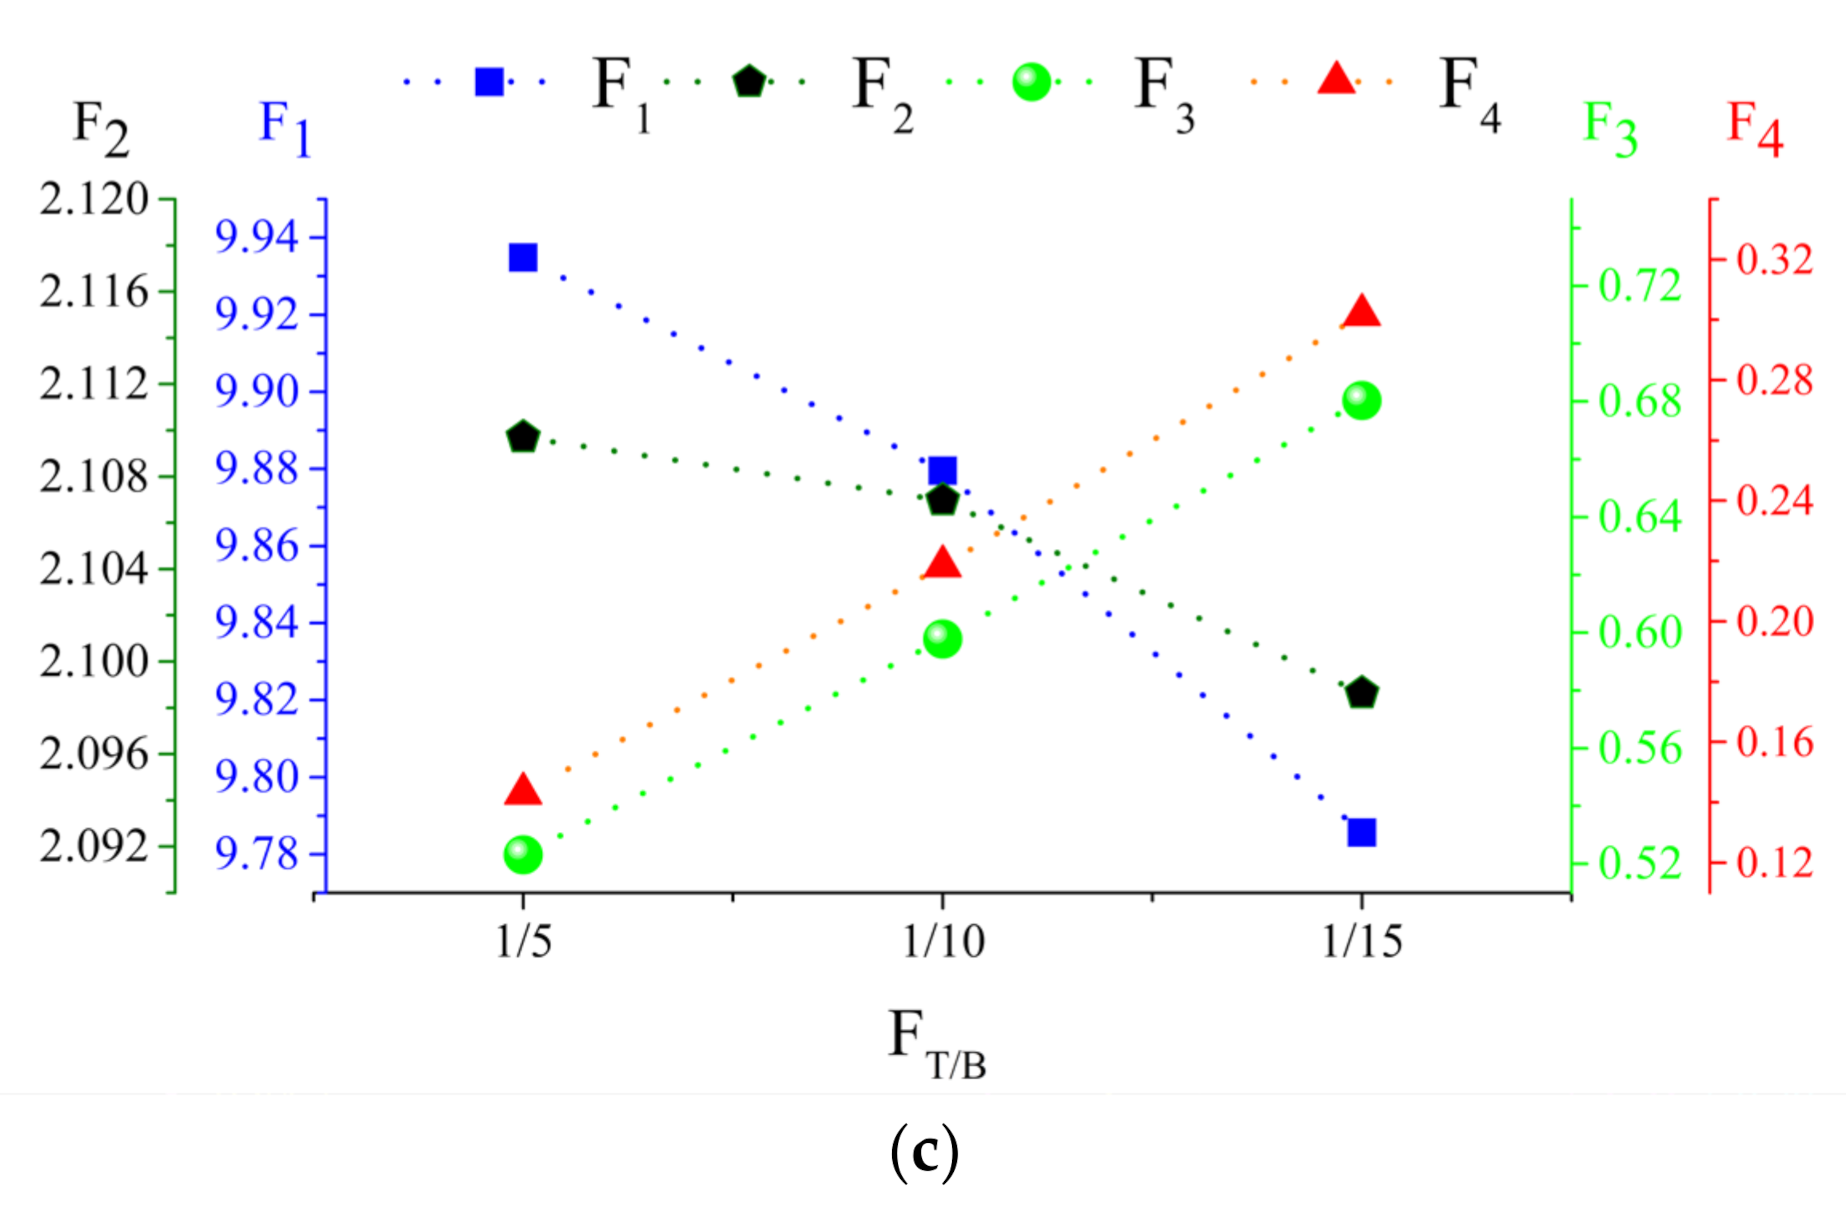
The insulator was in abnormal condition under light pollution (0.05 mg/cm2) with a high WR (9 l/h) and moderate and heavy levels of NSDD (0.6 and 0.9 mg/cm2) for all contaminated distribution FT/B except the 1/5 level, according to the ranges of indicators in Table 5. Furthermore, in the presence of medium contamination (0.12 mg/cm2), medium WR (6 l/h), NSDD (0.6 mg/cm2), and FT/B (1/1 to 1/5), the insulator under investigation showed an abnormal state. Except in situations of high wetting, in which the probability of flashover increases, the probability of a discharge happening in these conditions is limited.
Figure 10. (a) Boundary detection of indicator 2 F2 (as an example); (b) classification tree for F2 indicator to estimate the insulator condition.
Polymers 14 00737 g010
Table 5. Insulator condition dependent on experimentally determined indices values.
IndicatorNormal RangeAbnormal RangeCritical Range
F1<1.36>1.5 and <5.5>5.5
F2<1.33>1.33 and <2.1>2.1
F3>3.4>1.5 and <3.4<1.5
F4>2.2>1.2 and <2.2<1.2
(1)
The critical condition of the insulator under testing was discovered in two states: first, under moderate pollution levels for WR (9 l/h), NSDD (0.9 mg/cm2), and all pollution distribution categories; and second, under heavy pollution conditions for WR, NSDD, and all pollution distribution scenarios. In these conditions, the probability of a discharge occurring is significant, especially under severe wetting and heavy NSDD.
(2)
The pre-flashover metric values of the indices indicate that these metrics can be employed to detect the flashover occurrence for polluted insulators during service.

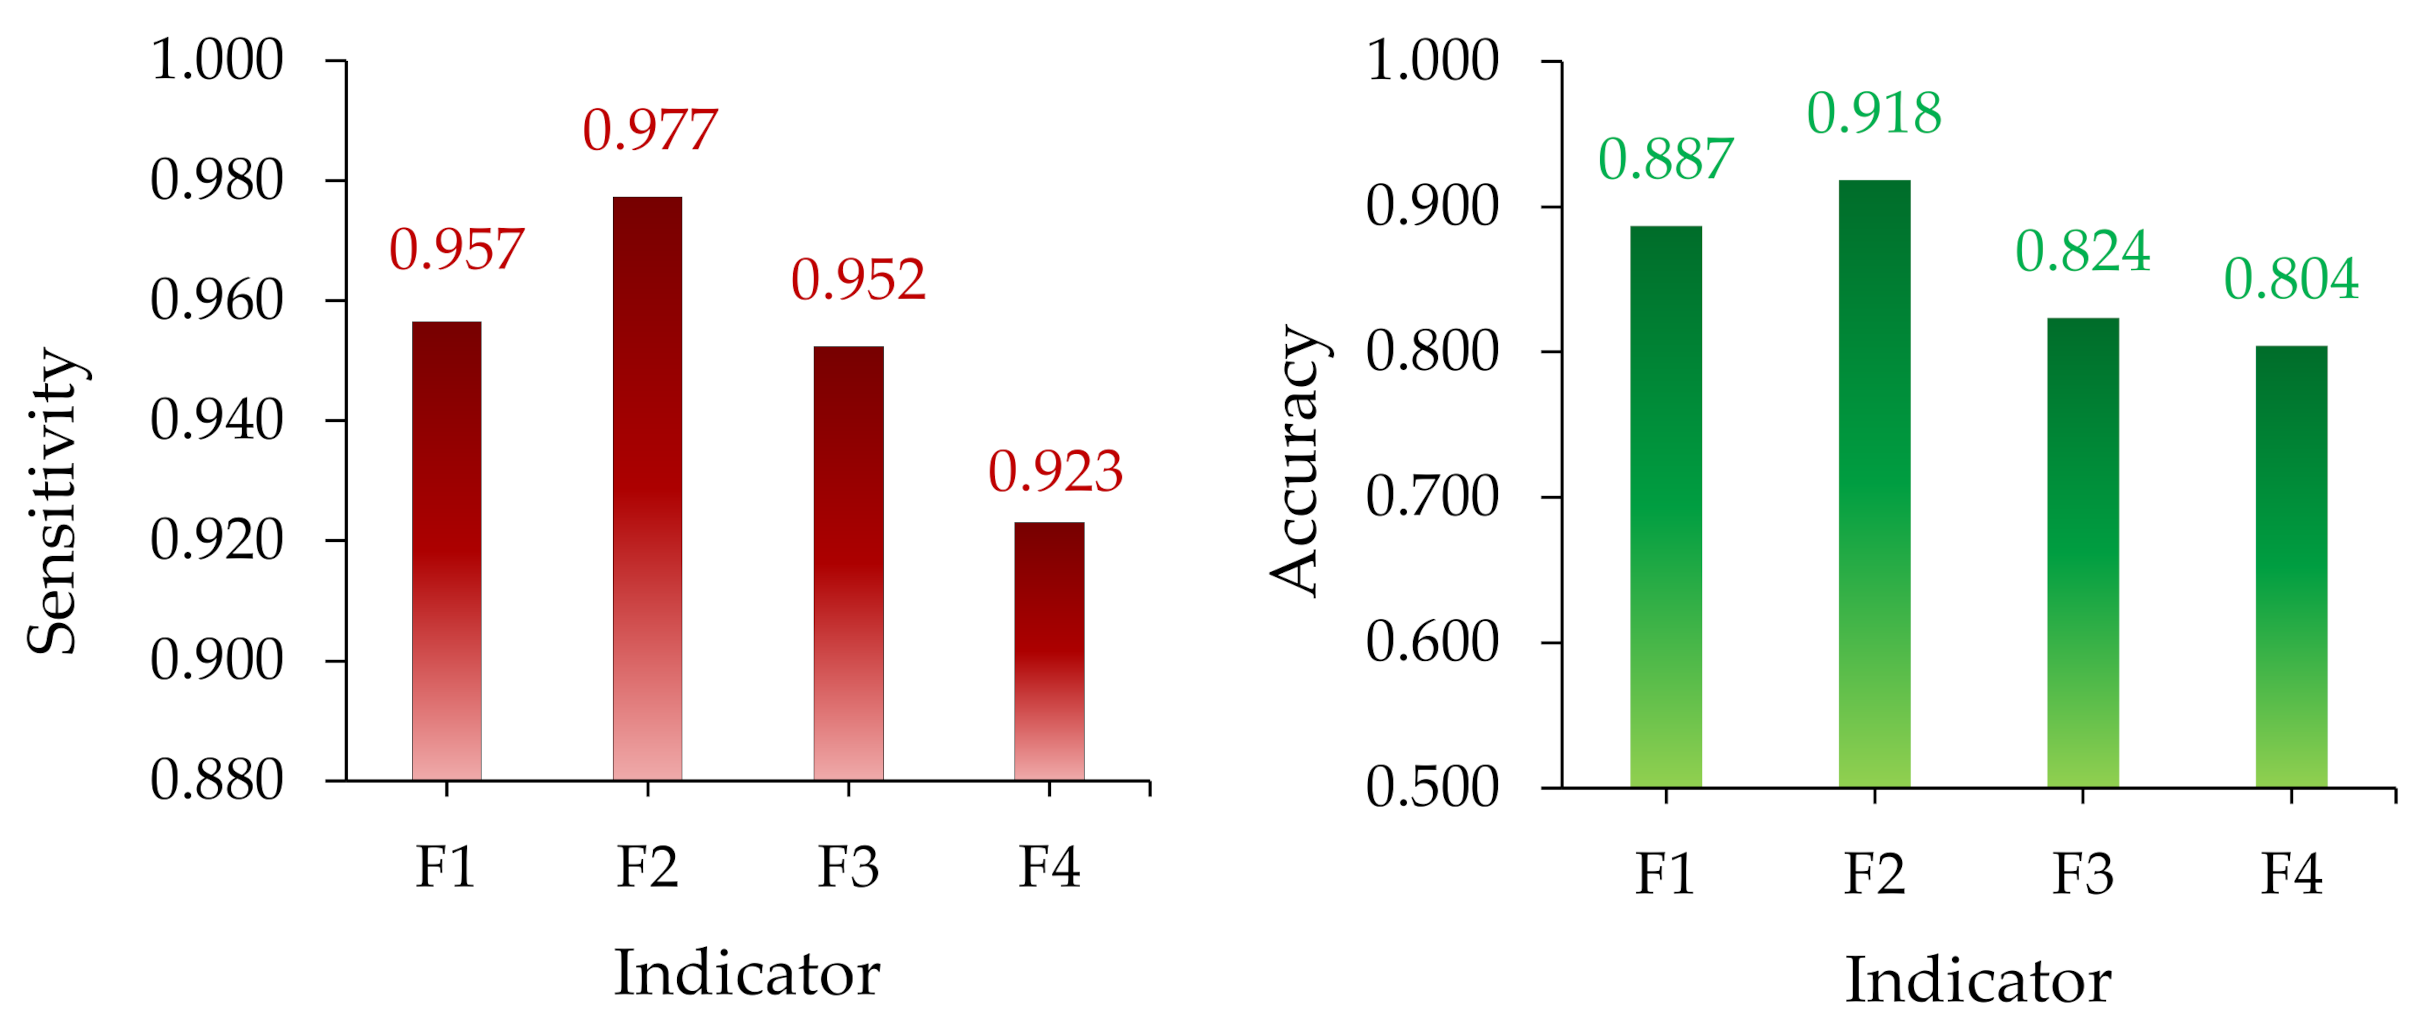
4. Determination of Indices Performance

The performance of the suggested indicators to accurately estimate the insulator state from the 196 test observations was investigated. The confusion matrix illustrated in Figure 11 was used to compute the sensitivity and accuracy of these indices. The values of the confusion matrix were determined based on the capability of the insulator indicator to predict the correct condition. The selection of test results and recommended indices are specified as follows:
  • A: The results of the test and the indicator prediction are both positive (correct).
  • B: The test result is positive, but the indicator prediction is negative.
  • C: The test result is negative, but the indicator prediction is positive.
  • D: The results of the test and the indicator prediction are both negative (incorrect).
The insulator condition was successfully reflected in the majority of tests (170 out of 196). In contrast, 26 of the test findings were negative. The erroneous test findings might be related to a lack of adequate implementation of contaminants on the insulator surface, a measurement equipment mistake, or other factors.
The diversity in the number of projected outcomes may help determine which indicators are the best, with the indices with the greatest number of correct predicted outcomes being the best. In other words, the indices with the greatest number of correctly predicted results will be the most accurate. Based on the indices’ prediction results presented in the figure above, indicator F1 (44) had the highest number of correct predictions, followed by F2 (43), F3 (40), and F4 (36). The indicator measures (sensitivity and accuracy) were calculated as shown in Figure 12. Figure 12 shows that indicator F2 has the highest sensitivity and accuracy, followed by F1, F3, and F4, respectively.

5. Conclusions

Based on laboratory investigations conducted according to the IEC 60507 standard for polymer insulators under pollution, the leakage current has been measured. The leakage current value shows a positive slope when the ESDD, WR, and NSDD on the surface of insulators increase. However, the slope will be negative when FT/B increases. The LC value is mostly affected by the pollution level, ESDD, and wetness rate, WR. Four indicators have been extracted from leakage current signals at different pollution levels. The results show that the suggested indicators are able to evaluate the insulator condition effectively. The indicators F1 and F2 indicate that the insulators will be in critical condition if their values exceed 5.5 mA and 2.1, respectively. If the F3 and F4 values are less than 1.5 and 1.2, respectively, the insulator will also be in the critical state. The possibility of flashover occurrence becomes higher when the insulator condition becomes critical. Moreover, the results show that all indicators presented in this study are useful for determining the condition of polluted insulators. However, based on the confusion matrix analysis, the indicator F2 performs better compared to other indicators. The current analysis can therefore be utilized to devise a reasonable criterion in identifying changes in the leakage current characteristics. When the measured leakage current reaches a particular threshold value, the associated change can be better identified. The suggested approach can be implemented online and a prototype device for monitoring the insulator condition can be developed in the future to verify the practicality of the suggested approach.

Author Contributions

Conceptualization, A.A.S., A.M.A.-S. and K.Y.L.; methodology, A.A.S., N.M. and Z.A.-M.; software, A.A.S., N.M., A.A.A.-S. and H.M.H.F.; validation, A.A.S., K.Y.L., Z.A.-M. and A.M.A.-S.; formal analysis, A.A.S. and N.M.; investigation, K.Y.L. and Z.A.-M.; resources, A.A.S. and A.M.A.-S.; data curation, A.A.S., A.M.A.-S., Z.A.-M. and K.Y.L.; writing—original draft preparation, A.A.S. and K.Y.L.; writing—review and editing, A.A.S., K.Y.L., Z.A.-M., A.M.A.-S., N.M., H.M.H.F. and A.M.A.-S.; visualization, A.A.S. and A.M.A.-S.; supervision, A.A.S., Z.A.-M. and K.Y.L.; project administration, A.A.S., K.Y.L., Z.A.-M. and A.M.A.-S.; funding acquisition, A.A.S., K.Y.L., Z.A.-M. and A.M.A.-S. All authors have read and agreed to the published version of the manuscript.

Funding

King Saud University, Riyadh, Saudi Arabia under Researchers Supporting Project number (RSP-2021/337).

Institutional Review Board Statement

Not applicable.

Informed Consent Statement

Not applicable.

Data Availability Statement

Not applicable.

Acknowledgments

The authors would like to acknowledge the Post-Doctoral Fellowship Scheme under the Professional Development Research University Grant (05E68) from Universiti Teknologi Malaysia (UTM) and the Researchers Supporting Project number (RSP-2021/337), King Saud University, Riyadh, Saudi Arabia.

Conflicts of Interest

The authors declare no conflict of interest.

References

  1. Sopelsa Neto, N.F.; Stefenon, S.F.; Meyer, L.H.; Bruns, R.; Nied, A.; Seman, L.O.; Gonzalez, G.V.; Leithardt, V.R.Q.; Yow, K.-C. A Study of Multilayer Perceptron Networks Applied to Classification of Ceramic Insulators Using Ultrasound. Appl. Sci. 2021, 11, 1592. [Google Scholar] [CrossRef]
  2. Zhang, D.; Xu, H.; Liu, J.; Yang, C.; Huang, X.; Zhang, Z.; Jiang, X. Research on the Non-Contact Pollution Monitoring Method of Composite Insulator Based on Space Electric Field. Energies 2021, 14, 2116. [Google Scholar] [CrossRef]
  3. Lan, L.; Mu, L.; Yuan, X.; Yan, J.; Wang, Y.; Wang, W.; Shen, Y.; Hao, L. Studies on metallurgical contamination accumulation characteristics on ceramic insulator of 500 kV AC transmission line. IET Sci. Meas. Technol. 2019, 13, 722–728. [Google Scholar] [CrossRef]
  4. Salem, A.A.; Abd-Rahman, R.; Al-Gailani, S.A.; Salam, Z.; Kamarudin, M.S.; Zainuddin, H.; Yousof, M.F.M. Risk Assessment of Polluted Glass Insulator Using Leakage Current Index Under Different Operating Conditions. IEEE Access 2020, 8, 175827–175839. [Google Scholar] [CrossRef]
  5. Zhang, Z.; Yang, S.; Jiang, X.; Qiao, X.; Xiang, Y.; Zhang, D. DC Flashover Dynamic Model of Post Insulator under Non-Uniform Pollution between Windward and Leeward Sides. Energies 2019, 12, 2345. [Google Scholar] [CrossRef] [Green Version]
  6. Mestriner, D.; Brignone, M. Corona Effect Influence on the Lightning Performance of Overhead Distribution Lines. Appl. Sci. 2020, 10, 4902. [Google Scholar] [CrossRef]
  7. Yamashita, T.; Ishimoto, R.; Furusato, T. Influence of series resistance on dry-band discharge characteristics on wet pollute insulators. IEEE Trans. Dielectr. Electr. Insul. 2018, 25, 154–161. [Google Scholar] [CrossRef]
  8. Ren, A.; Liu, H.; Wei, J.; Li, Q. Natural Contamination and Surface Flashover on Silicone Rubber Surface under Haze–Fog Environment. Energies 2017, 10, 1580. [Google Scholar] [CrossRef] [Green Version]
  9. De Barros Bezerra, J.M.; Lima, A.M.N.; Deep, G.S.; da Costa, E.G. An Evaluation of Alternative Techniques for Monitoring Insulator Pollution. IEEE Trans. Power Deliv. 2009, 24, 1773–1780. [Google Scholar] [CrossRef]
  10. Choi, I.H.; Koo, J.B.; Woo, J.W.; Son, J.A.; Bae, D.Y.; Yoon, Y.G.; Oh, T.K. Damage Evaluation of Porcelain Insulators with 154 kV Transmission Lines by Various Support Vector Machine (SVM) and Ensemble Methods Using Frequency Response Data. Appl. Sci. 2020, 10, 84. [Google Scholar] [CrossRef] [Green Version]
  11. Suda, T. Frequency Characteristics of Leakage Current Waveforms of Artificially Polluted Suspension insulators. IEEE Trans. Dielectr. Electr. Insul. 2005, 8, 705–709. [Google Scholar] [CrossRef]
  12. Hussain, M.M.; Farokhi, S.; McMeekin, S.G.; Farzaneh, M. Risk Assessment of Failure of Outdoor High Voltage Polluted Insulators under Combined Stresses Near Shoreline. Energies 2017, 10, 1661. [Google Scholar] [CrossRef] [Green Version]
  13. Fofana, I.; N’cho, J.S.; Betie, A.; Hounton, E.; Meghnefi, F.; Yapi, K.M.L. Lessons to Learn from Post-Installation Pollution Levels Assessment of Some Distribution Insulators. Energies 2020, 13, 4064. [Google Scholar] [CrossRef]
  14. Chen, W.; Wang, W.; Xia, Q.; Luo, B.; Li, L. Insulator Contamination Forecasting Based on Fractal Analysis of Leakage Current. Energies 2012, 5, 2594–2607. [Google Scholar] [CrossRef] [Green Version]
  15. Salem, A.A.; Abd-Rahman, R.; Al-Gailani, S.A.; Kamarudin, M.S.; Ahmad, H.; Salam, Z. The Leakage Current Components as a Diagnostic Tool to Estimate Contamination Level on High Voltage Insulators. IEEE Access 2020, 8, 92514–92528. [Google Scholar] [CrossRef]
  16. Jiang, Y.; McMeekin, S.G.; Reid, A.J.; Nekahi, A.; Judd, M.D.; Wilson, A. Monitoring contamination level on insulator materials under dry condition with a microwave reflectometer. IEEE Trans. Dielectr. Electr. Insul. 2016, 23, 1427–1434. [Google Scholar] [CrossRef]
  17. Fontana, E.; Martins-Filho, J.F.; Oliveira, S.C.; Cavalcanti, F.J.M.M.; Lima, R.A.; Cavalcanti, G.O.; Prata, T.L.; Lima, R.B. Sensor network for monitoring the state of pollution of high-voltage insulators via satellite. IEEE Trans. Power Deliv. 2012, 27, 953–962. [Google Scholar] [CrossRef]
  18. Douar, M.A.; Mekhaldi, A.; Bouzidi, M.C. Flashover process and frequency analysis of the leakage current on insulator model under non-uniform pollution conditions. IEEE Trans. Dielectr. Electr. Insul. 2010, 17, 1284–1297. [Google Scholar] [CrossRef]
  19. Faramarzi Palangar, M.; Mirzaie, M. Diagnosis Porcelain and Glass Insulators Conditions Using Phase Angle Index Based on Experimental Test. IEEE Trans. Dielectr. Electr. Insul. 2016, 23, 3–9. [Google Scholar]
  20. Shaik, M.G.; Karuppaiyan, V. Investigation of Surface Degradation of Aged High Temperature Vulcanized (HTV) Silicone Rubber Insulators. Energies 2019, 12, 3769. [Google Scholar] [CrossRef] [Green Version]
  21. Zhao, S.; Jiang, X.; Zhang, Z.; Hu, J.; Shu, L. Flashover voltage prediction of composite insulators based on the characteristics of leakage current. IEEE Trans. Power Deliv. 2013, 28, 1699–1708. [Google Scholar] [CrossRef]
  22. Terrab, H.; Bayadi, A. Experimental Study Using Design of Experiment of Pollution Layer Effect on Insulator Performance Taking into Account the Presence of Dry Bands. IEEE Trans. Dielectr. Electr. Insul. 2014, 21, 2486–2495. [Google Scholar] [CrossRef]
  23. Liu, Y.; Du, B.X. Recurrent plot analysis of leakage current on flashover performance of rime-iced composite insulator. IEEE Trans. Dielectr. Electr. Insul. 2010, 17, 465–472. [Google Scholar] [CrossRef]
  24. Li, J.; Sima, W.; Sun, C.; Sebo, S.A. Use of leakage currents of insulators to determine the stage characteristics of the flashover process and contamination level prediction. IEEE Trans. Dielectr. Electr. Insul 2010, 17, 490–501. [Google Scholar] [CrossRef]
  25. Ghosh, R.; Chatterjee, B.; Chakravorti, S. A novel leakage current index for the field monitoring of overhead insulators under harmonic voltage. IEEE Trans. Ind. Electron. 2018, 65, 1568–1576. [Google Scholar] [CrossRef]
  26. Fahimi, N.; Sezavar, H.R.; Abbas, A. Dynamic modeling of flashover of polymer insulators under polluted conditions based on HGA-PSO algorithm. Electr. Power Syst. Res. 2022, 205, 107728. [Google Scholar] [CrossRef]
  27. Sit, K.; Das, A.K.; Mukherjee, D.; Haque, N.; Deb, S.; Pradhan, A.K.; Dalai, S.; Chatterjee, B. Condition Monitoring of Overhead Polymeric Insulators Employing Hyperbolic Window Stockwell Transform of Surface Leakage Current Signals. IEEE Sens. J. 2021, 21, 10957–10964. [Google Scholar] [CrossRef]
  28. Kordkheili, H.H.; Abravesh, H.; Tabasi, M.; Dakhem, M.; Abravesh, M.M. Determining the probability of flashover occurrence in composite insulators by using leakage current harmonic components. IEEE Trans. Dielectr. Electr. Insul. 2010, 17, 502–512. [Google Scholar] [CrossRef]
  29. IEC 507. Artificial pollution tests on high-voltage insulators to be used on A.C. systems. Int. Stand 1991, 2, 1–7. [Google Scholar]
  30. Salem, A.A.; Abd-Rahman, R.; Kamarudin, M.S.; Ahmad, H.; Jamail, N.A.M.; Othman, N.A.; Ishak, M.T.; Baharom, M.N.R.; Al-Ameri, S. Proposal of a Dynamic Numerical Approach in Predicting Flashover Critical Voltage. Int. J. Power Electron. Drive Syst. (IJEPDS) 2019, 10, 602–610. [Google Scholar] [CrossRef] [Green Version]
  31. Salem, A.A.; Abd-Rahman, R.; Rahiman, W.; Al-Gailani, S.A.; Al-Ameri, S.M.; Ishak, M.T.; Sheikh, U.U. Pollution Flashover Under Different Contamination Profiles on High Voltage Insulator: Numerical and Experiment Investigation. IEEE Access 2021, 9, 37800–37812. [Google Scholar] [CrossRef]
  32. Ahmad, J.; Tahir, A.; Stewart, B.G.; Nekahi, A. Forecasting Flashover Parameters of Polymeric Insulators under Contaminated Conditions Using the Machine Learning Technique. Energies 2020, 13, 3889. [Google Scholar]
  33. Salem, A.A.; Abd-Rahman, R.; Ahmad, H.; Kamarudin, M.S.; Jamal, N.A.M.; Othman, N.A.; Ishak, M.T. A New Flashover Prediction on Outdoor Polluted Insulator Using Leakage Current Harmonic Components. In Proceedings of the 2018 IEEE 7th International Conference on Power and Energy (PECon), Kuala Lumpur, Malaysia, 3–4 December 2018; pp. 413–418. [Google Scholar]
  34. Zhang, Z.; Qiao, X.; Yang, S.; Jiang, X. Non-Uniform Distribution of Contamination on Composite Insulators in HVDC Transmission Lines. Appl. Sci. 2018, 8, 1962. [Google Scholar] [CrossRef] [Green Version]
  35. Aydogan, A.; Atalar, F.; Ersoy Yilmaz, A.; Rozga, P. Using the Method of Harmonic Distortion Analysis in Partial Discharge Assessment in Mineral Oil in a Non-Uniform Electric Field. Energies 2020, 13, 4830. [Google Scholar] [CrossRef]
  36. Fielding, A.H.; Bell, J.F. A review of methods for the assessment of prediction errors in conservation presence/absence models. Environ. Conserv. 1997, 24, 38–49. [Google Scholar] [CrossRef]
Figure 1. 33 kV polymer insulator sample.
Polymers 14 00737 g001
Figure 2. Experiment setup schematic diagram for the leakage current measurement of a polymeric insulator.
Polymers 14 00737 g002
Figure 3. Insulator condition diagnosis using leakage current characteristics flowchart.
Polymers 14 00737 g003
Figure 4. Leakage current features (a), time domain for extract indicators 1 and 2 (F1 and F2) (b), leakage current frequency domain for extract indicator 3 F3.
Polymers 14 00737 g004
Figure 5. Leakage current signal under different contamination levels, 0.15 of NSDD, and 3 l/h of wetting rate: (a) time waveform; (b) FFT.
Polymers 14 00737 g005
Figure 6. Leakage current under different values of FT/B. (a) Relationship between leakage current and ESDD when NSDD = 0.9 (mg/cm2) and WR = 9 (l/h); (b) relationship between leakage current and NSDD when ESDD = 0.1 (mg/cm2) and WR = 9 (l/h); (c) relationship between leakage current and ESDD when ESDD = 0.15 (mg/cm2) and NSDD = 0.9 (l/h).
Polymers 14 00737 g006
Figure 7. Leakage current indices of clean insulators under various wetting rates WR and NSDD: (a) indicator 1, F1; (b) indicator 2, F2; (c) indicator 3, F3; (d) indicator 4, F4.
Polymers 14 00737 g007aPolymers 14 00737 g007b
Figure 8. Proposed indices of uniform polluted insulators under different wetting rates, WR, and NSDD: (a) indicator 1, F1; (b) indicator 2, F2; (c) indicator 3, F3; (d) indicator 4, F4.
Polymers 14 00737 g008aPolymers 14 00737 g008b
Figure 9. The indicator trends with (a) NSDD, (b) wetting rate (WR), and (c) FT/B.
Polymers 14 00737 g009aPolymers 14 00737 g009b
Figure 11. Confusion matrix for determining indices’ sensitivity, specificity, and accuracy.
Polymers 14 00737 g011
Figure 12. The value of the indices’ sensitivity, specificity, and accuracy for evaluating the insulator condition.
Polymers 14 00737 g012
Table 1. Insulator parameters.
ParameterSymbolLength (cm)
Leakage distanceLt89
HeightH52.5
DiameterD9.8
Core diameterDc2.4
Arc distanceHa32.9
Table 2. Pollution layer components.
ParametersValues
Pollution levelClean (C)Light (L)Medium (M)Heavy (H)
ESDD (mg/cm2)0.00.050.100.15
NSDD (mg/cm2)0.00.30.60.9
Wetting rate (l/h)0.0369
Table 3. Leakage current components under uniform conditions.
ESDDNSDDWRI1I3I5I7I9
0.00000.14830.00040.00160.00000.0016
0.300.16210.00050.00240.00080.0004
30.35660.00240.01220.00160.0006
60.58350.00320.01030.00650.0006
90.72930.00570.01380.00810.0049
0.600.17830.00240.01130.00160.0016
30.54290.00810.03320.00410.0049
60.70500.00880.03240.00650.0057
90.78610.01380.04860.00810.0065
0.900.33230.00470.00970.00730.0073
30.59970.01460.04860.00410.0024
60.73740.01620.05150.00490.0041
90.85090.02670.05920.00570.0073
0.050.300.42300.00730.03480.00730.0032
30.72930.10130.25930.04860.0243
60.96430.11020.24310.06730.0324
91.27230.14590.29170.07460.0624
0.600.59160.01130.04540.00650.0057
30.99680.11510.18720.06890.0535
61.20750.13530.18640.11350.0567
91.49110.14510.18720.12160.0648
0.900.73740.01460.05270.01050.0081
31.32090.15400.20420.08270.0454
61.65320.17830.19450.11350.0729
92.11510.21150.25930.09720.0891
0.100.300.51540.01780.05830.00890.0065
31.19940.26740.21880.03240.0648
61.32090.33230.25930.05020.0972
91.56400.37280.33230.07700.0648
0.600.60780.02590.06810.01050.0170
31.39380.28360.25120.08430.0729
61.58830.42950.29980.08910.0794
91.89630.46190.33230.10530.0891
0.900.76180.03320.07130.02510.0186
31.60450.45380.29170.10530.1297
61.65320.58350.33230.12160.1053
92.11510.50240.34040.13780.1459
0.150.300.68230.04290.07780.03650.0259
32.13940.77800.22690.17020.1216
62.38250.80230.18640.21070.0891
92.95790.88090.18640.21880.1053
0.600.83470.05020.08100.05110.0259
32.37440.76990.22690.17020.0891
62.66610.88330.21880.18640.0972
93.23341.05350.25930.19450.0972
0.900.86710.05270.08270.03890.0405
32.86871.12800.24310.09720.1216
64.24641.31280.28360.17020.0972
95.27551.45060.21880.10530.1378
Table 4. Leakage current indicators of polymer insulators under variation non-uniform pollution FT/B, wetting rate (WR), and NSDD.
FT/B 1/51/101/15
ESDD
mg/cm2
NSDD
mg/cm2
Wt
l/h
F1F2F3F4F1F2F3F4F1F2F3F4
0.050.300.111.187.926.140.080.815.454.230.050.478.326.26
30.301.263.892.680.210.872.681.840.140.514.092.73
60.641.293.622.280.440.892.491.570.300.523.802.33
90.851.303.462.080.580.892.381.430.390.523.642.12
0.600.251.317.786.600.170.905.354.540.120.538.186.73
30.571.283.211.970.390.882.211.360.260.513.372.01
60.891.293.061.920.610.892.111.320.410.523.221.96
92.561.303.041.971.760.892.091.361.190.523.192.01
0.900.431.327.125.310.300.914.903.650.200.537.485.42
30.721.292.481.550.500.891.711.070.330.522.611.58
62.511.302.501.261.730.891.720.871.160.522.631.29
94.661.312.411.263.210.901.660.872.160.532.531.29
0.100.300.521.336.074.850.360.924.183.340.240.536.384.95
31.871.271.481.081.290.871.020.740.870.511.561.10
63.891.311.510.962.680.901.040.661.800.531.590.98
96.701.841.681.173.231.271.160.812.180.741.771.19
0.600.652.005.764.310.451.383.962.970.300.806.054.40
34.661.331.641.023.210.921.130.702.160.531.721.04
65.591.801.490.953.851.241.030.652.590.721.570.97
97.112.001.490.954.891.381.030.653.300.801.570.97
0.900.662.144.742.960.451.473.262.040.310.864.983.02
34.271.341.320.812.940.920.910.561.980.541.390.83
66.081.831.320.794.181.260.910.542.820.731.390.81
98.572.061.360.795.901.420.940.543.970.831.430.81
0.150.300.852.193.902.180.581.512.681.500.390.884.102.22
34.871.460.770.213.351.000.530.142.260.590.810.21
66.321.970.720.274.351.360.500.192.930.790.760.28
99.332.080.680.275.041.430.470.193.400.830.710.28
0.601.052.243.741.940.721.542.571.340.490.903.931.98
37.921.500.800.355.451.030.550.243.670.600.840.36
69.252.030.710.306.371.400.490.214.290.810.750.31
912.462.050.610.378.581.410.420.255.780.820.640.38
0.900.522.183.651.880.361.502.511.290.240.873.841.92
38.581.600.640.345.911.100.440.233.980.640.670.35
69.912.060.760.396.821.420.520.274.600.830.800.40
99.932.110.520.146.831.450.360.104.610.850.550.14
Publisher’s Note: MDPI stays neutral with regard to jurisdictional claims in published maps and institutional affiliations.

