
Mechanical and Thermal Properties of Geopolymer Foams (GFs) Doped with By-Products of the Secondary Aluminum Industry

 ,
,  , ,
, ,  ,
,  , , , , ,
  and
and 
Abstract
:1. Introduction
2. Materials and Methods
2.1. Starting Materials
2.2. Experimental Procedure for the Geopolymer Synthesis
2.3. Methods for the Mechanical Tests
2.4. Methods for the Thermal Measurements
3. Results and Discussion
3.1. Mechanical Properties
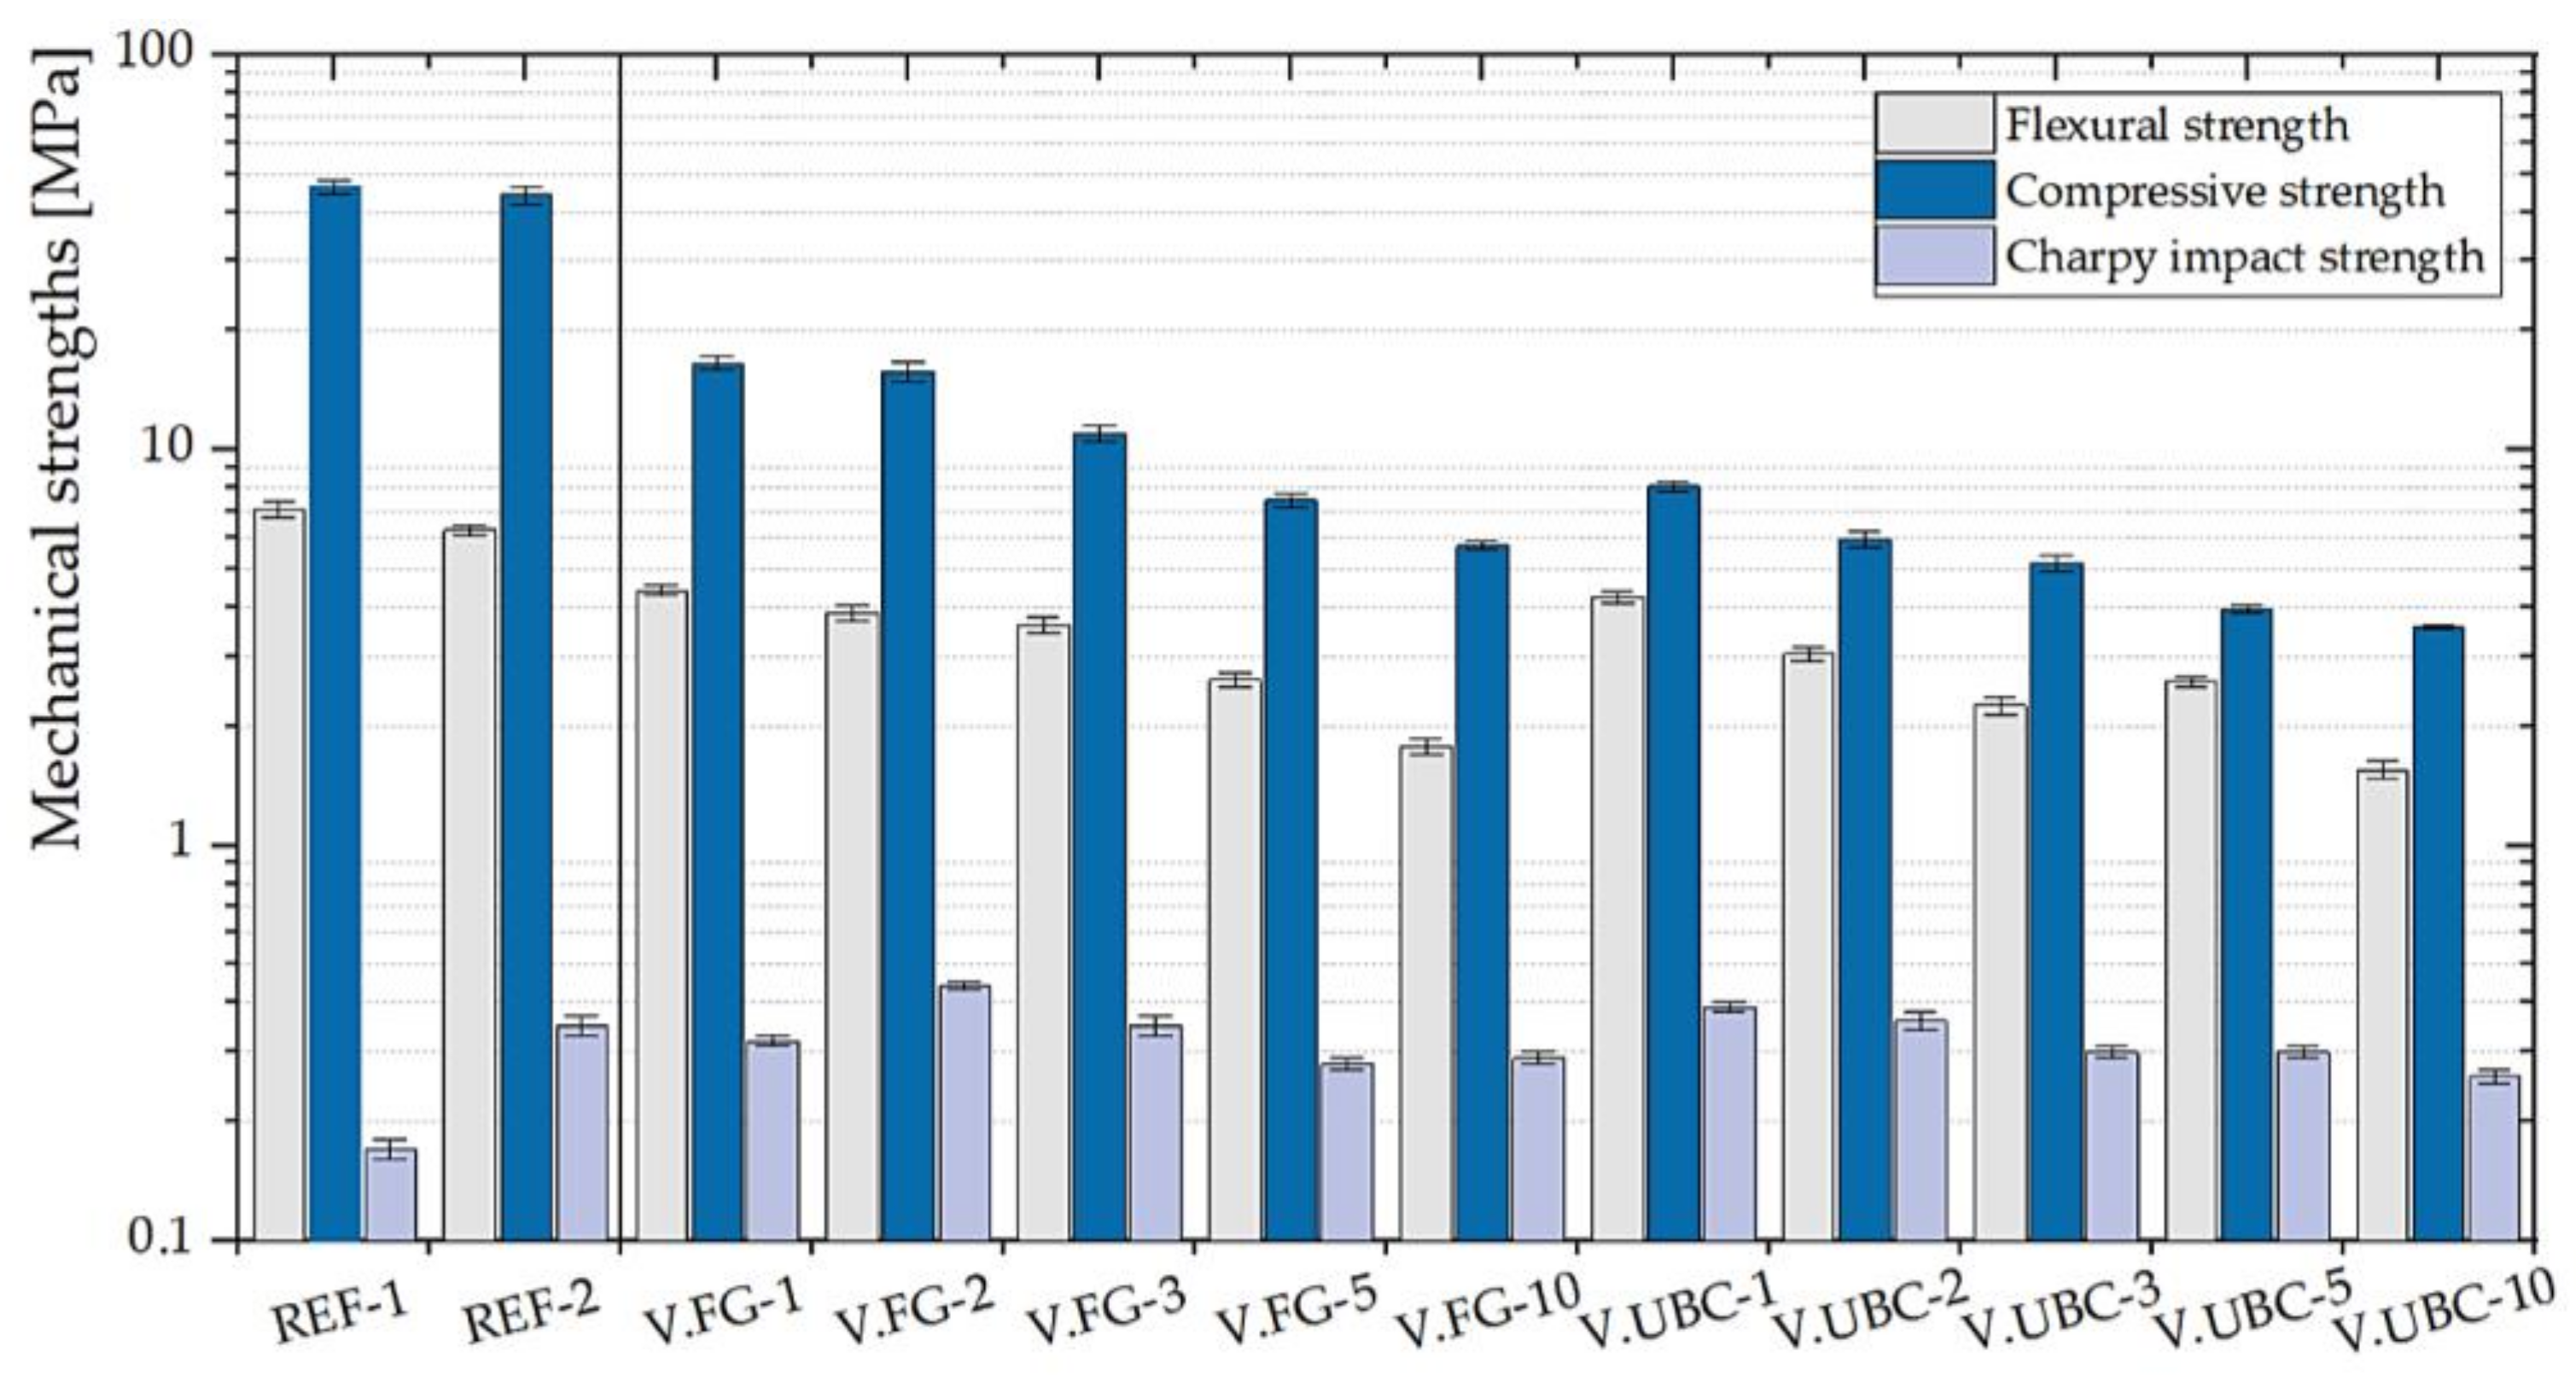
3.1.1. GFs with the Addition of the Aluminum-Rich By-Products of the Screening Processes
3.1.2. GFs with the Addition of the Aluminum-Rich By-Products of the Pyrolysis Processes
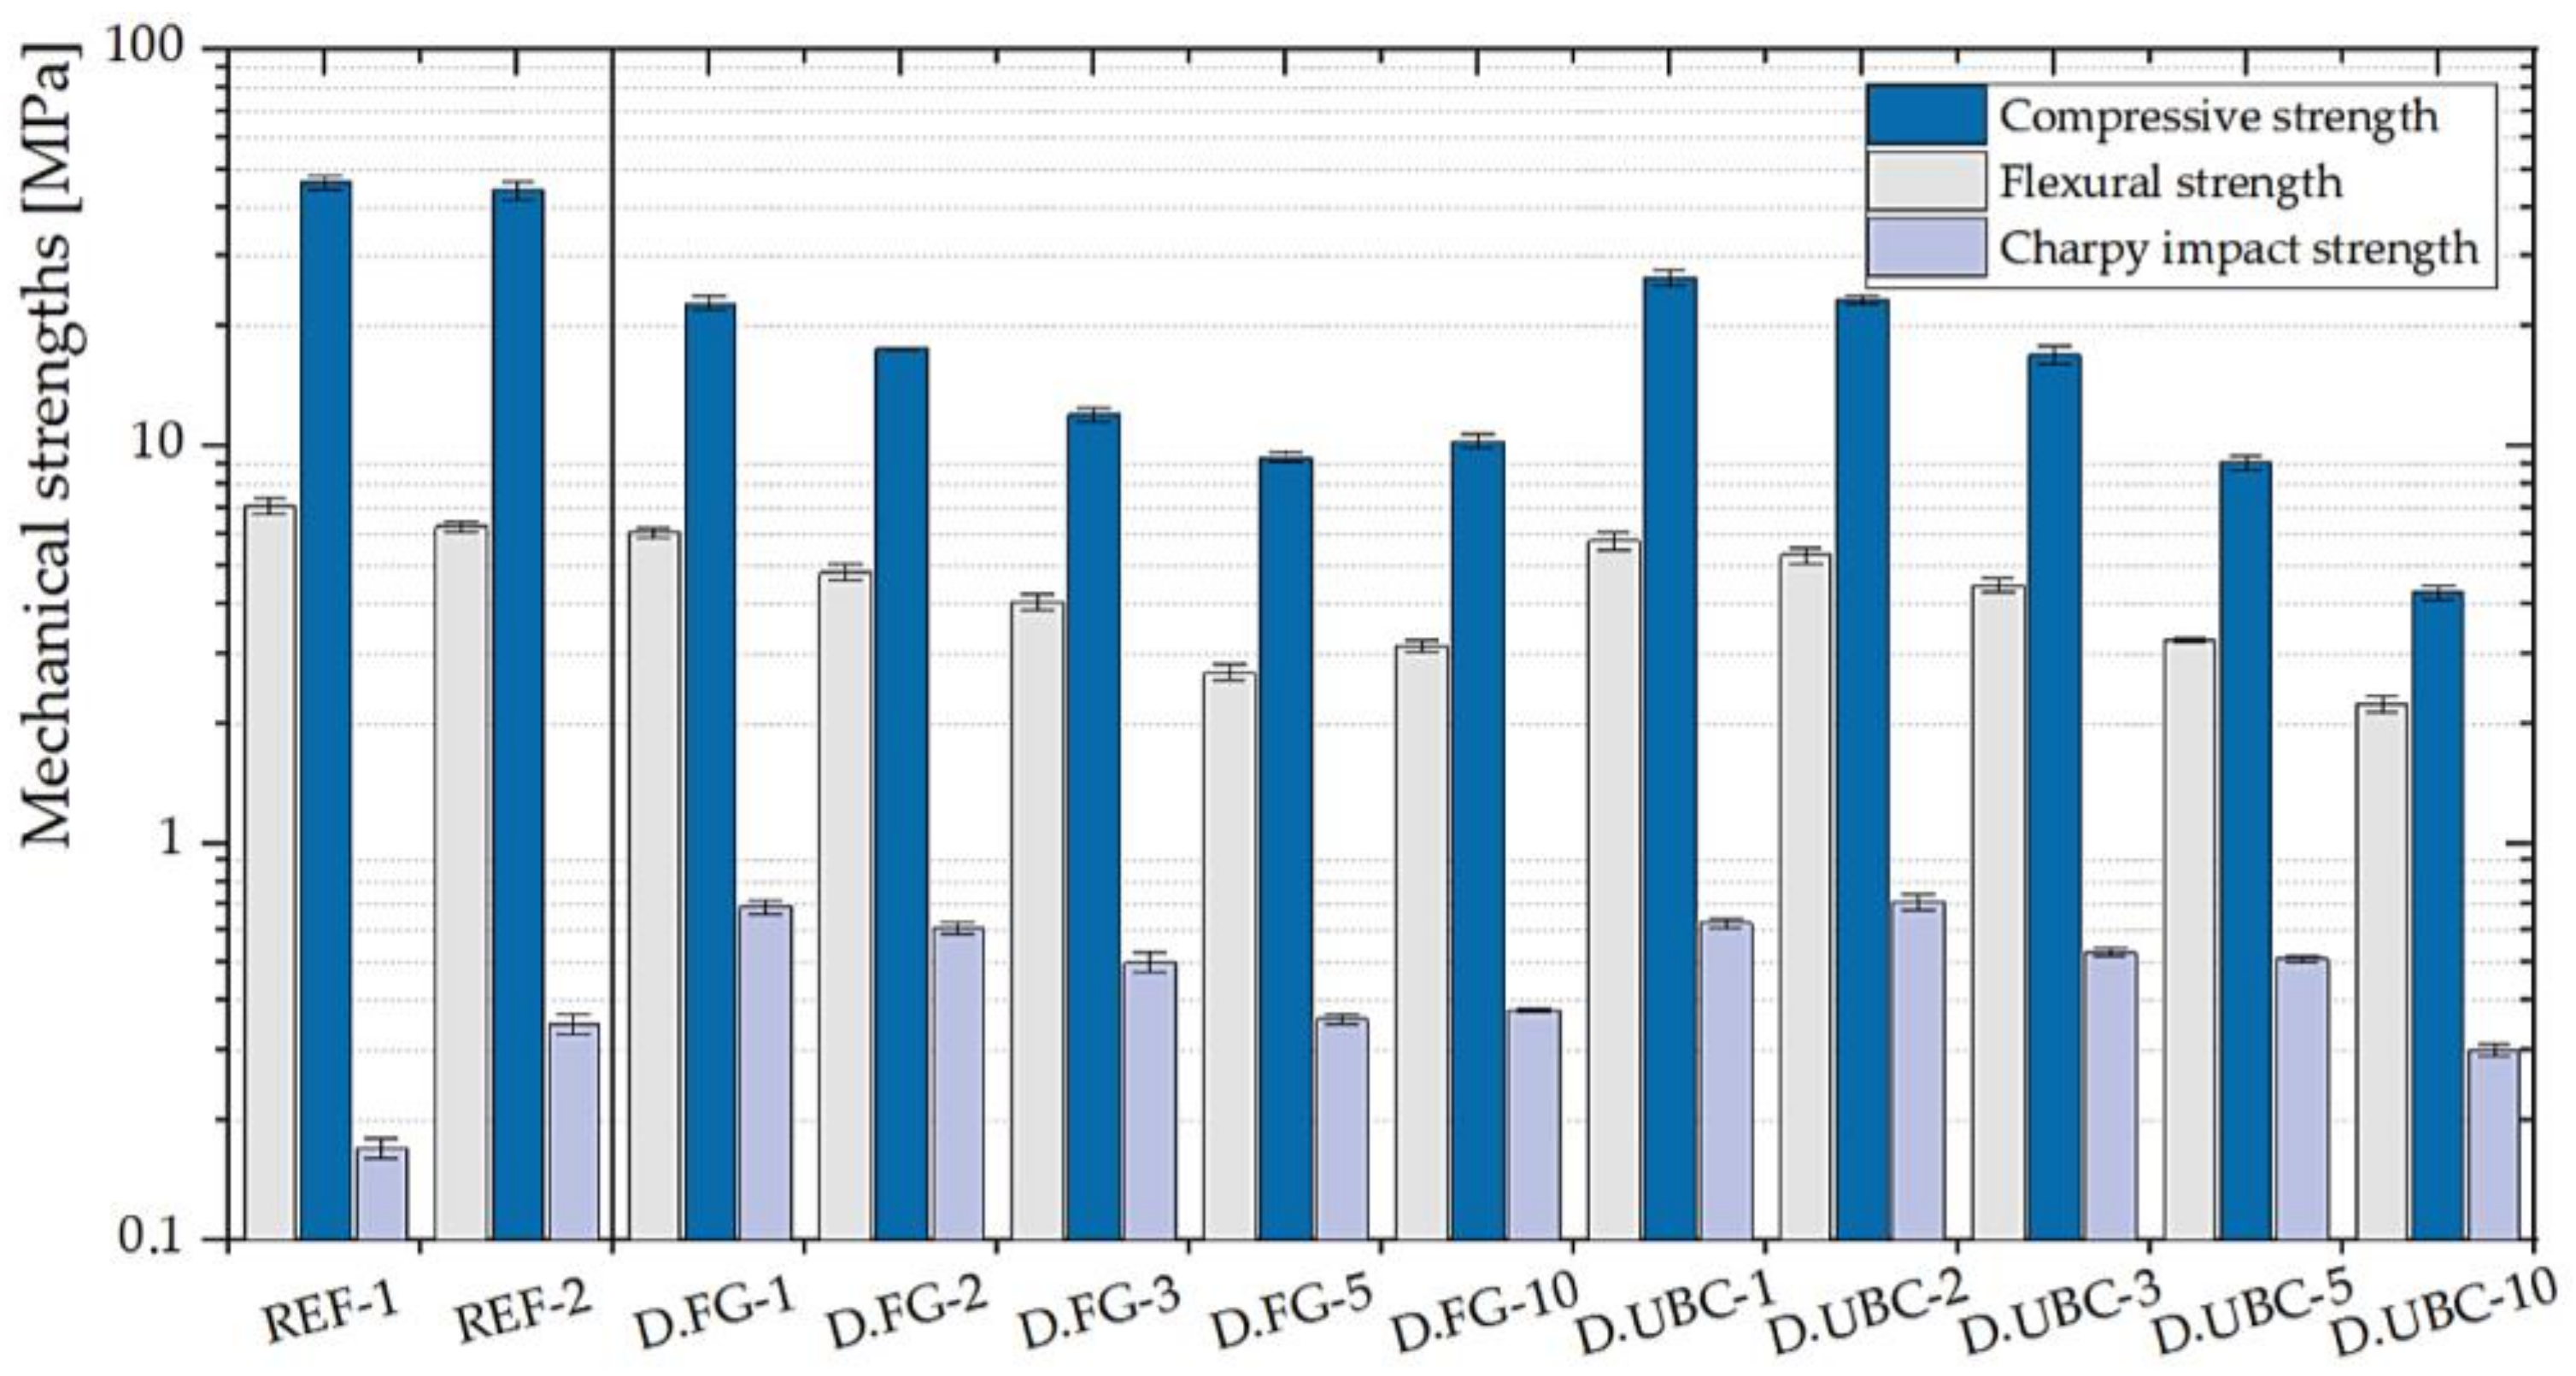
3.1.3. GFs with the Addition of the Aluminum-Rich By-Products of the Dust Abatement Systems (Cyclons)
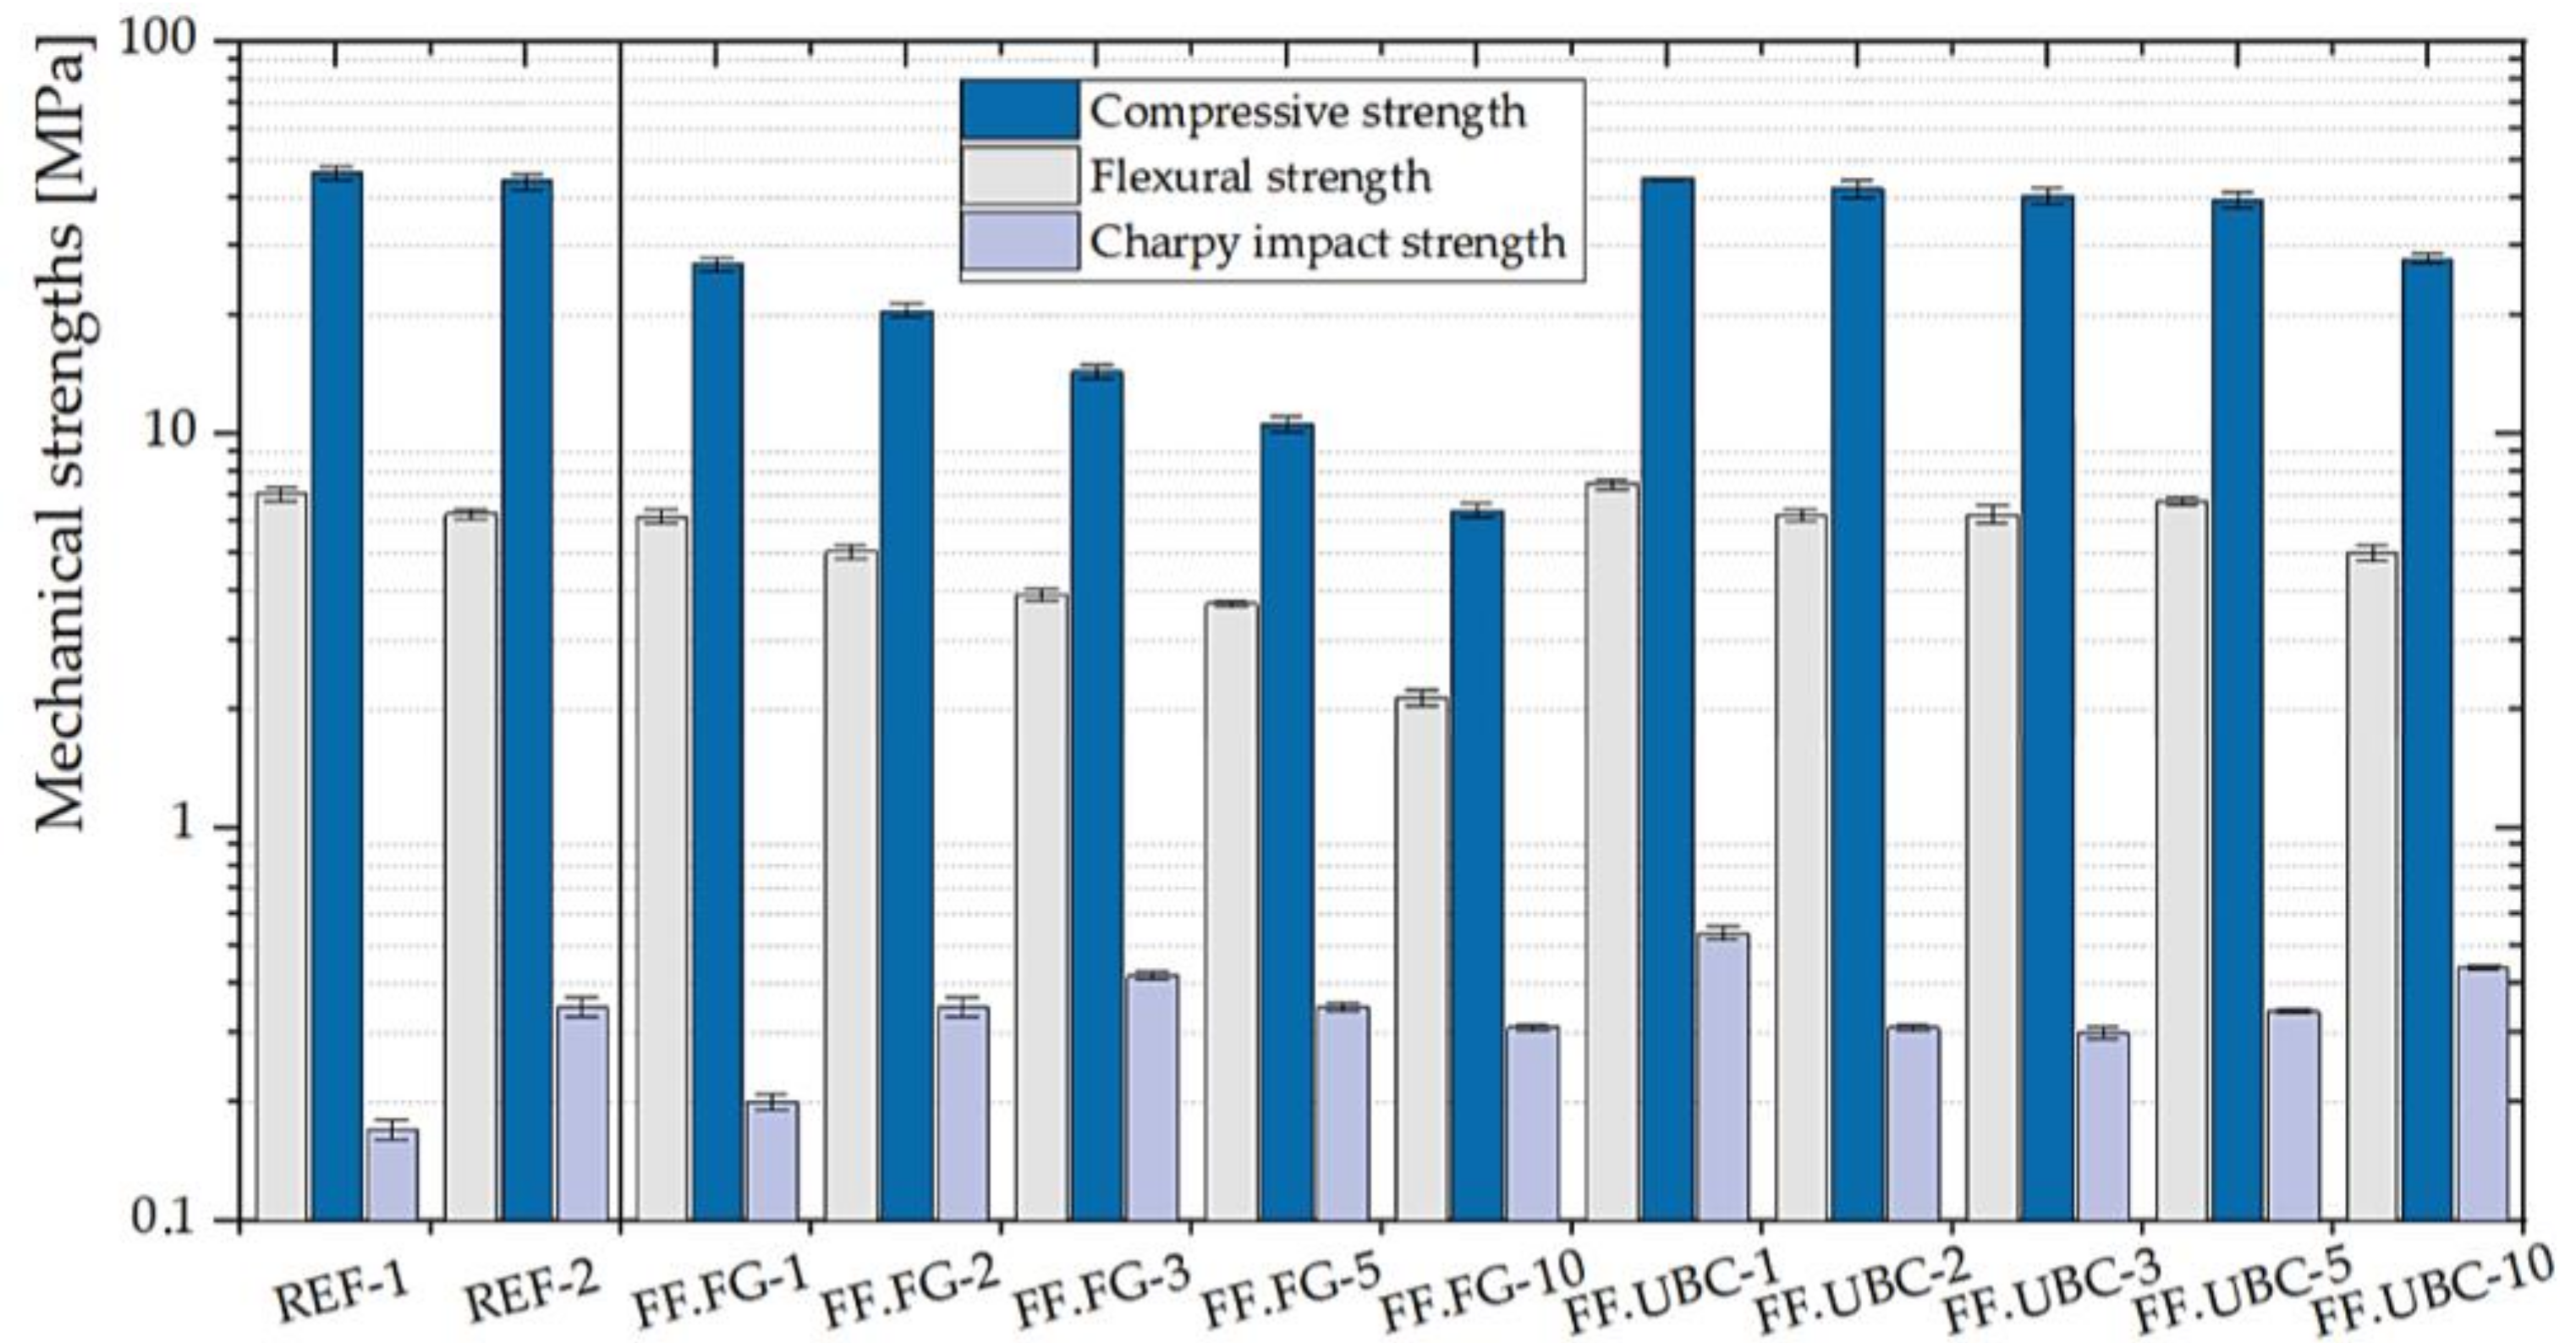
3.1.4. GFs with the Addition of the Aluminum-Rich By-Products of the Fusion Processes
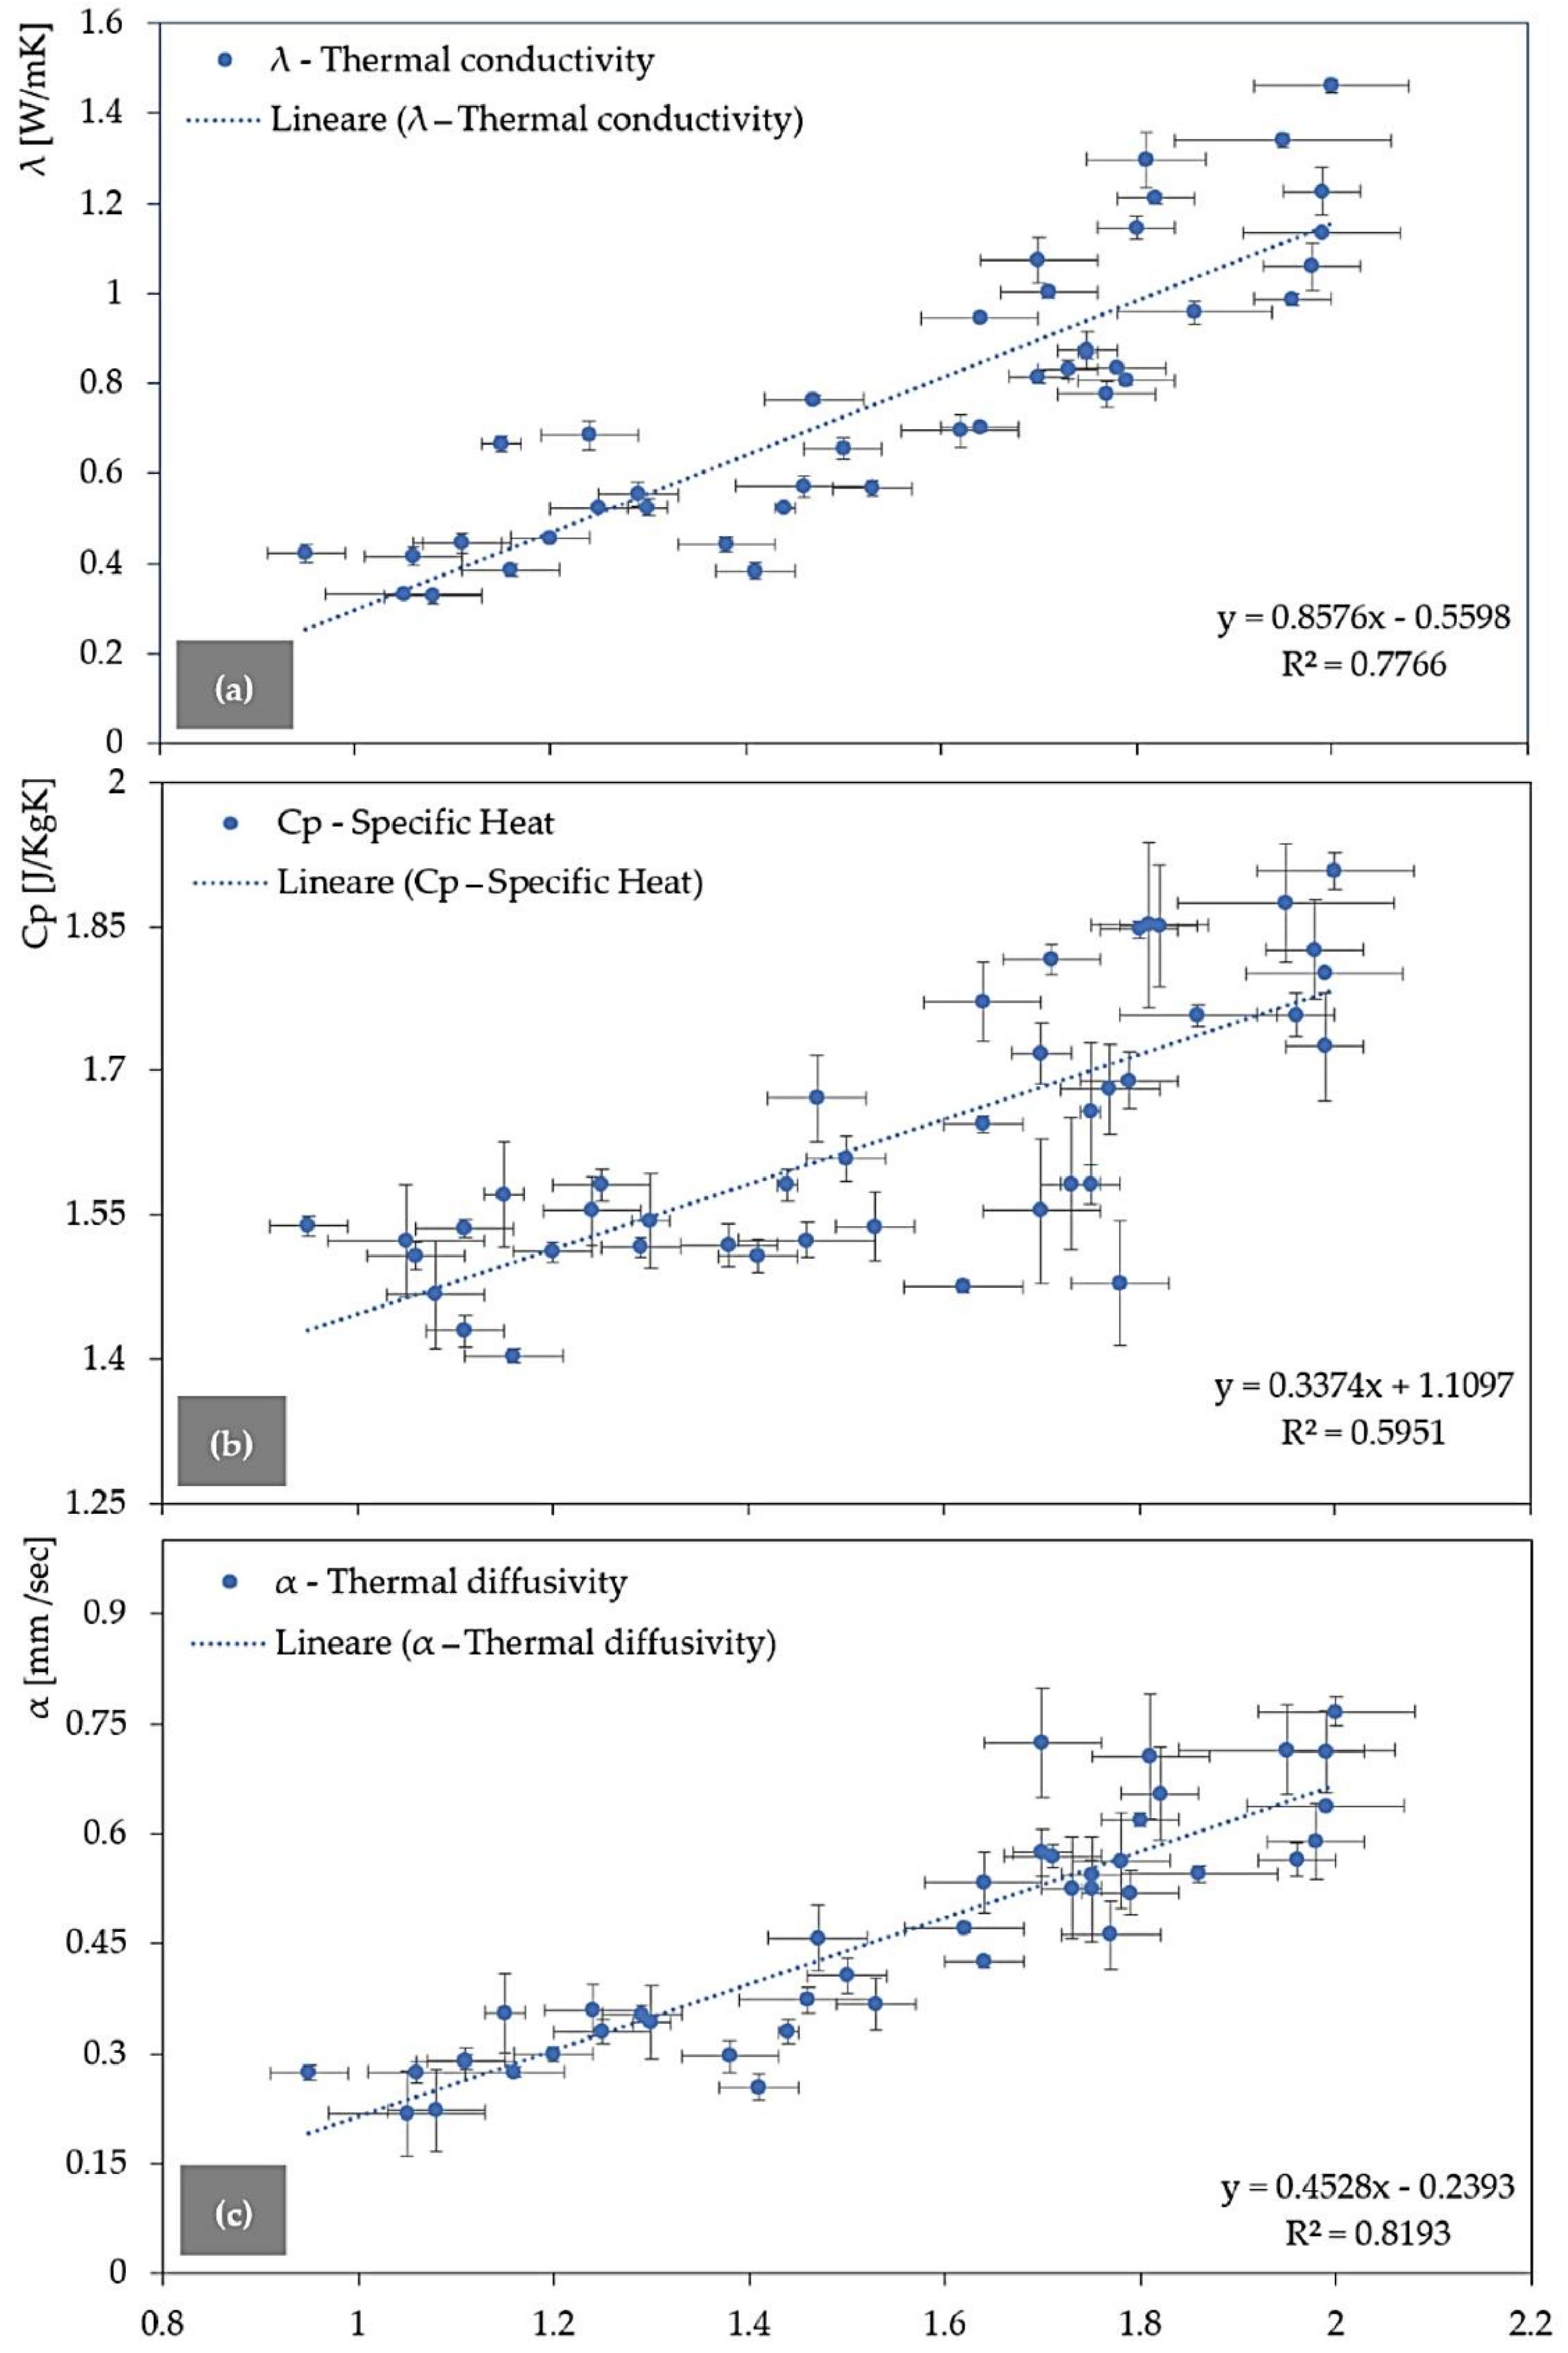
3.2. Densities versus Thermal Conductivity, Diffusivity, and Specific Heat
3.3. Classification of the GFs
4. Conclusions
Author Contributions
Funding
Acknowledgments
Conflicts of Interest
References
- Wang, S.; Li, H.; Zou, S.; Zhang, G. Experimental research on a feasible rice husk/geopolymer foam building insulation material. Energy Build. 2020, 226, 110358. [Google Scholar] [CrossRef]
- Zhang, Z.; Provis, J.; Reid, A.; Wang, H. Geopolymer foam concrete: An emerging material for sustainable construction. Constr. Build. Mater. 2014, 56, 113–127. [Google Scholar] [CrossRef]
- Sanjayan, J.G.; Nazari, A.; Chen, L.; Nguyen, G.H. Physical and mechanical properties of lightweight aerated geopolymer. Constr. Build. Mater. 2015, 79, 236–244. [Google Scholar] [CrossRef]
- Amran, M.; Al-Fakih, A.; Chu, S.H.; Fediuk, R.; Haruna, S.; de Azevedo, A.R.G.; Vatin, N. Long-term durability properties of geopolymer concrete: An indepth review. Case Stud. Constr. Mater. 2021, 15, e00661. [Google Scholar] [CrossRef]
- Janošević, N.; Djoric-Veljkovic, S.; Toplicic-Curcic, G.A.; Karamarkovic, J. Properties of geopolymers. Facta Univ. Ser. Archit. Civ. Eng. 2018, 16, 45–56. [Google Scholar] [CrossRef] [Green Version]
- Vempada, S.R.; Shrihari, S.; Rajashekar, C. Parametric studies on the properties of geopolymer concrete. E3S Web Conf. 2021, 309, 01101. [Google Scholar]
- Ahmed, F.B.; Biswas, R.K.; Ahsan, K.A.; Islam, S.; Rahman, M.R. Estimation of strength properties of geopolymer concrete. Mater. Today Proc. 2020, 44, 871–877. [Google Scholar] [CrossRef]
- Rajak, M.; Goel, V.; Rai, B. Synthesis, Characterization and Mechanical Properties of Geopolymer Paste. In Advances in Sustainable Construction Materials; Springer: Singapore, 2021; pp. 721–735. [Google Scholar]
- Singh, N.; Kumar, M.; Rai, S. Geopolymer cement and concrete: Properties. Mater. Today Proc. 2020, 29, 743–748. [Google Scholar] [CrossRef]
- van Su, L.; Szczypiński, M.M.; Hajkova, P.; Kovacic, V.; Bakalova, T.; Voleský, L.; Le, H.; Louda, P. Mechanical properties of geopolymer foam at high temperature. Sci. Eng. Compos. Mater. 2020, 27, 10. [Google Scholar]
- Kumar, R.; Verma, M.; Dev, N. Investigation on the Effect of Seawater Condition, Sulphate Attack, Acid Attack, Freeze–Thaw Condition, and Wetting–Drying on the Geopolymer Concrete. Iran. J. Sci. Technol. Trans. Civ. Eng. 2021, 1–31. [Google Scholar] [CrossRef]
- Novais Rui, M.C.; Pullar, R.; Labrincha, J.A. Geopolymer foams: An overview of recent advancements. Prog. Mater. Sci. 2020, 109, 100621. [Google Scholar] [CrossRef]
- Arnoult, M.; Perronnet, M.; Autef, A.; Nait-Ali, B.; Rossignol, S. Understanding the Formation of Geopolymer Foams: Influence of the Additives. Ceram. Mod. Technol. 2019, 1, 163–172. [Google Scholar] [CrossRef]
- Łach, M.; Pławecka, K.; Bąk, A.; Lichocka, K.; Korniejenko, K.; Cheng, A.; Lin, W.T. Determi-nation of the Influence of Hydraulic Additives on the Foaming Process and Stability of the Produced Geopolymer Foams. Materials 2021, 14, 5090. [Google Scholar] [CrossRef] [PubMed]
- van Su, L.; Louda, P.; Nam, T.H.; Dong, N.P.; Bakalova, T.; Buczkowska, K.; Dufkova, I. Study on Temperature-Dependent Properties and Fire Resistance of Metakaolin-Based Geopolymer Foams. Polymers 2020, 12, 2994. [Google Scholar]
- Łach, M.; Korniejenko, K.; Mikuła, J. Thermal Insulation and Thermally Resistant Materials Made of Geopolymer Foams. Procedia Eng. 2016, 151, 410–416. [Google Scholar] [CrossRef] [Green Version]
- van Su, L. Thermal Conductivity of Reinforced Geopolymer Foams. Ceram. Silik. 2019, 63, 1–9. [Google Scholar]
- Krishna, R.S.; Mishra, J.; Zribi, M.; Adeniyi, F.I.; Saha, S.; Baklouti, S.; Shaikh, F.U.A.; Gökçe, H.S. A review on developments of environmentally friendly geopolymer technology. Materialia 2020, 20, 101212. [Google Scholar] [CrossRef]
- Ercoli, R.; Orlando, A.; Borrini, D.; Tassi, F.; Bicocchi, G.; Renzulli, A. Hydrogen-Rich Gas Produced by the Chemical Neu-tralization of Reactive By-Products from the Screening Processes of the Secondary Aluminum Industry. Sustainability 2021, 13, 12261. [Google Scholar] [CrossRef]
- Li, Y.; Qin, Z.; Li, C.; Qu, Y.; Wang, H.; Peng, L.; Wang, Y. Hazardous characteristics and transformation mechanism in hydrometallurgical disposing strategy of secondary aluminum dross. J. Environ. Chem. Eng. 2021, 9, 106470. [Google Scholar] [CrossRef]
- Orveillon, G.; Garbarino, E.; Saveyn, H. Waste Disposal; JRC125415; European Commission: Brussels, Belgium, 2021. [Google Scholar]
- Gabitov, R.; Kolibaba, O.; Artemyeva, V.; Aksenchik, K. Cherepovets State University Experimental study of solid waste oxidative pyrolysis. Vestnik IGEU 2017, 14–19. [Google Scholar] [CrossRef]
- Mejia, R.; Villaquirán-Caicedo, M.A. Mechanical, physical, and thermoacoustic properties of lightweight composite geopolymers. Ing. Compet. 2021, in press. [Google Scholar]
- Katarzyna, B.; Le, C.H.; Louda, P.; Michał, S.; Bakalova, T.; Tadeusz, P.; Prałat, K. The Fabrication of Geopolymer Foam Composites Incorporating Coke Dust Waste. Processes 2020, 8, 1052. [Google Scholar] [CrossRef]
- Xingyi, Z.; Li, W.; Du, Z.; Zhou, S.; Zhang, Y.; Li, F. Recycling and utilization assessment of steel slag in metakaolin based geopolymer from steel slag by-product to green geopolymer. Constr. Build. Mater. 2021, 305, 124654. [Google Scholar]
- Tsaousi, G.-M.; Panias, D. Production, Properties and Performance of Slag-Based, Geopolymer Foams. Minerals 2021, 11, 732. [Google Scholar] [CrossRef]
- Kozub, B.; Bazan, P.; Gailitis, R.; Korniejenko, K.; Mierzwiński, D. Foamed Geopolymer Composites with the Addition of Glass Wool Waste. Materials 2021, 14, 4978. [Google Scholar] [CrossRef] [PubMed]
- Hajimohammadi, A.; Ngo, T.; Mendis, P.; Sanjayan, J. Regulating the chemical foaming reaction to control the porosity of geopolymer foams. Mater. Des. 2017, 120, 255–265. [Google Scholar] [CrossRef]
- Eliche-Quesada, D.; Ruiz-Molina, S.; Pérez-Villarejo, L.; Castro, E.; Sánchez-Soto, P.J. Dust filter of secondary al-uminium industry as raw material of geopolymer foams. J. Build. Eng. 2020, 32, 101656. [Google Scholar] [CrossRef]
- Clausi, M.; Tarantino, S.C.; Magnani, L.L.; Riccardi, M.P.; Tedeschi, C.; Zema, M. Metakaolin as a precursor of materials for applications in Cultural Heritage: Geopolymer-based mortars with ornamental stone aggregates. Appl. Clay Sci. 2016, 132–133, 589–599. [Google Scholar] [CrossRef]
- Hermann, E.; Kunze, C.; Gatzweiler, R.; Kießig, G.; Davidovits, J. Solidification of various radioactive residues by Gèoplymère with special emphasis on long-term-stability. Gèopolymère ‘99 Proc. 1999. Available online: https://www.geopolymer.org/wp-content/uploads/SOLIDRAD.pdf (accessed on 31 January 2022).
- Davidovits, J. Application of Ca-Based Geopolymer with Blast Furnace Slag, a Review. In Proceedings of the 2nd International Slag Valorisation Symposium, Leuven, Belgium, 18–20 April 2011; pp. 33–49. [Google Scholar]
- Fernández-Jiménez, A.; Palomo, A.; Criado, M. Alkali activated fly ash binders. A comparative study between sodium and potassium activators. Mater. De Constr. 2006, 56, 51–65. [Google Scholar]
- Davidovits, J. Geopolymers: Ceramic-like inorganic polymers. J. Ceram. Sci. Technol. 2017, 8, 335–350. [Google Scholar]
- Davidovits, J. Geopolymer Chemistry and Applications, 5th ed.; Institut Géopolymère: Saint-Quentin, France, 2020; ISBN 9782954453118. [Google Scholar]
- Weng, L.; Sagoe-Crentsil, K.; Brown, T.; Song, S. Effects of Aluminosilicates on the Formation of Geopolymers. Mat. Sci. Eng. 2005, 117, 163–168. [Google Scholar] [CrossRef]
- Davidovits, J.; Buzzi, L.; Rocher, P.; Gimeno, D.; Marini, C.; Tocco, S. Geopolymeric Cement Based on Low Cost Geologic Material, Results from the European Research Project GEOCISTEM. Available online: https://www.researchgate.net/publication/284757919_Geopolymeric_cement_based_on_low_cost_geologic_material_results_from_the_European_Research_project_GEOCISTEM (accessed on 31 January 2022).
- Palomo, A.; Glasser, F. Chemically-bonded cementitious materials based on metakaolin. Ceram. Trans. 1992, 91, 107–112. [Google Scholar]
- Duxson, P.; Lukey, G.C.; Van De Venter, J.S.J.; Mallicoat, S.W.; Kriven, W. Microstructural Characterization of Metakaolin-based Geopolymers. Ceram. Trans. 2005, 165, 71–85. [Google Scholar]
- BAUCIS LK: ČLUZ a.s. Available online:https://www.cluz.cz/en/baucis-lk (accessed on 31 January 2022).
- Sklopísek Střeleč a.s. Available online: https://glassand.eu/celkova-produkce/podle-druhu/technicke-pisky (accessed on 31 January 2022).
- Korniejenko, K.; Figiela, B.; Miernik, K.; Ziejewska, C.; Marczyk, J.; Hebda, M.; Cheng, A.; Lin, W.T. Mechanical and Fracture Properties of Long Fiber Reinforced Geopolymer Composites. Materials 2021, 14, 5183. [Google Scholar] [CrossRef] [PubMed]
- Walbrück, K.; Maeting, F.; Witzleben, S.; Stephan, D. Natural Fiber-Stabilized Geopolymer Foams—A Review. Materials 2020, 1, 3198. [Google Scholar] [CrossRef] [PubMed]
- Lee, J.H.; Wattanasiriwech, S.; Wattanasiriwech, D. Preparation of Carbon Fiber Reinforced Metakaolin Based-Geopolymer Foams. Key Eng. Mater. 2018, 766, 19–27. [Google Scholar] [CrossRef]
- Nguyen, S.; Louda, P.; Katarzyna, B.; Roberto, E.; Piotr, L. Enhancing Geopolymer Composites by Recycled Fibers; Geopolymer Institute: Saint-Quentin, France, 2021. [Google Scholar]
- Padamata, S.K.; Yasinskiy, A.; Polyakov, P.V. A Review of Secondary Aluminum Production and Its Byproducts. JOM 2021, 73, 2603–2614. [Google Scholar] [CrossRef]
- Jafari, N.H.; Stark, T.D.; Roper, R. Classification and Reactivity of Secondary Aluminum Production Waste. J. Hazard. Toxic Radioact. Waste 2014, 18, 04014018. [Google Scholar] [CrossRef]
- Asur Marche. Available online: https://serviziweb.asur.marche.it/ALBI/AV1/determine/2015/20151014_111048_875-AV1-14-10-2015.rtf (accessed on 31 January 2022).
- EUR-Lex. Directive 2010/75/EU of the European Parliament and of the Council of 24 November 2010 on Industrial Emissions (Integrated Pollution Prevention and Control). Available online: https://eur-lex.europa.eu/legal-content/EN/TXT/?uri=CELEX%3A32010L0075 (accessed on 31 January 2022).
- European Parliament. Available online: https://www.europarl.europa.eu/RegData/etudes/etudes/join/2006/375865/IPOL-ENVI_ET (accessed on 31 January 2022).
- EUR-Lex. Available online: https://eur-lex.europa.eu/legal-content/EN/TXT/?uri=celex%3A32008R1272 (accessed on 5 March 2021).
- EUR-Lex. Available online: https://eur-lex.europa.eu/legal-content/IT/TXT/PDF/?uri=CELEX:32014R1357&from=DA (accessed on 31 January 2022).
- Gasparini, E.; Tarantino, S.C.; Conti, M.; Biesuz, R.; Ghigna, P.; Auricchio, F.; Riccardi, M.P.; Zema, M. Geopolymers from low-T activated kaolin: Implications for the use of alunite-bearing raw materials. Appl. Clay Sci. 2015, 114, 530–539. [Google Scholar] [CrossRef]
- Lermen, R.T.; Korf, E.M.; De Oliveira, L.N.; De Oliveira, R.N.; Dos Santos Neto, D.D.; Silva, R. Evaluation of the properties of a foamed geopolymer developed with different types of metakaolin. Ceramica 2021, 67, 12. [Google Scholar] [CrossRef]
- Nguyen, V.V.; Le, V.S.; Louda, P.; Szczypiński, M.M.; Ercoli, R.; Růžek, V.; Łoś, P.; Prałat, K.; Plaskota, P.; Pacyniak, T.; et al. Low-Density Geopolymer Composites for the Construction Industry. Polymers 2022, 14, 304. [Google Scholar] [CrossRef] [PubMed]
- European Standards. Available online: https://www.en-standard.eu/bs-en-12390-3-2019-testing-hardened-concrete-compressive-strength-of-test-specimens/ (accessed on 31 January 2022).
- UNI. Available online: http://store.uni.com/catalogo/uni-en-10002-1-2004 (accessed on 31 January 2022).
- UNI. Available online: http://store.uni.com/catalogo/en-196-1-2016 (accessed on 31 January 2022).
- UNI. Available online: http://store.uni.com/catalogo/en-iso-148-1-2010 (accessed on 31 January 2022).
- AST International. Available online: https://www.astm.org/d5334-08.html#:~:text=ASTM%20D5334%20%2D%2008%20Standard%20Test,by%20Thermal%20Needle%20Probe%20Procedure (accessed on 31 January 2022).
- Maleki, N.; Haghighi, B. Design of a Simple and Stand-alone RS-232c Interface. J. Chem. Educ. 1995, 72, A78. [Google Scholar] [CrossRef]
- Dudek, E.; Mosiadz, M.; Orzepowski, M. Uncertainties of resistors temperature coefficients. Meas. Sci. Rev. 2007, 7, 23–26. [Google Scholar]
- Kušnerová, M.; Valíček, J.; Harničárová, M.; Hryniewicz, T.; Rokosz, K.; Palková, Z.; Václavík, V.; Řepka, M.; Bendová, M. A proposal for simplifying the method of evaluation of uncertainties in measurement results. Meas. Sci. Rev. 2013, 13, 1–6. [Google Scholar] [CrossRef]
- Prałat, K.; Ciemnicka, J.; Koper, A.; Buczkowska, K.; Łoś, P. Comparison of the Thermal Properties of Geopolymer and Modified Gypsum. Polymers 2021, 13, 1220. [Google Scholar] [CrossRef] [PubMed]
- Prałat, K.; Jaskulski, R.; Ciemnicka, J.; Makomaski, G. Analysis of the thermal properties and structure of gypsum modified with cellulose based polymer and aerogels. Arch. Civ. Eng. 2020, 66, 135214. [Google Scholar] [CrossRef]
- European Standards. Available online: https://www.en-standard.eu/bs-en-1936-2006-natural-stone-test-methods-determination-of-real-density-and-apparent-density-and-of-total-and-open-porosity/ (accessed on 31 January 2022).
- Prałat, K.; Łukasiewicz, M.; Miczko, P. Experimental study of the basic mechanical properties of hardened gypsum paste modified with addition of polyoxymethylene micrograins. Arch. Civ. Eng. 2020, 66, 385–397. [Google Scholar]
- Rozyanty, A.R. Mechanical Properties of Geopolymer Filler in Polymer Composites. In Mineral-Filled Polymer Composites; CRC Press: Boca Raton, FL, USA, 2021. [Google Scholar]
- Koper, A.; Prałat, K.; Ciemnicka, J.; Buczkowska, K. Influence of the Calcination Temperature of Synthetic Gypsum on the Particle Size Distribution and Setting Time of Modified Building Materials. Energies 2020, 13, 5759. [Google Scholar] [CrossRef]
- Prałat, K.; Krymarys, E. A particle size distribution measurements of selected building materials using laser diffraction method. Tech. Trans. 2018, 11, 95–108. [Google Scholar]
- Walbrück, K.; Drewler, L.; Witzleben, S.; Stephan, D. Factors influencing thermal conductivity and compressive strength of natural fiber-reinforced geopolymer foams. Open Ceram. 2021, 5, 100065. [Google Scholar] [CrossRef]
- Ji, Z.; Li, M.; Su, L.; Pei, Y. Porosity, mechanical strength and structure of waste-based geopolymer foams by different stabilizing agents. Constr. Build. Mater. 2020, 258, 119555. [Google Scholar] [CrossRef]
- Zhang, Z.; Wang, H. The Pore Characteristics of Geopolymer Foam Concrete and Their Impact on the Compressive Strength and Modulus. Front. Mater. 2016, 3, 38. [Google Scholar] [CrossRef] [Green Version]
- Bai, C.; Franchin, G.; Elsayed, H.; Zaggia, A.; Conte, L.; Li, H.; Colombo, P. High-porosity geopolymer foams with tailored porosity for thermal insulation and wastewater treatment. J. Mater. Res. 2017, 32, 1–9. [Google Scholar] [CrossRef]
- Jaya, N.A.; Ming, L.Y.; Yong, H.C.; Abdullah, M.M.a.; Kamarudin, H. Correlation between pore structure, compressive strength and thermal conductivity of porous metakaolin geopolymer. Constr. Build. Mater. 2020, 247, 118641. [Google Scholar] [CrossRef]


| ρ (g/cc) | SiO2 (wt. %) | Al2O3 (wt.%) | TiO2 (wt.%) | Fe2O3 (wt.%) | K2O (wt.%) | MgO (wt.%) | CaO (wt.%) | C (wt.%) | |
|---|---|---|---|---|---|---|---|---|---|
| MK | 1.95 | 54.1 | 40.1 | 1.80 | 1.10 | 0.80 | 0.18 | 0.13 | - |
| SA | 2.65 | 99.4 | - | - | 0.04 | - | - | - | - |
| CFs | 1.8 | - | - | - | - | - | - | - | >95% |
| V.FG | V.UBC | D.FG | D.UBC | C.FG | C.UBC | FF.FG | FF.UBC | Classification (CE Reg. 1272/2008) | HP (CE Reg. 1357/2014) | |
|---|---|---|---|---|---|---|---|---|---|---|
| ρ (g/cc) | 2.87 ± 0.01 | 2.69 ± 0.003 | 2.55 ± 0.09 | 2.58 ± 0.09 | 2.34 ± 0.04 | 2.40 ± 0.09 | 2.47 ± 0.11 | 2.52 ± 0.05 | ||
| Al (ppm) | 125,468 | 180,638 | 32,204 | 40,198 | 73,296 | 62,333 | 14,549 | 6636 | H314 | 50,000 HP8 |
| Sb (ppm) | <5 | <5 | 6 | <5 | <5 | <5 | 7.0 | 11 | H314 H314 H411 | 10,000 HP4 50,000 HP8 250,000 HP 14 |
| As (ppm) | <5 | <5 | <5 | <5 | <5 | <5 | <5 | <5 | H301 H331 H350 H400 H410 | 50,000 HP6 32,500 HP6 1000 HP7 250,000 HP14 250,000 HP14 |
| B (ppm) | 36.2 | 11.1 | 128.8 | 137.9 | 62.4 | 70.9 | 77 | 59 | H360FD | 3000 HP10 |
| Cd (ppm) | 36.2 | 7.4 | 25.8 | 46.1 | 27.6 | 70.6 | 91.3 | 36.3 | H372 H330 H350 H361 H341 | 10,000 HP 5 1000 HP 6 1000 HP 7 30,000 HP 10 10,000 HP 11 |
| Co (ppm) | 28.5 | <5 | 9.7 | 31.3 | 12.3 | 103.8 | <5 | <5 | H317; H334 | 100,000 HP13 |
| Cr6+ (ppm) | <0.5 | <0.5 | <0.5 | <0.5 | <0.5 | <0.5 | <0.5 | <0.5 | H340 H361f H317; H334 H350 H302 H410 H335; H372 | 1000 HP 11 30,000 HP 10 100,000 HP 13 1000 HP7 250,000 HP6 250,000 HP 14 10,000 HP 5 |
| Cr (ppm) | 49.5 | 107.9 | 182.3 | 34.7 | 326.5 | 222 | 94.8 | 30.3 | - | - |
| Mn (ppm) | 930.5 | 2891 | 302.4 | 585.6 | 671.6 | 717.8 | 129.6 | 29.5 | H301; H302; H332H373 | 50,000 HP6 100,000 HP5 |
| Mo (ppm) | <5 | 5 | <5 | <5 | <5 | <5 | <5 | <5 | H315; H319 H351 | 200,000 HP 4 10,000 HP 7 |
| Ni (ppm) | 488.7 | 26.7 | 66.6 | 49.8 | 119.1 | 134.6 | 21.5 | <5 | H315 H301; H331 H350i H360D H341 H317; H334 H400 H411 | 200,000 HP 4 32,500 HP 6 1000 HP 7 3000 HP 10 10,000 HP 11 100,000 HP 13 250,000 HP 14 250,000 HP 14 |
| Pb (ppm) | 266.1 | 54.1 | 2756.4 | 787.8 | 3998.0 | 1378.0 | 369.5 | 165.6 | H373 H360Df H410 H332 | 100,000 HP 5 3000 HP 10 250,000 HP 14 225,000 HP 6 |
| Cu (ppm) | 2710.3 | 1287.5 | 2045.9 | 640.2 | 2891.6 | 744.4 | 201.2 | 79.3 | H315; H319 H302 H400 H410 | 200,000 HP 4 250,000 HP 6 250,000 HP 14 250,000 HP 14 |
| Se (ppm) | <5 | <5 | <5 | <5 | <5 | <5 | 78.8 | 20 | H373H301; H331 | 100,000 HP5 32,500 HP6 |
| Sn (ppm) | 102.8 | 52.4 | 91.7 | 15.5 | 116.2 | 194.7 | 39.9 | 7.2 | H314 H412 | 50,000 HP 8 250,000 HP 14 |
| V (ppm) | 29.6 | 56.4 | 24.6 | 12.6 | 23.8 | 23.7 | <5.0 | <5.0 | H318 H335 H372 H300; H301; H302; H332 H341 H411 | 10,000 HP4 200,000 HP 5 10,000 HP 5 1000 HP 6 10,000 HP 11 250,000 HP 14 |
| Zn (ppm) | 14,539.0 | 3501.0 | 4774.2 | 3977.2 | 10,109.6 | 13,937.9 | 2028.6 | 689.4 | H302 H315; H319 H335 H400 H410 | 250,000 HP 6 200,000 HP 4 200,000 HP 5 250,000 HP 14 250,000 HP 14 |
| By Weight Ratio (-) | ||||
|---|---|---|---|---|
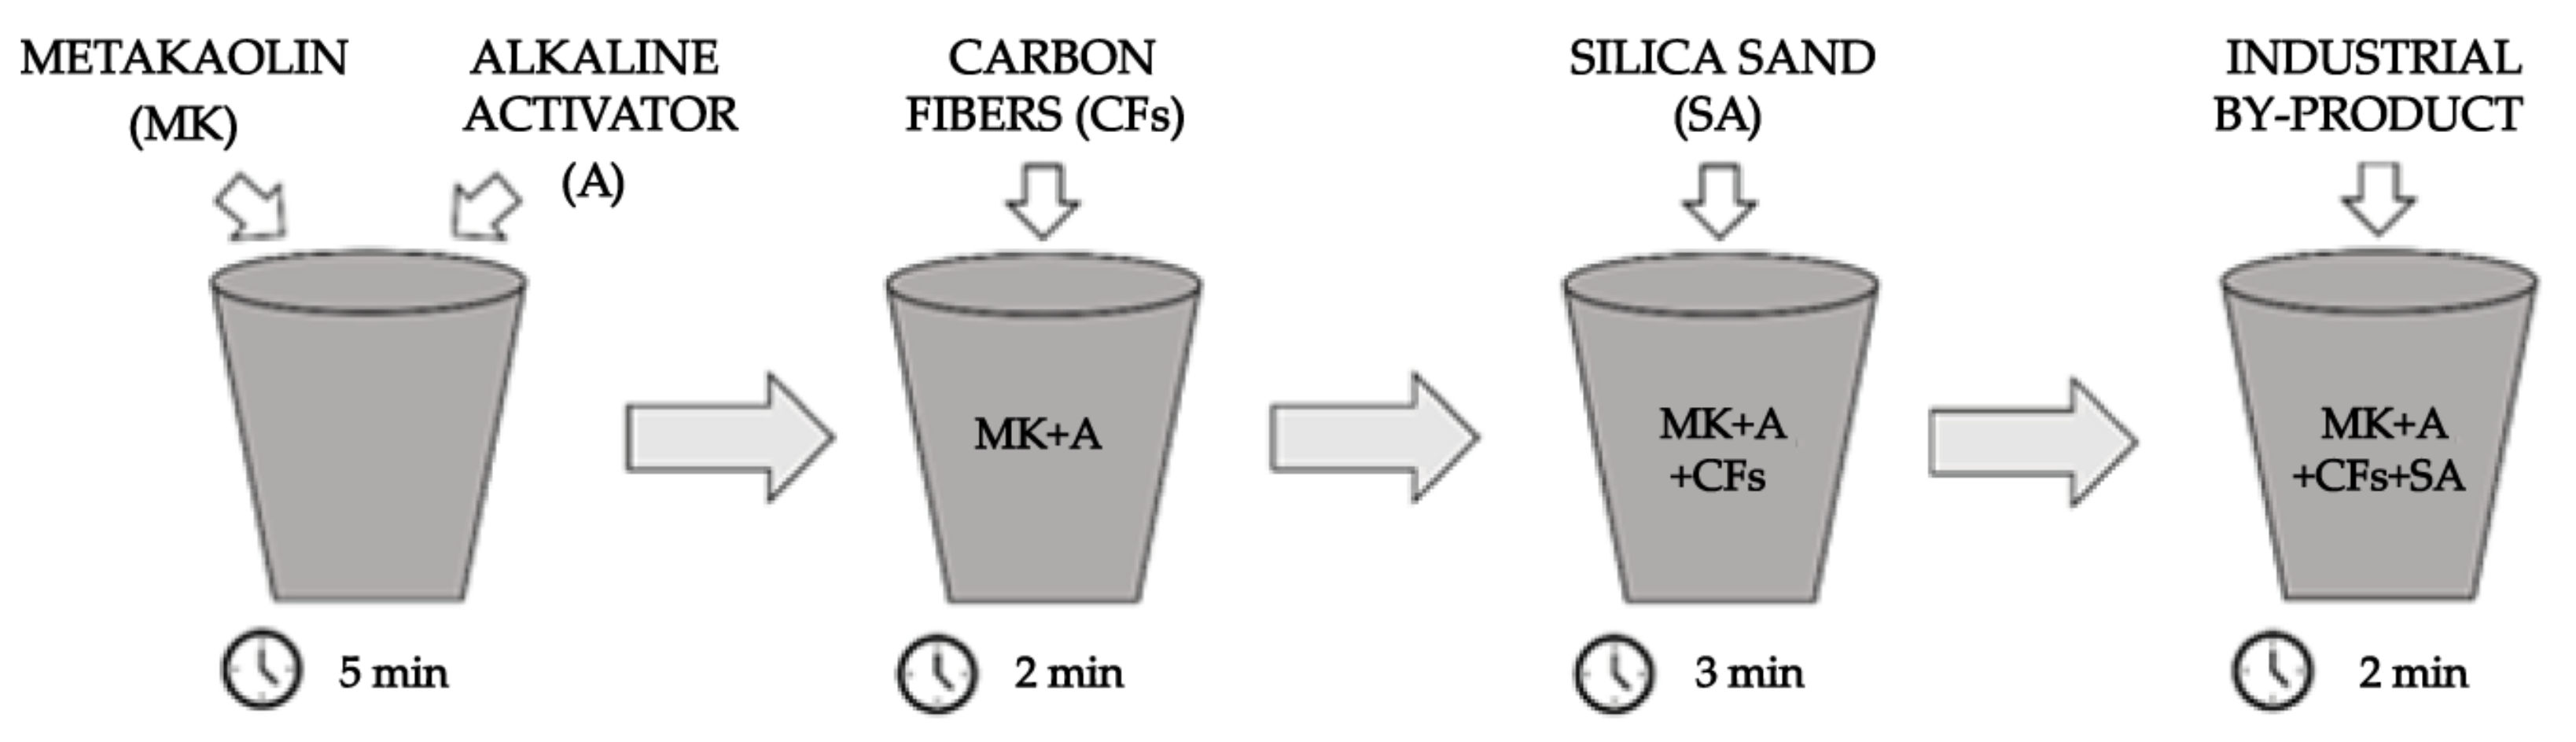
| Metakaolin (MK) | Alkaline Activator (A) | Carbon Fibers (CFs) | Silica Sand (SA) | Industrial By-Products (V.FG, V.UBC, D.FG, D.UBC, C.FG, C.UBC, FF.FG, FF.UBC) |
| 1 | 0.9 MK | 0.01 MK | 1 MK | 0.01 MK 0.02 MK 0.03 MK 0.05 MK 0.1 MK |
| Geopolymers | Three-Point Bending Strength | Compressive Strength | Charpy Impact Strength | |
|---|---|---|---|---|
| By-Products (wt.% of MK) | ||||
| REF-1 | - | 7.04 ± 0.31 | 46.24 ± 1.84 | 0.17 ± 0.01 |
| REF-2 | - | 6.25 ± 0.20 | 44.02 ± 2.08 | 0.35 ± 0.02 |
| V.FG- | 1 | 4.41 ± 0.11 | 16.56 ± 0.71 | 0.32 ± 0.01 |
| 2 | 3.87 ± 0.19 | 15.75 ± 0.85 | 0.44 ± 0.01 | |
| 3 | 3.61 ± 0.17 | 10.98 ± 0.54 | 0.35 ± 0.02 | |
| 5 | 2.62 ± 0.12 | 7.44 ± 0.34 | 0.28 ± 0.01 | |
| 10 | 1.78 ± 0.08 | 5.73 ± 0.13 | 0.29 ± 0.01 | |
| V.UBC- | 1 | 4.25 ± 0.13 | 8.08 ± 0.22 | 0.39 ± 0.01 |
| 2 | 3.05 ± 0.13 | 5.96 ± 0.26 | 0.36 ± 0.02 | |
| 3 | 2.26 ± 0.11 | 5.19 ± 0.24 | 0.30 ± 0.01 | |
| 5 | 2.59 ± 0.08 | 3.95 ± 0.08 | 0.30 ± 0.01 | |
| 10 | 1.55 ± 0.08 | 3.56 ± 0.05 | 0.26 ± 0.01 | |
| D.FG- | 1 | 6.04 ± 0.19 | 22.96 ± 0.96 | 0.69 ± 0.03 |
| 2 | 4.81 ± 0.22 | 17.57 ± 0.06 | 0.61 ± 0.02 | |
| 3 | 4.05 ± 0.20 | 12.00 ± 0.50 | 0.50 ± 0.03 | |
| 5 | 2.69 ± 0.12 | 9.39 ± 0.32 | 0.36 ± 0.01 | |
| 10 | 3.14 ± 0.12 | 10.28 ± 0.40 | 0.38 ± 0.004 | |
| D.UBC- | 1 | 5.78 ± 0.28 | 26.58 ± 1.32 | 0.63 ± 0.02 |
| 2 | 5.31 ± 0.24 | 23.35 ± 0.63 | 0.71 ± 0.03 | |
| 3 | 4.46 ± 0.19 | 16.99 ± 0.80 | 0.53 ± 0.01 | |
| 5 | 3.25 ± 0.05 | 9.08 ± 0.36 | 0.51 ± 0.01 | |
| 10 | 2.24 ± 0.11 | 4.27 ± 0.19 | 0.30 ± 0.01 | |
| C.FG- | 1 | 2.09 ± 0.08 | 6.67 ± 0.30 | 0.28 ± 0.01 |
| 2 | 2.18 ± 0.08 | 5.90 ± 0.25 | 0.26 ± 0.01 | |
| 3 | 1.71 ± 0.08 | 3.27 ± 0.06 | 0.29 ± 0.002 | |
| 5 | 2.58 ± 0.07 | 4.94 ± 0.19 | 0.31 ± 0.01 | |
| 10 | 2.23 ± 0.01 | 4.05 ± 0.09 | 0.35 ± 0.02 | |
| C.UBC- | 1 | 3.09 ± 0.09 | 6.35 ± 0.18 | 0.29 ± 0.001 |
| 2 | 2.17 ± 0.09 | 4.24 ± 0.17 | 0.26 ± 0.01 | |
| 3 | 1.99 ± 0.08 | 3.66 ± 0.16 | 0.19 ± 0.003 | |
| 5 | 1.96 ± 0.07 | 3.46 ± 0.13 | 0.26 ± 0.01 | |
| 10 | 1.74 ± 0.08 | 2.96 ± 0.13 | 0.31 ± 0.01 | |
| FF.FG- | 1 | 6.18 ± 0.25 | 27.03 ± 1.03 | 0.20 ± 0.01 |
| 2 | 5.03 ± 0.20 | 20.60 ± 0.88 | 0.35 ± 0.02 | |
| 3 | 3.91 ± 0.15 | 14.44 ± 0.65 | 0.42 ± 0.01 | |
| 5 | 3.71 ± 0.07 | 10.64 ± 0.49 | 0.35 ± 0.01 | |
| 10 | 2.15 ± 0.10 | 6.40 ± 0.27 | 0.31 ± 0.005 | |
| FF.UBC- | 1 | 7.48 ± 0.22 | 44.67 ± 0.31 | 0.54 ± 0.02 |
| 2 | 6.21 ± 0.23 | 42.05 ± 2.07 | 0.31 ± 0.004 | |
| 3 | 6.24 ± 0.31 | 40.53 ± 1.85 | 0.30 ± 0.01 | |
| 5 | 6.77 ± 0.16 | 39.47 ± 1.88 | 0.34 ± 0.004 | |
| 10 | 5.01 ± 0.23 | 27.92 ± 0.84 | 0.44 ± 0.003 | |
| Geopolymer |
By-Products (wt.% of MK) | (g/cc) | (W/mK) | (J/KgK) | (mm2/sec) |
|---|---|---|---|---|---|
| REF-1 | - | 1.81 ± 0.06 | 1.2981 ± 0.0606 | 1.8518 ± 0.0855 | 0.7056 ± 0.0295 |
| REF-2 | - | 2.00 ± 0.08 | 1.4607 ± 0.0167 | 1.9078 ± 0.0194 | 0.7667 ± 0.0124 |
| V.FG- | 1 | 1.75 ± 0.03 | 0.8740 ± 0.0414 | 1.5828 ± 0.0206 | 0.5447 ± 0.0256 |
| 2 | 1.78 ± 0.05 | 0.8330 ± 0.0050 | 1.4794 ± 0.0649 | 0.5639 ± 0.0216 | |
| 3 | 1.62 ± 0.06 | 0.6947 ± 0.0345 | 1.4758 ± 0.0065 | 0.4709 ± 0.021 | |
| 5 | 1.44 ± 0.01 | 0.5239 ± 0.0039 | 1.5815 ± 0.0166 | 0.3302 ± 0.0058 | |
| 10 | 1.30 ± 0.02 | 0.5249 ± 0.0190 | 1.5446 ± 0.0495 | 0.3426 ± 0.0145 | |
| V.UBC- | 1 | 1.73 ± 0.03 | 0.8304 ± 0.0199 | 1.5828 ± 0.0692 | 0.5264 ± 0.0277 |
| 2 | 1.38 ± 0.05 | 0.4424 ± 0.0183 | 1.5195 ± 0.0219 | 0.2969 ± 0.0139 | |
| 3 | 1.46 ± 0.07 | 0.5723 ± 0.0237 | 1.5245 ± 0.0179 | 0.3735 ± 0.0114 | |
| 5 | 1.29 ± 0.04 | 0.5533 ± 0.0273 | 1.5168 ± 0.0108 | 0.3544 ± 0.0186 | |
| 10 | 1.16 ± 0.05 | 0.3864 ± 0.0131 | 1.4043 ± 0.0073 | 0.2752 ± 0.0079 | |
| D.FG- | 1 | 1.99 ± 0.08 | 1.1351 ± 0.0065 | 1.8014 ± 0.0016 | 0.6383 ± 0.0093 |
| 2 | 1.86 ± 0.08 | 0.9585 ± 0.0255 | 1.7580 ± 0.0114 | 0.5453 ± 0.0181 | |
| 3 | 1.79 ± 0.05 | 0.8056 ± 0.0091 | 1.6898 ± 0.0293 | 0.5203 ± 0.1047 | |
| 5 | 1.70 ± 0.03 | 0.8150 ± 0.0134 | 1.7186 ± 0.0318 | 0.5745 ± 0.0164 | |
| 10 | 1.53 ± 0.04 | 0.5666 ± 0.0164 | 1.5385 ± 0.0357 | 0.3683 ± 0.0026 | |
| D.UBC- | 1 | 1.70 ± 0.06 | 1.0742 ± 0.0510 | 1.5547 ± 0.0751 | 0.7246 ± 0.0319 |
| 2 | 1.64 ± 0.06 | 0.9446 ± 0.0073 | 1.7715 ± 0.0411 | 0.5336 ± 0.0164 | |
| 3 | 1.77 ± 0.05 | 0.7761 ± 0.0291 | 1.6812 ± 0.0466 | 0.4624 ± 0.0231 | |
| 5 | 1.64 ± 0.04 | 0.7012 ± 0.0097 | 1.6448 ± 0.0090 | 0.4263 ± 0.0037 | |
| 10 | 1.24 ± 0.05 | 0.6841 ± 0.0320 | 1.5549 ± 0.0353 | 0.3597 ± 0.0158 | |
| C.FG- | 1 | 1.25 ± 0.05 | 0.5222 ± 0.0038 | 1.5815 ± 0.0166 | 0.3302 ± 0.0058 |
| 2 | 1.20 ± 0.04 | 0.4568 ± 0.0074 | 1.5125 ± 0.0102 | 0.2999 ± 0.0066 | |
| 3 | 1.05 ± 0.08 | 0.3306 ± 0.0069 | 1.5235 ± 0.0583 | 0.2194 ± 0.0008 | |
| 5 | 1.06 ± 0.05 | 0.4154 ± 0.0190 | 1.5079 ± 0.0145 | 0.2754 ± 0.0099 | |
| 10 | 1.11 ± 0.04 | 0.4444 ± 0.0212 | 1.4302 ± 0.0167 | 0.2903 ± 0.0135 | |
| C.UBC- | 1 | 1.50 ± 0.04 | 0.6539 ± 0.0239 | 1.6092 ± 0.0230 | 0.4064 ± 0.0150 |
| 2 | 1.41 ± 0.04 | 0.3829 ± 0.0191 | 1.5076 ± 0.0173 | 0.2542 ± 0.0218 | |
| 3 | 1.11 ± 0.05 | 0.4443 ± 0.0076 | 1.5359 ± 0.0096 | 0.2892 ± 0.0032 | |
| 5 | 0.95 ± 0.04 | 0.4217 ± 0.0205 | 1.5390 ± 0.0103 | 0.2741 ± 0.0132 | |
| 10 | 1.08 ± 0.05 | 0.3265 ± 0.0150 | 1.4678 ± 0.0558 | 0.2220 ± 0.0113 | |
| FF.FG- | 1 | 1.98 ± 0.05 | 1.0599 ± 0.0528 | 1.8263 ± 0.0520 | 0.5892 ± 0.0288 |
| 2 | 1.96 ± 0.04 | 0.9873 ± 0.0130 | 1.7583 ± 0.0226 | 0.5643 ± 0.0024 | |
| 3 | 1.75 ± 0.01 | 0.8694 ± 0.0134 | 1.6577 ± 0.0717 | 0.5250 ± 0.0147 | |
| 5 | 1.47 ± 0.05 | 0.7647 ± 0.0071 | 1.6716 ± 0.0445 | 0.4577 ± 0.0112 | |
| 10 | 1.15 ± 0.02 | 0.6655 ± 0.0178 | 1.5719 ± 0.0540 | 0.3564 ± 0.0094 | |
| FF.UBC- | 1 | 1.95 ± 0.11 | 1.3399 ± 0.0153 | 1.8743 ± 0.0613 | 0.7152 ± 0.0152 |
| 2 | 1.99 ± 0.04 | 1.2267 ± 0.0531 | 1.7256 ± 0.0564 | 0.7127 ± 0.0656 | |
| 3 | 1.82 ± 0.04 | 1.2116 ± 0.0126 | 1.8506 ± 0.0628 | 0.6551 ± 0.0155 | |
| 5 | 1.80 ± 0.04 | 1.1462 ± 0.0245 | 1.8472 ± 0.0090 | 0.6197 ± 0.0168 | |
| 10 | 1.71 ± 0.05 | 1.0018 ± 0.0119 | 1.8159 ± 0.0154 | 0.5700 ± 0.0452 |
Publisher’s Note: MDPI stays neutral with regard to jurisdictional claims in published maps and institutional affiliations. |
© 2022 by the authors. Licensee MDPI, Basel, Switzerland. This article is an open access article distributed under the terms and conditions of the Creative Commons Attribution (CC BY) license (https://creativecommons.org/licenses/by/4.0/).
Share and Cite
Ercoli, R.; Laskowska, D.; Nguyen, V.V.; Le, V.S.; Louda, P.; Łoś, P.; Ciemnicka, J.; Prałat, K.; Renzulli, A.; Paris, E.; et al. Mechanical and Thermal Properties of Geopolymer Foams (GFs) Doped with By-Products of the Secondary Aluminum Industry. Polymers 2022, 14, 703. https://doi.org/10.3390/polym14040703
Ercoli R, Laskowska D, Nguyen VV, Le VS, Louda P, Łoś P, Ciemnicka J, Prałat K, Renzulli A, Paris E, et al. Mechanical and Thermal Properties of Geopolymer Foams (GFs) Doped with By-Products of the Secondary Aluminum Industry. Polymers. 2022; 14(4):703. https://doi.org/10.3390/polym14040703
Chicago/Turabian StyleErcoli, Roberto, Dorota Laskowska, Van Vu Nguyen, Van Su Le, Petr Louda, Piotr Łoś, Justyna Ciemnicka, Karol Prałat, Alberto Renzulli, Eleonora Paris, and et al. 2022. "Mechanical and Thermal Properties of Geopolymer Foams (GFs) Doped with By-Products of the Secondary Aluminum Industry" Polymers 14, no. 4: 703. https://doi.org/10.3390/polym14040703
APA StyleErcoli, R., Laskowska, D., Nguyen, V. V., Le, V. S., Louda, P., Łoś, P., Ciemnicka, J., Prałat, K., Renzulli, A., Paris, E., Basilici, M., Rapiejko, C., & Buczkowska, K. E. (2022). Mechanical and Thermal Properties of Geopolymer Foams (GFs) Doped with By-Products of the Secondary Aluminum Industry. Polymers, 14(4), 703. https://doi.org/10.3390/polym14040703