
Thermal Degradation Kinetics Analysis of Ethylene-Propylene Copolymer and EP-1-Hexene Terpolymer


Abstract
:1. Introduction
2. Experimental
2.1. Chemical Reagents
2.2. Polymerization
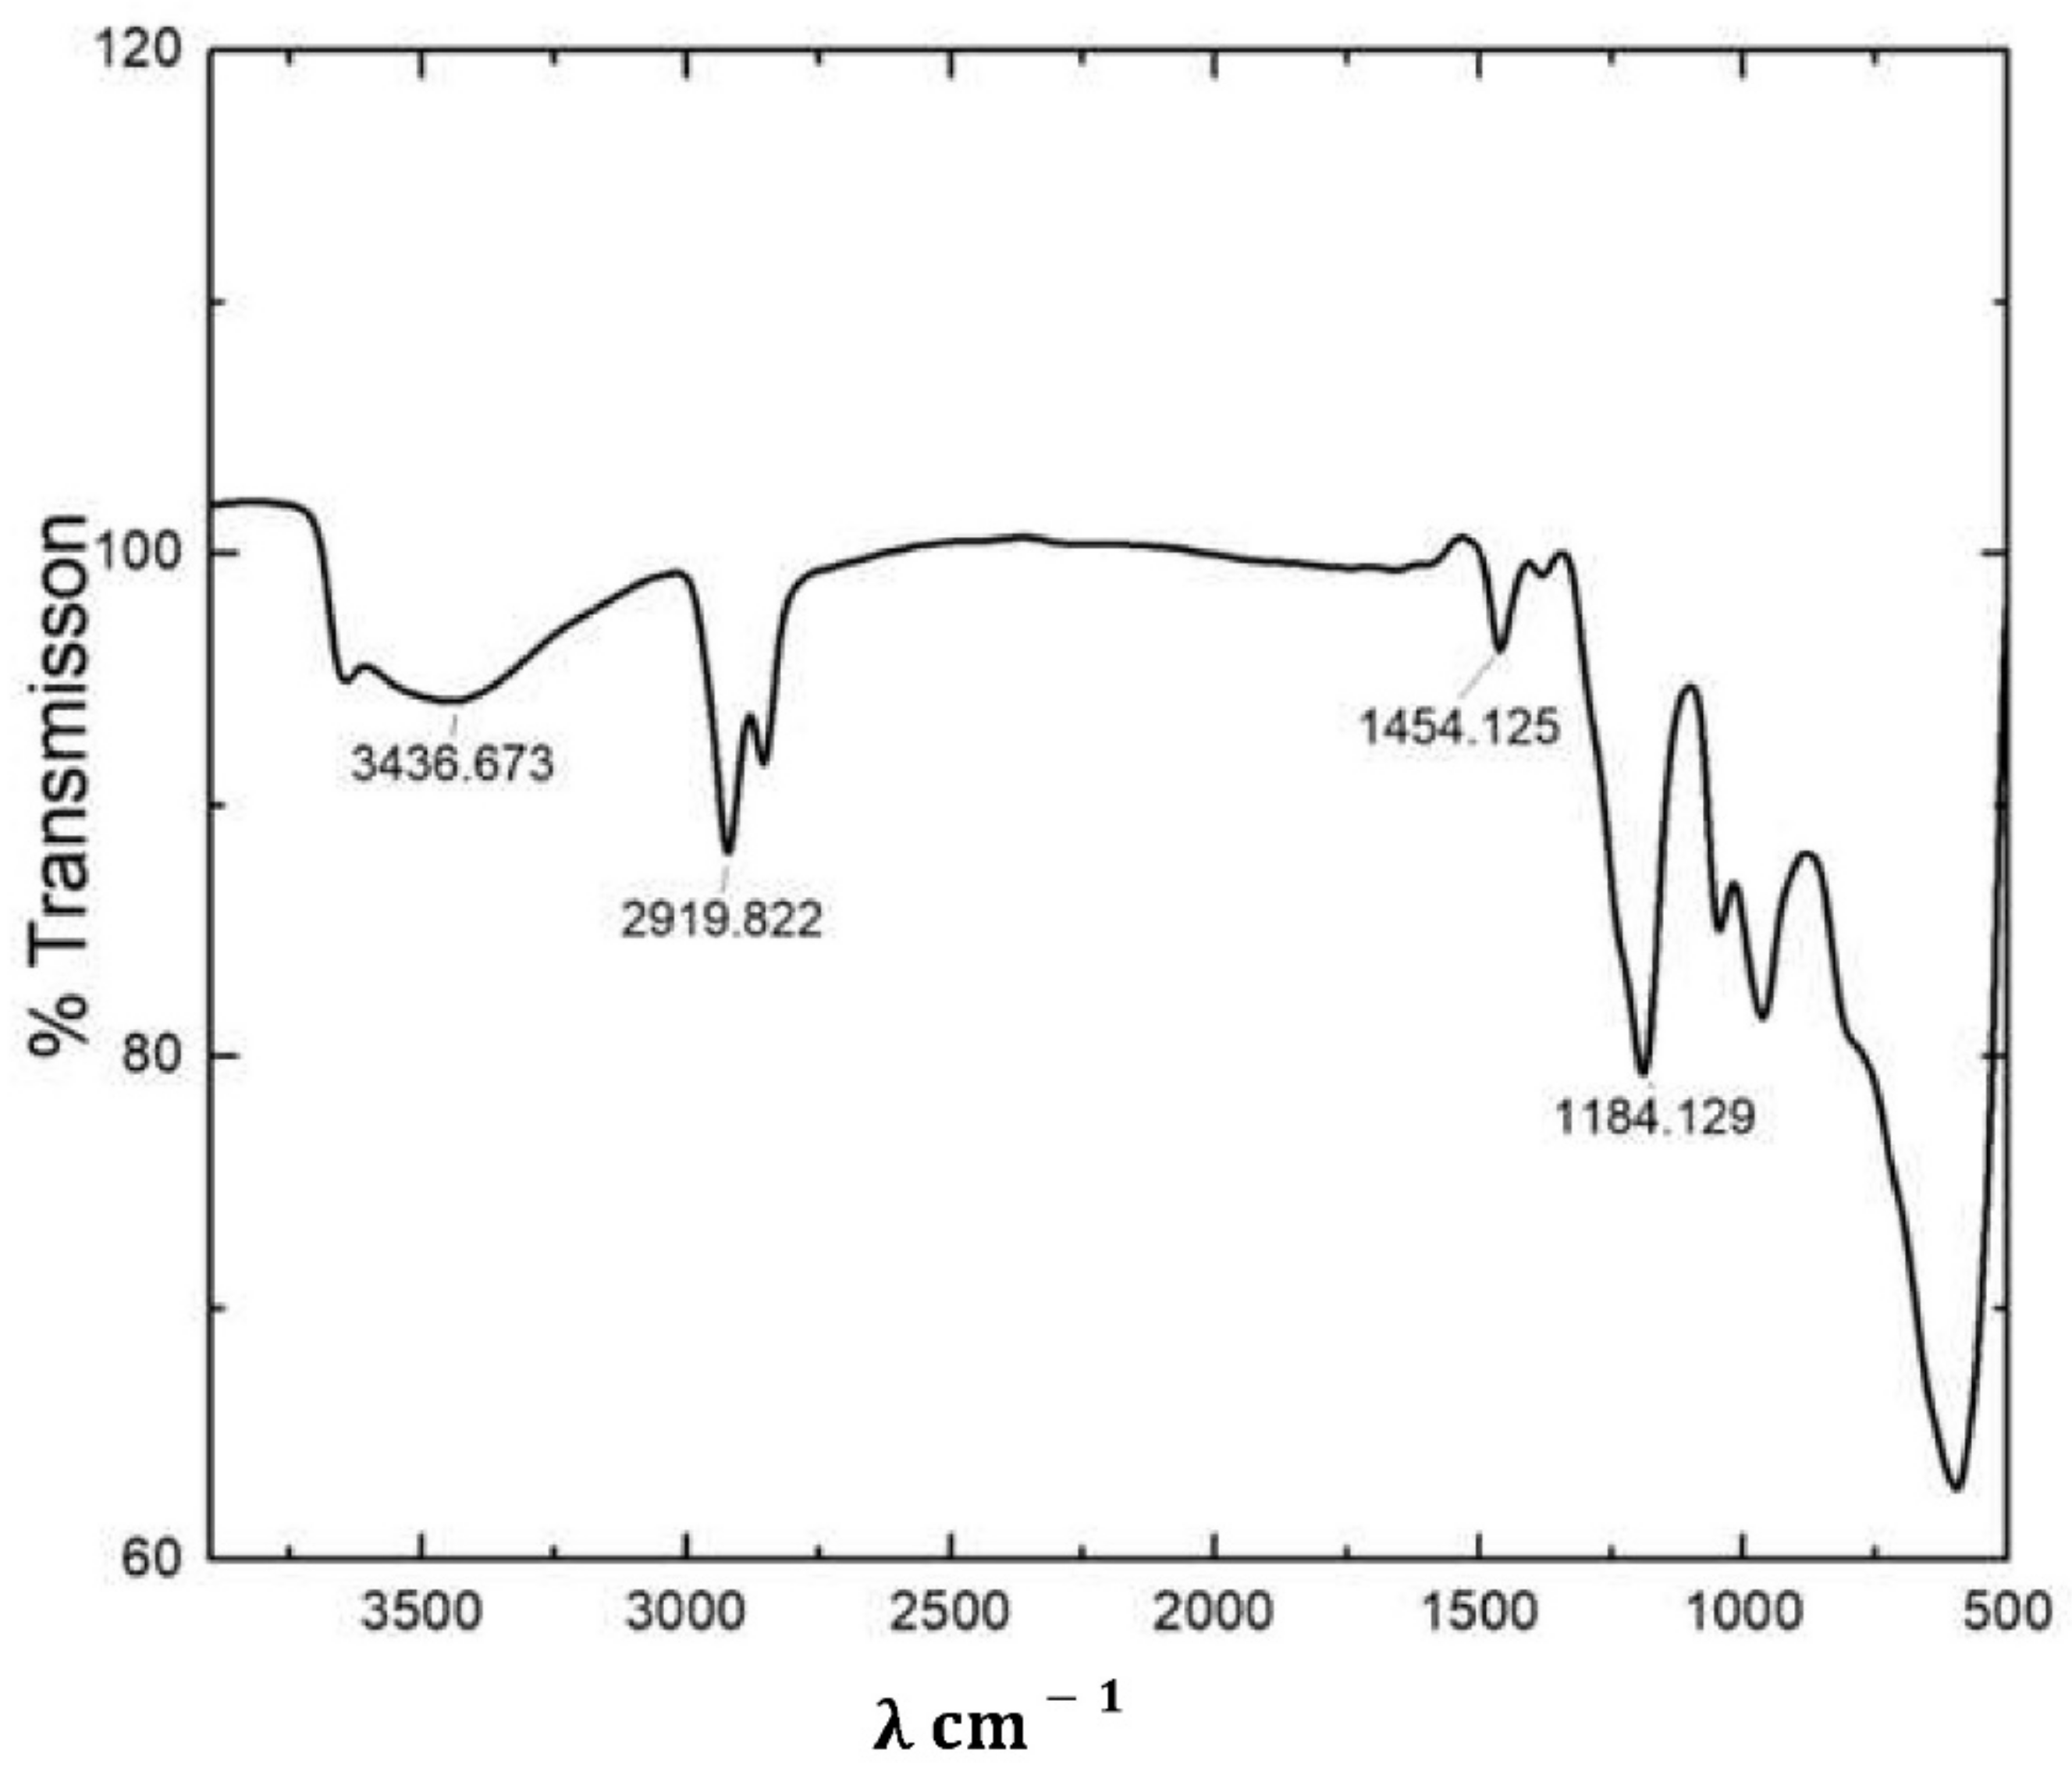
2.3. FTIR
2.4. Thermal Characterization of Polymer
3. Result and Discussion
3.1. LDH Characterization
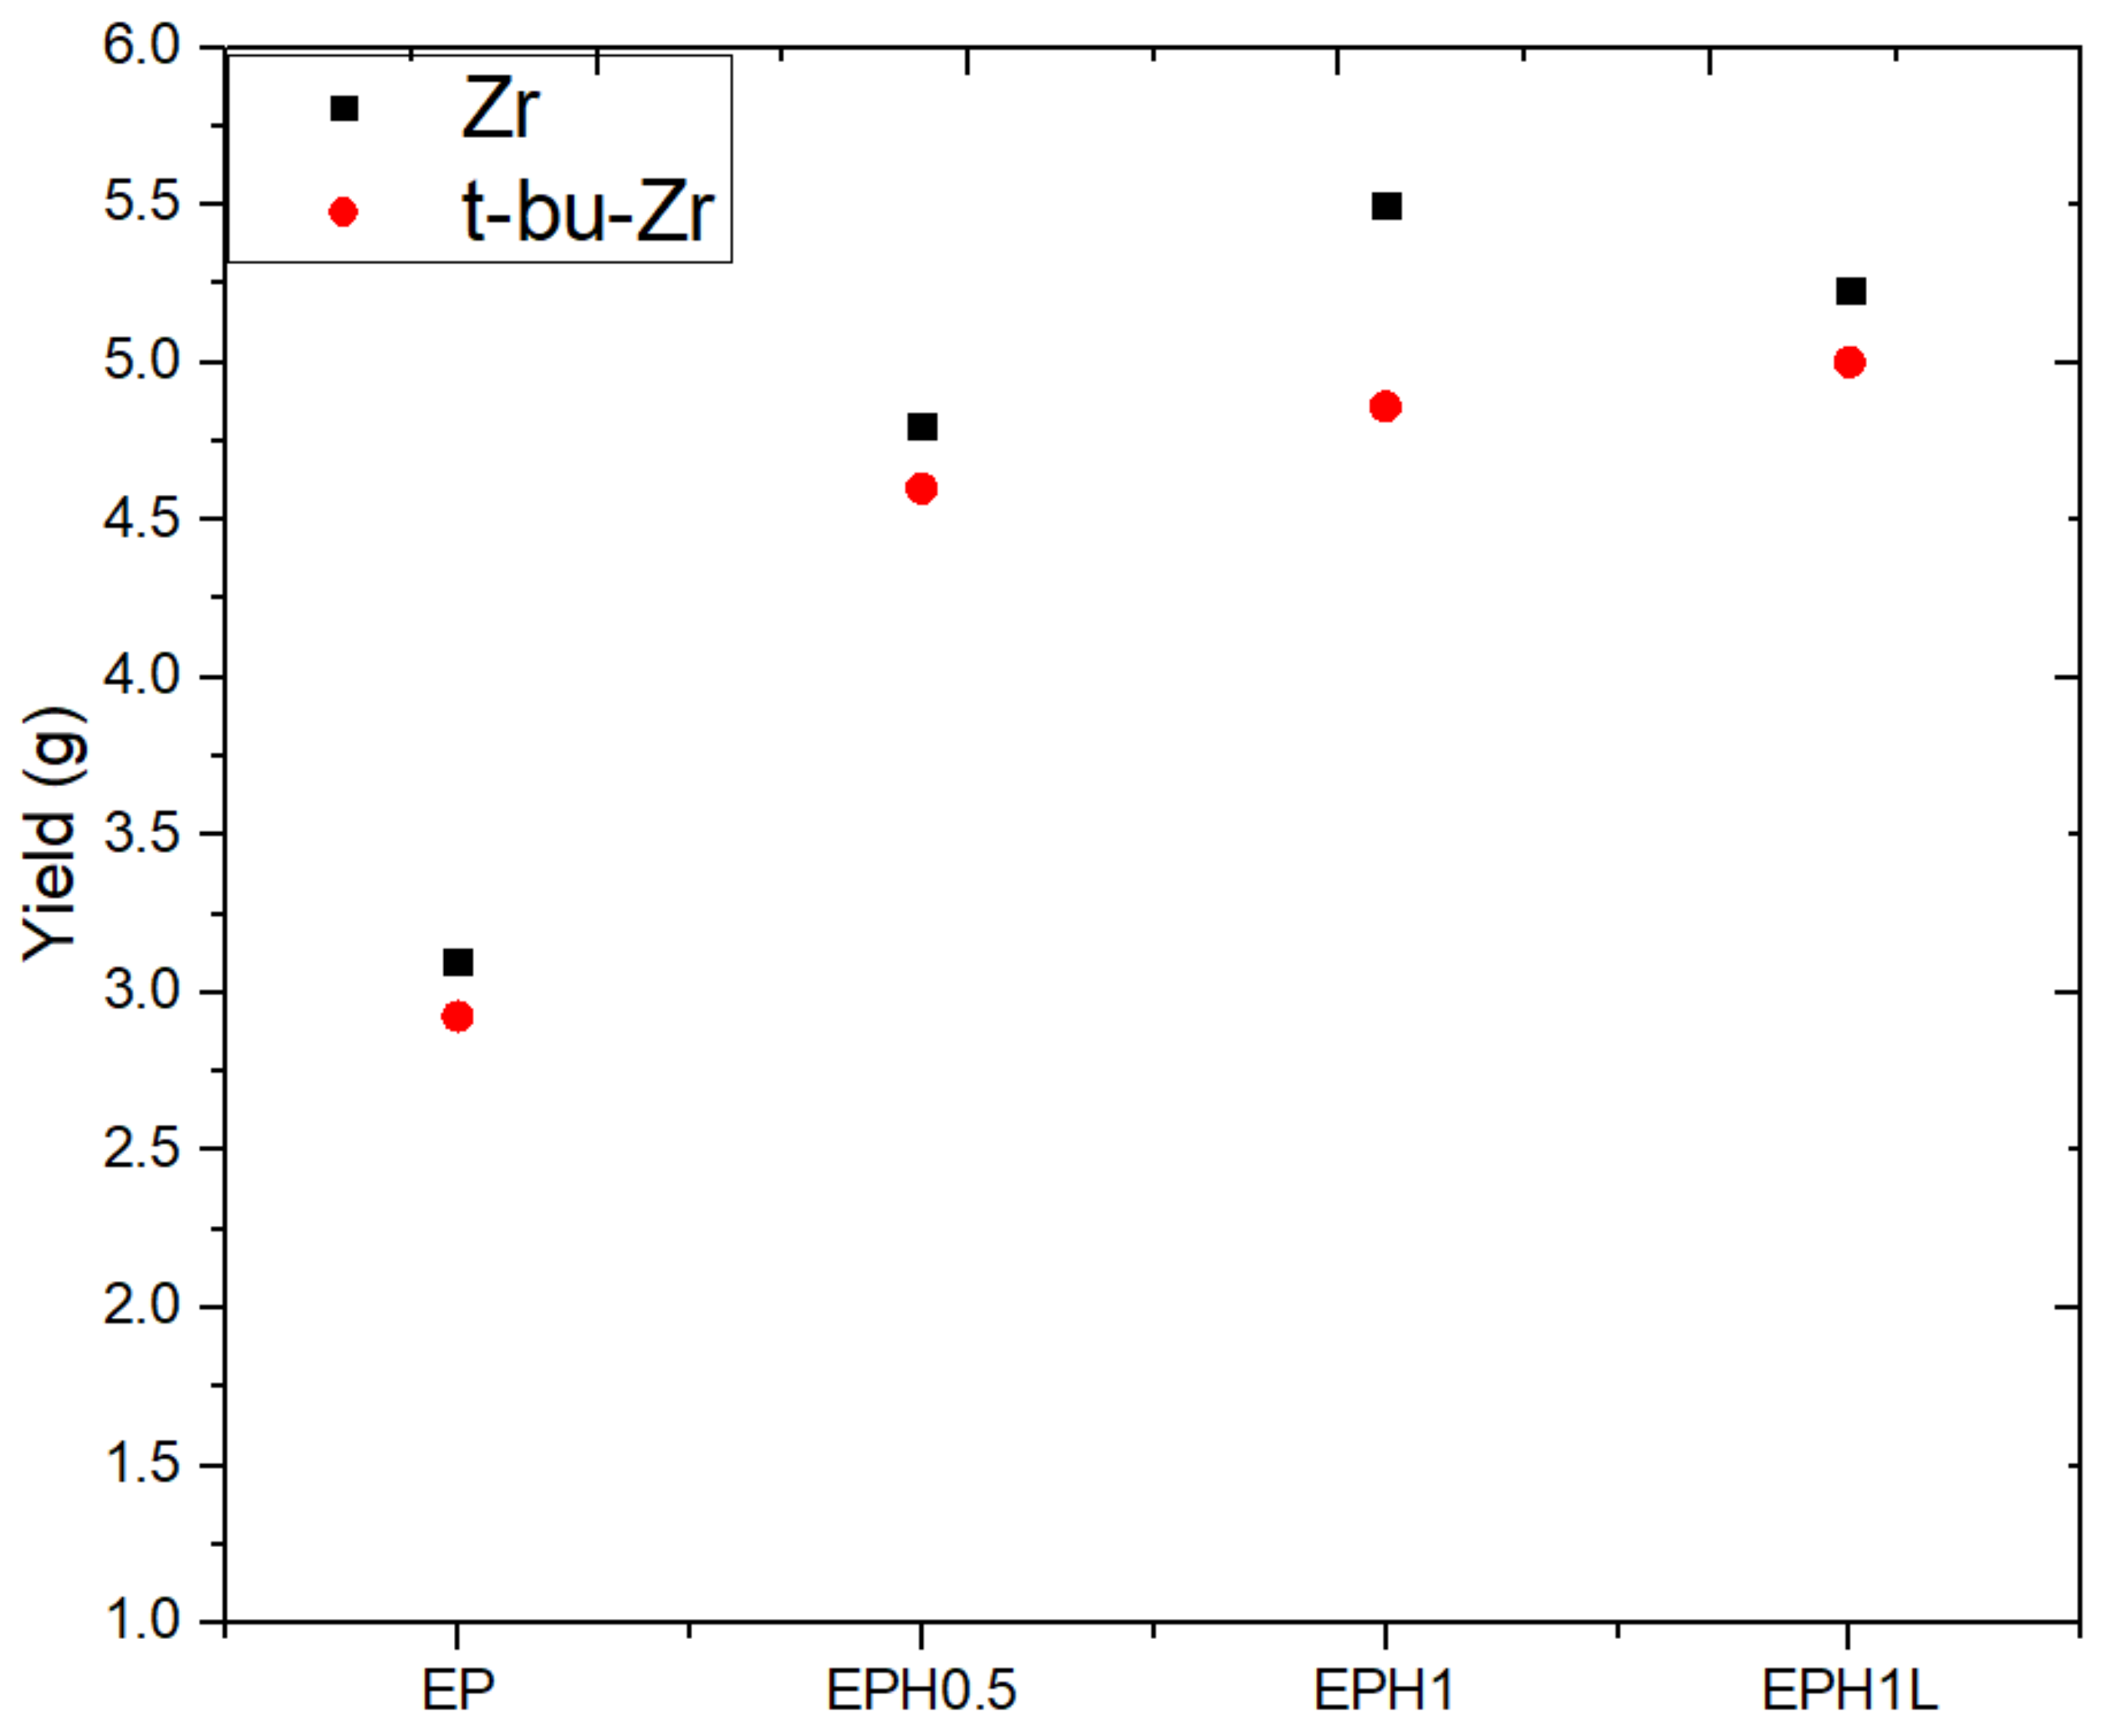
3.2. Yield
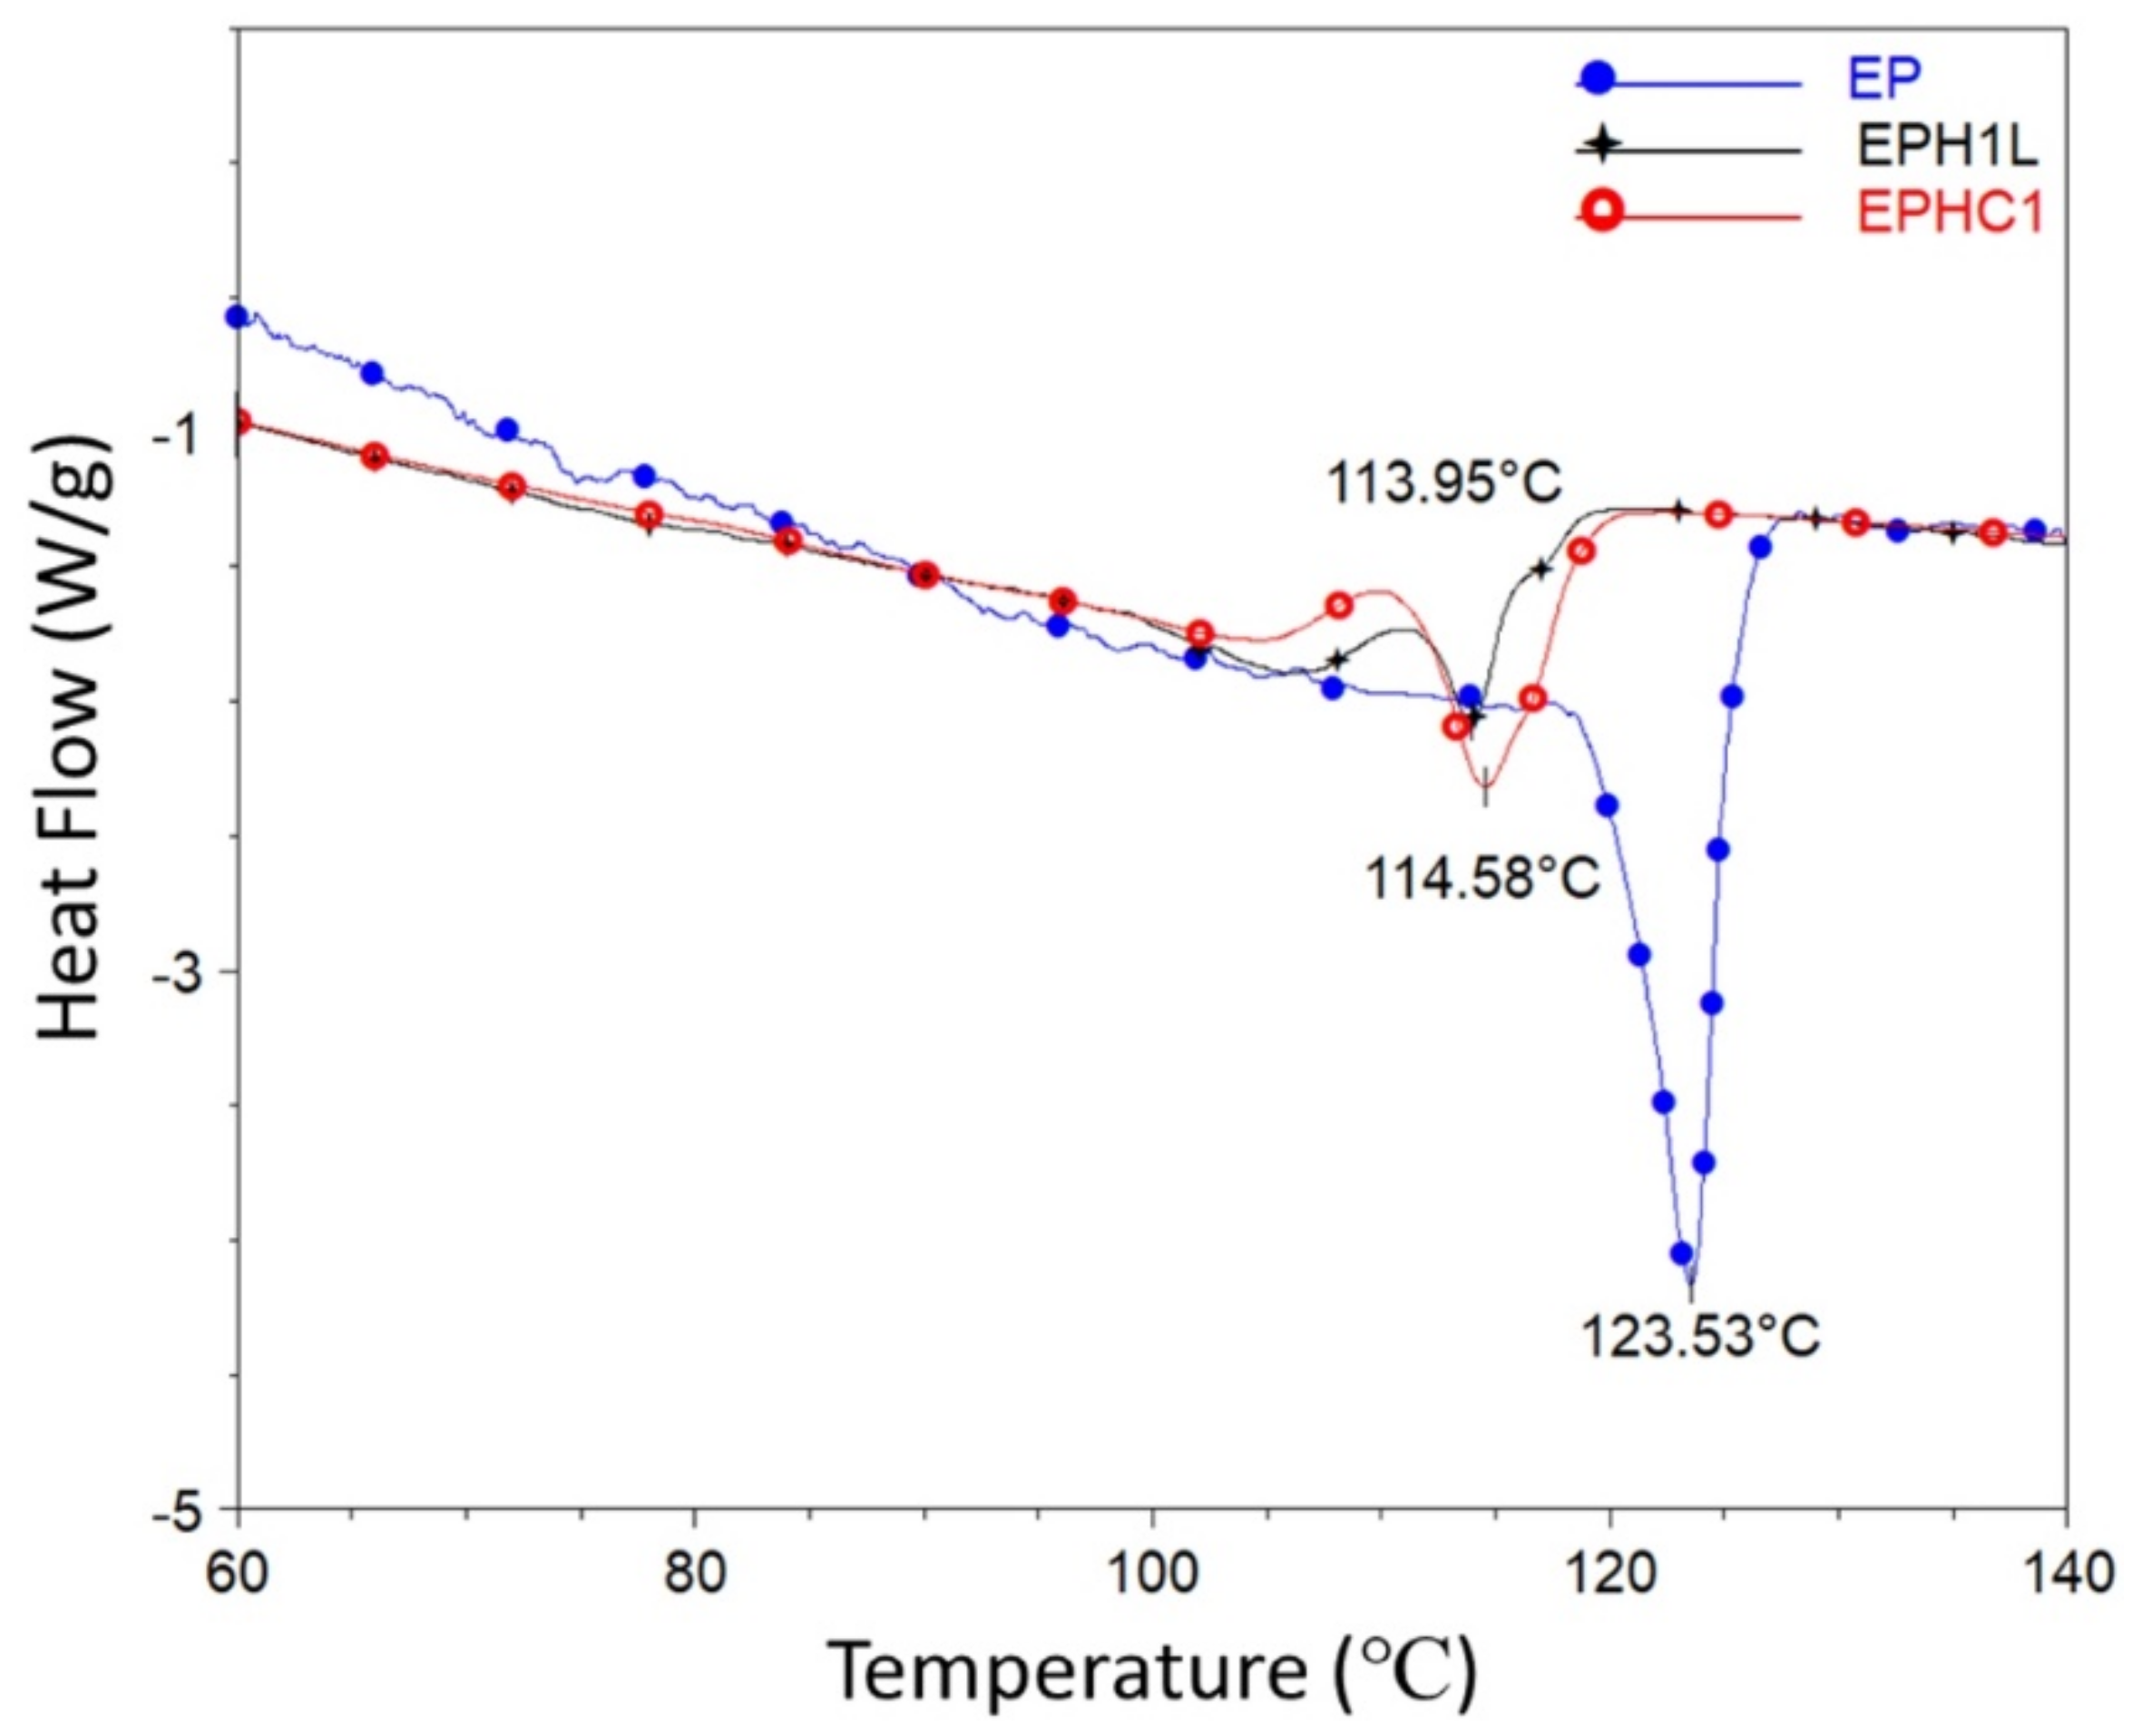
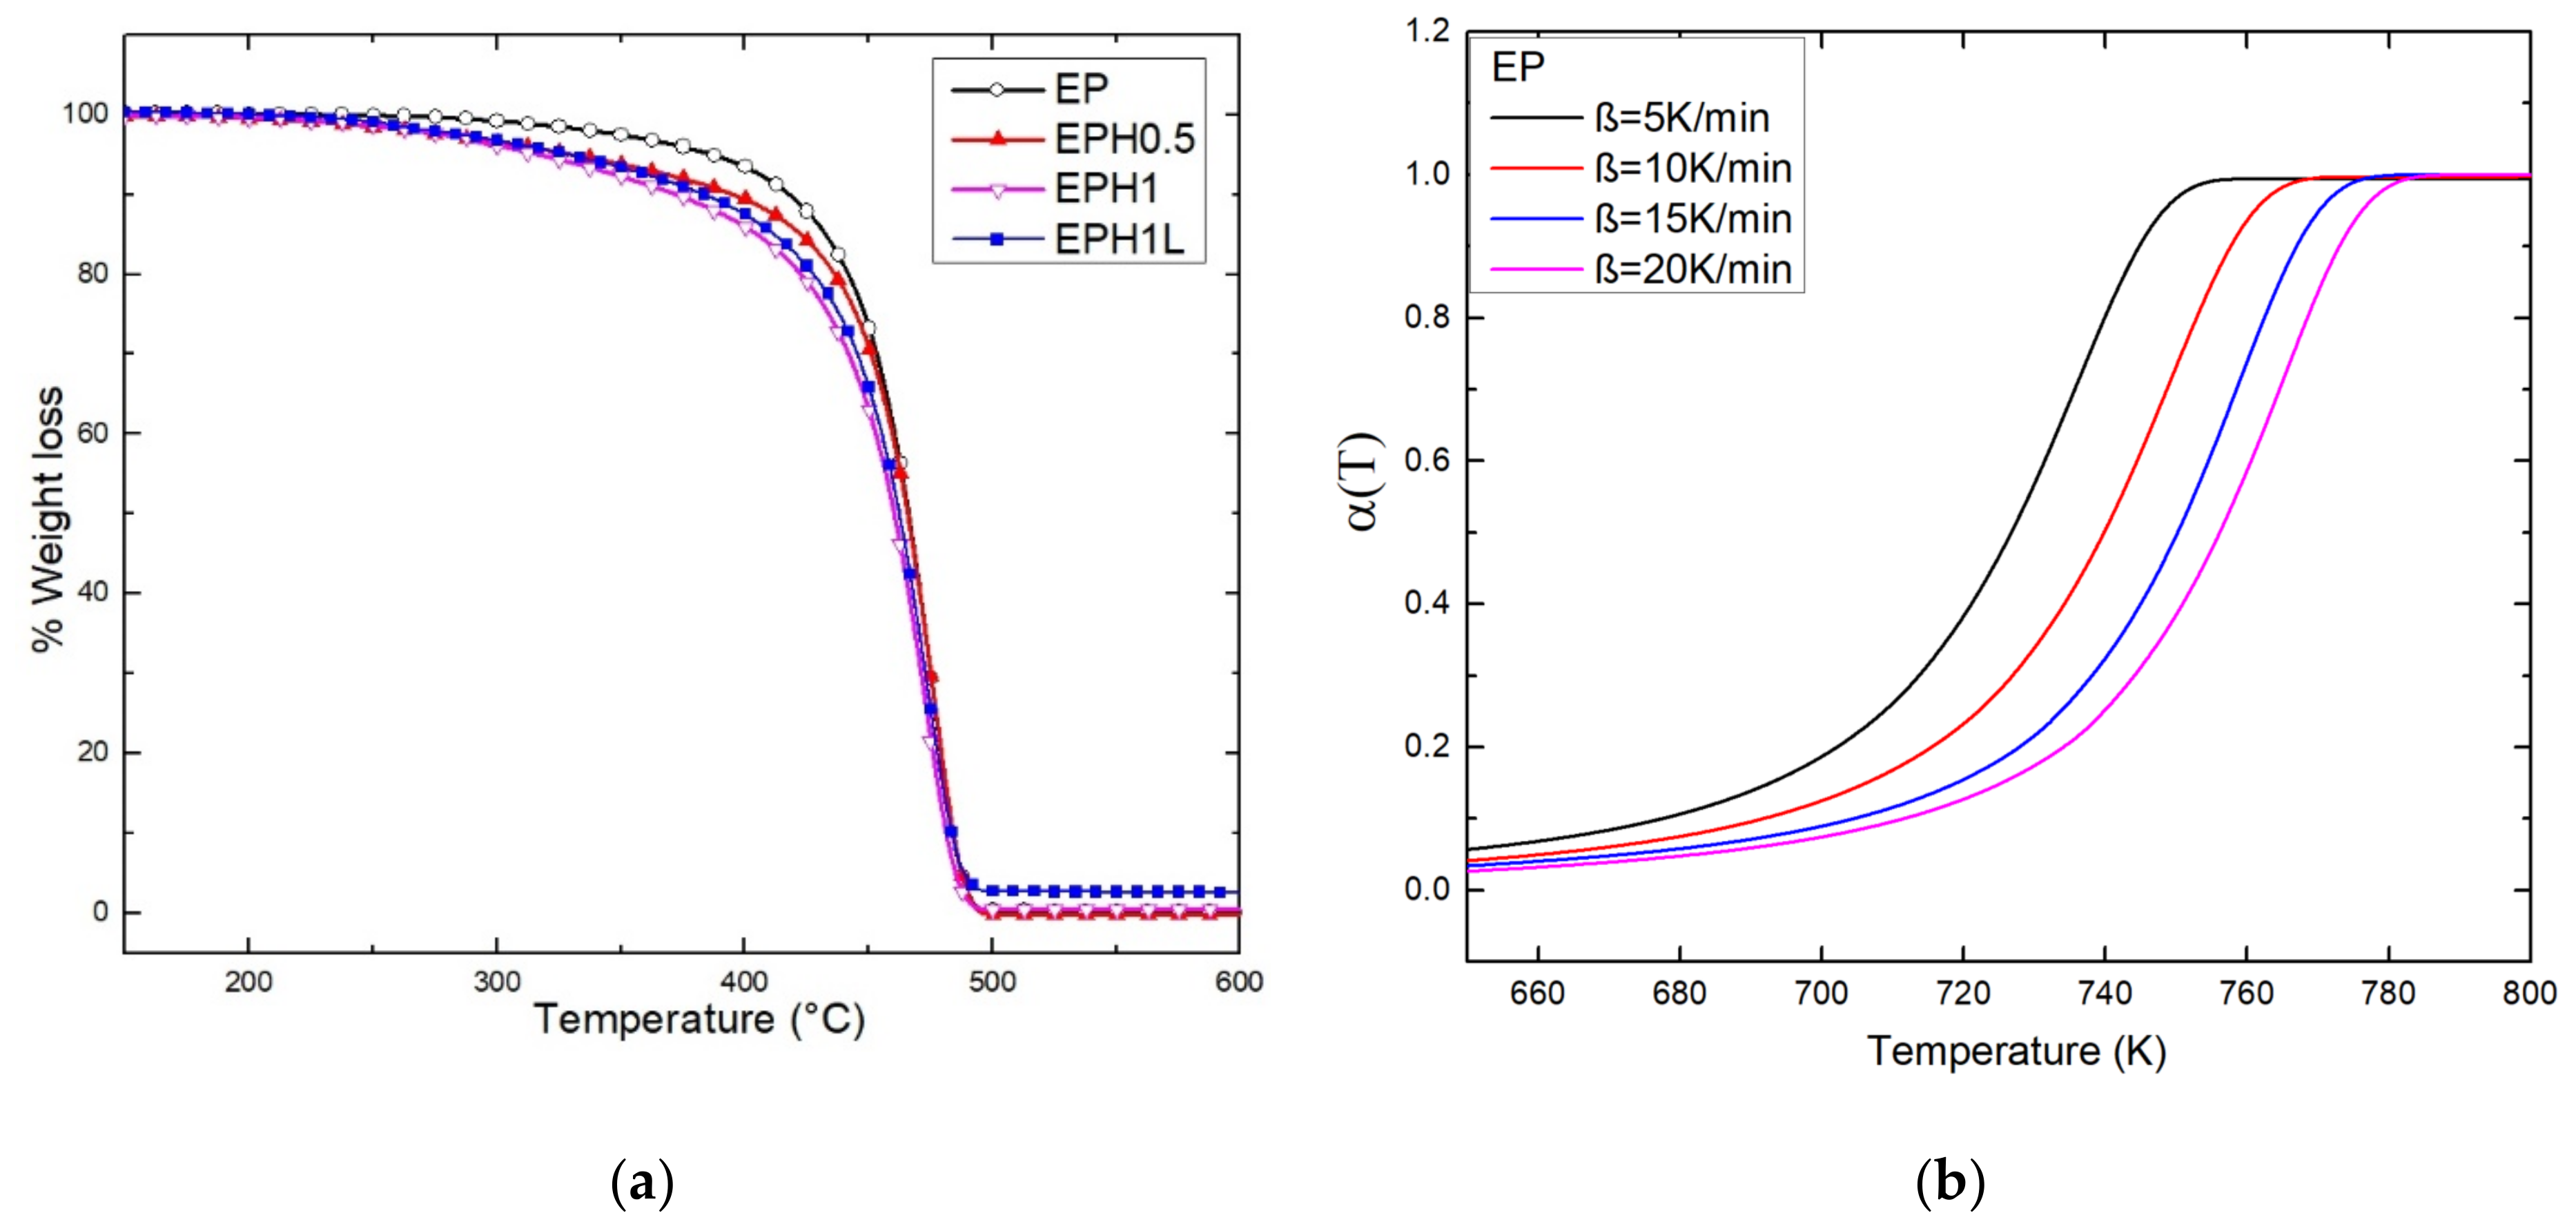
3.3. DSC and TGA Result
3.4. Kinetic Model Using Theoretical Master Plot
4. Conclusions
Supplementary Materials
Author Contributions
Funding
Institutional Review Board Statement
Informed Consent Statement
Data Availability Statement
Acknowledgments
Conflicts of Interest
References
- Daud, M.; Shehzad, F.; Al-Harthi, M.A. Crystallization behaviour and lamellar thickness distribution of metallocene-catalyzed polymer: Effect of 1-alkene comonomer and branch length. Can. J. Chem. Eng. 2017, 95, 491–499. [Google Scholar] [CrossRef]
- Galland, G.B.; dos Santos, J.H.Z.; Dall’Agnol, M.; Bisatto, R. Study of Ethylene-Propylene-1-Hexene Co- and Terpolymers Obtained with Homogeneous and Supported Metallocene Catalysts. Macromol. Symp. 2006, 245–246, 42–50. [Google Scholar] [CrossRef]
- Zubair, M.; Shehzad, F.; Al-Harthi, M.A. Impact of modified graphene and microwave irradiation on thermal stability and degradation mechanism of poly (styrene-co-methyl meth acrylate). Thermochim. Acta 2016, 633, 48–55. [Google Scholar] [CrossRef]
- Preston, C.M.L.; Amarasinghe, G.; Hopewell, J.L.; Shanks, R.A.; Mathys, Z. Evaluation of polar ethylene copolymers as fire retardant nanocomposite matrices. Polym. Degrad. Stab. 2004, 84, 533–544. [Google Scholar] [CrossRef]
- Gao, M.; Jiao, Q.; Cui, W.; Feng, C.; Zhao, Y.; Xiang, A.; Mu, X.; Ma, L. Preparation of PET/LDH composite materials and their mechanical properties and permeability for O 2. Polym. Eng. Sci. 2019, 59, E366–E371. [Google Scholar] [CrossRef]
- Usman, M.; Ali, M.; Al-Maythalony, B.A.; Ghanem, A.S.; Saadi, O.W.; Ali, M.; Jafar Mazumder, M.A.; Abdel-Azeim, S.; Habib, M.A.; Yamani, Z.H.; et al. Highly Efficient Permeation and Separation of Gases with Metal–Organic Frameworks Confined in Polymeric Nanochannels. ACS Appl. Mater. Interfaces 2020, 12, 49992–50001. [Google Scholar] [CrossRef]
- Ahmad, T.; Mansha, M.; Kazi, I.W.; Waheed, A.; Ullah, N. Synthesis of 3,5-diaminobenzoic acid containing crosslinked porous polyamine resin as a new adsorbent for efficient removal of cationic and anionic dyes from aqueous solutions. J. Water Process Eng. 2021, 43, 102304. [Google Scholar] [CrossRef]
- Mansha, M.; Kazi, I.W.; Manzar, M.S.; Ahmed, T.; Waheed, A.; Ullah, N.; Blaisi, N.I. Ultrahigh removal of methyl orange, acid blue-92 and malachite green by a novel triazine-based polyamine resin: Synthesis, isotherm and kinetic studies. Int. J. Environ. Anal. Chem. 2020, 1–19. [Google Scholar] [CrossRef]
- Mansha, M.; Waheed, A.; Ahmad, T.; Kazi, I.W.; Ullah, N. Synthesis of a novel polysuccinimide based resin for the ultrahigh removal of anionic azo dyes from aqueous solution. Environ. Res. 2020, 184, 109337. [Google Scholar] [CrossRef]
- Fischer, H. Polymer nanocomposites: From fundamental research to specific applications. Mater. Sci. Eng. C 2003, 23, 763–772. [Google Scholar] [CrossRef]
- Shehzad, F.; Thomas, S.P.; Al-Harthi, M.A. Non-isothermal crystallization kinetics of high density polyethylene/graphene nanocomposites prepared by in-situ polymerization. Thermochim. Acta 2014, 589, 226–234. [Google Scholar] [CrossRef]
- Daud, M.; Kamal, M.S.; Shehzad, F.; Al-Harthi, M.A. Graphene/layered double hydroxides nanocomposites: A review of recent progress in synthesis and applications. Carbon N. Y. 2016, 104, 241–252. [Google Scholar] [CrossRef]
- Daud, M.; Shehzad, F.; Al-Harthi, M.A. Non-isothermal crystallization kinetics of LLDPE prepared by in situ polymerization in the presence of nano titania. Polym. Bull. 2015, 72, 1233–1245. [Google Scholar] [CrossRef]
- Yang, M.; McDermott, O.; Buffet, J.C.; O’Hare, D. Synthesis and characterisation of layered double hydroxide dispersions in organic solvents. RSC Adv. 2014, 4, 51676–51682. [Google Scholar] [CrossRef]
- Alexandre, M.; Dubois, P. Polymer-layered silicate nanocomposites: Preparation, properties and uses of a new class of materials. Mater. Sci. Eng. R Reports 2000, 28, 1–63. [Google Scholar] [CrossRef]
- Bharadwaj, R.K. Modeling the barrier properties of polymer-layered silicate nanocomposites. Macromolecules 2001, 34, 9189–9192. [Google Scholar] [CrossRef]
- Gilman, J.W.; Jackson, C.L.; Morgan, A.B.; Harris, R.; Manias, E.; Giannelis, E.P.; Wuthenow, M.; Hilton, D.; Phillips, S.H. Flammability properties of polymer-Layered-silicate nanocomposites. Polypropylene and polystyrene nanocomposites. Chem. Mater. 2000, 12, 1866–1873. [Google Scholar] [CrossRef]
- Sinclair, K.B. Future trends in polyolefin materials. Macromol. Symp. 2001, 173, 237–261. [Google Scholar] [CrossRef]
- dos Ouros, A.C.; de Souza, M.O.; Pastore, H.O. Metallocene Supported on Inorganic Solid Supports: An Unfinished History. J. Braz. Chem. Soc. 2014, 25, 2164–2185. [Google Scholar] [CrossRef]
- Buffet, J.-C.; Byles, C.F.H.; Felton, R.; Chen, C.; O’Hare, D. Metallocene supported core@LDH catalysts for slurry phase ethylene polymerisation. Chem. Commun. 2016, 52, 4076–4079. [Google Scholar] [CrossRef]
- Stürzel, M.; Kempe, F.; Thomann, Y.; Mark, S.; Enders, M.; Mülhaupt, R. Novel Graphene UHMWPE Nanocomposites Prepared by Polymerization Filling Using Single-Site Catalysts Supported on Functionalized Graphene Nanosheet Dispersions. Macromolecules 2012, 45, 6878–6887. [Google Scholar] [CrossRef]
- Kaminsky, W.; Funck, A.; Klinke, C. In-situ polymerization of olefins on nanoparticles or fibers by metallocene catalysts. Top. Catal. 2008, 48, 84–90. [Google Scholar] [CrossRef]
- Chen, C.; Yang, M.; Wang, Q.; Buffet, J.C.; O’Hare, D. Synthesis and characterisation of aqueous miscible organic-layered double hydroxides. J. Mater. Chem. A 2014, 2, 15102–15110. [Google Scholar] [CrossRef]
- Gao, Y.; Wang, Q.; Wang, J.; Huang, L.; Yan, X.; Zhang, X.; He, Q.; Xing, Z.; Guo, Z. Synthesis of highly efficient flame retardant high-density polyethylene nanocomposites with inorgano-layered double hydroxides as nanofiller using solvent mixing method. ACS Appl. Mater. Interfaces 2014, 6, 5094–5104. [Google Scholar] [CrossRef]
- Gomez, N.A.G.; Wypych, F. Nanocomposites of polyethylene and ternary (Mg + Zn/Al) layered double hydroxide modified with an organic UV absorber. J. Polym. Res. 2019, 26, 203. [Google Scholar] [CrossRef]
- Hickman, G.E.; Wright, C.M.R.; Kilpatrick, A.F.R.; Turner, Z.R.; Buffet, J.C.; O’Hare, D. Synthesis, characterisation and slurry phase ethylene polymerisation of rac-(PhBBI*)ZrCl2 immobilised on modified layered double hydroxides. Mol. Catal. 2019, 468, 139–147. [Google Scholar] [CrossRef]
- Buffet, J.C.; Arnold, T.A.Q.; Turner, Z.R.; Angpanitcharoen, P.; O’Hare, D. Synthesis and characterisation of permethylindenyl zirconium complexes and their use in ethylene polymerisation. RSC Adv. 2015, 5, 87456–87464. [Google Scholar] [CrossRef]
- Wright, C.M.R.; Ruengkajorn, K.; Kilpatrick, A.F.R.; Buffet, J.C.; O’Hare, D. Controlling the Surface Hydroxyl Concentration by Thermal Treatment of Layered Double Hydroxides. Inorg. Chem. 2017, 56, 7842–7850. [Google Scholar] [CrossRef]
- Collins, R.A.; Russell, A.F.; Mountford, P. Group 4 metal complexes for homogeneous olefin polymerisation: A short tutorial review. Appl. Petrochemical Res. 2015, 5, 153–171. [Google Scholar] [CrossRef] [Green Version]
- Ma, R.; Liu, Z.; Takada, K.; Iyi, N.; Bando, Y.; Sasaki, T. Synthesis and exfoliation of Co2+-Fe3+ layered double hydroxides: An innovative topochemical approach. J. Am. Chem. Soc. 2007, 129, 5257–5263. [Google Scholar] [CrossRef]
- Buffet, J.C.; Wanna, N.; Arnold, T.A.Q.; Gibson, E.K.; Wells, P.P.; Wang, Q.; Tantirungrotechai, J.; Ohare, D. Highly tunable catalyst supports for single-site ethylene polymerization. Chem. Mater. 2015, 27, 1495–1501. [Google Scholar] [CrossRef]
- Kalali, E.N.; Montes, A.; Wang, X.; Zhang, L.; Shabestari, M.E.; Li, Z.; Wang, D.Y. Effect of phytic acid–modified layered double hydroxide on flammability and mechanical properties of intumescent flame retardant polypropylene system. Fire Mater. 2018, 42, 213–220. [Google Scholar] [CrossRef]
- Gao, Z.; Kaneko, T.; Hou, D.; Nakada, M. Kinetics of thermal degradation of poly(methyl methacrylate) studied with the assistance of the fractional conversion at the maximum reaction rate. Polym. Degrad. Stab. 2004, 84, 399–403. [Google Scholar] [CrossRef]
- Sánchez-Jiménez, P.E.; Pérez-Maqueda, L.A.; Perejón, A.; Criado, J.M. Generalized kinetic master plots for the thermal degradation of polymers following a random scission mechanism. J. Phys. Chem. A 2010, 114, 7868–7876. [Google Scholar] [CrossRef] [Green Version]
- Mamleev, V.; Bourbigot, S.; Le Bras, M.; Yvon, J.; Lefebvre, J. Model-free method for evaluation of activation energies in modulated thermogravimetry and analysis of cellulose decomposition. Chem. Eng. Sci. 2006, 61, 1276–1292. [Google Scholar] [CrossRef]
- Mazhar, H.; Shehzad, F.; Hong, S.G.; Al-harthi, M.A. Degradation kinetics and thermomechanical properties of in-situ polymerized layered double hydroxides-ethylene-propylene copolymer. J. Appl. Polym. Sci. 2021, 52002. [Google Scholar] [CrossRef]
- Shehzad, F.; Al-Harthi, M.A. Graphite-LDH hybrid supported zirconocene for ethylene polymerization: Influence of the support on the crystallization kinetics and thermal stability of polyethylene. Appl. Clay Sci. 2021, 202, 105947. [Google Scholar] [CrossRef]
- Afzal, H.M.; Shehzad, F.; Zubair, M.; Bakather, O.Y.; Al-Harthi, M.A. Influence of microwave irradiation on thermal properties of PVA and PVA/graphene nanocomposites. J. Therm. Anal. Calorim. 2020, 139, 353–365. [Google Scholar] [CrossRef]
- Sánchez-Jiménez, P.E.; Pérez-Maqueda, L.A.; Perejón, A.; Criado, J.M. Combined kinetic analysis of thermal degradation of polymeric materials under any thermal pathway. Polym. Degrad. Stab. 2009, 94, 2079–2085. [Google Scholar] [CrossRef] [Green Version]
- Li, C.; Dou, Q.; Bai, Z.; Lu, Q. Non-isothermal crystallization behaviors and spherulitic morphology of poly(lactic acid) nucleated by a novel nucleating agent. J. Therm. Anal. Calorim. 2015, 122, 407–417. [Google Scholar] [CrossRef]
- Bartocci, P.; Tschentscher, R.; Stensrød, R.E.; Barbanera, M.; Fantozzi, F. Kinetic Analysis of Digestate Slow Pyrolysis with the Application of the Master-Plots Method and Independent Parallel Reactions Scheme. Molecules 2019, 24, 1657. [Google Scholar] [CrossRef] [Green Version]
- Vyazovkin, S. Model-free kinetics: Staying free of multiplying entities without necessity. J. Therm. Anal. Calorim. 2006, 83, 45–51. [Google Scholar] [CrossRef]
- Vyazovkin, S.; Chrissafis, K.; Di Lorenzo, M.L.; Koga, N.; Pijolat, M.; Roduit, B.; Sbirrazzuoli, N.; Suñol, J.J. ICTAC Kinetics Committee recommendations for collecting experimental thermal analysis data for kinetic computations. Thermochim. Acta 2014, 590, 1–23. [Google Scholar] [CrossRef]
- Friedman, H.L. Kinetics of thermal degradation of char-forming plastics from thermogravimetry. Application to a phenolic plastic. J. Polym. Sci. Part C Polym. Symp. 2007, 6, 183–195. [Google Scholar] [CrossRef]
- Sánchez-Jiménez, P.E.; Pérez-Maqueda, L.A.; Perejón, A.; Criado, J.M. Generalized master plots as a straightforward approach for determining the kinetic model: The case of cellulose pyrolysis. Thermochim. Acta 2013, 552, 54–59. [Google Scholar] [CrossRef] [Green Version]
- Starink, M.J. The determination of activation energy from linear heating rate experiments: A comparison of the accuracy of isoconversion methods. Thermochim. Acta 2003, 404, 163–176. [Google Scholar] [CrossRef] [Green Version]
- Wang, L.; Su, S.; Chen, D.; Wilkie, C.A. Variation of anions in layered double hydroxides: Effects on dispersion and fire properties. Polym. Degrad. Stab. 2009, 94, 770–781. [Google Scholar] [CrossRef] [Green Version]
- García-Peñas, A.; Gómez-Elvira, J.M.; Blázquez-Blázquez, E.; Barranco-García, R.; Pérez, E.; Cerrada, M.L. Microstructural details and polymorphs in poly(propylene-co-1-nonene) copolymers synthesized at different polymerization temperatures. Polym. Cryst. 2021, 4, e10150. [Google Scholar] [CrossRef]
- García-Peñas, A.; Gõmez-Elvira, J.M.; Pérez, E.; Cerrada, M.L. Microstructure of metallocene isotactic propylene-co-1-pentene-co-1-hexene terpolymers. J. Polym. Sci. Part A Polym. Chem. 2014, 52, 2537–2547. [Google Scholar] [CrossRef] [Green Version]
- Da Silva, M.A.; Galland, G.B. Synthesis and characterization of ethylene-propylene-1-pentene terpolymers. J. Polym. Sci. Part A Polym. Chem. 2008, 46, 947–957. [Google Scholar] [CrossRef]
- Gao, Y.; Zhang, Y.; Williams, G.R.; O’Hare, D.; Wang, Q. Layered double hydroxide-oxidized carbon nanotube hybrids as highly efficient flame retardant nanofillers for polypropylene. Sci. Rep. 2016, 6, 35502. [Google Scholar] [CrossRef]
- Liu, Y.; Gao, Y.; Wang, Q.; Lin, W. The synergistic effect of layered double hydroxides with other flame retardant additives for polymer nanocomposites: A critical review. Dalton Trans. 2018, 47, 14827–14840. [Google Scholar] [CrossRef]
- Peterson, J.D.; Vyazovkin, S.; Wight, C.A. Kinetics of the Thermal and Thermo-Oxidative Degradation of Polystyrene, Polyethylene and Poly(propylene). Macromol. Chem. Phys. 2001, 202, 775–784. [Google Scholar] [CrossRef]
- Das, P.; Tiwari, P. Thermal degradation kinetics of plastics and model selection. Thermochim. Acta 2017, 654, 191–202. [Google Scholar] [CrossRef]
- Aboulkas, A.; El harfi, K.; El Bouadili, A. Thermal degradation behaviors of polyethylene and polypropylene. Part I: Pyrolysis kinetics and mechanisms. Energy Convers. Manag. 2010, 51, 1363–1369. [Google Scholar] [CrossRef]

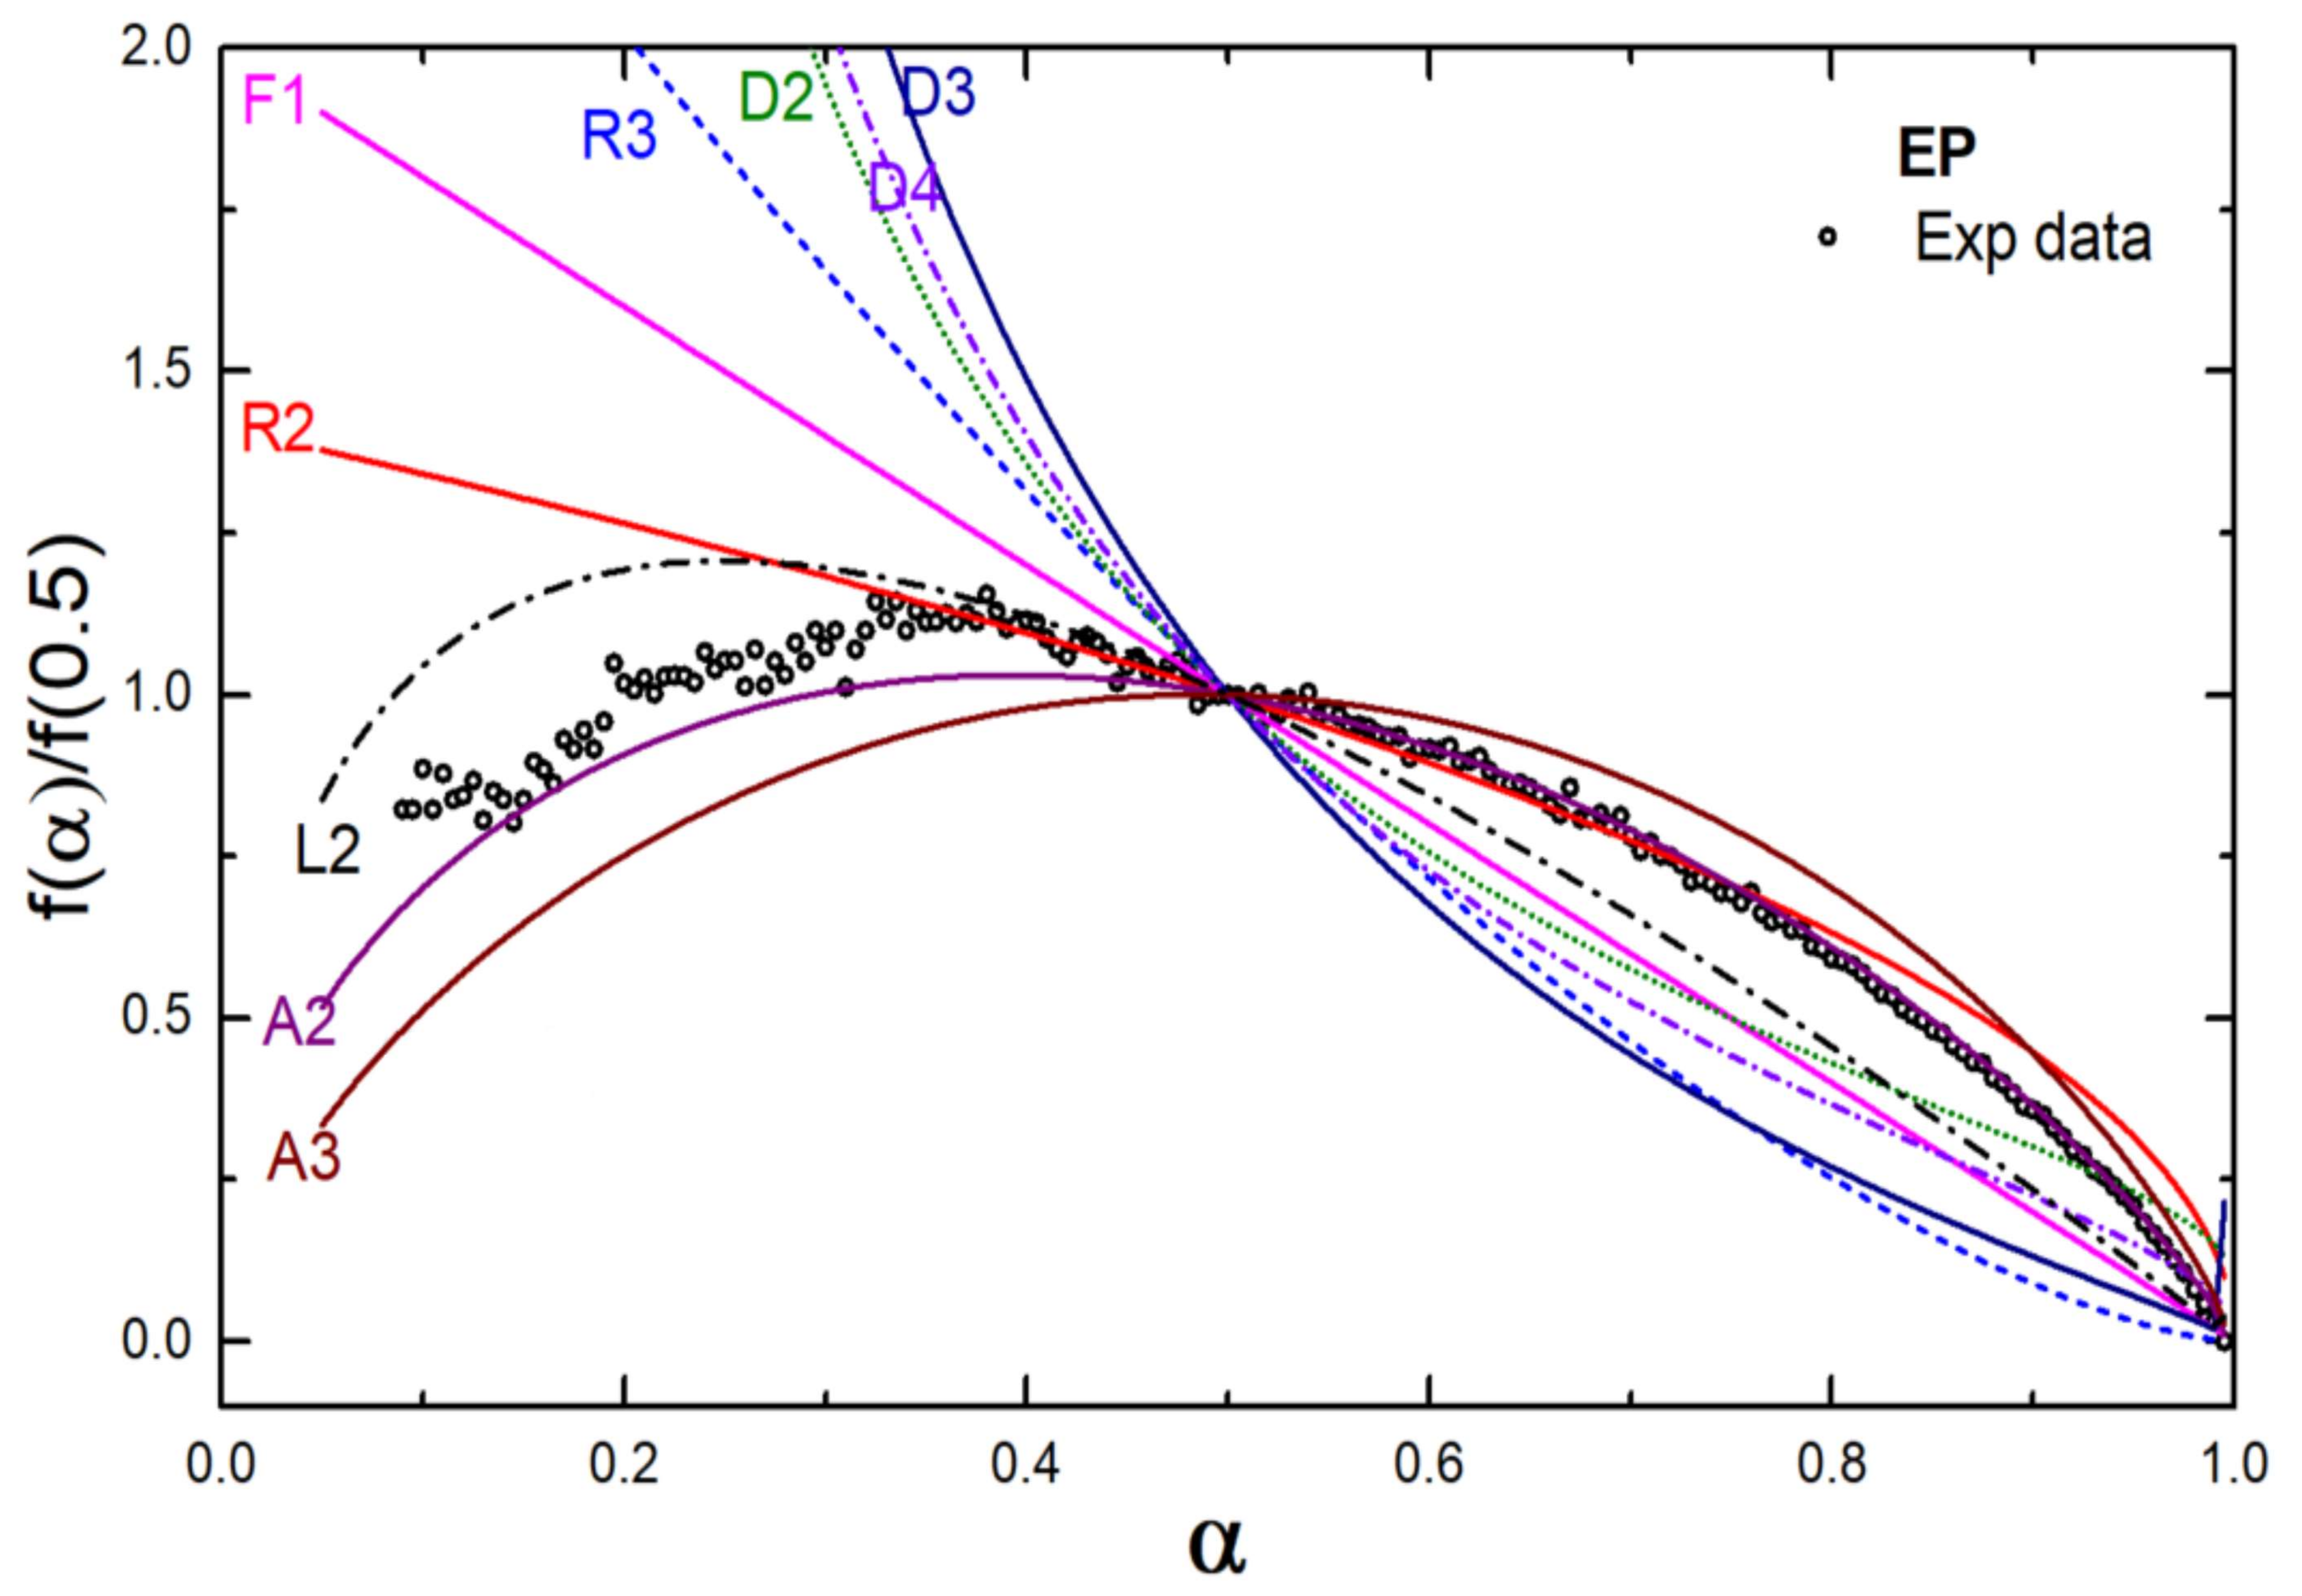
| Mechanism | Symbol | f(α) |
|---|---|---|
| phase boundary-controlled reaction (contracting area) | R2 | |
| phase boundary-controlled reaction (contracting volume) | R3 | |
| random nucleation followed by an instantaneous growth of nuclei (Avrami-Erofeev equation, n = 1) | F1 | |
| random nucleation and growth of nuclei through different nucleation and nucleus growth models (Avrami-Erofeev equation, n ≠1) | An | |
| two-dimensional diffusion | D2 | |
| three-dimensional diffusion (Jander equation) | D3 | |
| three-dimensional diffusion (Ginstling-Brounshtein equation) 3 | D4 | |
| random scission, L = 2 | L2 | |
| random scission, L >2 | Ln | no symbolic solution |
| Catalyst Name | Zirconocene | ||||
|---|---|---|---|---|---|
| Sample Name | Composition | Tm (°C) | Crystallinity * | T0.9 (°C) | Ea # (kJ/mol) |
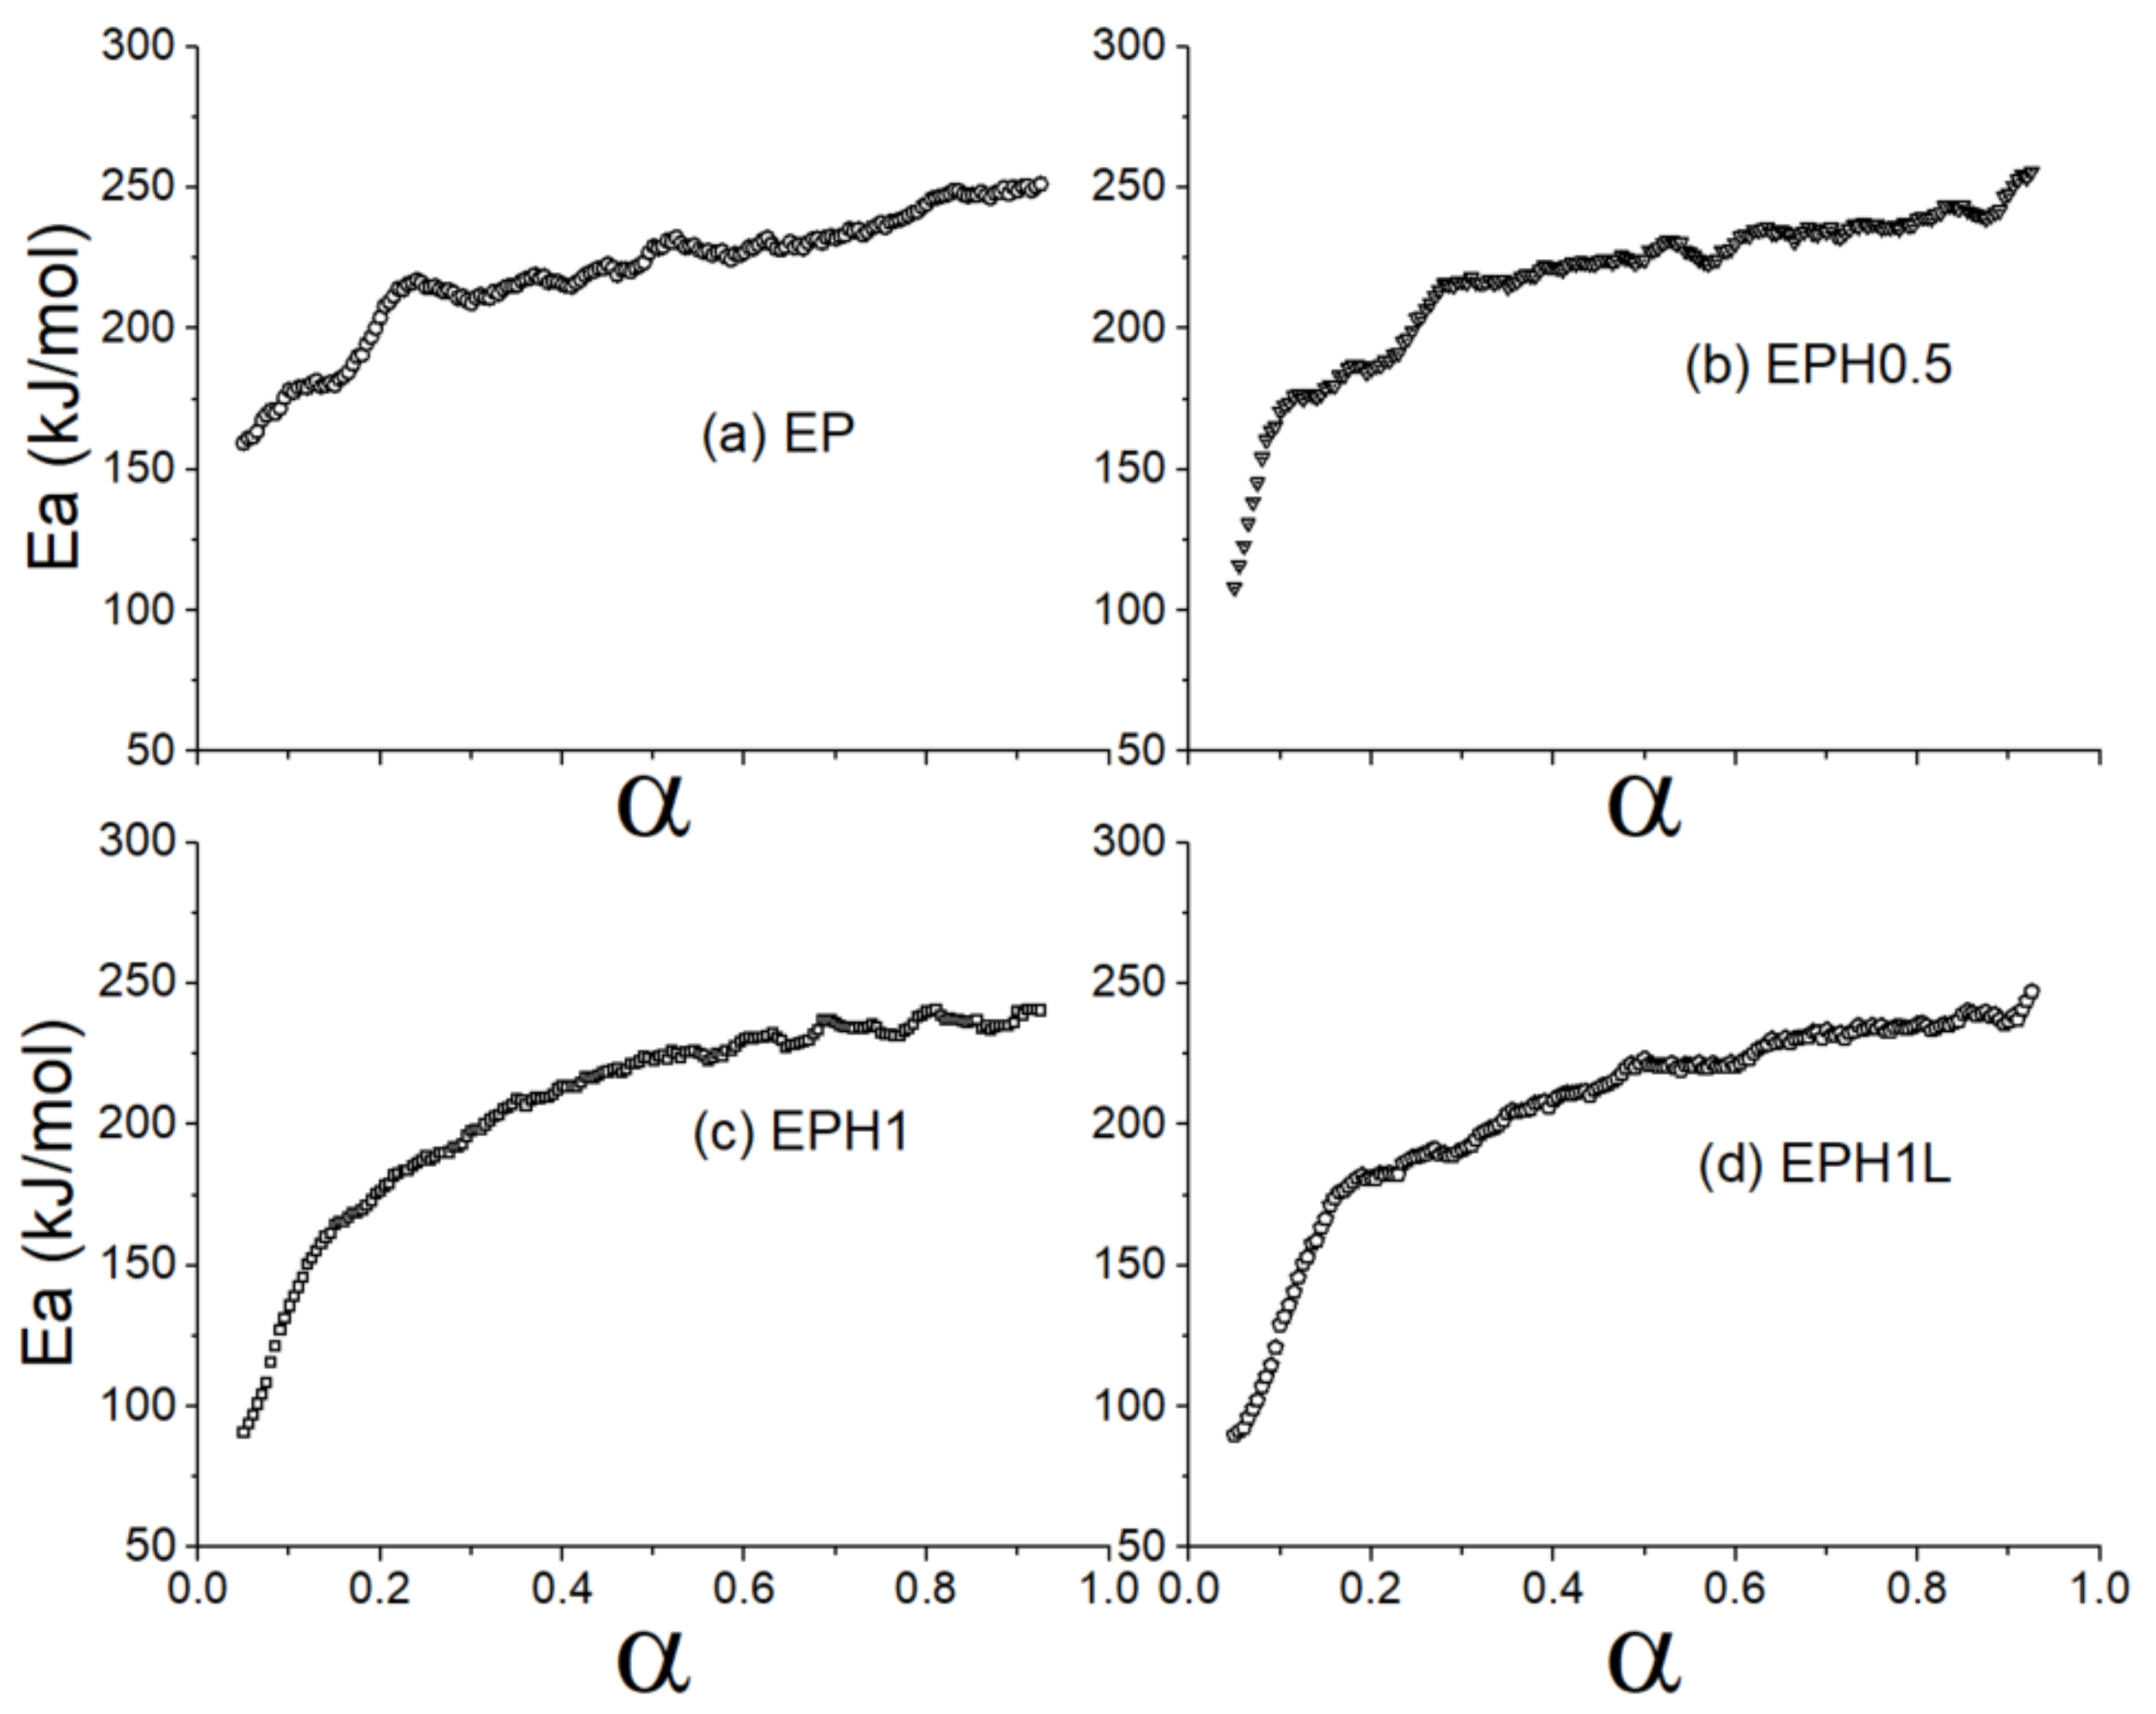
| EP | Neat EP | 123.5 | 58.7 | 430 ± 2 | 244 |
| EPH0.5 | EP + 0.5 mL 1hexene | 113.3 | 46 | 395 | 217 |
| EPH1 | EP + 1 mL 1hexene | 114.6 | 26.8 | 372 | 207 |
| EPH1L | EP + 1 mL 1hexene + LDH | 114 | 29 | 383.5 | 207 |
| Sample | Kinetic Model | α-Range | Ea [kJ/mol] | R2 |
|---|---|---|---|---|
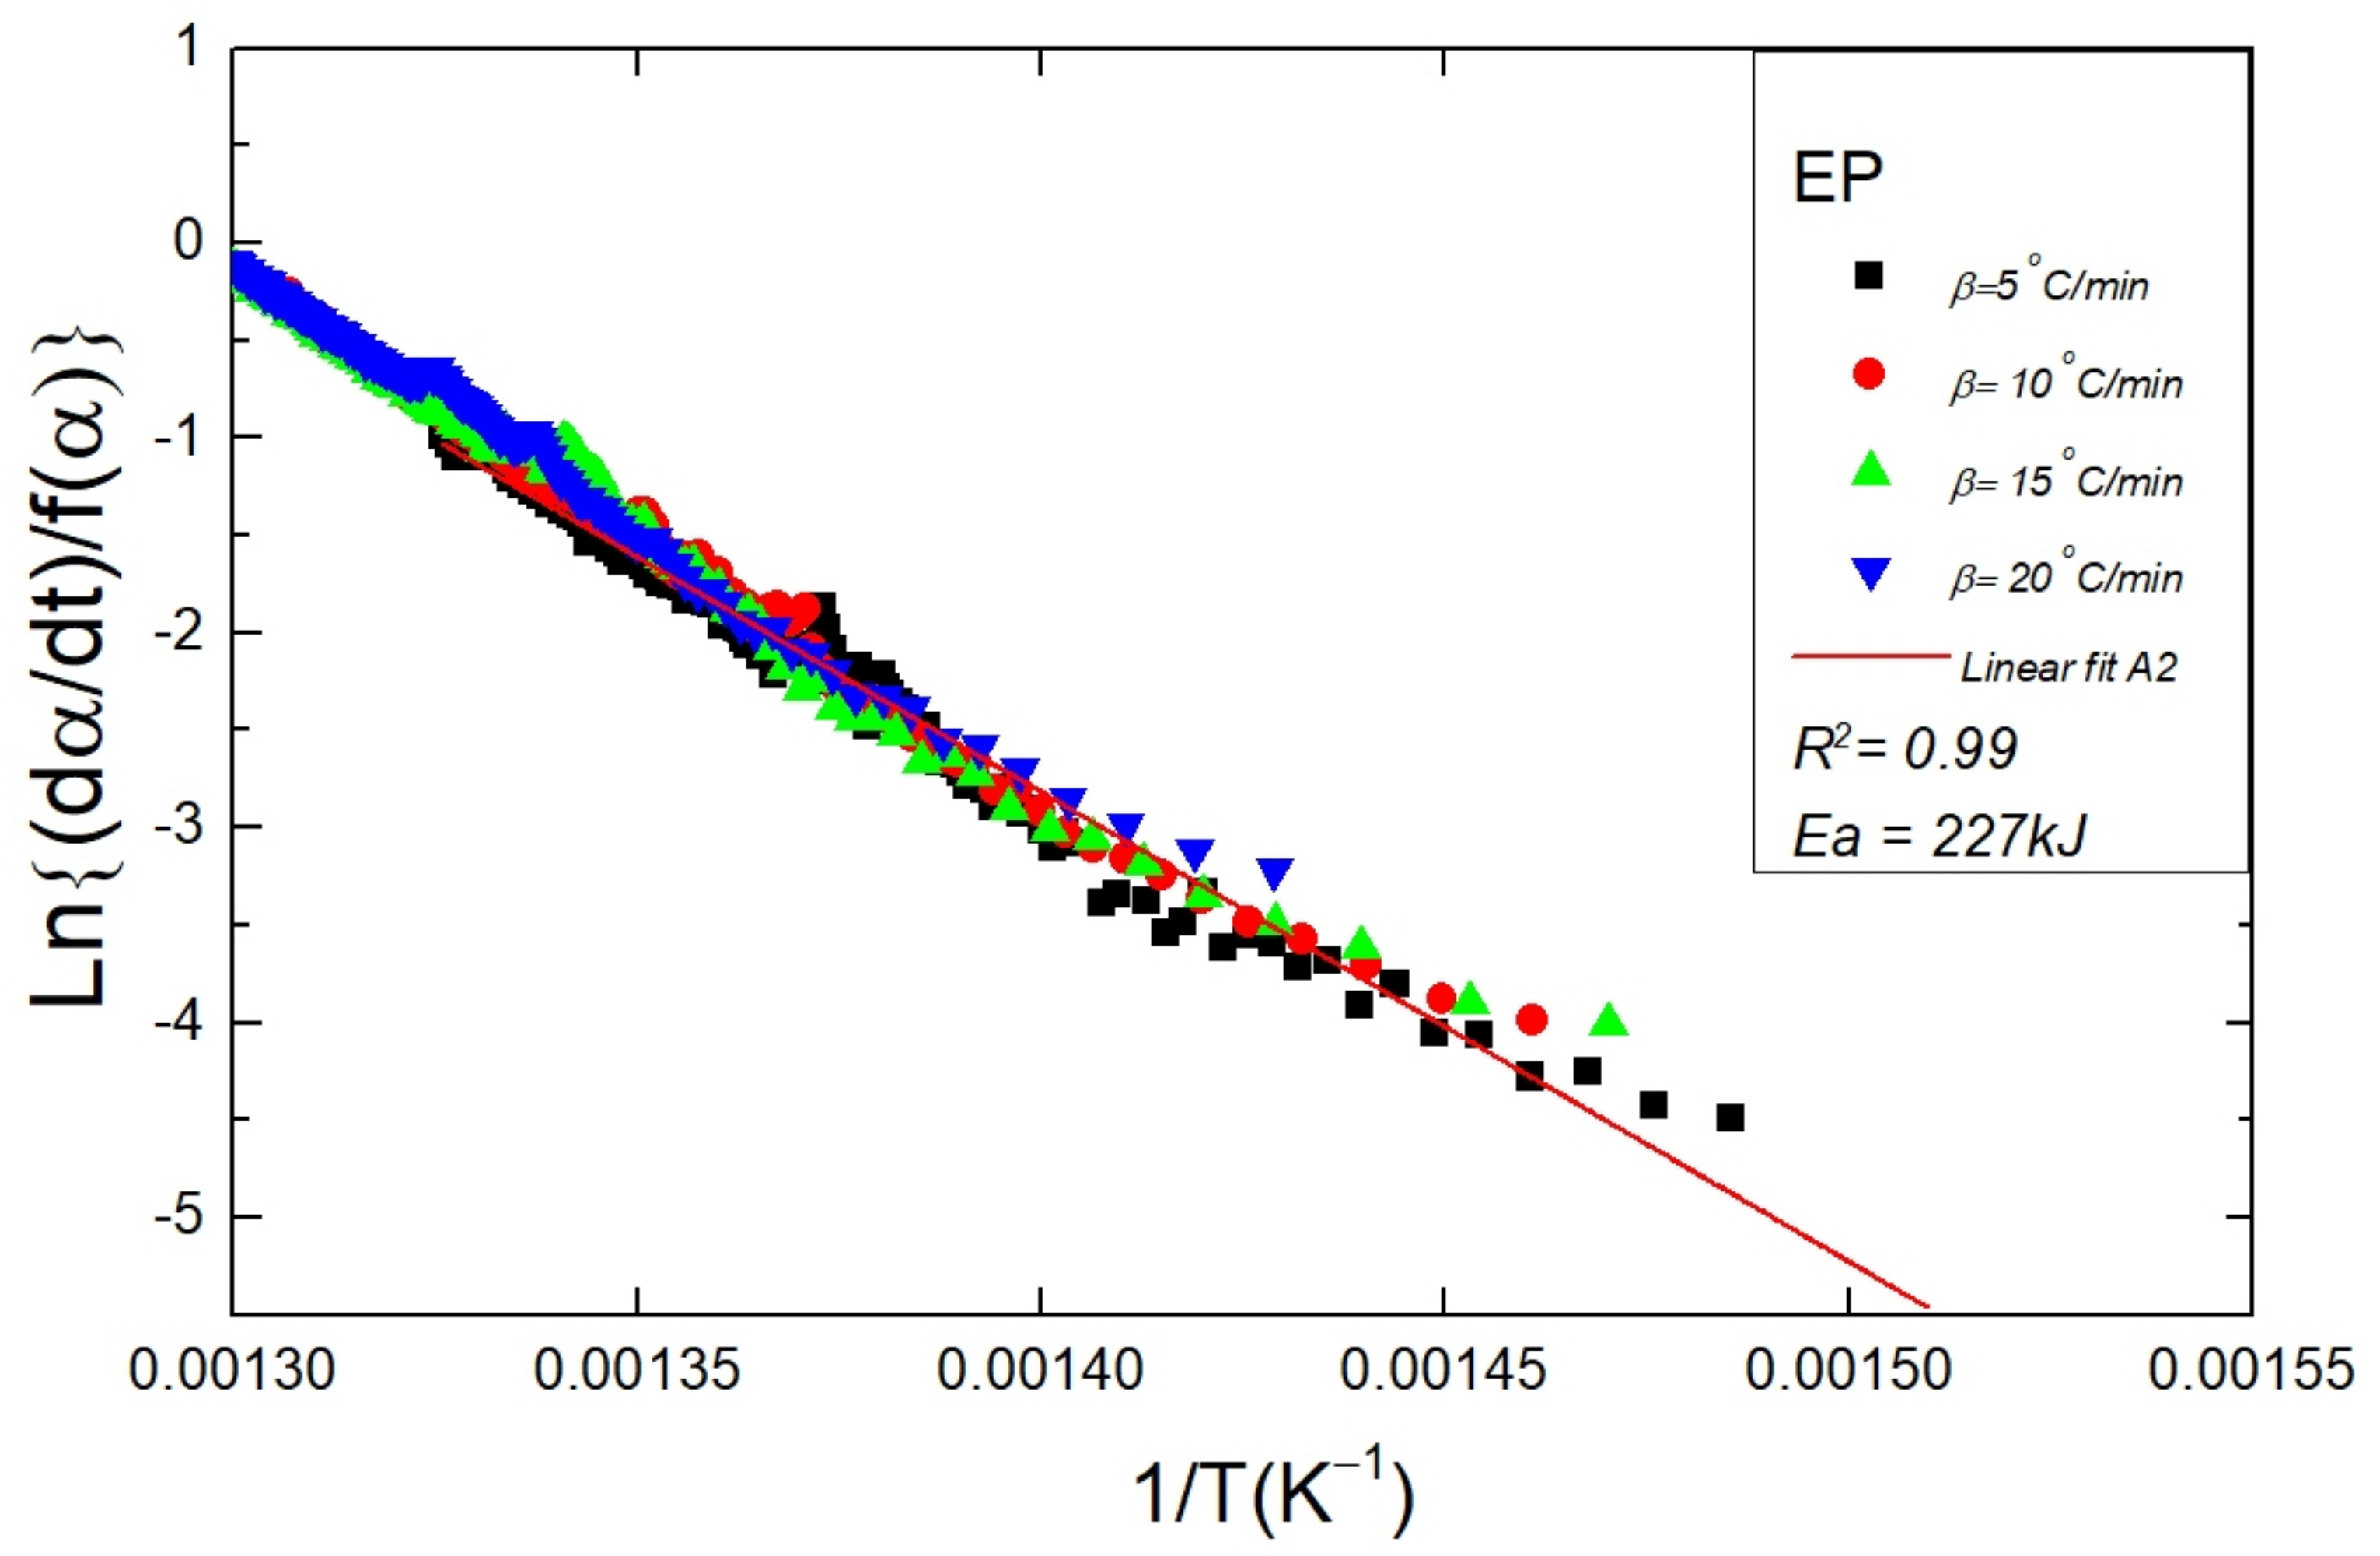
| EP | A2 | 0.05 < α < 1 | 228 | 0.99 |
| EPH0.5 | 0.15 < α < 1 | 205 | 0.99 | |
| EPH1 | 0.15 < α < 1 | 185 | 0.98 | |
| EPH1L | 0.18 < α < 1 | 187 | 0.986 |
Publisher’s Note: MDPI stays neutral with regard to jurisdictional claims in published maps and institutional affiliations. |
© 2022 by the authors. Licensee MDPI, Basel, Switzerland. This article is an open access article distributed under the terms and conditions of the Creative Commons Attribution (CC BY) license (https://creativecommons.org/licenses/by/4.0/).
Share and Cite
Mazhar, H.; Shehzad, F.; Hong, S.-G.; Al-Harthi, M.A. Thermal Degradation Kinetics Analysis of Ethylene-Propylene Copolymer and EP-1-Hexene Terpolymer. Polymers 2022, 14, 634. https://doi.org/10.3390/polym14030634
Mazhar H, Shehzad F, Hong S-G, Al-Harthi MA. Thermal Degradation Kinetics Analysis of Ethylene-Propylene Copolymer and EP-1-Hexene Terpolymer. Polymers. 2022; 14(3):634. https://doi.org/10.3390/polym14030634
Chicago/Turabian StyleMazhar, Hassam, Farrukh Shehzad, Sung-Gil Hong, and Mamdouh A. Al-Harthi. 2022. "Thermal Degradation Kinetics Analysis of Ethylene-Propylene Copolymer and EP-1-Hexene Terpolymer" Polymers 14, no. 3: 634. https://doi.org/10.3390/polym14030634
APA StyleMazhar, H., Shehzad, F., Hong, S.-G., & Al-Harthi, M. A. (2022). Thermal Degradation Kinetics Analysis of Ethylene-Propylene Copolymer and EP-1-Hexene Terpolymer. Polymers, 14(3), 634. https://doi.org/10.3390/polym14030634