
Multi-Analytical Investigations of Andy Warhol’s “Orange Car Crash”: Polymeric Materials in Modern Paints

 , ,
, ,
Abstract
1. Introduction
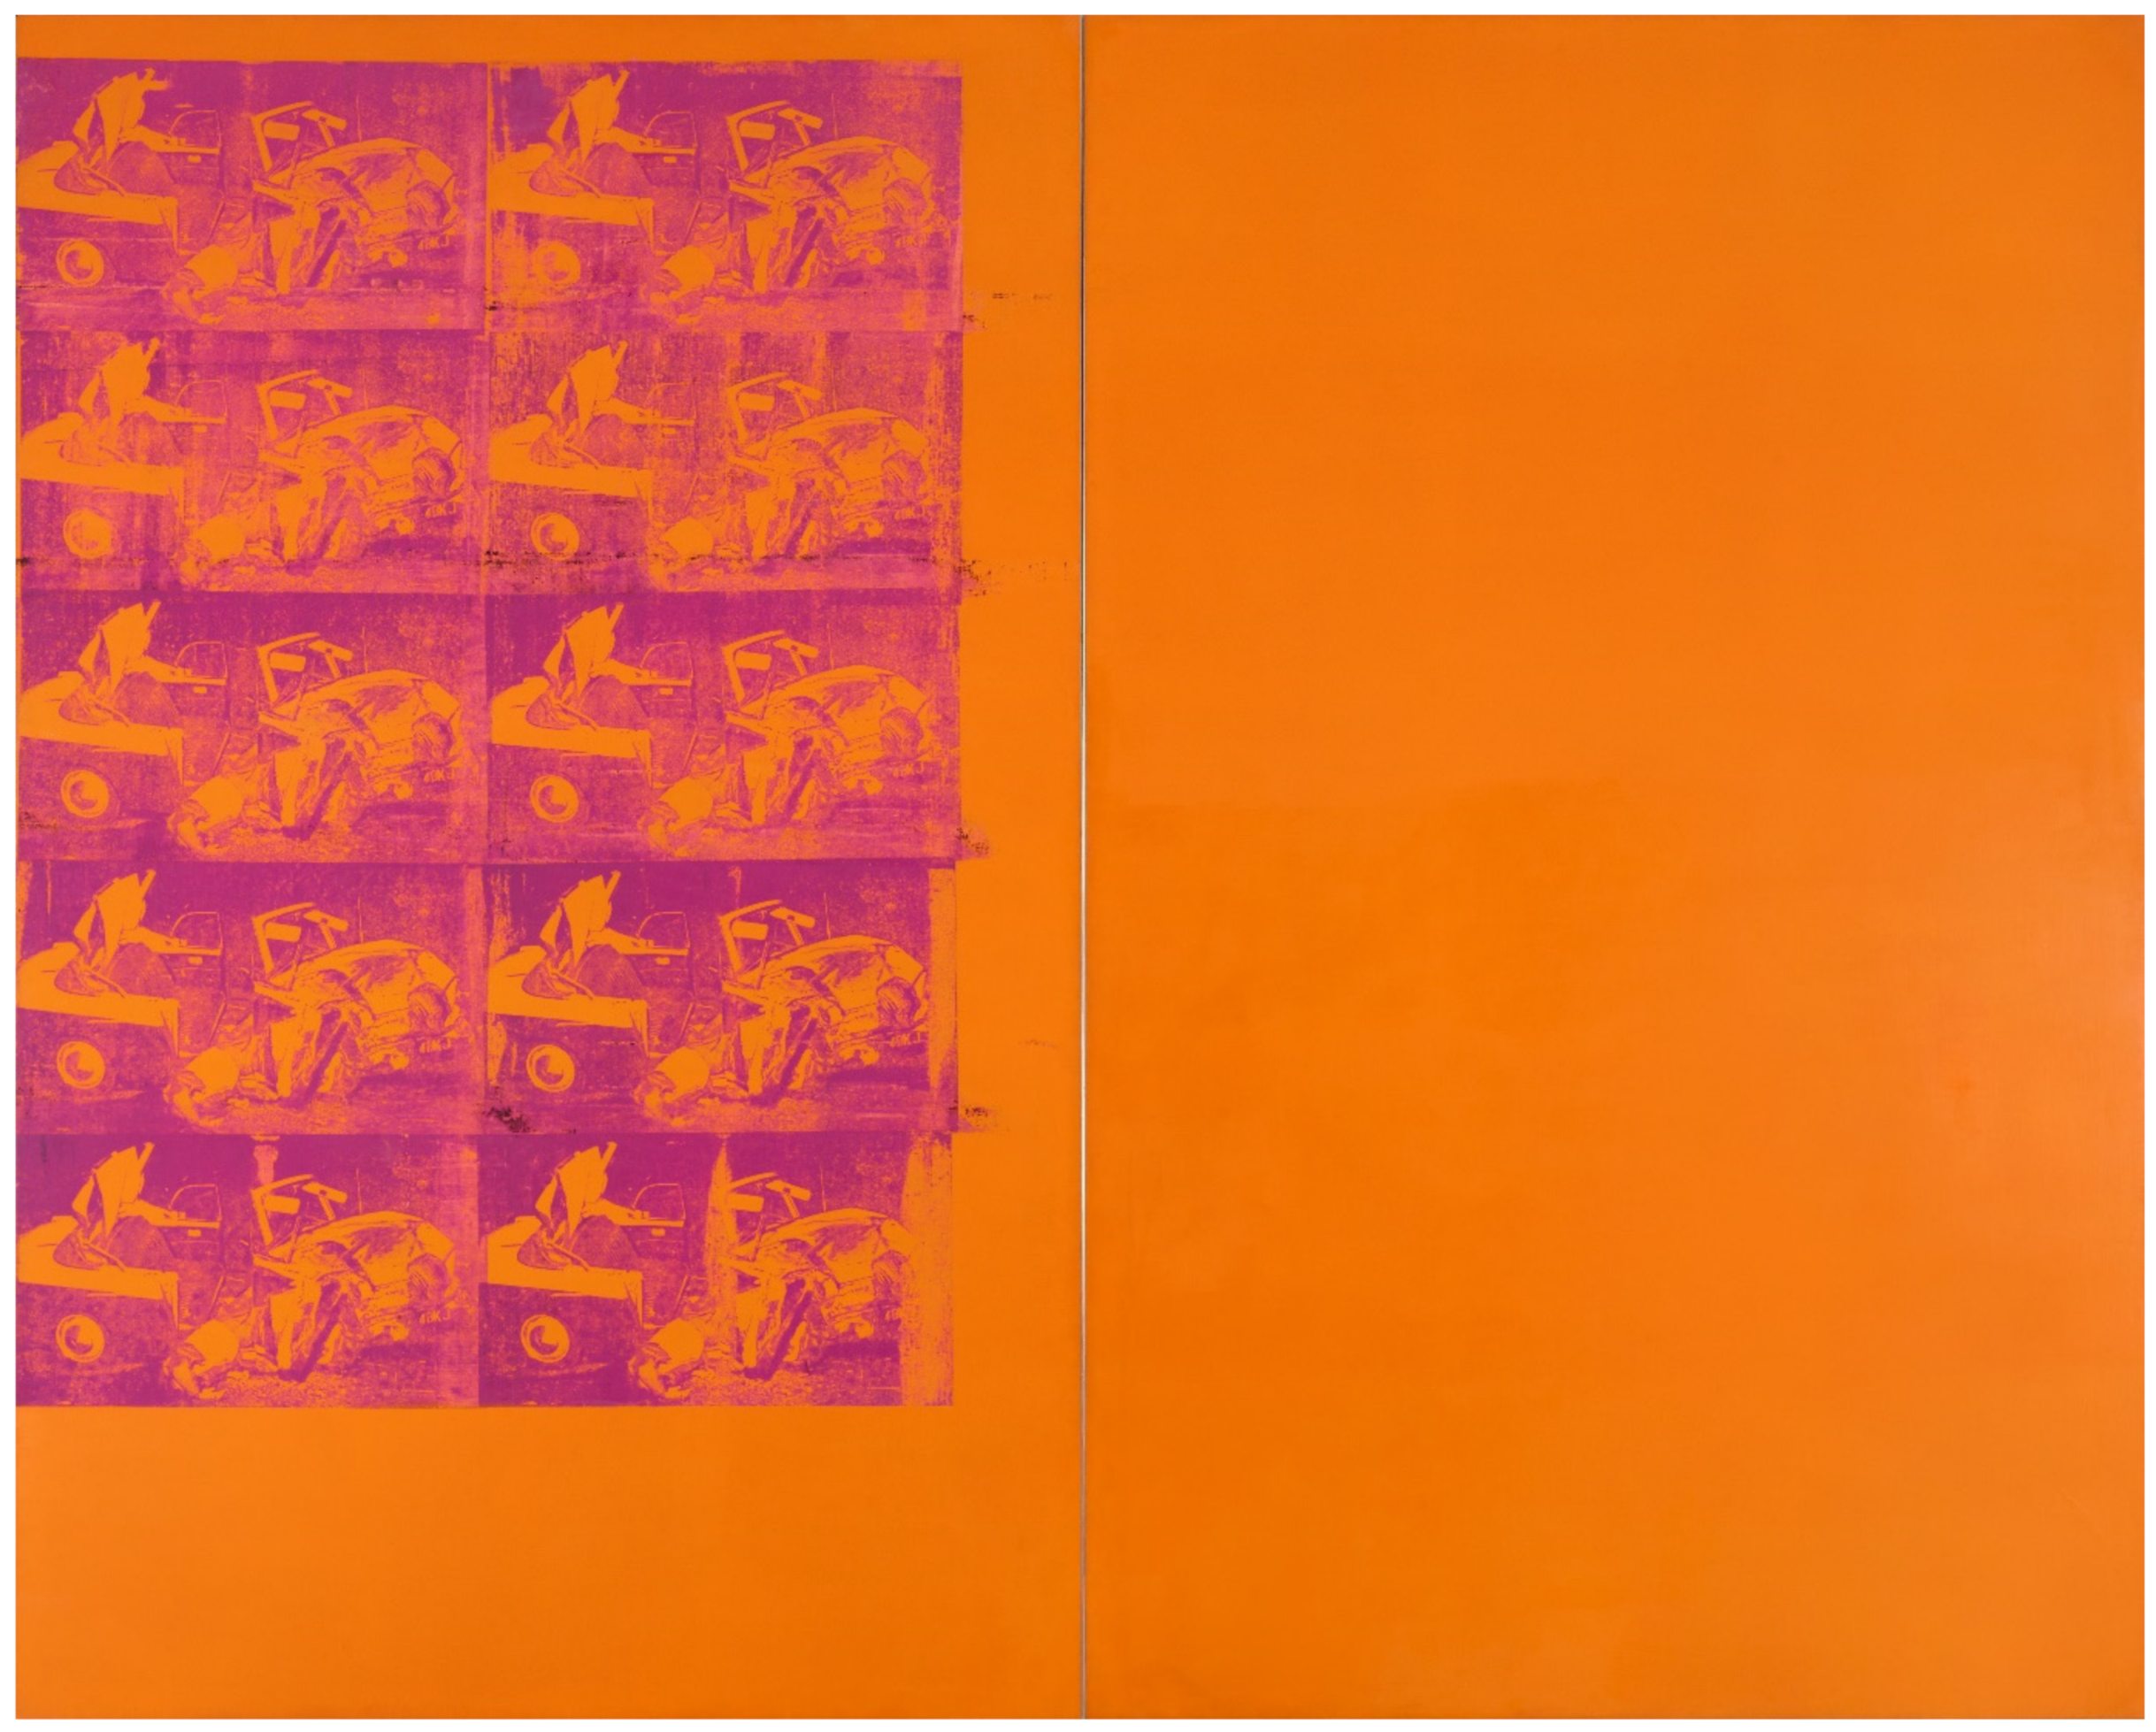
1.1. “ Orange Car Crash” by Andy Warhol in the Time of Modern Materials
1.2. Challenges in Modern Materials Analyses
1.3. Aim of This Research
2. Experimental
2.1. Materials
2.2. Optical Microscopy (OM) and Scanning Electron Microscopy with Energy Dispersive X-ray Spectroscopy (SEM/EDX)
2.3. Pyrolysis–Gas Chromatography/Mass Spectrometry (Py–GC/MS) and Thermally Assisted Hydrolysis and Methylation–Gas Chromatography/Mass Spectrometry (THM–GC/MS)
2.4. Micro-Attenuated Total Reflection of Fourier-Transform Infrared (µ-ATR–FTIR) Spectroscopy
2.5. µ-Raman Spectroscopy
3. Results and Discussion
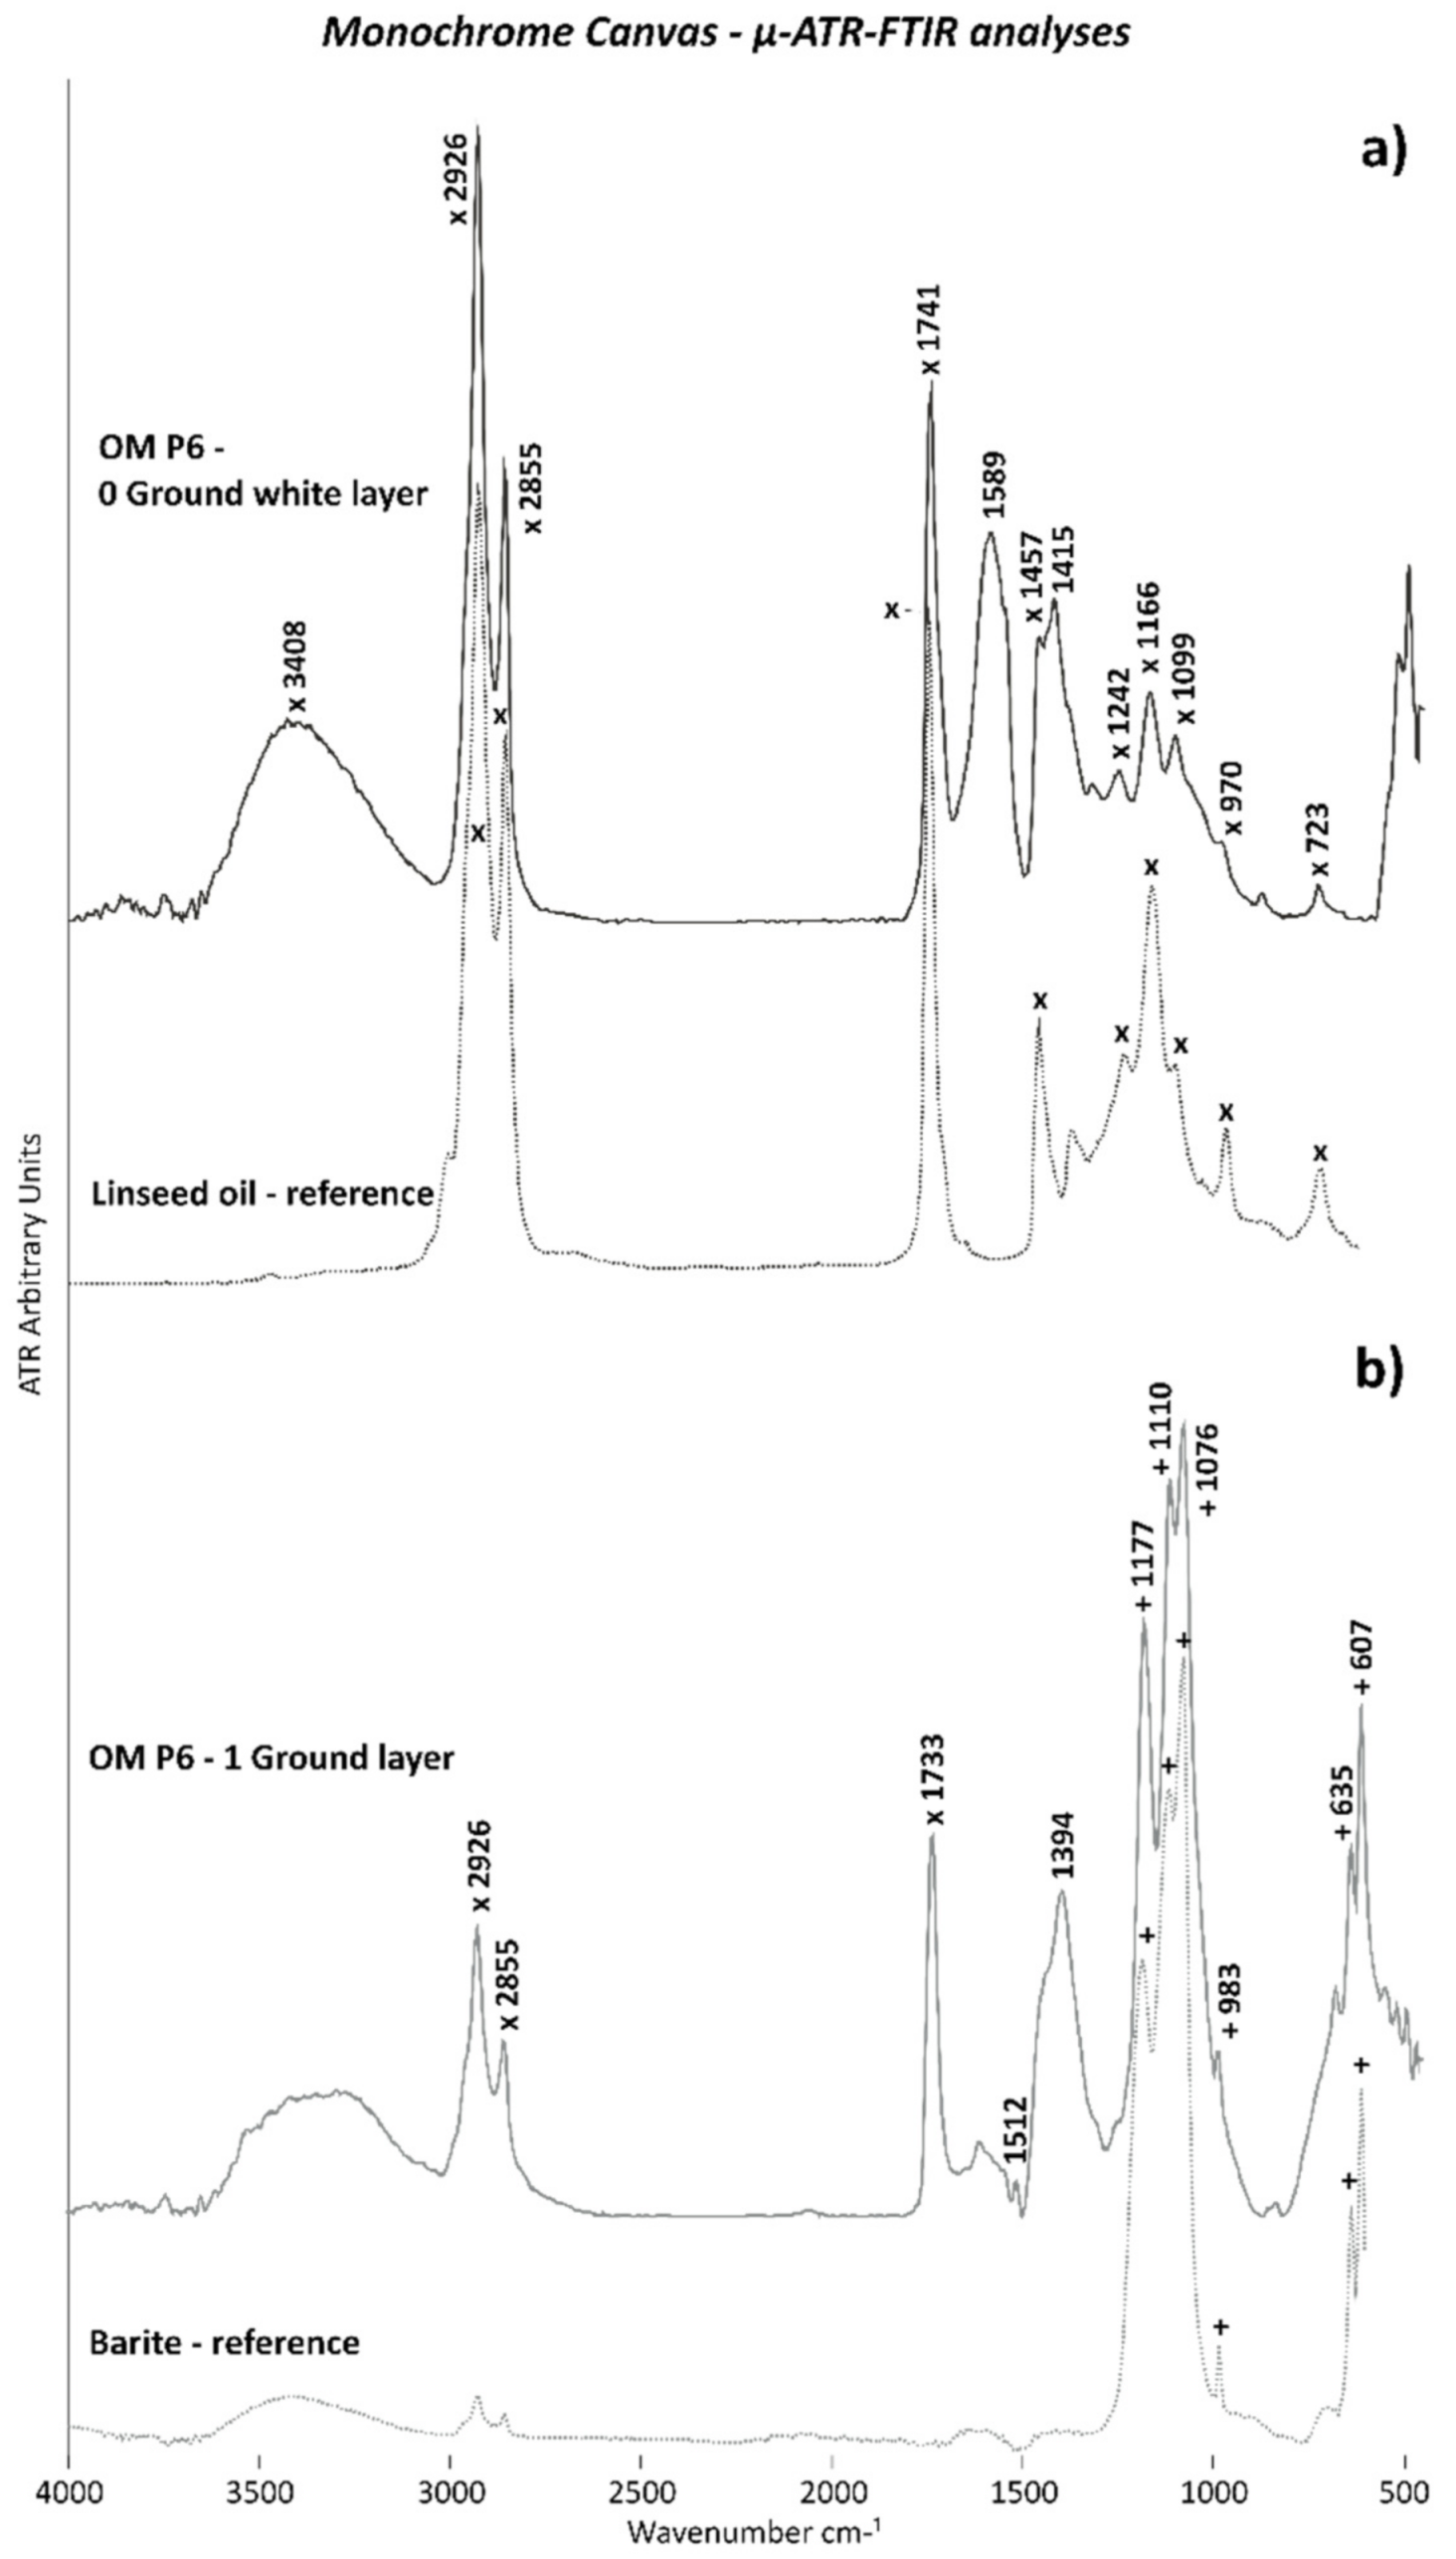
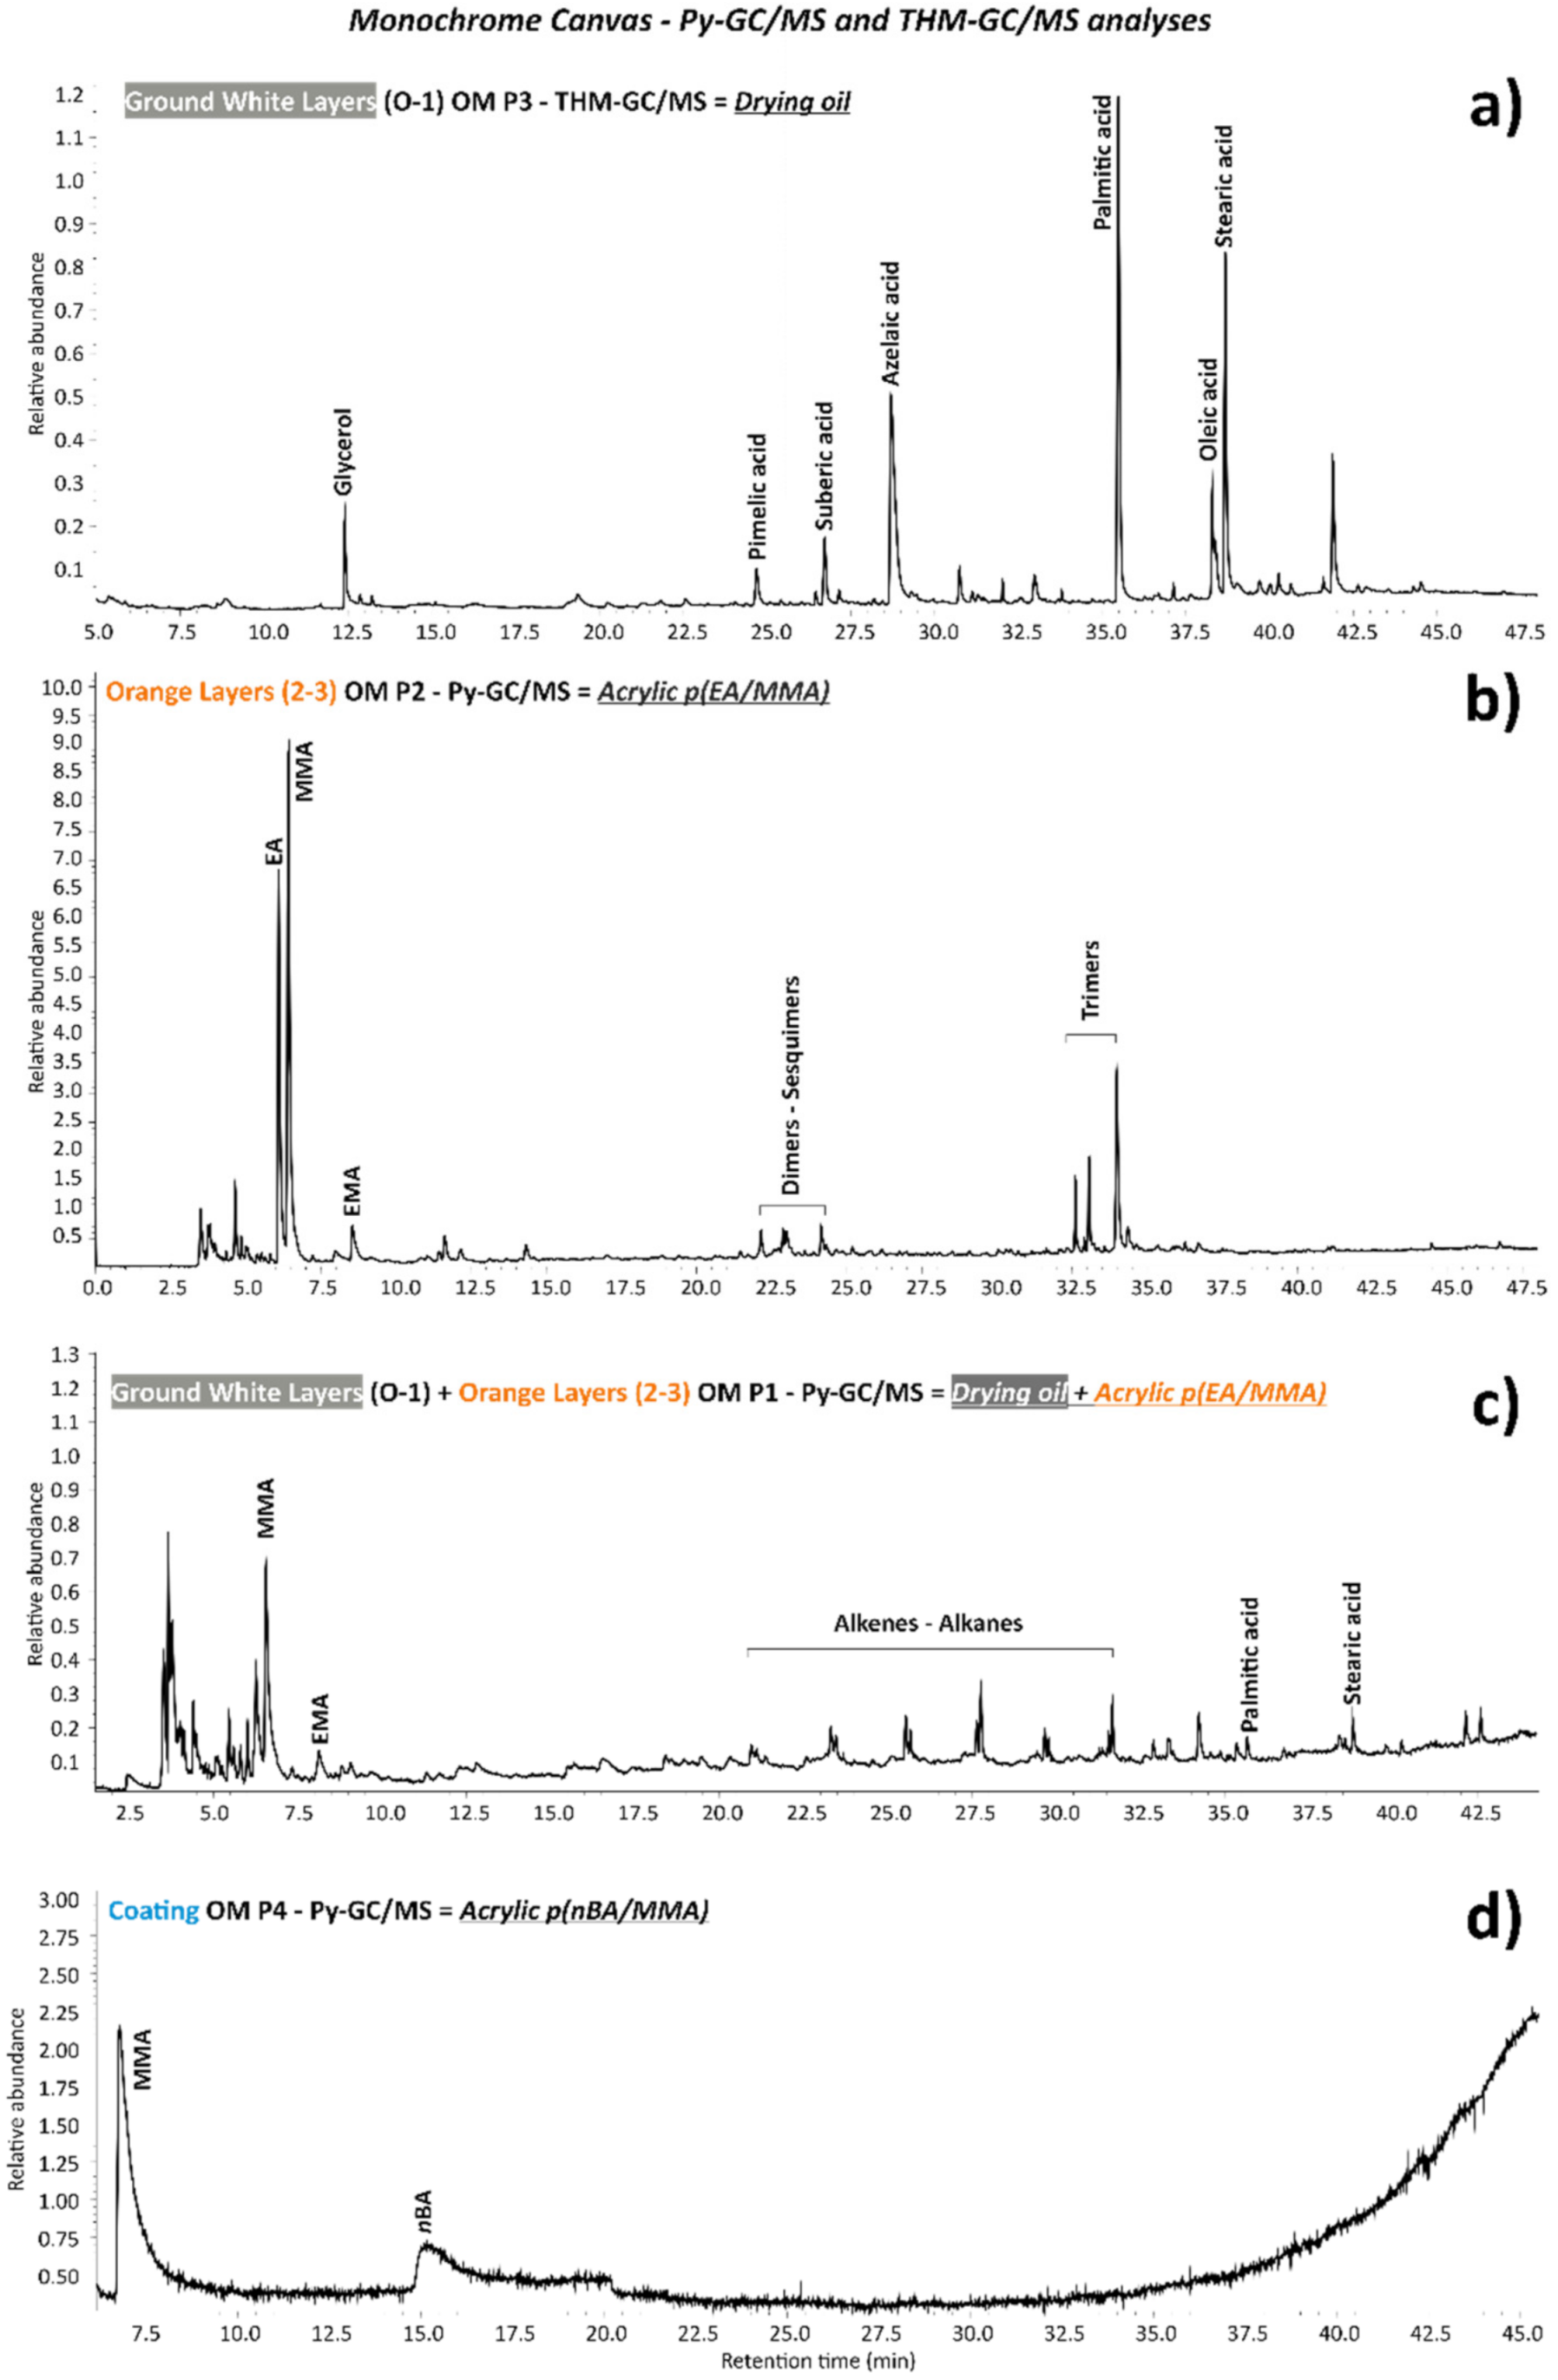
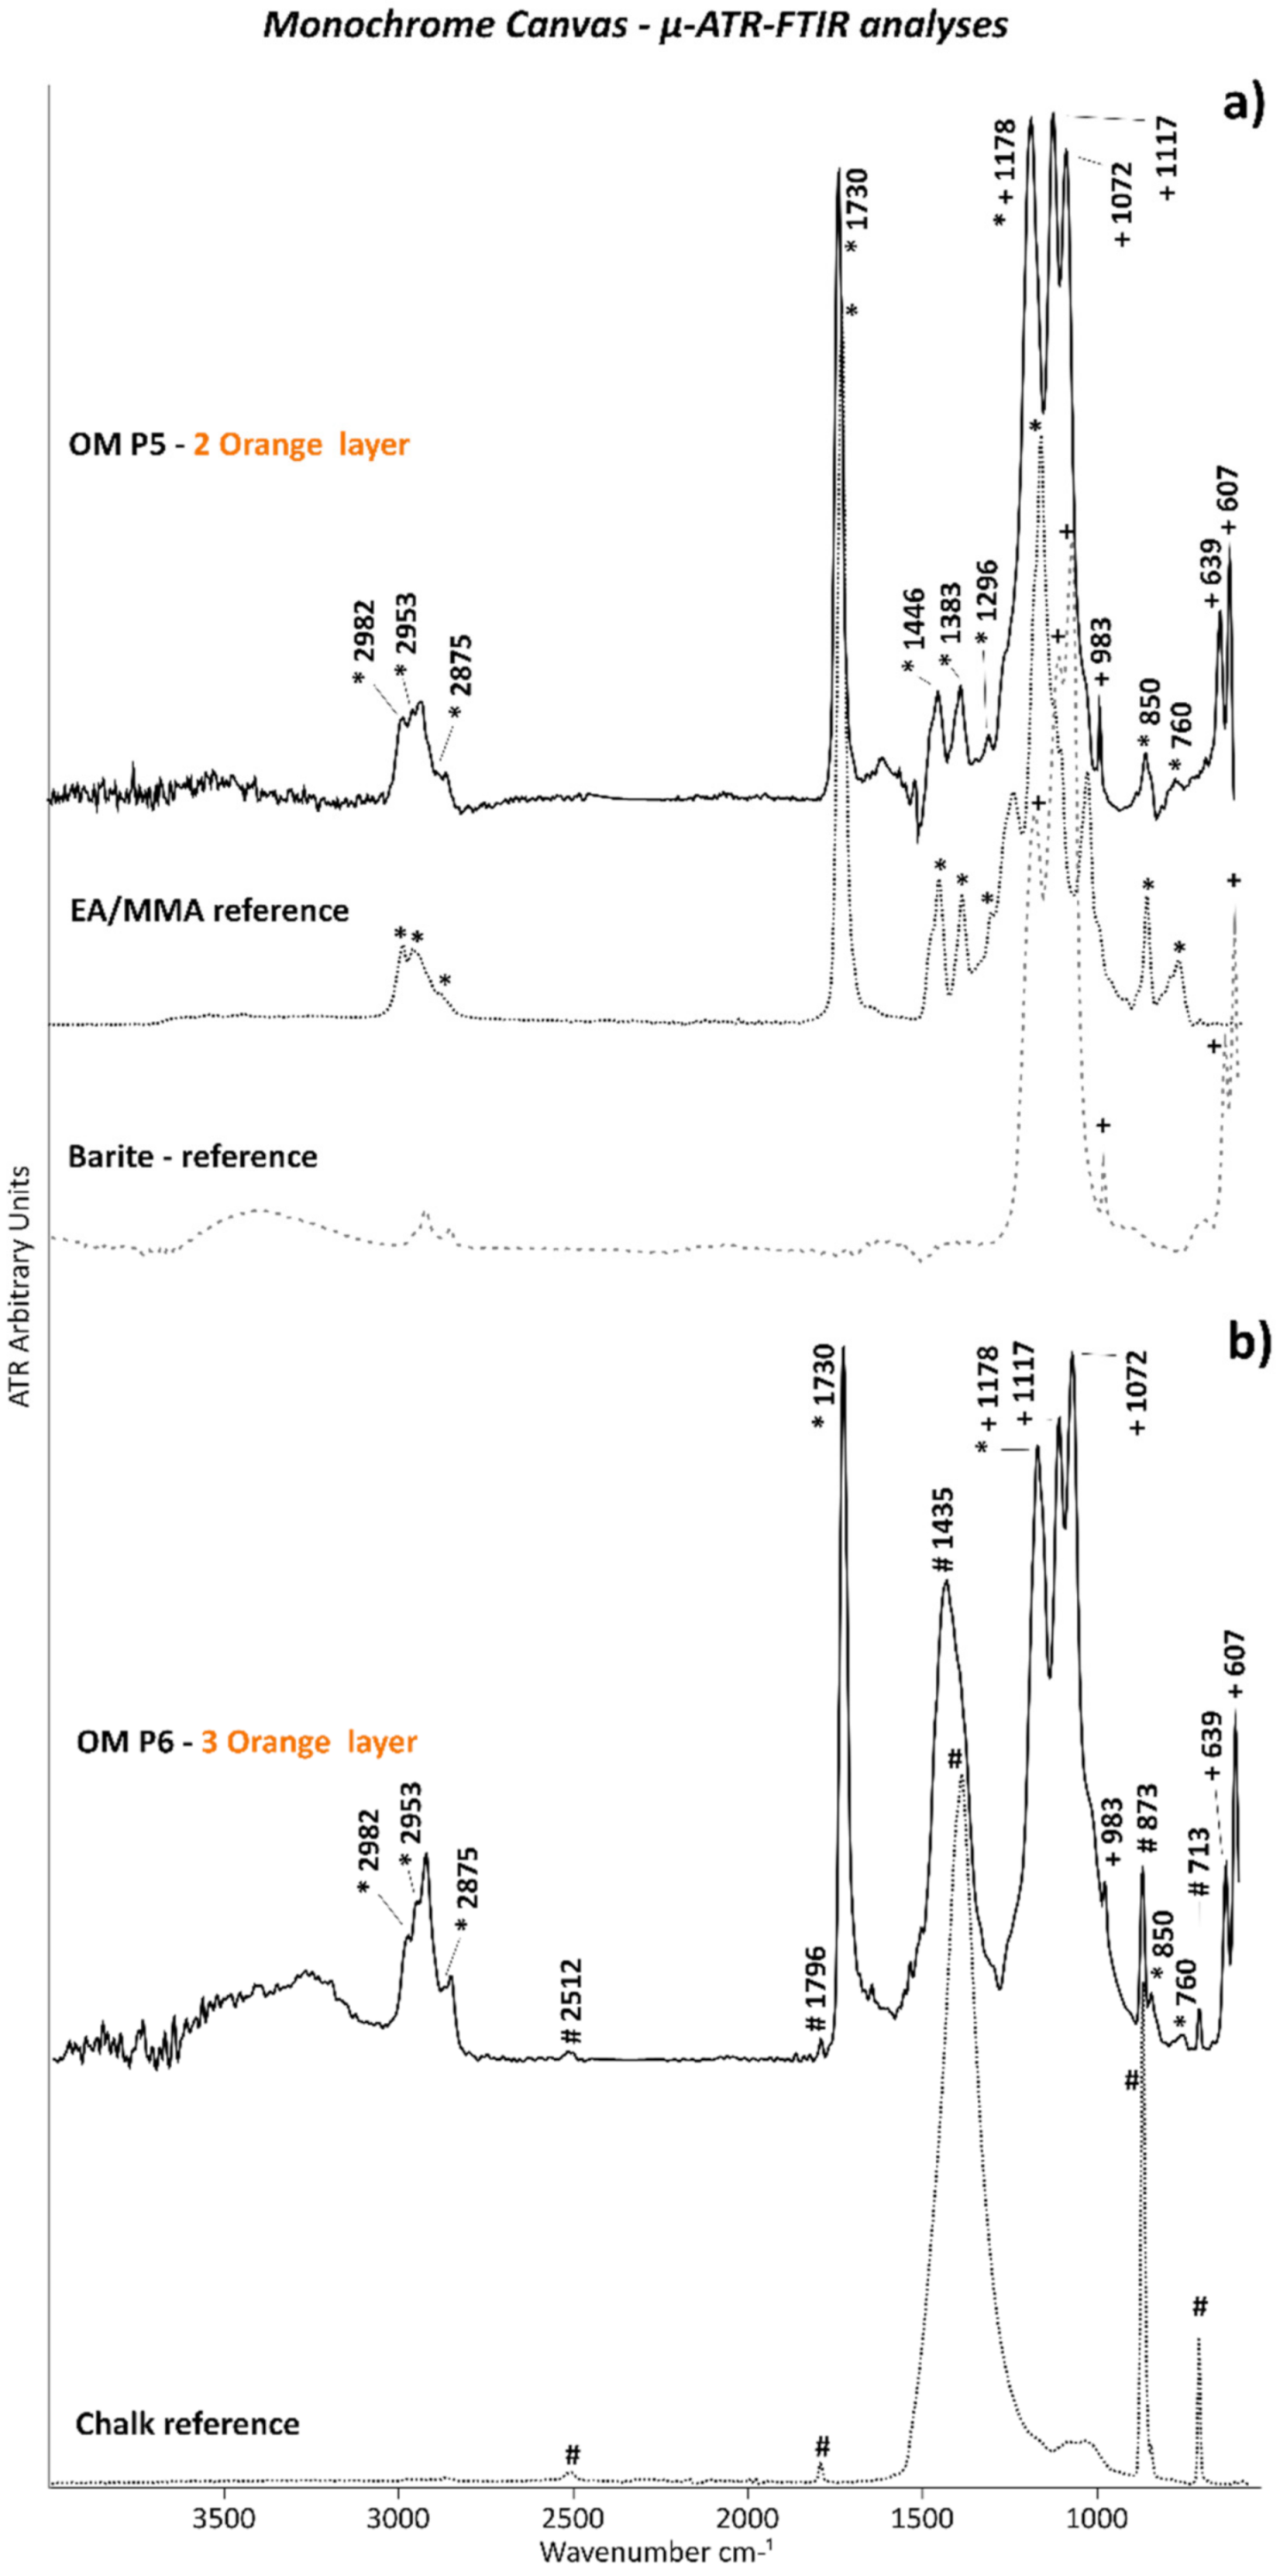
3.1. Monochrome Canvas
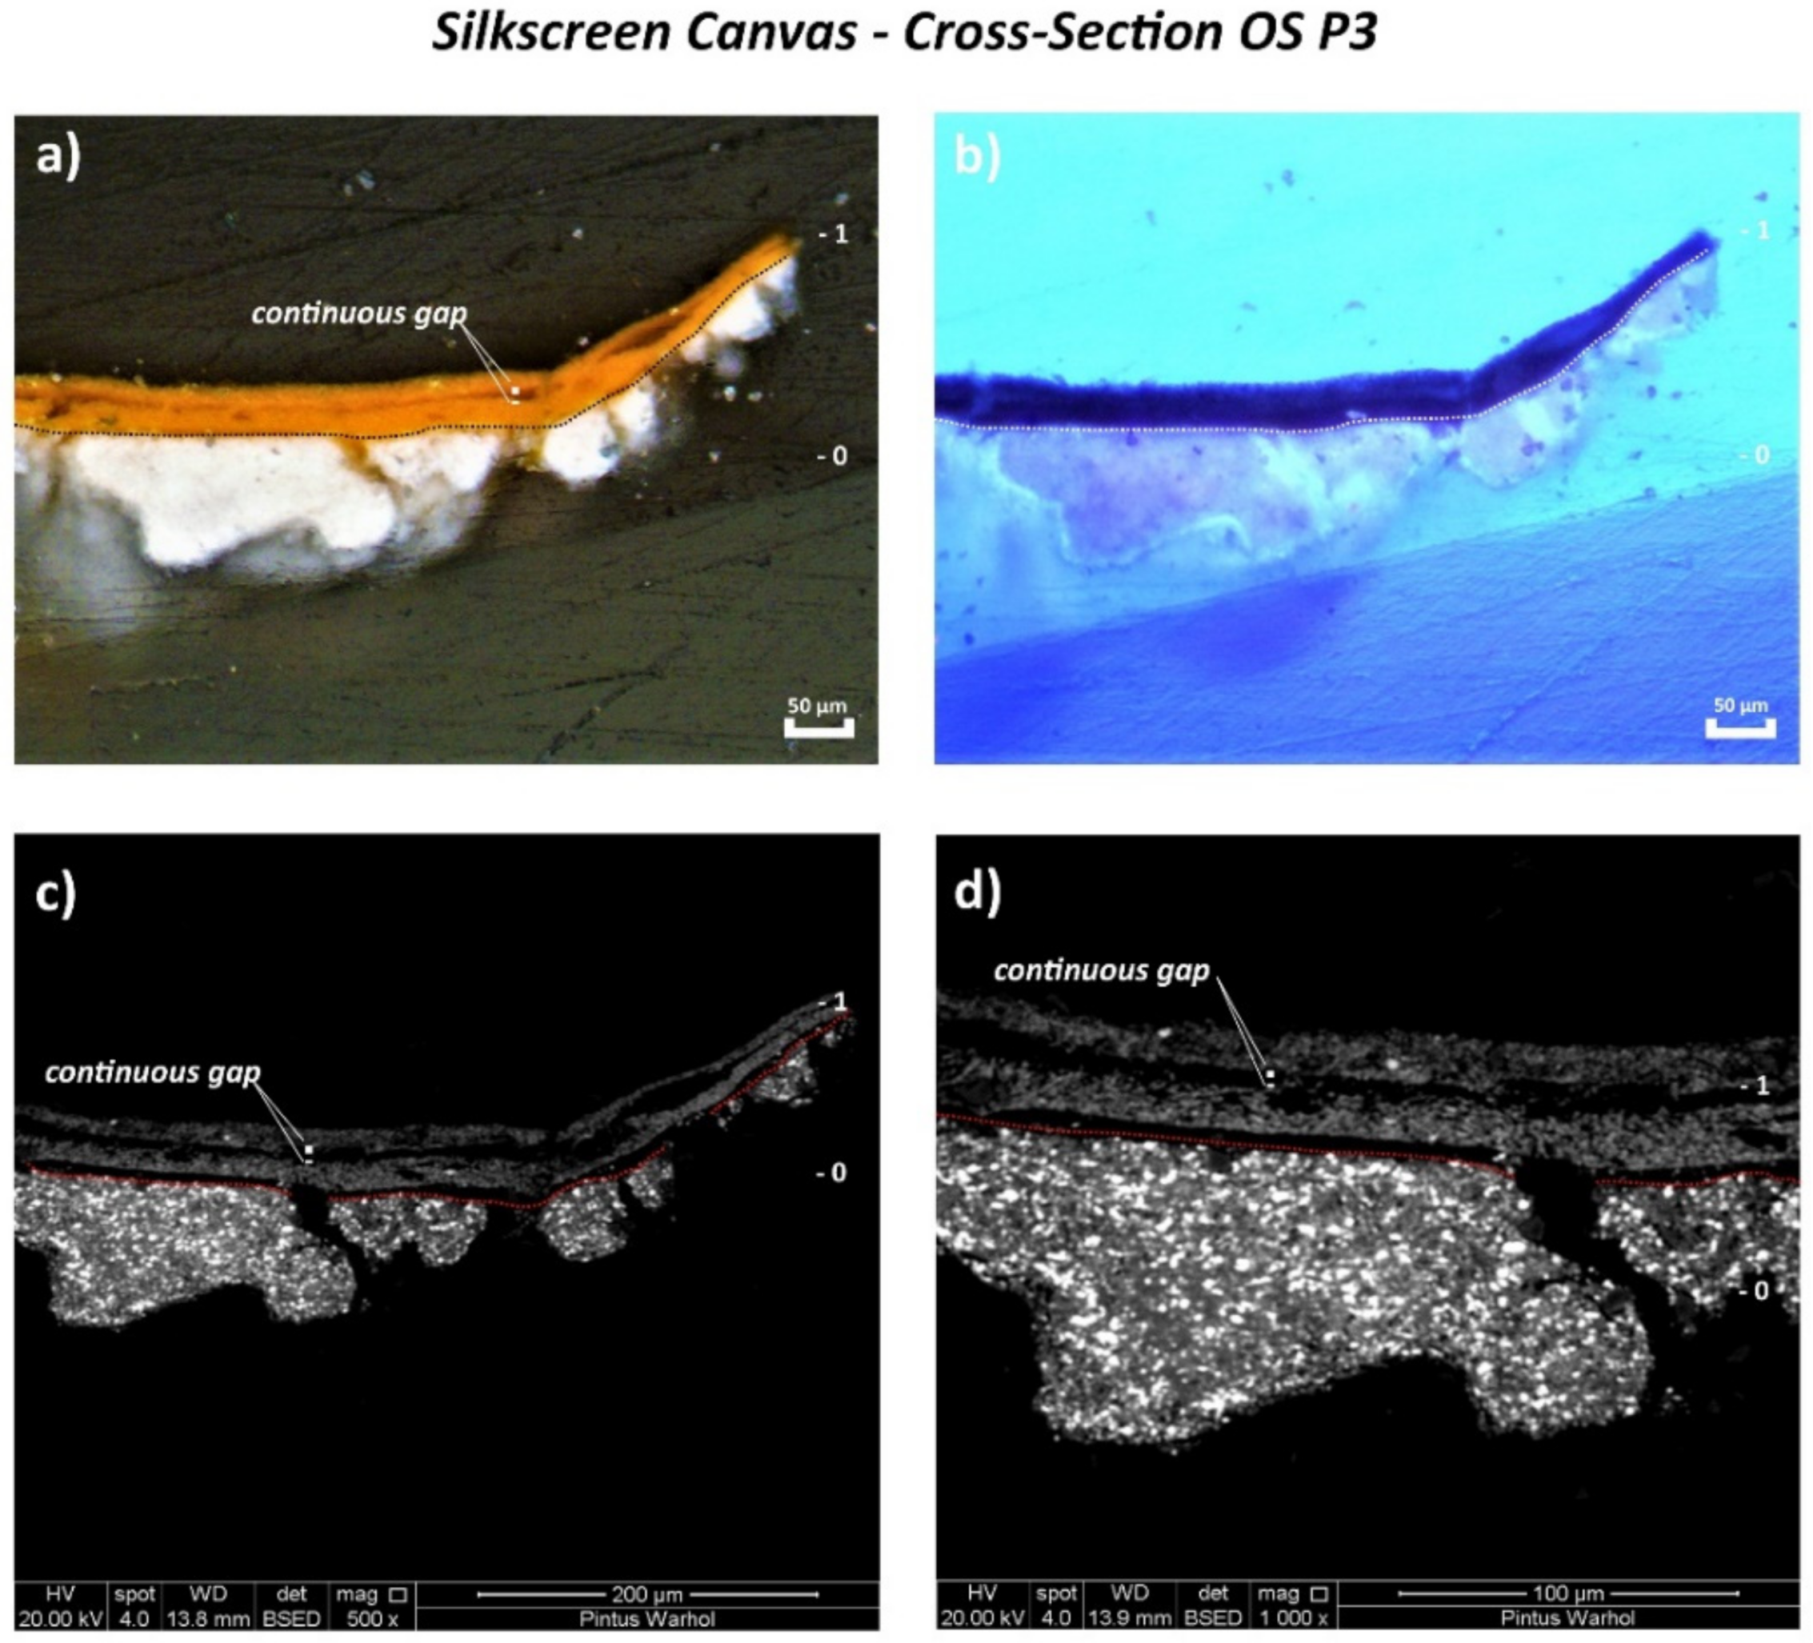
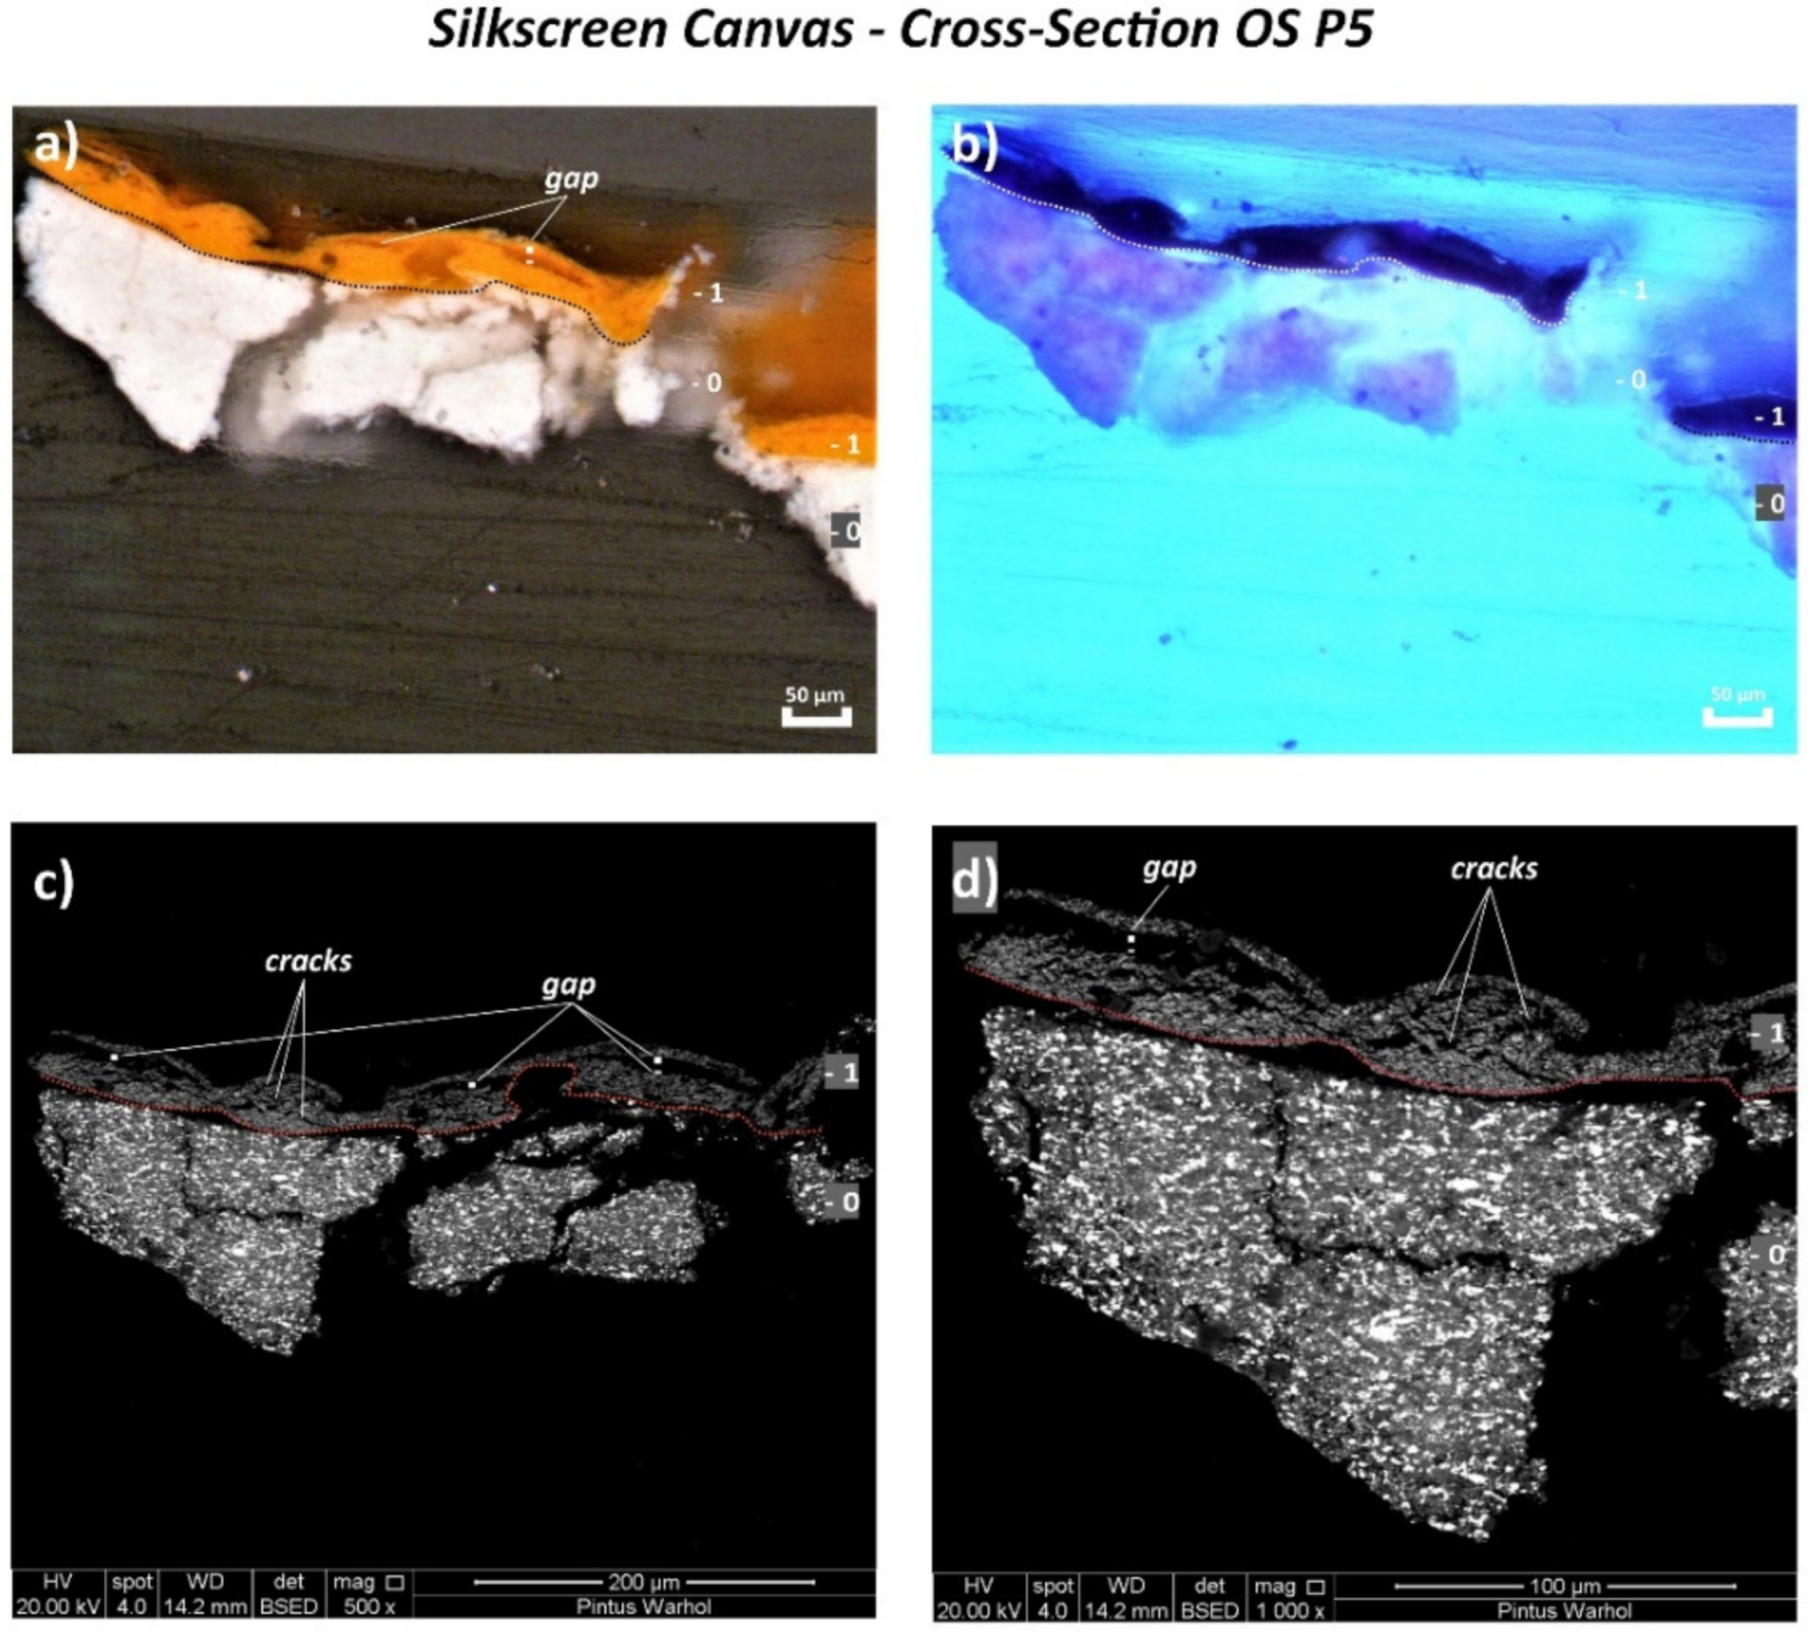
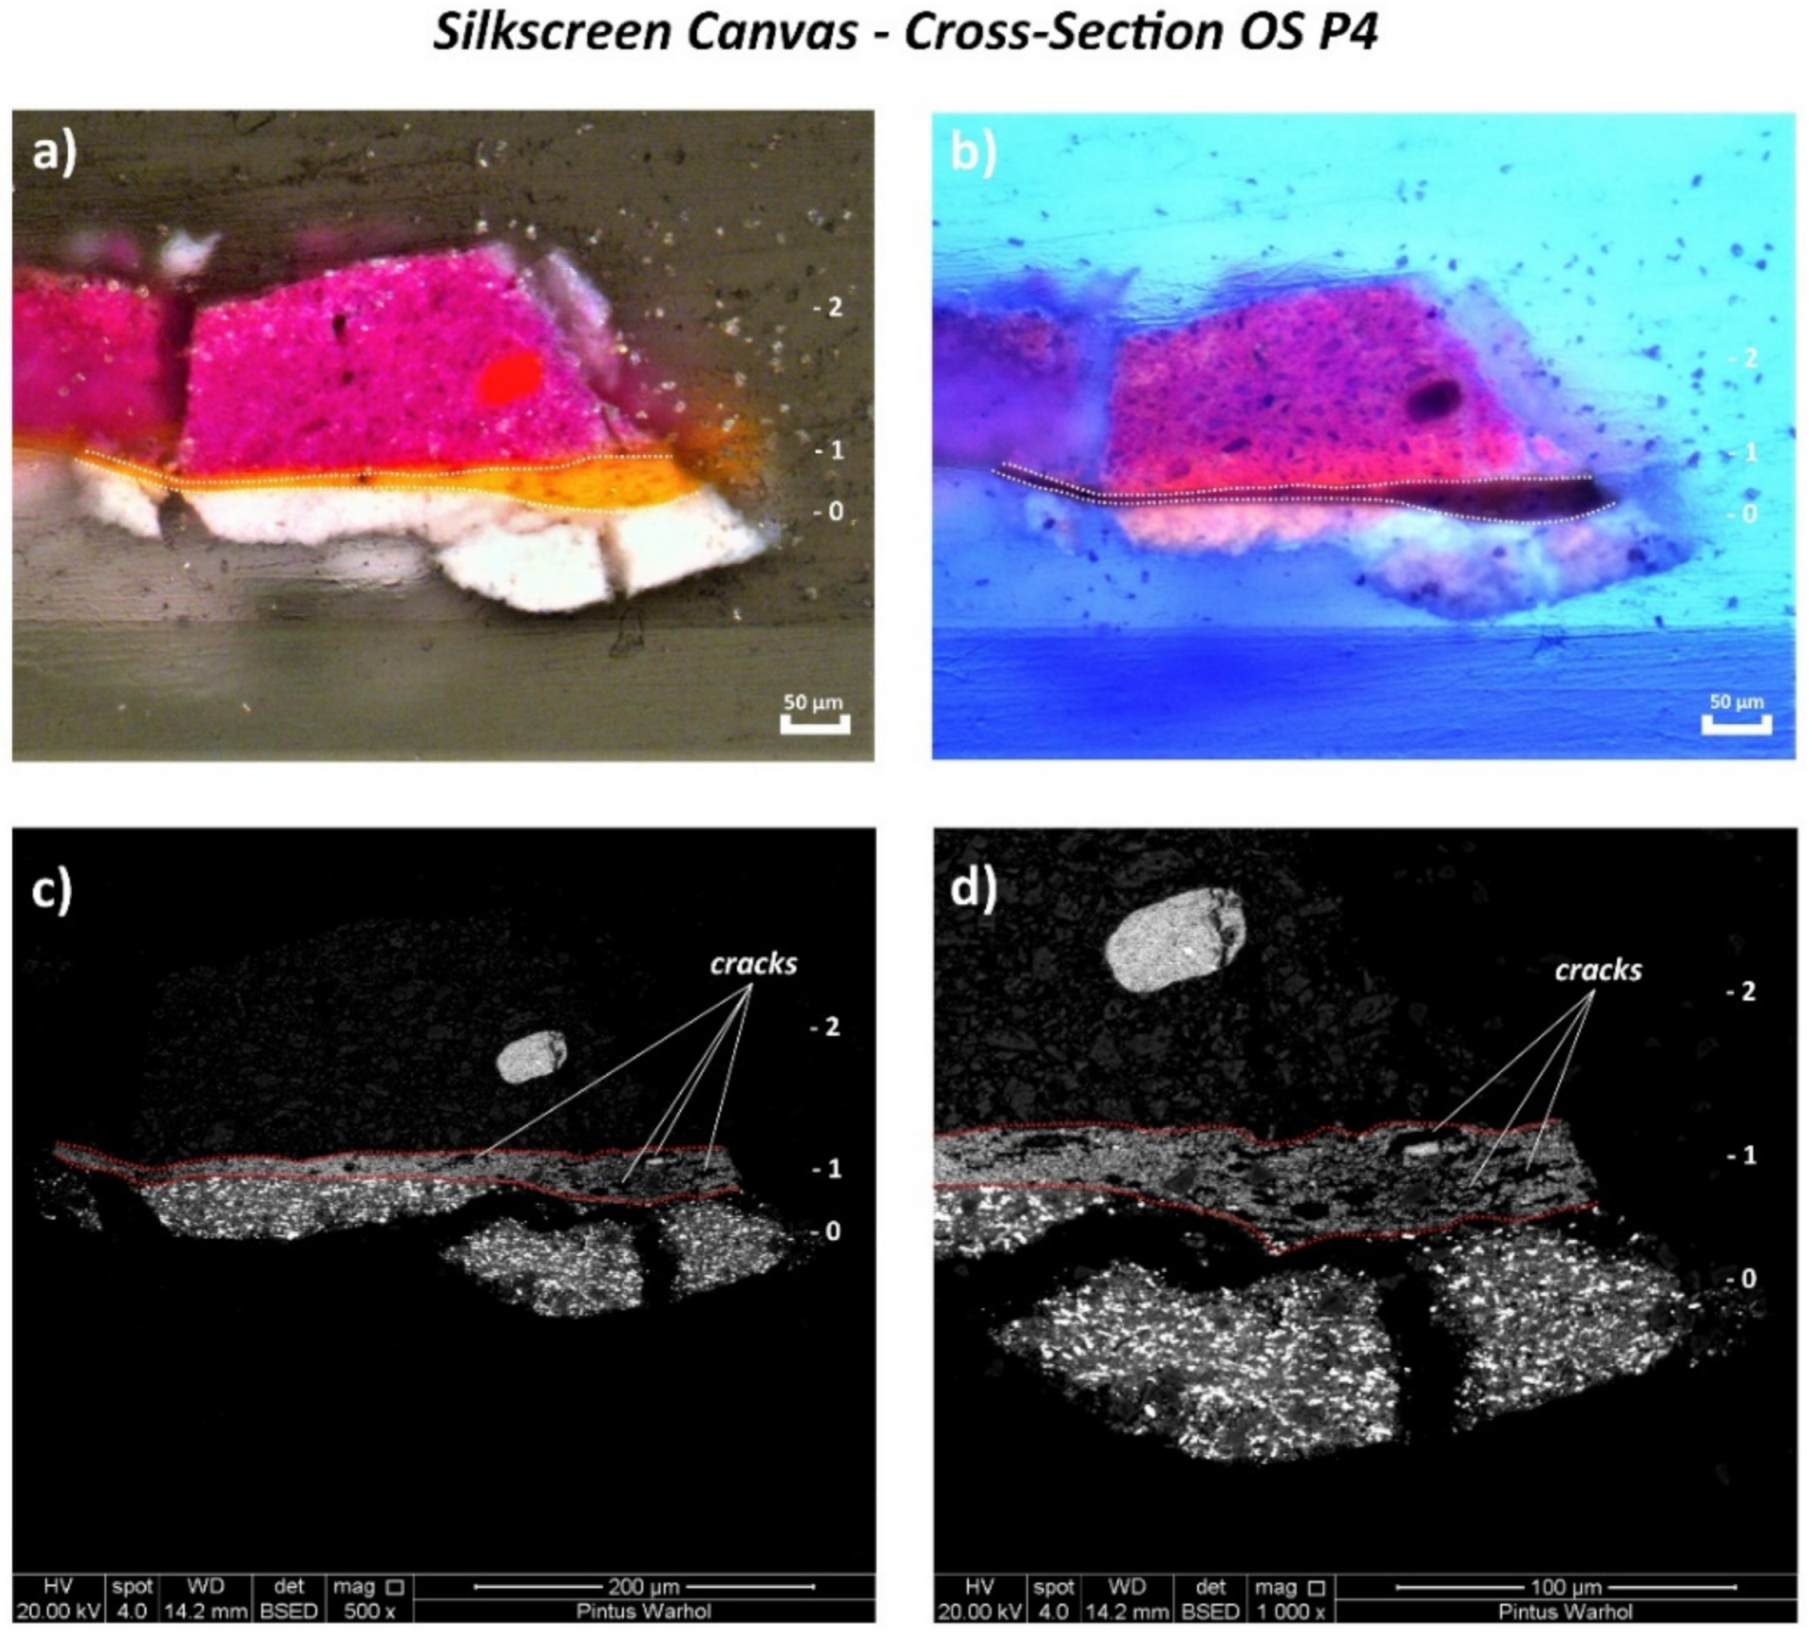
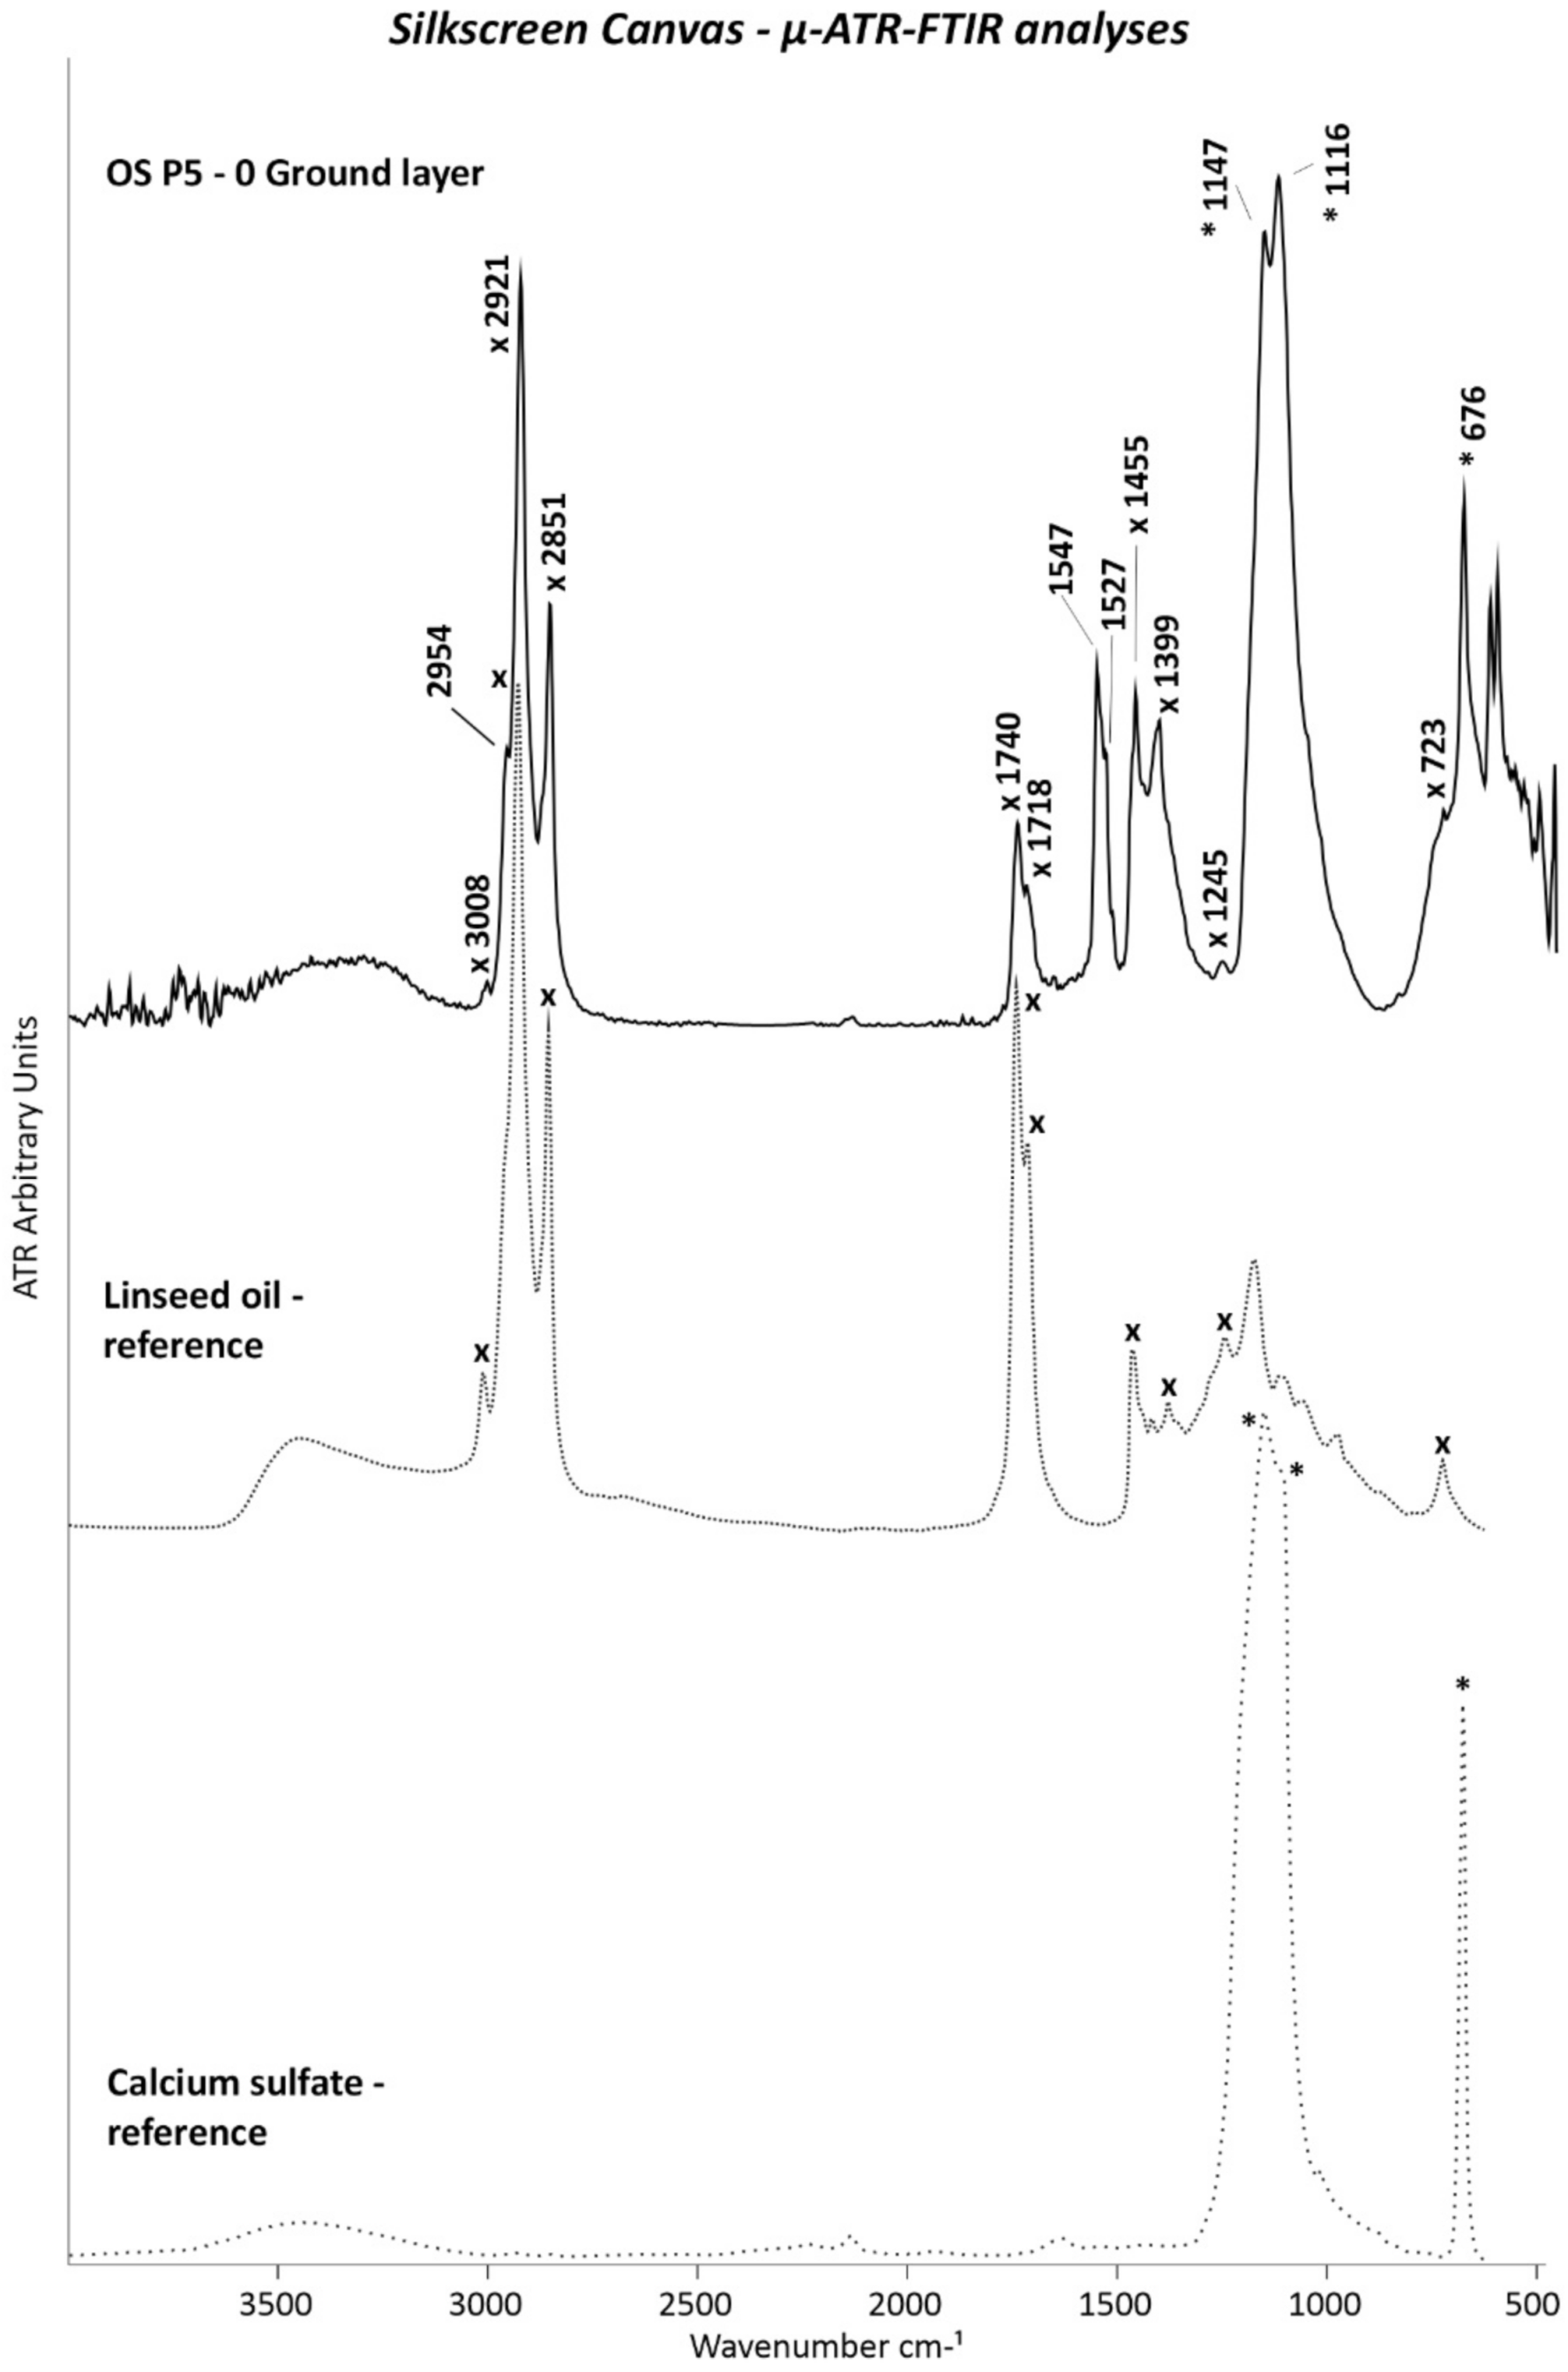
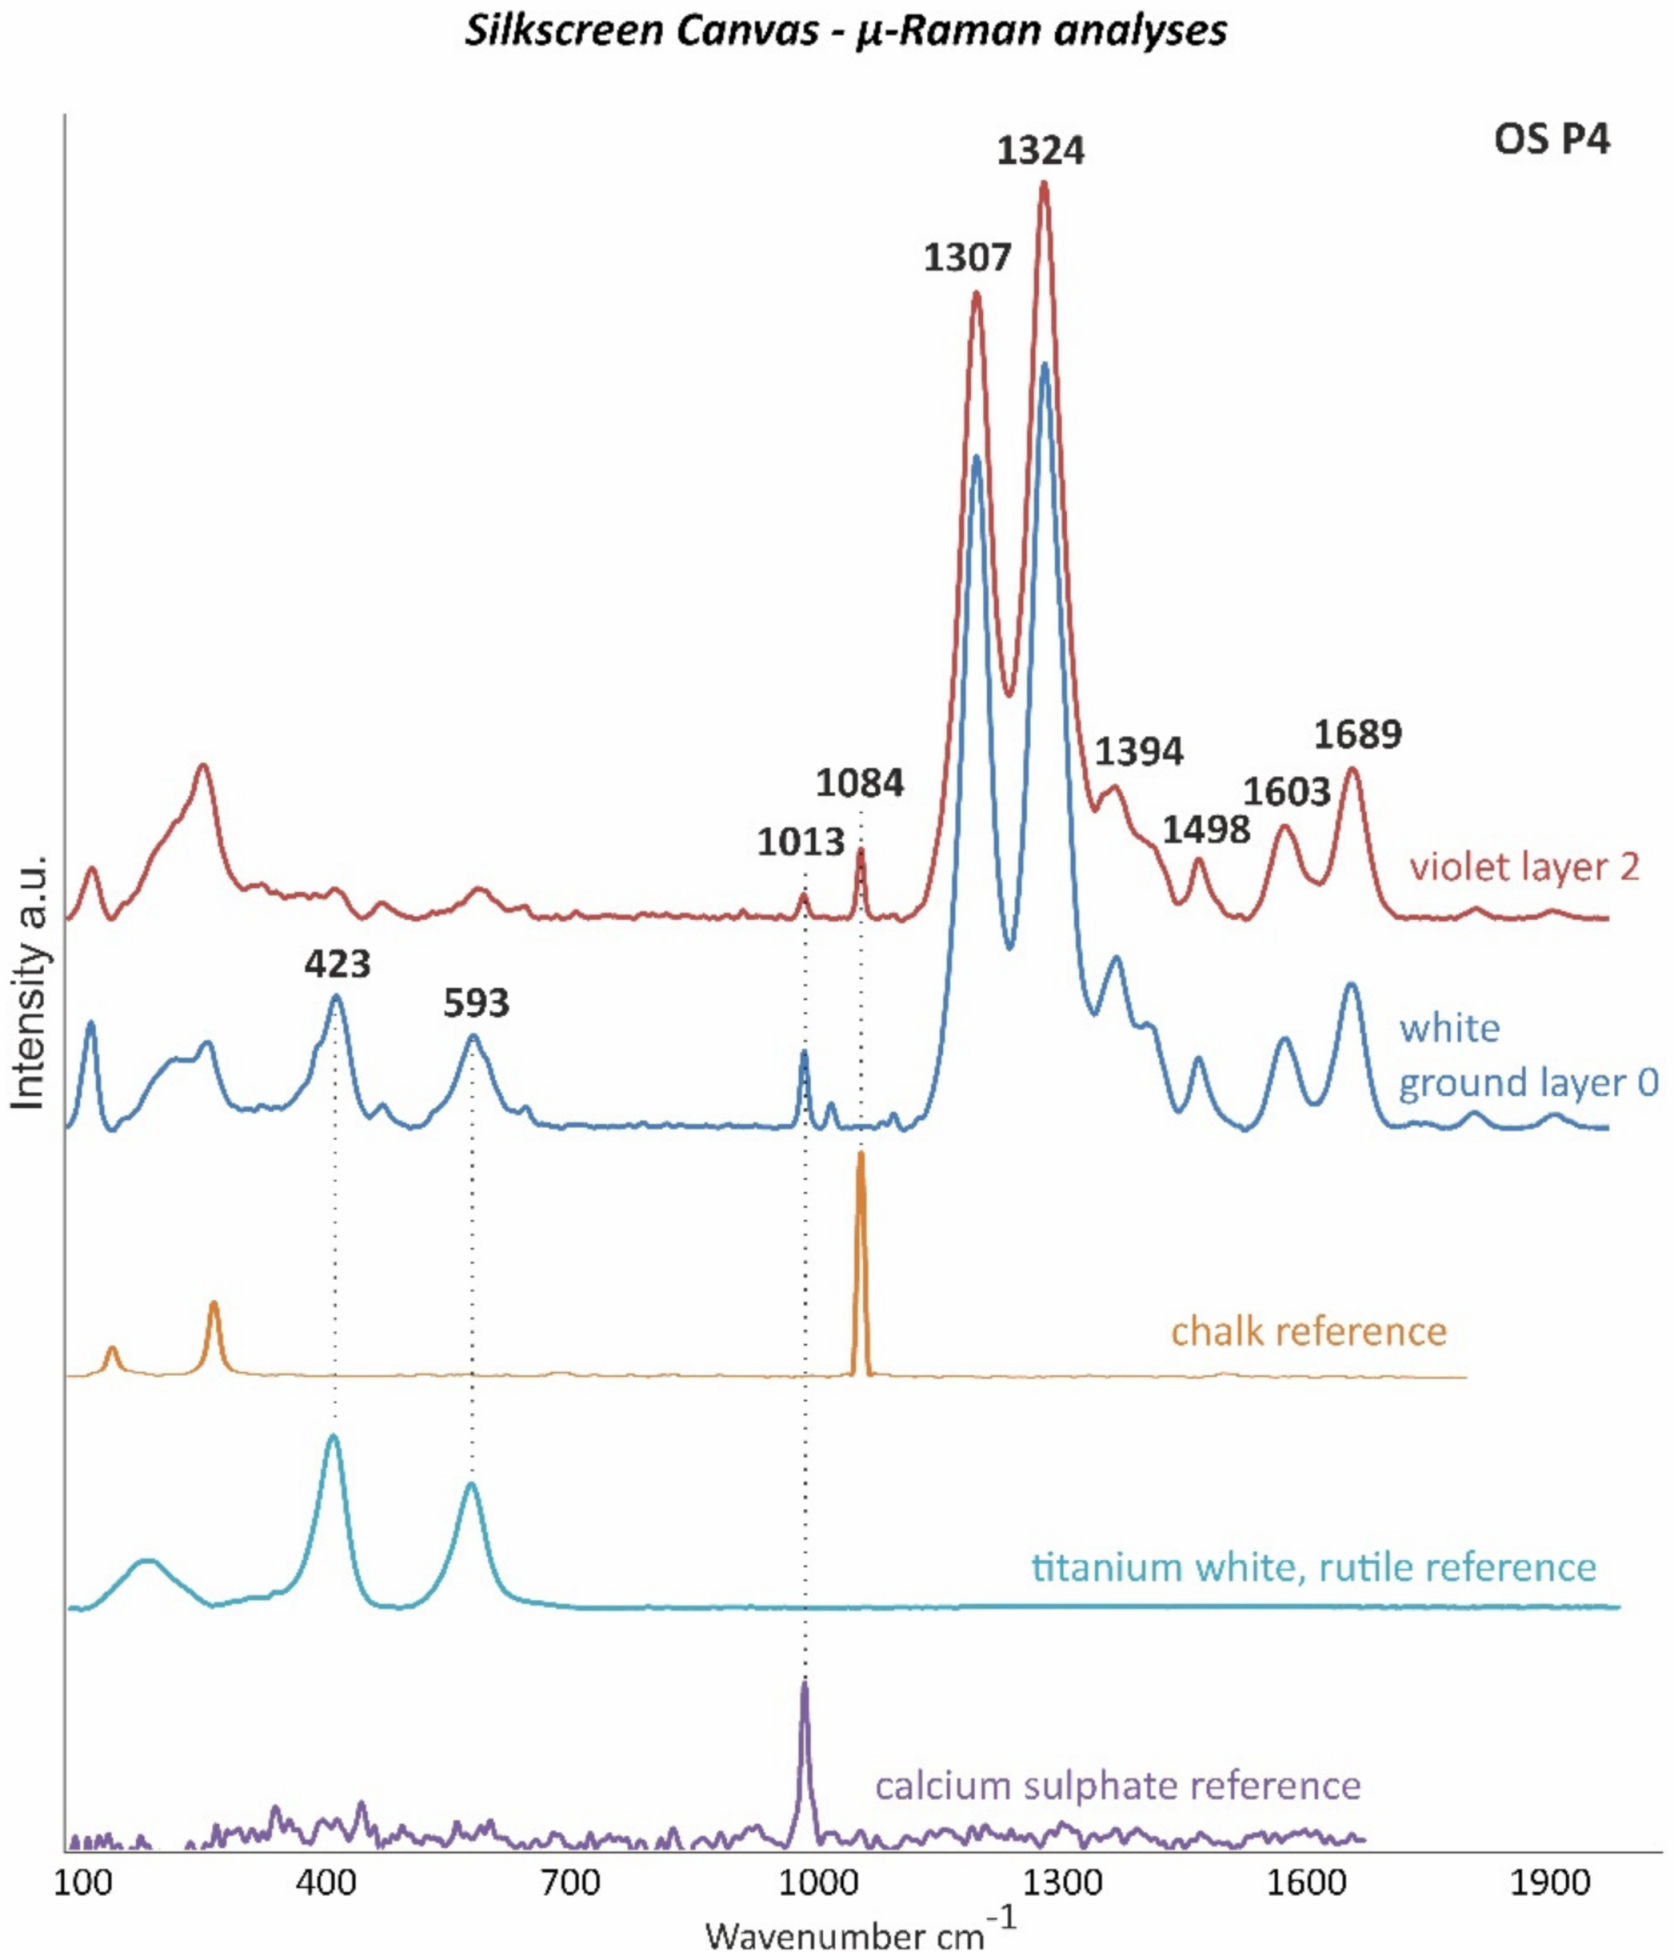
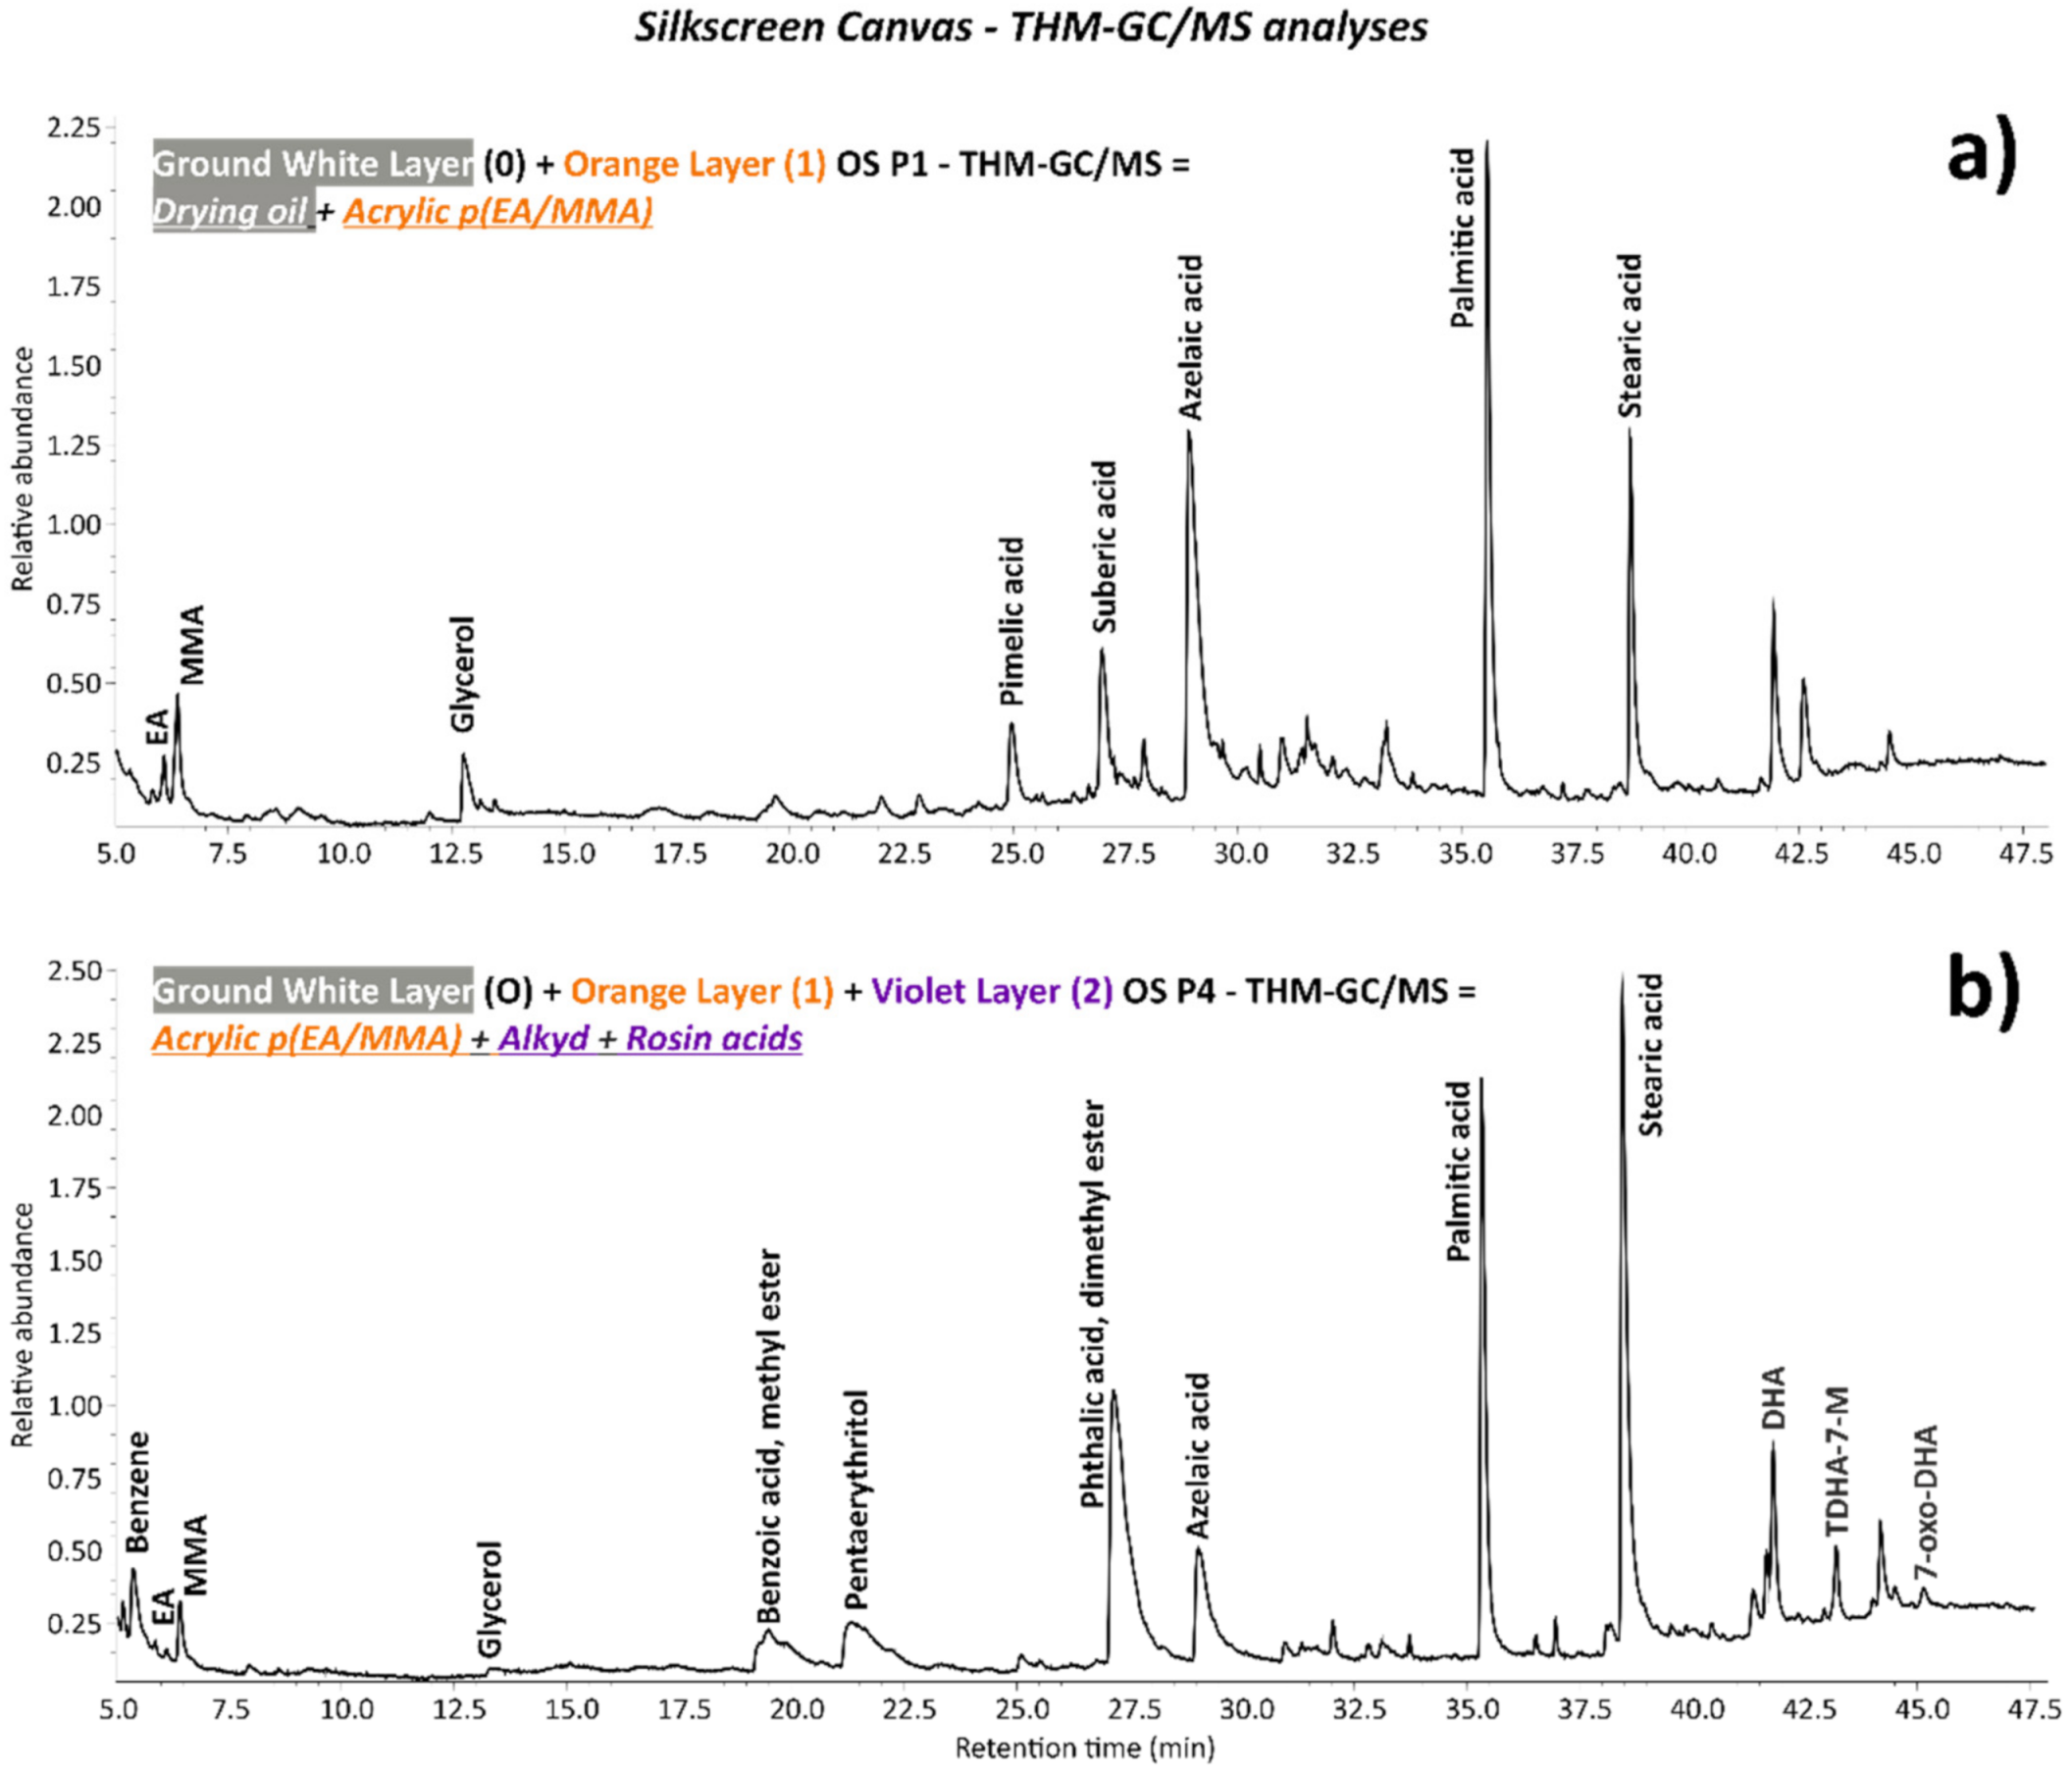
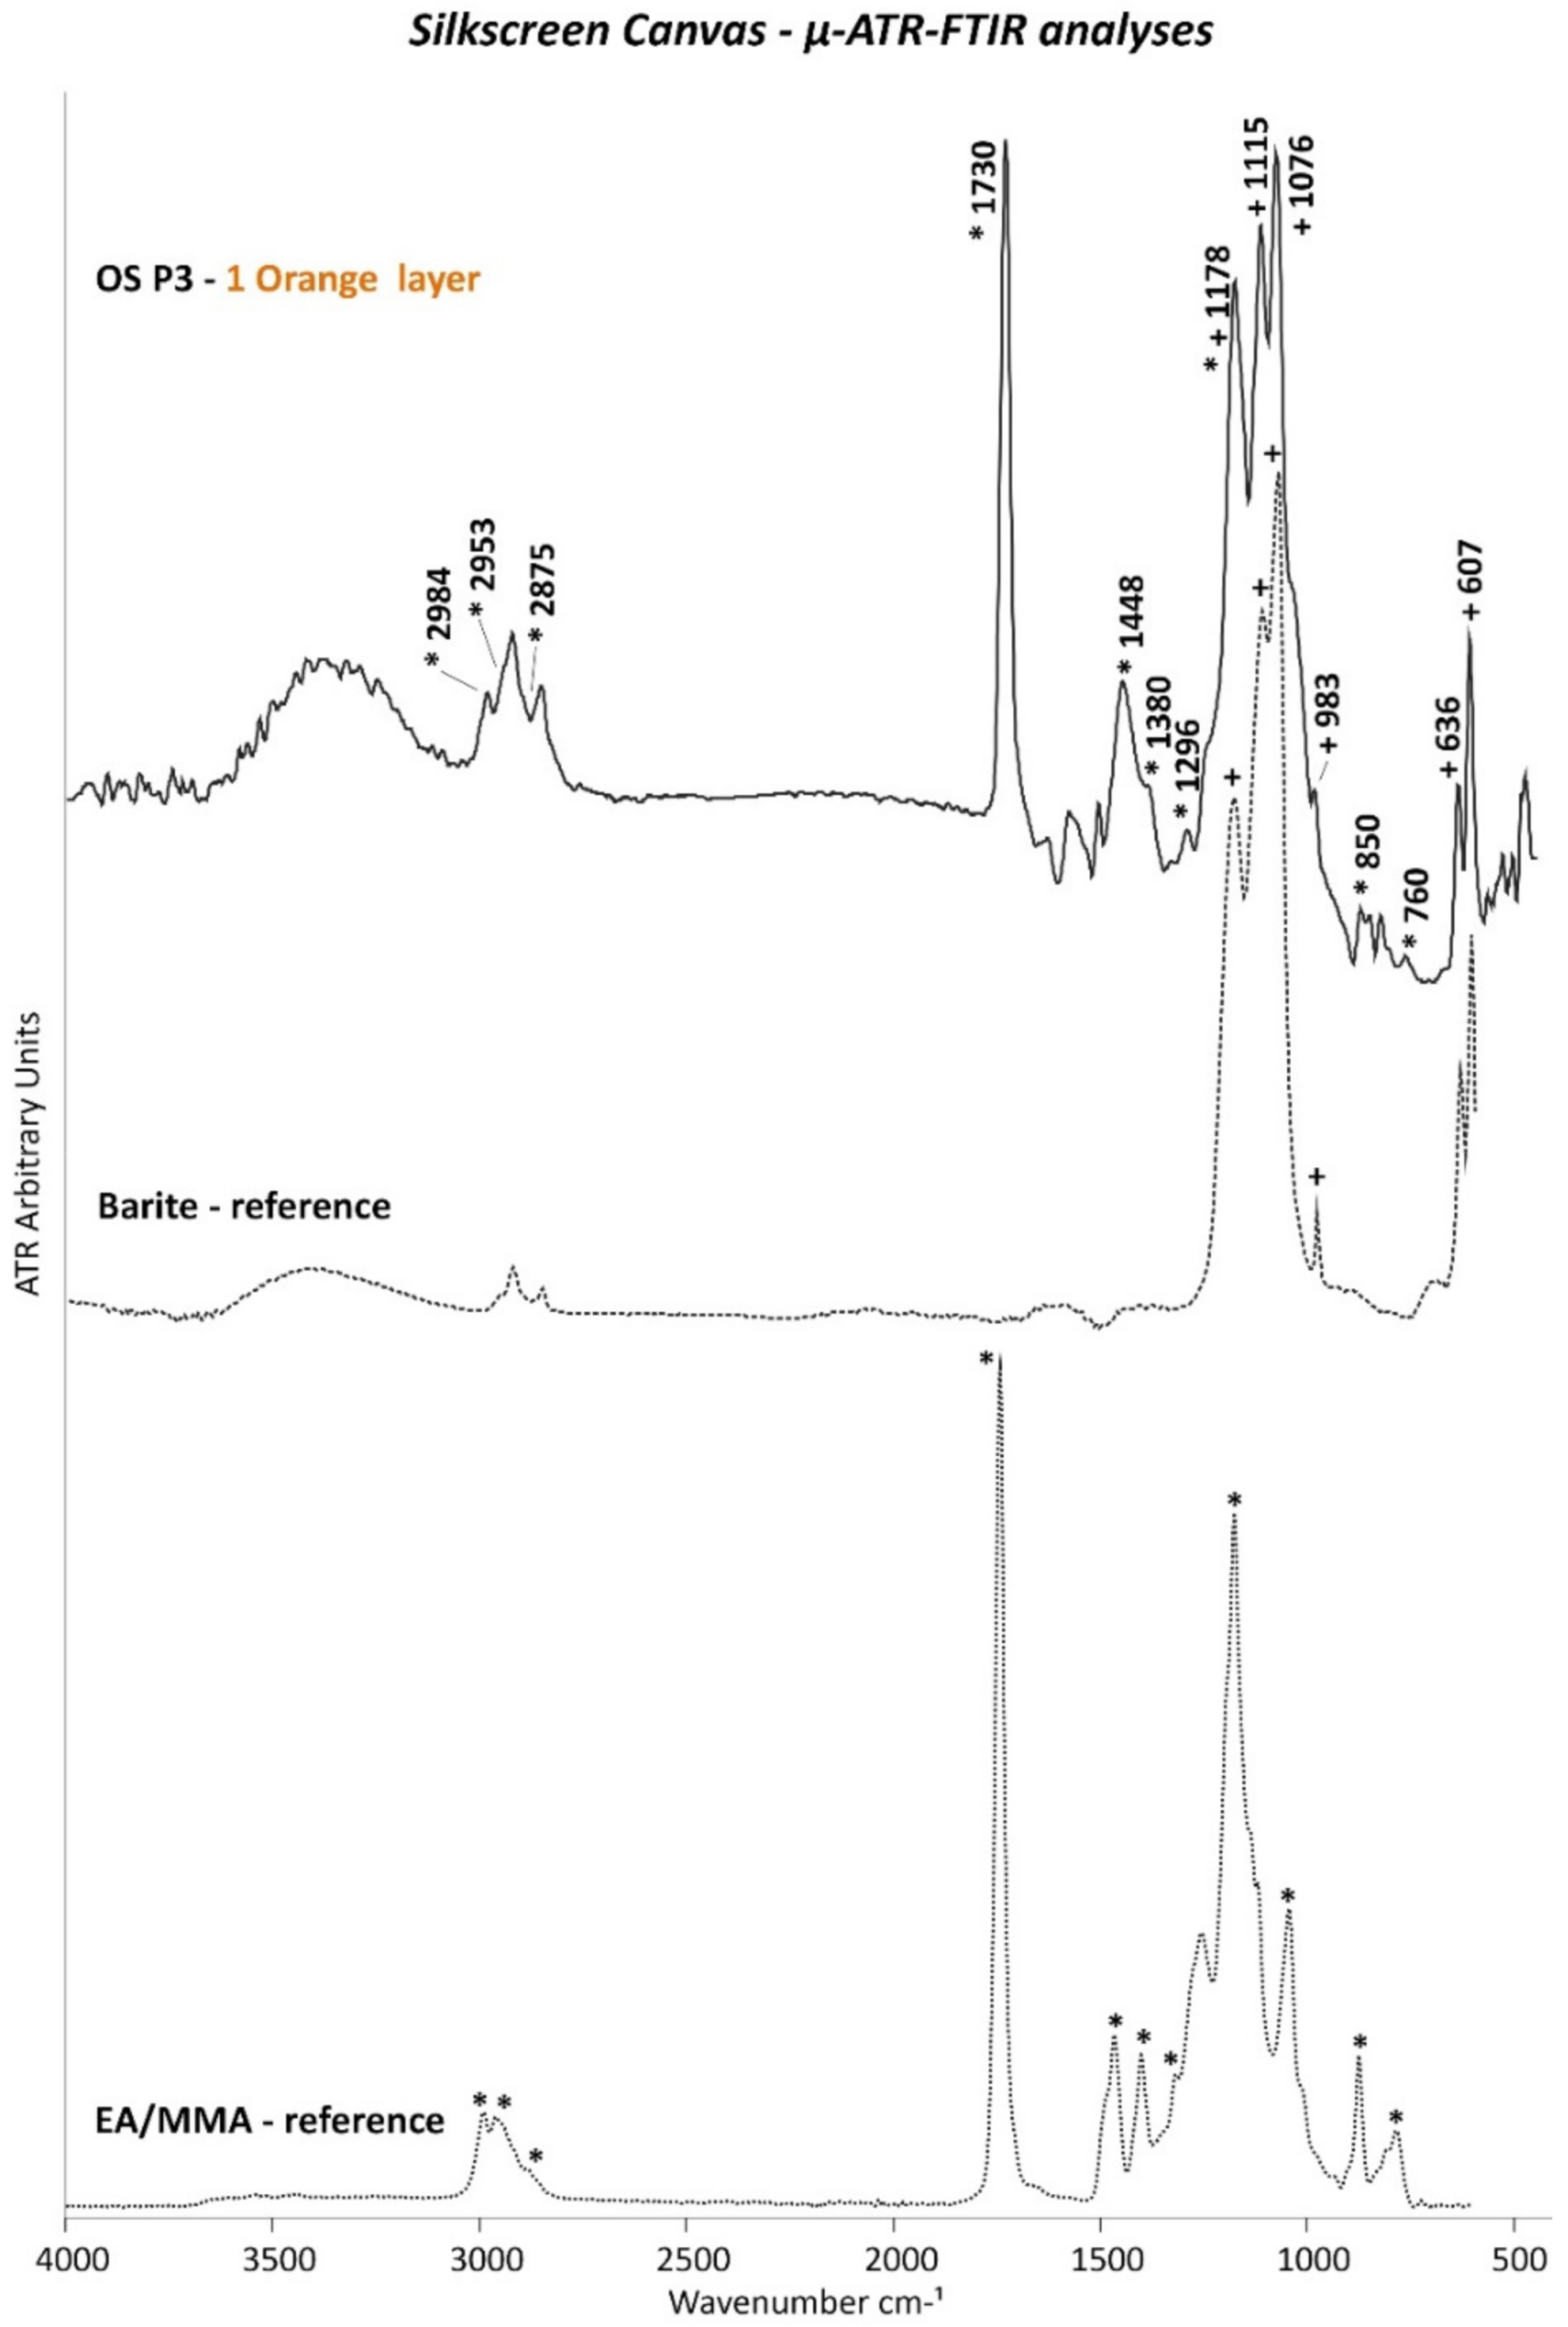
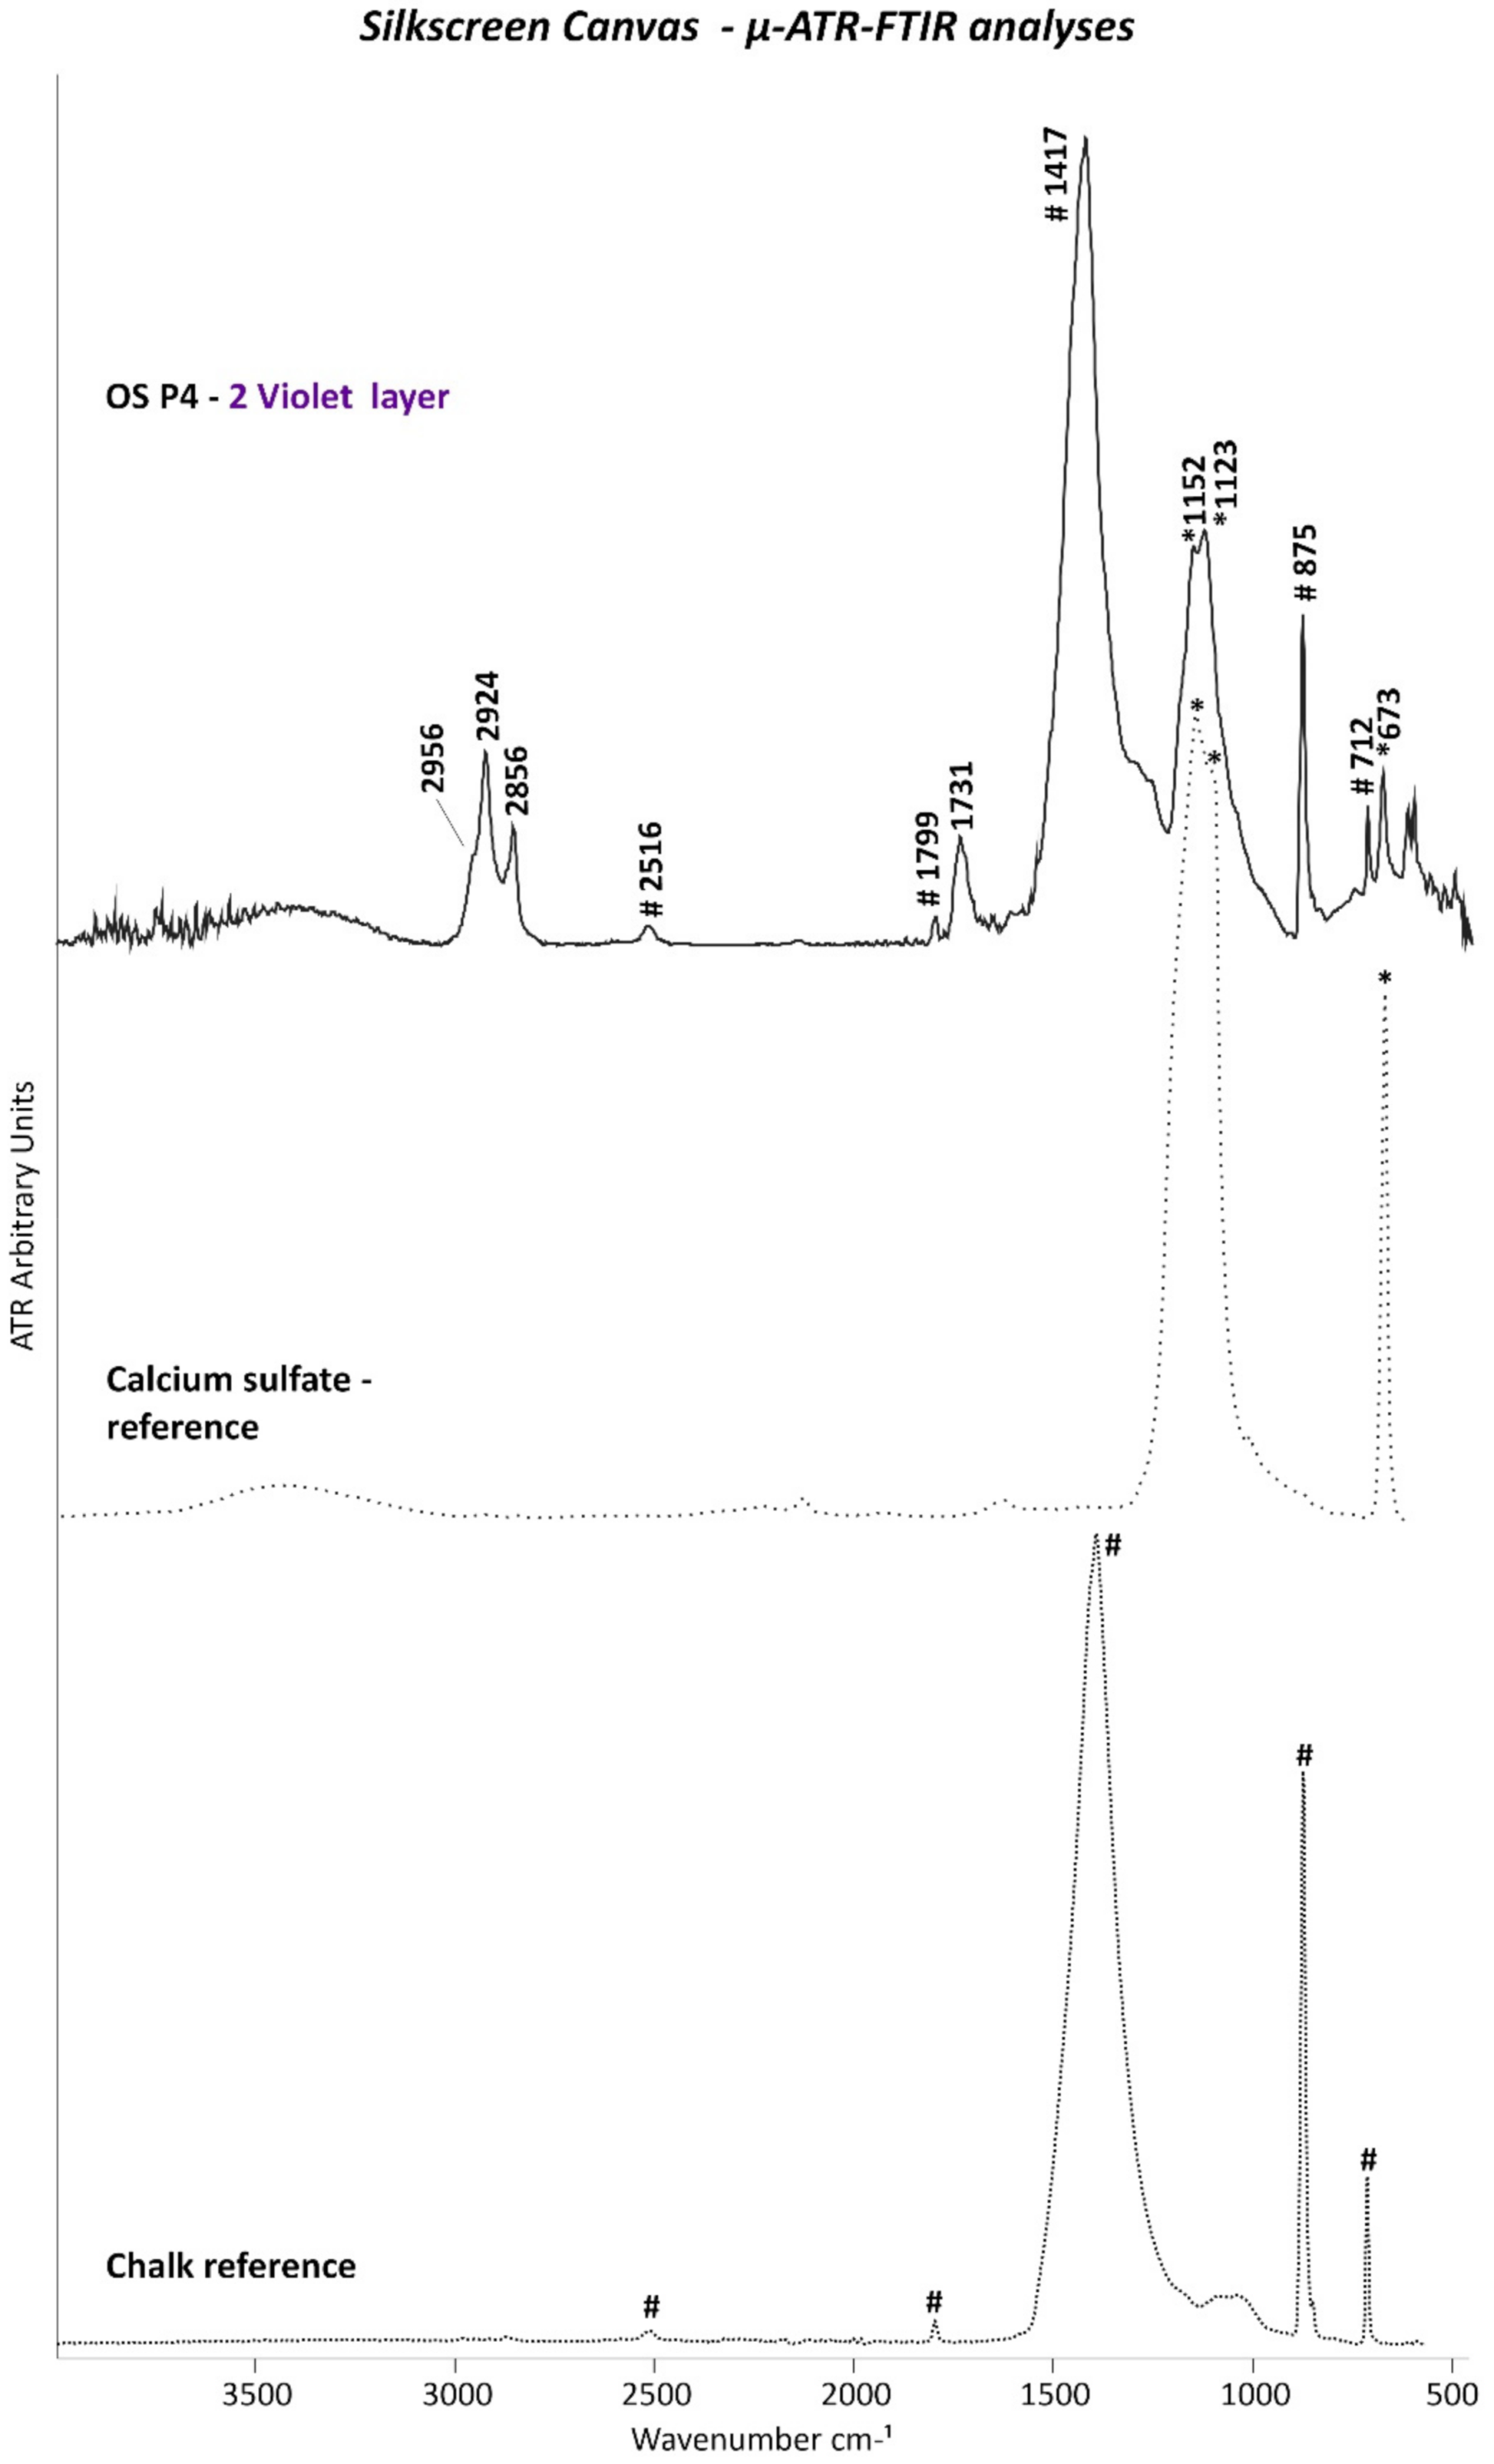
3.2. Silkscreen Canvas
4. Conclusions
Author Contributions
Funding
Institutional Review Board Statement
Informed Consent Statement
Data Availability Statement
Acknowledgments
Conflicts of Interest
References
- Frei, G.; Printz, N. The Andy Warhol Catalogue Raisonné Vol. 01: Paintings and Sculptures 1961–1963; Phaidon Press: New York, NY, USA, 2002; p. 468. [Google Scholar]
- Crook, J.; Learner, T. The Impact of Modern Paints; Watson-Guptill Publications: New York, NY, USA, 2000. [Google Scholar]
- Schilling, M.R.; Mazurek, J.; Learner, T. Studies of modern oil-based artists’ paintmedia by gas chromatography/mass spectrometry. In Modern Paints Uncovered; Learner, T., Smithen, P., Krueger, J., Schilling, M., Eds.; The Getty Conservation Institute: Los Angeles, CA, USA, 2007; pp. 129–139. [Google Scholar]
- Learner, T. Analysis of Modern Paints; The Getty Conservation Institute: Los Angeles, CA, USA, 2004. [Google Scholar]
- Learner, T.; Chiantore, O.; Scalarone, D. Ageing studies on acrylic emulsion paints. In Proceedings of the ICOM Committee for Conservation, ICOM-CC: 13th Triennial Meeting, Rio de Janeiro, Brazil, 22–27 September 2002; James & James: London, UK, 2002; pp. 911–919. [Google Scholar]
- Chiantore, O.; Scalarone, D.; Learner, T. Characterisation of artists’ acrylic emulsion paints. Int. J. Polym. Anal. Charact. 2003, 8, 67–82. [Google Scholar] [CrossRef]
- Learner, T. The analysis of synthetic resins found in twentieth-century paint media. In Proceedings of the Resins—Ancient and Modern, Preprints of the SSCR Conference, Aberdeen, UK, 13–14 September 1995; Wright, M.M., Townsend, J.H., Eds.; Scottish Society for Conservation and Restoration: Edinburgh, UK, 1995; pp. 76–84. [Google Scholar]
- Pintus, V.; Schreiner, M. Characterization and identification of acrylic binding media: Influence on UV light on the ageing process. Anal. Bioanal. Chem. 2011, 399, 2961–2976. [Google Scholar] [CrossRef] [PubMed]
- Wei, S.; Pintus, V.; Schreiner, M. A comparison study of alkyd resin used in art works by Py-GC//MS and GC/MS: The influence of ageing. J. Anal. Appl. Pyrolysis 2013, 104, 441–447. [Google Scholar] [CrossRef]
- Pintus, V.; Wei, S.; Schreiner, M. UV ageing studeis: Evaluation of lightfastness declarations of commercial acrylic paints. Anal. Bioanal. Chem. 2012, 402, 1567–1584. [Google Scholar] [CrossRef] [PubMed]
- Fardi, T.; Kampasakali, E.; Terzopoulou, Z.; Pintus, V.; Pavlidou, E.; Schreiner, M.; Bikiaris, D.; Kyriacou, G. A preliminary study on the physicochemical properties of pigmented Sty/nBA/MMA emulsion films: The effect of thermal ageing. Polym. Degrad. Stabil. 2018, 158, 157–167. [Google Scholar] [CrossRef]
- Haswell, R.; Carlyle, L.; Mensch, K.T.J. Quantitative Determination of van Gogh’s Painting Grounds Using SEM/EDX. Microsc. Microanal. 2011, 17, 656–690. [Google Scholar] [CrossRef] [PubMed]
- Castellá, F.; Pérez-Estebanez, M.; Mazurek, J.; Monkes, P.; Learner, T.; Niello, J.F.; Tascón, M.; Marte, F. A multi-analytical approach for the characterization of modern white paints used for Argentine concrete art paintings during 1940–1960. Talanta 2019, 208, 120472. [Google Scholar] [CrossRef] [PubMed]
- Košařová, V.; Hradil, D.; Hradilová, J.; Čermáková, Z.; Němec, I.; Schreiner, M. The efficiency of micro-Raman spectroscopy in the analysis of complicated mixtures in modern paints: Munch’s and Kupka’s paintings under study. Spectrochim. Acta A 2016, 156, 36–46. [Google Scholar] [CrossRef] [PubMed]
- Anghelone, M.; Stoytschew, V.; Jembrih-Simbuerger, D.; Schreiner, M. Spectroscopic methods for the identification and photostability study of red synthetic organic pigments in alkyd and acrylic paints. Microchem. J. 2018, 139, 155–163. [Google Scholar] [CrossRef]
- Ormsby, B.; Miliani, C.; Learner, T. An FTIR-based exploration of the effects of wet cleaning treatments on artist’s acrylic emulsion paint films. e-PS 2009, 6, 186–195. [Google Scholar]
- Goldmann, M. Examination and Treatment of Early Andy Warhol Hand-Colored Lithographs. Stud. Conserv. 2016, 47, 78–82. [Google Scholar] [CrossRef]
- Picollo, M.; Bacci, M.; Magrini, D.; Radicati, B.; Trumpy, G.; Tsukada, M.; Kunzelman, D. Modern White Pigments: Their Identification by Means of non Invasive Ultraviolet, Visible and Infrared Fiber Optic Reflectance Spectroscopy. In Modern Paints Uncovered; Learner, T., Smithen, P., Krueger, J., Schilling, M., Eds.; The Getty Conservation Institute: Los Angeles, CA, USA, 2007; pp. 118–128. [Google Scholar]
- Pitthart, V.; Griesser, M.; Stanek, S.; Bayerova, T. Study of complex binding media systems on artwork applying GC-MS analysis: Selected examples from the Kunsthistorisches Museum. Macromol. Symp. 2006, 238, 37–45. [Google Scholar] [CrossRef]
- Mills, J.S.; White, R. The Organic Chemistry of Museum Objects; A. Odd: Oxford, UK, 1994. [Google Scholar]
- Colombini, M.P.; Modugno, F.; Giacomelli, M.; Francesconi, S. Characterization of proteinaceous and drying oils in wall painting samples by gas chromatography-mass spectrometry. J. Chromatogr. A 1999, 846, 113–124. [Google Scholar] [CrossRef]
- Wei, S.; Schreiner, M.; Rosenberg, E.; Guo, H.; Ma, Q. Identification of the binding media in Tang Dinasty Chinese wall paintings by using Py-GC/MS and GC/MS techniques. J. Int. Conserv. Sci. 2011, 2, 77–88. [Google Scholar]
- Valianou, L.; Wei, S.; Mubarak, M.S.; Farmakalidis, H.; Stassinopolous, S.; Rosenberg, E.; Karapanagiotis, I. Identification of organic materials inicons of the Cretan school of Iconography. J. Archaeol. Sci. 2011, 38, 246–254. [Google Scholar] [CrossRef]
- Dron, J.; Linke, R.; Rosenberg, E.; Schreiner, M. Trimethylsulfonium hydroxide as derivatizatiuon reagent for the chemical investigation of drying oils in works of art by gas chromatography. J. Chromatogr. A. 2004, 1047, 111–116. [Google Scholar] [CrossRef] [PubMed]
- Nawar, W.W.; Witchwoot, A. Autoxidation of oil and fats at elevated temperaturers. In Autoxidation in Food and Biological Systems; Simic, M.G., Karel, M., Eds.; Plenum Press: New York, NY, USA, 1980; pp. 207–221. [Google Scholar]
- Hartgers, W.A.; Sinninghe Damsté, J.S.; De Leeuw, J.W. Curie-point pyrolysis of sodium salts of functionalized fatty acids. J. Anal. Appl. Pyrol. 1995, 34, 191–217. [Google Scholar] [CrossRef][Green Version]
- Bonaduce, I.; Andreotti, A. Py-GC/MS of Organic Paint Binders. In Organic Mass Spectrometry in Art and Archaeology; Colombini, M.P., Modugno, F., Eds.; John Wiley & Sons (Verlag), Ltd.: Hoboken, NJ, USA, 2009; pp. 303–326. [Google Scholar]
- Cappitelli, F.; Learner, T.; Chiantore, O. An initial assessment of thermally assisted hydrolysis and methylation-gas chromatography/mass spectrometry for the identification of oils from dries paint films. J. Anal. Appl. Pyrol. 2002, 63, 339–348. [Google Scholar] [CrossRef]
- Andreotti, A.; Bonaduce, I.; Colombini, M.P.; Gautier, G.; Modugno, F.; Ribechini, E. Combined GC/MS Analytical Procedure for the Characterization of Glycerolipid, Waxy, Resinous, and Proteinaceous Materials in a Unique Paint Microsample. Anal. Chem. 2006, 78, 4490–4500. [Google Scholar] [CrossRef]
- Van der Weerd, J.; Van Loon, A.; Boon, J.J. FTIR studies of the effects of pigments on the ageing of oil. Stud. Conserv. 2005, 50, 3–22. [Google Scholar] [CrossRef]
- Eastaugh, N. Pigment Compendium: A Dictionary and Optical Microscopy of Historical Pigments; Butterworth-Heinemann: Amsterdam, The Netherlands, 2008. [Google Scholar]
- Fiedler, I.; Bayard, M.A. Cadmium Yellows, Oranges and Reds. In Artist´ Pigments Volume 1; Feller, R.L., Ed.; National Gallery of Art: Washington, DC, USA; Archetype Publications: London, UK, 1986; pp. 65–108. [Google Scholar]
- Della Torre Arrigoni, D. Colour in Painting: Materials and Spirituality; lulu.com: Morrisville, NC, USA, 2015; ISBN 978-1-326-45076-2. [Google Scholar]
- Ormsby, O.; Smithen, P.; Hoogland, F.; Miliani, C.; Learner, T. A scientific evaluation of surface cleaning acrylic emulsion paintings. In Proceedings of the ICOM Committee for Conservation, 15th Triennial Conference, New Delhi, India, 22–26 September 2008; Allied Publisher PVT: New Delhi, India, 2008; pp. 865–873. [Google Scholar]
- Izdebska, J.; Thomas, S. Printing on Polymers: Fundamentals and Applications, 1st ed.; William Andrew: Norwich, NY, USA, 2016. [Google Scholar]
- Production of Pigment Composition. U.S. Patent US005366546A, 1994.


| Canvas | Sample Name | Description | Sampling Area | Sample Preparation | OM | SEM/EDX | Py-GC/MS | THM-GC/MS | µ-ATR-FTIR | Raman |
|---|---|---|---|---|---|---|---|---|---|---|
| Monochrome | OM P1 | Orange paint and ground layer | 2 samples from the top foldover edge on the reverse, 152 and 154 cm from the left | 🗴 | 🗴 | 🗴 | ✓ | 🗴 | 🗴 | ✓ |
| OM P2 | Orange paint layer | Loose paint flake on the left tacking margin, 128 cm from the top | 🗴 | 🗴 | 🗴 | ✓ | 🗴 | 🗴 | ✓ | |
| OM P3 | White ground layer | From the left tacking margin, 145.5 cm from the top | 🗴 | 🗴 | 🗴 | 🗴 | ✓ | 🗴 | ✓ | |
| OM P4 | Coating (presumably from restoration 1993) | From various areas in the bottom half of the painting, close to the left edge | 🗴 | 🗴 | 🗴 | ✓ | 🗴 | 🗴 | 🗴 | |
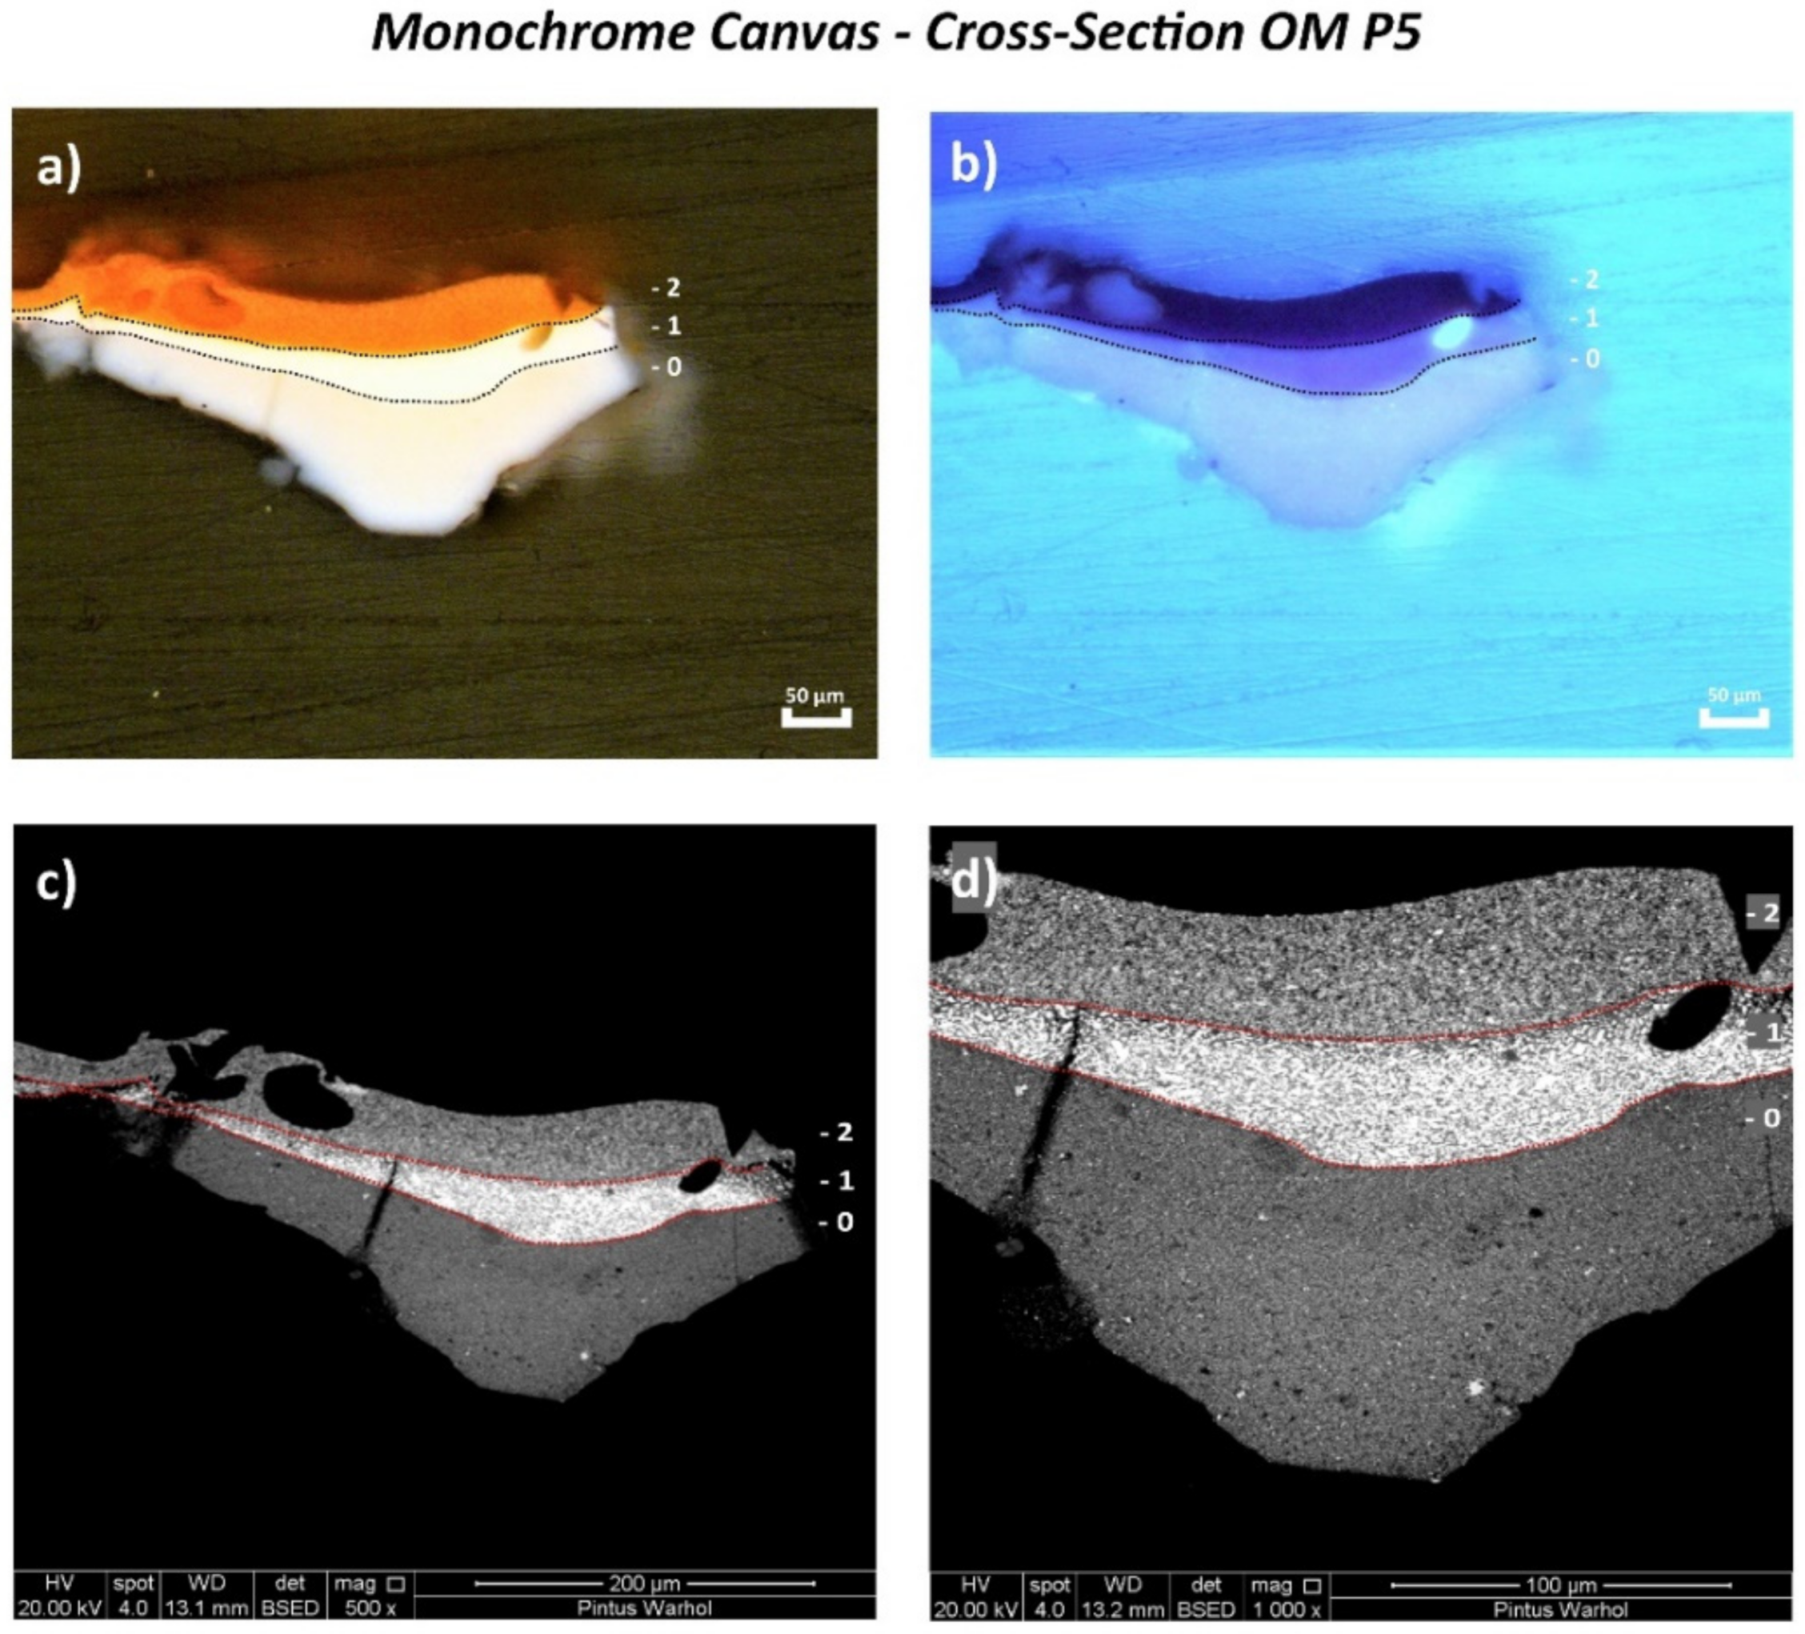
| OM P5 | Orange paint and ground layer | From a loss on the tacking margin on the right side, 144 cm from the top | Cross-section | ✓ | ✓ | 🗴 | 🗴 | ✓ | ✓ | |
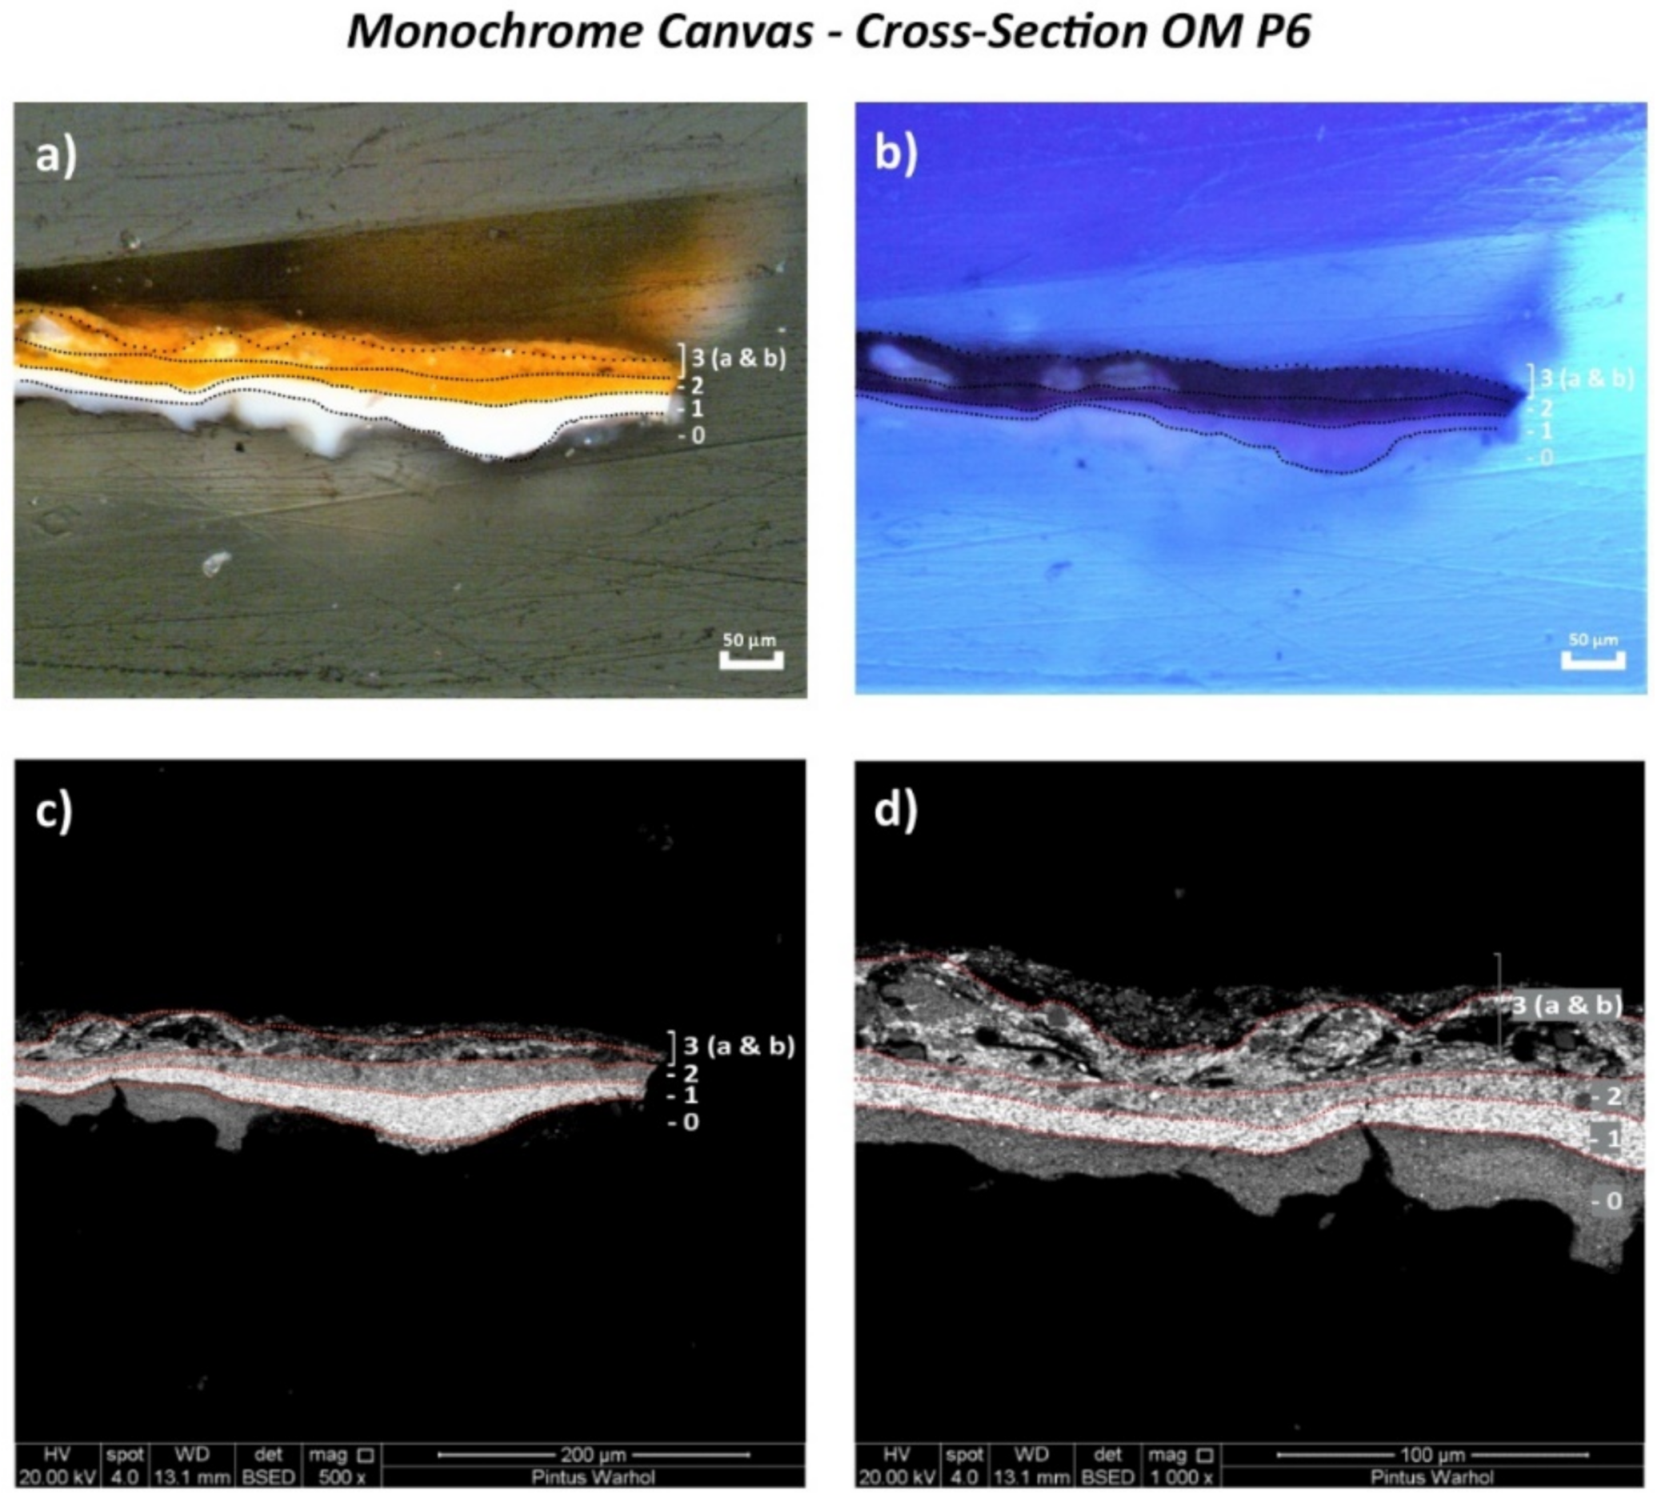
| OM P6 | Orange paint and ground layer | From the tacking margin on the right side, 24.9 cm from the top | Cross-section | ✓ | ✓ | 🗴 | 🗴 | ✓ | ✓ | |
| Silkscreen | OS P1 | Orange paint and ground layer | From the bottom foldover edge on the reverse: 73.3 cm from the left and 2 cm from the bottom | 🗴 | 🗴 | 🗴 | ✓ | 🗴 | 🗴 | ✓ |
| OS P2 | Violet silkscreen paint | 24.8 cm from the left and 120.3 cm from the bottom | 🗴 | 🗴 | 🗴 | ✓ | ✓ | 🗴 | ✓ | |
| OS P3 | Orange paint and ground layer | 115.9 cm from the bottom and 1.4 cm from the right | Cross-section | ✓ | ✓ | 🗴 | 🗴 | ✓ | ✓ | |
| OS P4 | Violet silkscreen paint, orange paint and ground layer | First silkscreen image bottom left: 96 cm from the bottom and 0.2 cm from the left | Cross-section | ✓ | ✓ | ✓ | ✓ | ✓ | ✓ | |
| OS P5 | Orange paint and ground layer | From the foldover edge on the reverse: 73.3 cm from the left and 2 cm from the bottom (same area as for OS P1) | Cross-section | ✓ | ✓ | 🗴 | 🗴 | ✓ | ✓ |
| Canvas | Paint Layer | Color | Pigment Color Index | ID by SEM/EDX | ID by Py-GC/MS | ID by THM-GC/MS | ID by µ-ATR-FTIR | ID by Raman |
|---|---|---|---|---|---|---|---|---|
| Monochrome | 0 | White | PW4 | Zinc white (ZnO) | 🗴 | Linseed oil | Linseed oil | 🗴 |
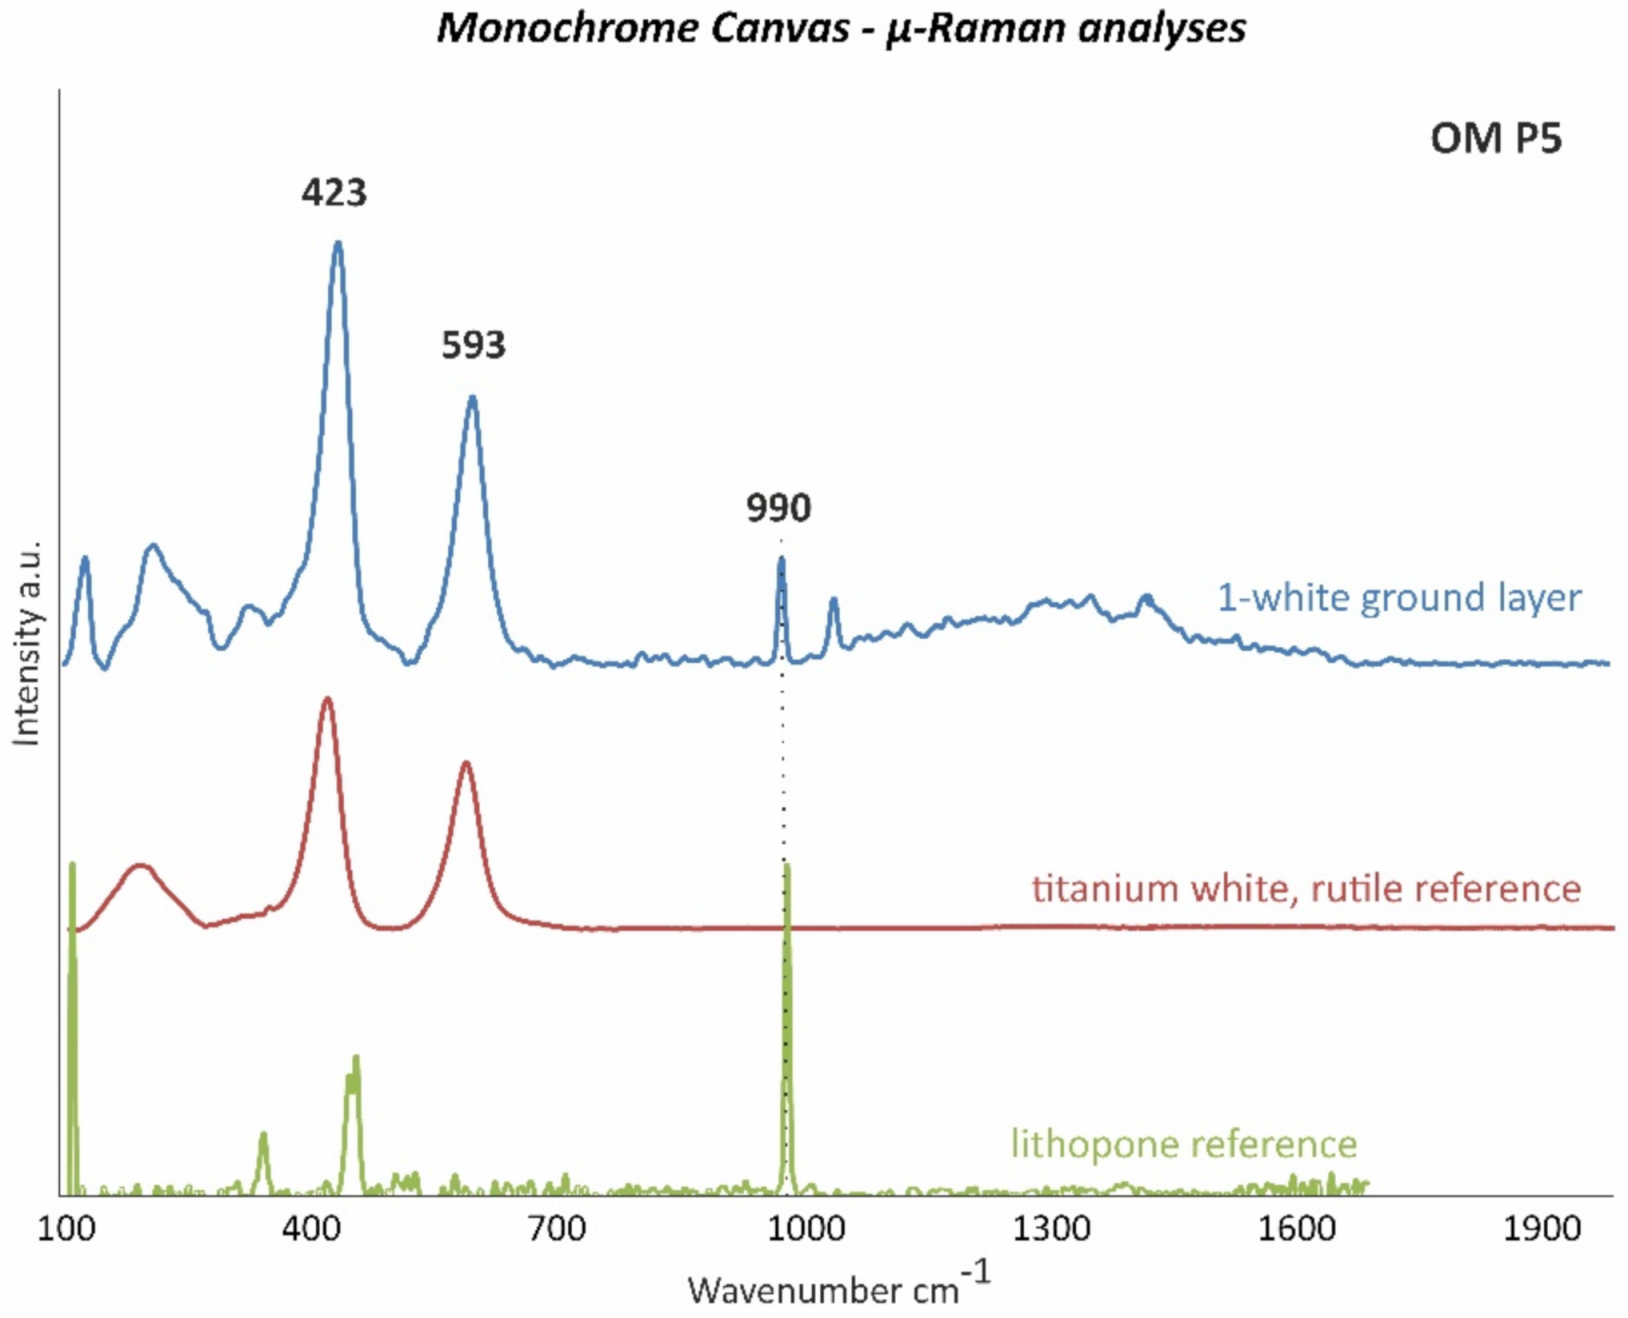
| 1 | White | PW6–PW5 | Titanium white (TiO2), lithopone (barite (BaSO4) + zinc sulphide (ZnS) | 🗴 | Linseed oil | Linseed oil traces, barite (BaSO4) as part of lithopone | Titanium white (TiO2) (rutile), lithopone (barite (BaSO4) + zinc sulphide (ZnS) | |
| 2 | Orange (retouch) | PO20:1 | Cadmium sulfoselenide lithopone orange (CdS,xCdSe + BaSO4) | EA/MMA acrylic | 🗴 | EA/MMA acrylic-barite (BaSO4) as part of cadmium sulfoselenide lithopone | 🗴 | |
| 3 | Restoration overlay | PO20:1–PW18 | Cadmium sulfoselenide lithopone Orange (CdS,xCdSe + BaSO4), chalk (CaCO3) | EA/MMA acrylic | 🗴 | EA/MMA acrylic-barite (BaSO4) as part of cadmium sulfoselenide lithopone, | 🗴 | |
| 4 | Transparent (coating) | 🗴 | 🗴 | nBA/MMA acrylic | 🗴 | 🗴 | 🗴 |
| Canvas | OM P5—Layer | Elements |
|---|---|---|
| Monochrome | 0—White | Zn (+++) |
| 1—White | S (+++), Ti (++), Zn (++), Ba (+), Cd (trace) | |
| 2—Orange | S (+++), Cd (++), Ba (++), Se (trace), Zn (+) | |
| OM P6—Layer | Elements | |
| 0—White | Zn (+++), Ti (trace) | |
| 1—White | S (+++), Ti (+++), Zn (++), Ba (+) | |
| 2—Orange | S (+++), Cd (++), Ba (++), Se (+), Ti (trace), Zn (trace) | |
| 3 (a & b)—Orange | S (+++), Cd (++), Ba (++), Ca (++), Se (+), Zn (trace) |
| Canvas | Paint Layer | Color | Pigment Color Index | ID by SEM/EDX | ID by Py-GC/MS | ID by THM-GC/MS | ID by µ-ATR-FTIR | ID by Raman |
|---|---|---|---|---|---|---|---|---|
| Silkscreen | 0 | White | PW6–PW25 | Titanium white (TiO2), calcium sulphate (CaSO4) | 🗴 | Soya oil | Drying oil, calcium sulphate (CaSO4) | Titanium white (rutile) (TiO2), calcium sulphate (CaSO4) |
| 1 | Orange | PO20:1 | Cadmium sulfoselenide lithopone orange (CdS,xCdSe + BaSO4) | EA/MMA acrylic | EA/MMA acrylic | EA/MMA acrylic, barite (BaSO4) as part of lithopone | 🗴 | |
| 2 | Violet | Unidentified | Calcium sulphate (CaSO4), chalk (CaCO3) | 🗴 | Alkyd, rosin acids | Calcium sulphate (CaSO4), chalk (CaCO3) | Calcium sulphate (CaSO4), chalk (CaCO3) |
| Canvas | OS P3—Layer | Elements |
|---|---|---|
| Silkscreen | 0—White | S (+++), Ca (++), Ti (++), Si (tr.), As (tr.) |
| 1—Orange | S (+++), Cd (++), Ba (++), Ca (+), Se (tr.), Si (tr.) | |
| OS P4—Layer | Elements | |
| 0—White | S (+++), Ca (++), Ti (++), Si (tr.), As (tr.) | |
| 1—White | S (+++), Cd (++), Ba (++), Ca (+), Ti (+), Se (tr.), Si (tr.), | |
| 2—Violet | Ca (+++), S (+), Ti (+), Si (tr.) | |
| OS P5—Layer | Elements | |
| 0—White | S (+++), Ca (++), Ti (++), Si (tr.), As (tr.) | |
| 1—Orange | S (+++), Cd (++), Ba (++), Ca (++), Se (tr.), Ti (tr.), Si (tr.) |
Publisher’s Note: MDPI stays neutral with regard to jurisdictional claims in published maps and institutional affiliations. |
© 2022 by the authors. Licensee MDPI, Basel, Switzerland. This article is an open access article distributed under the terms and conditions of the Creative Commons Attribution (CC BY) license (https://creativecommons.org/licenses/by/4.0/).
Share and Cite
Pintus, V.; Baragona, A.J.; Cappa, F.; Haiml, C.; Hierl, C.; Sterflinger, K.; Schreiner, M. Multi-Analytical Investigations of Andy Warhol’s “Orange Car Crash”: Polymeric Materials in Modern Paints. Polymers 2022, 14, 633. https://doi.org/10.3390/polym14030633
Pintus V, Baragona AJ, Cappa F, Haiml C, Hierl C, Sterflinger K, Schreiner M. Multi-Analytical Investigations of Andy Warhol’s “Orange Car Crash”: Polymeric Materials in Modern Paints. Polymers. 2022; 14(3):633. https://doi.org/10.3390/polym14030633
Chicago/Turabian StylePintus, Valentina, Anthony J. Baragona, Federica Cappa, Christa Haiml, Christina Hierl, Katja Sterflinger, and Manfred Schreiner. 2022. "Multi-Analytical Investigations of Andy Warhol’s “Orange Car Crash”: Polymeric Materials in Modern Paints" Polymers 14, no. 3: 633. https://doi.org/10.3390/polym14030633
APA StylePintus, V., Baragona, A. J., Cappa, F., Haiml, C., Hierl, C., Sterflinger, K., & Schreiner, M. (2022). Multi-Analytical Investigations of Andy Warhol’s “Orange Car Crash”: Polymeric Materials in Modern Paints. Polymers, 14(3), 633. https://doi.org/10.3390/polym14030633