
Use of Fourier Series in X-ray Diffraction (XRD) Analysis and Fourier-Transform Infrared Spectroscopy (FTIR) for Estimation of Crystallinity in Cellulose from Different Sources

 , ,
, ,  , , , ,
  and
and 
Abstract
1. Introduction
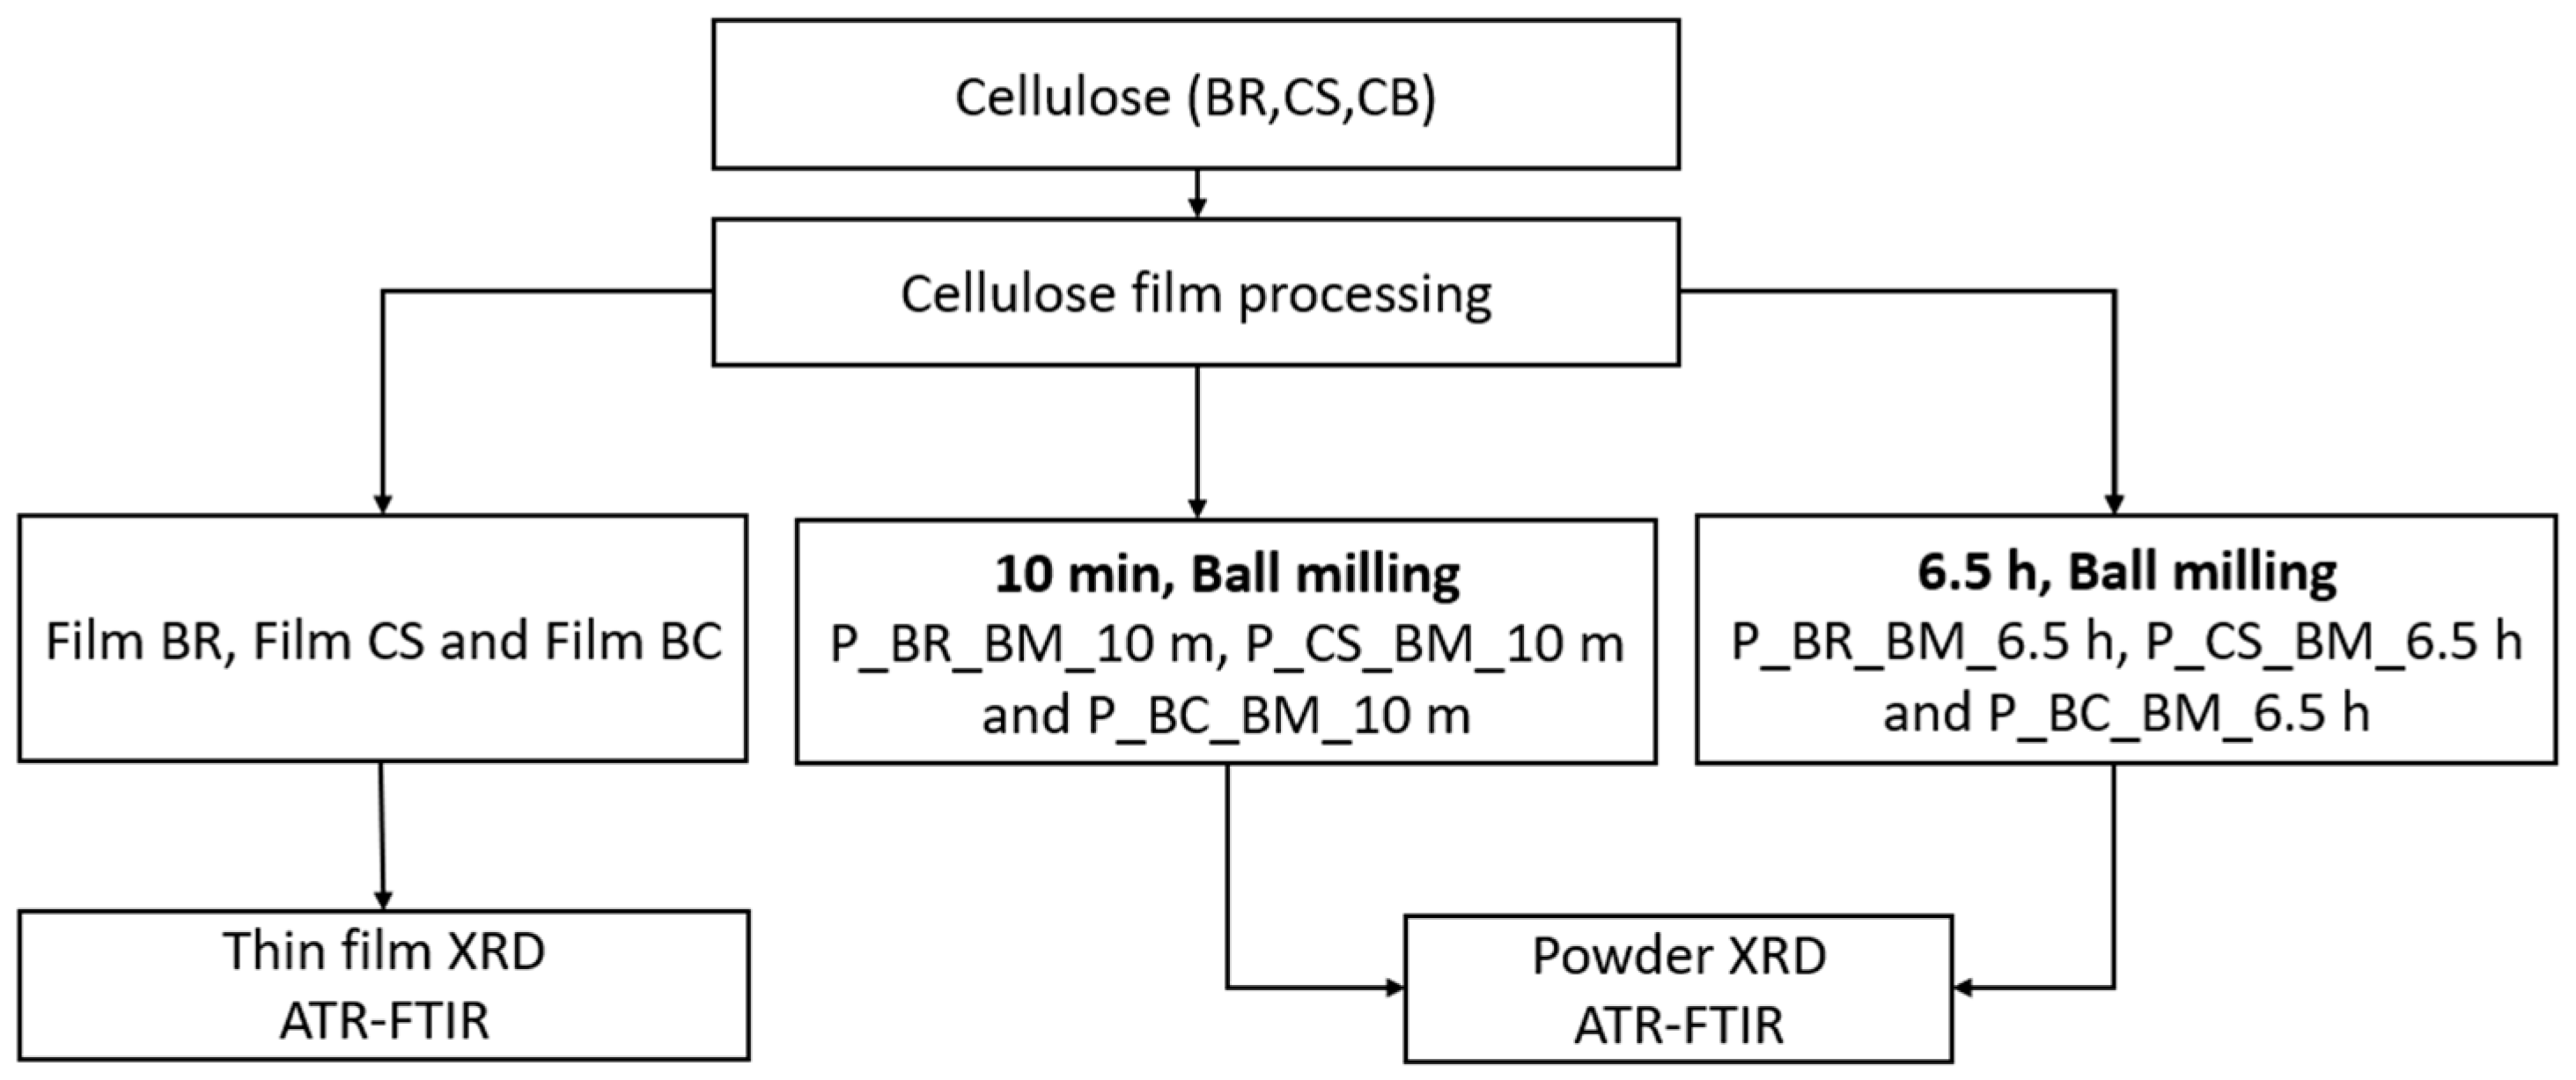
2. Materials and Methods
2.1. Materials
2.2. Ball-Milling Treatment
2.3. Attenuated Total Reflection–Fourier-Transform Infrared Spectroscopy (ATR-FTIR)
2.4. X-ray Diffraction (XRD)
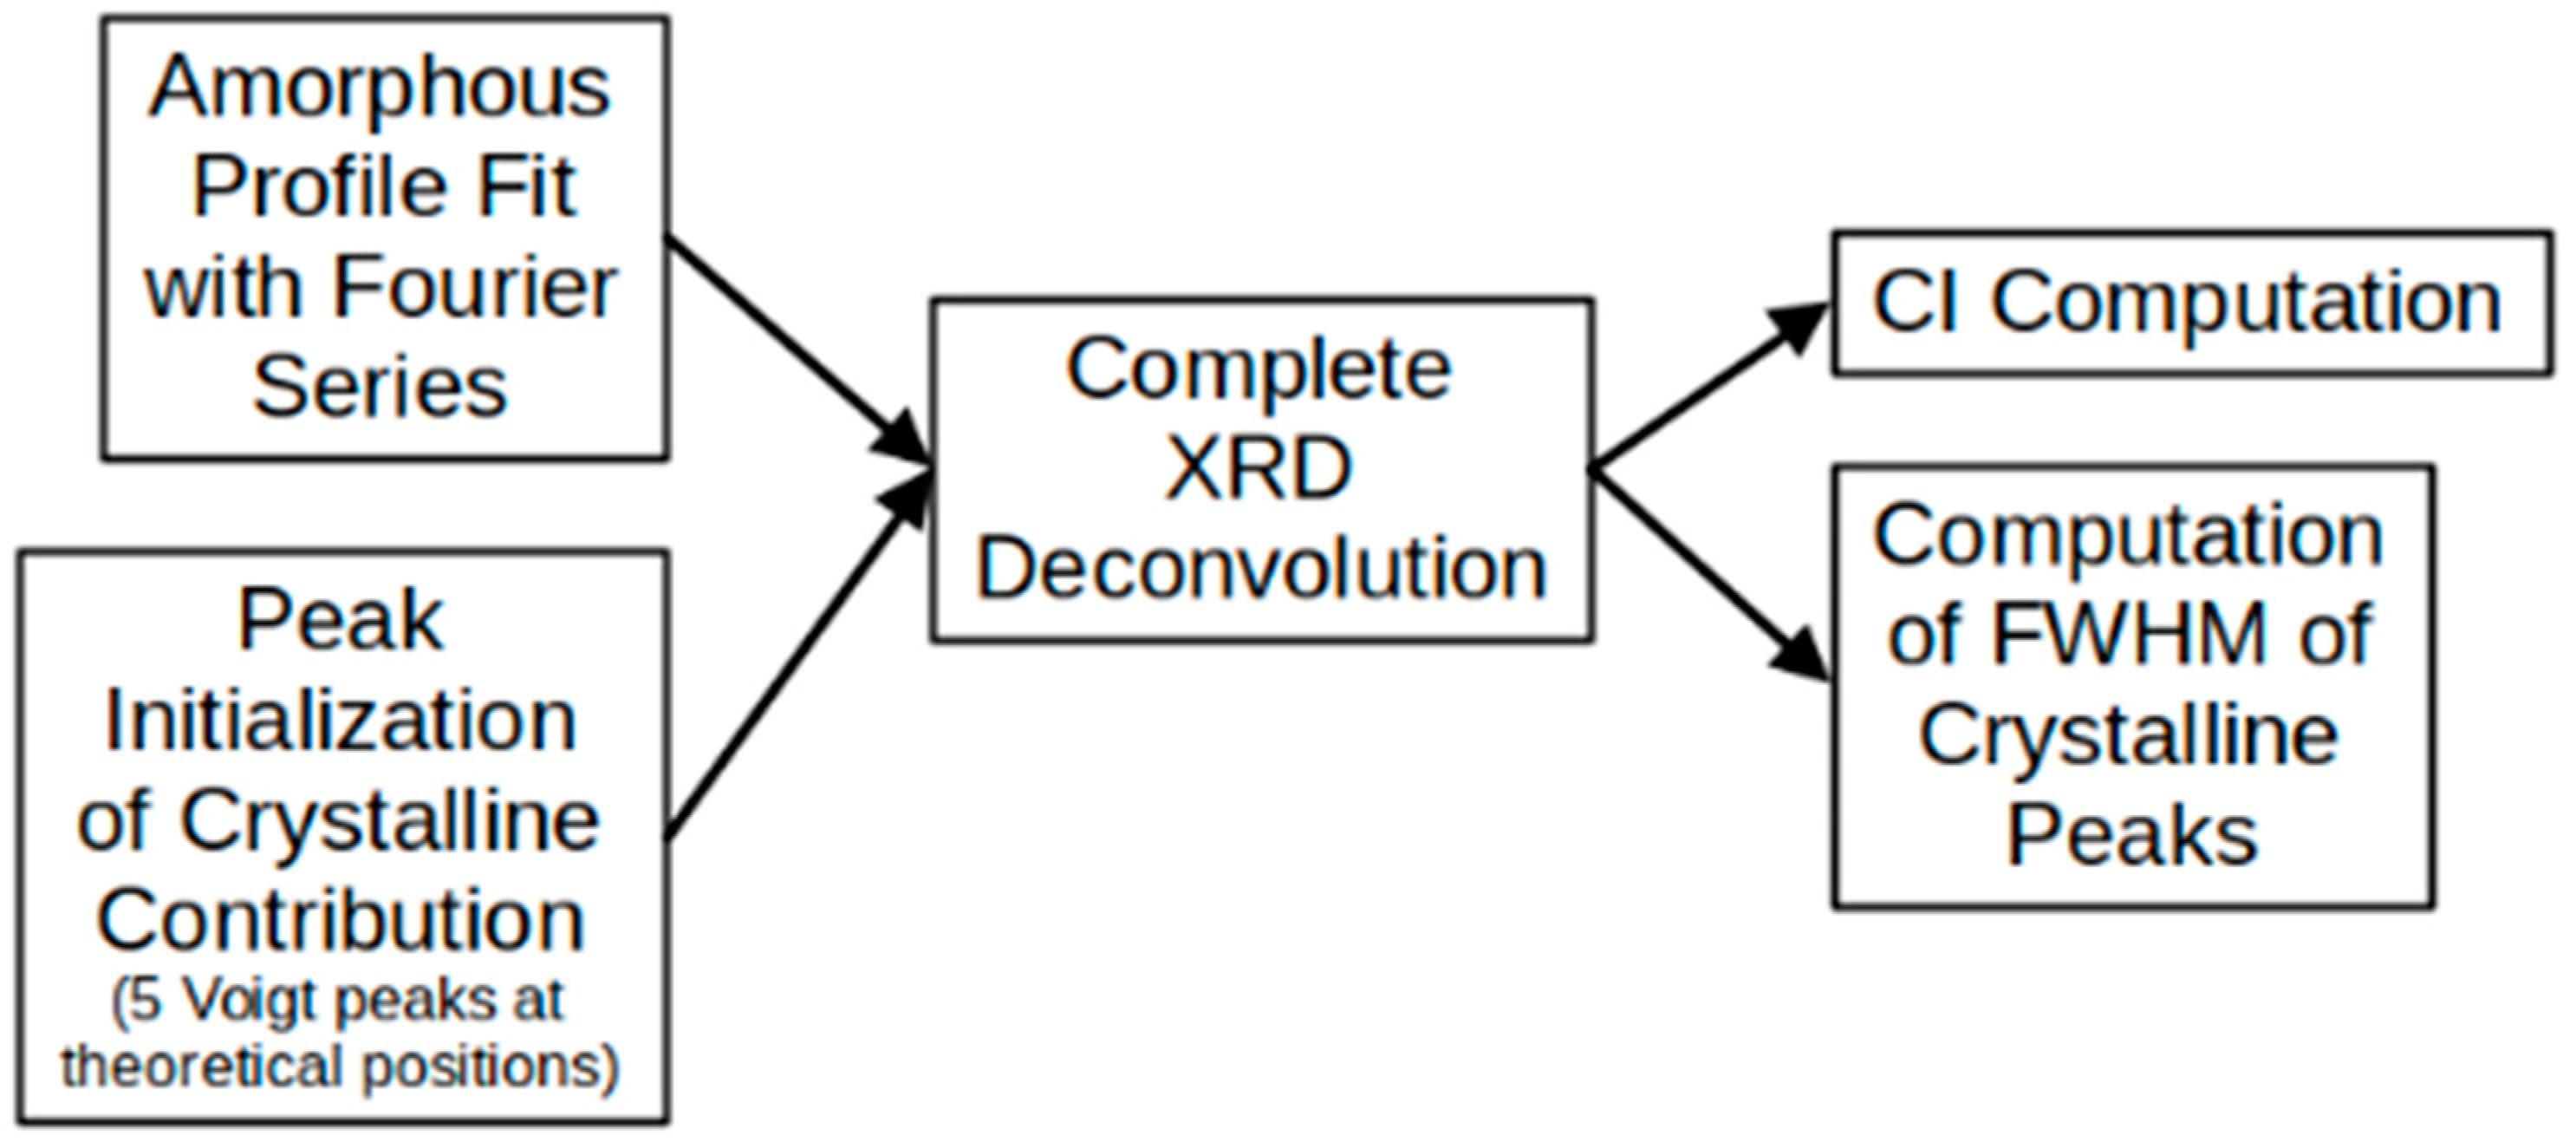
2.5. Amorphous Profile Fitting
2.6. Peak Deconvolution
- represents the estimate of the entire XRD diffractogram;
- represents the diffraction angle, which is an independent variable;
- represents the set of defining parameters of the n-th peak (e.g., position in horizontal axis, width, etc.);
- denotes the linear combination coefficient corresponding to the n-th peak;
- represents the fitted amorphous profile of the type of cellulose under study;
- denotes the peak function describing the n-th crystalline peak and represents the total number of peaks considered for the deconvolution (with peaks forming the crystalline contribution).
- The coefficients were never allowed to be negative.
- For the amorphous peak ( in Equation (1)), although its position on the horizontal axis represents an option that can be adjusted in the optimization routine, it was restricted to between 18 and 20 2θ.
- For the Voigt peaks, in general, since they correspond to a convolution of a Gaussian function and a Lorentzian function, in addition to their positions on the horizontal axis, both the Gaussian and the Lorentzian widths are available for adjustment by the optimization routine. In this case, the centers of the peaks were allowed to move in a range of 0–0.4 [29,31].
3. Results and Discussion
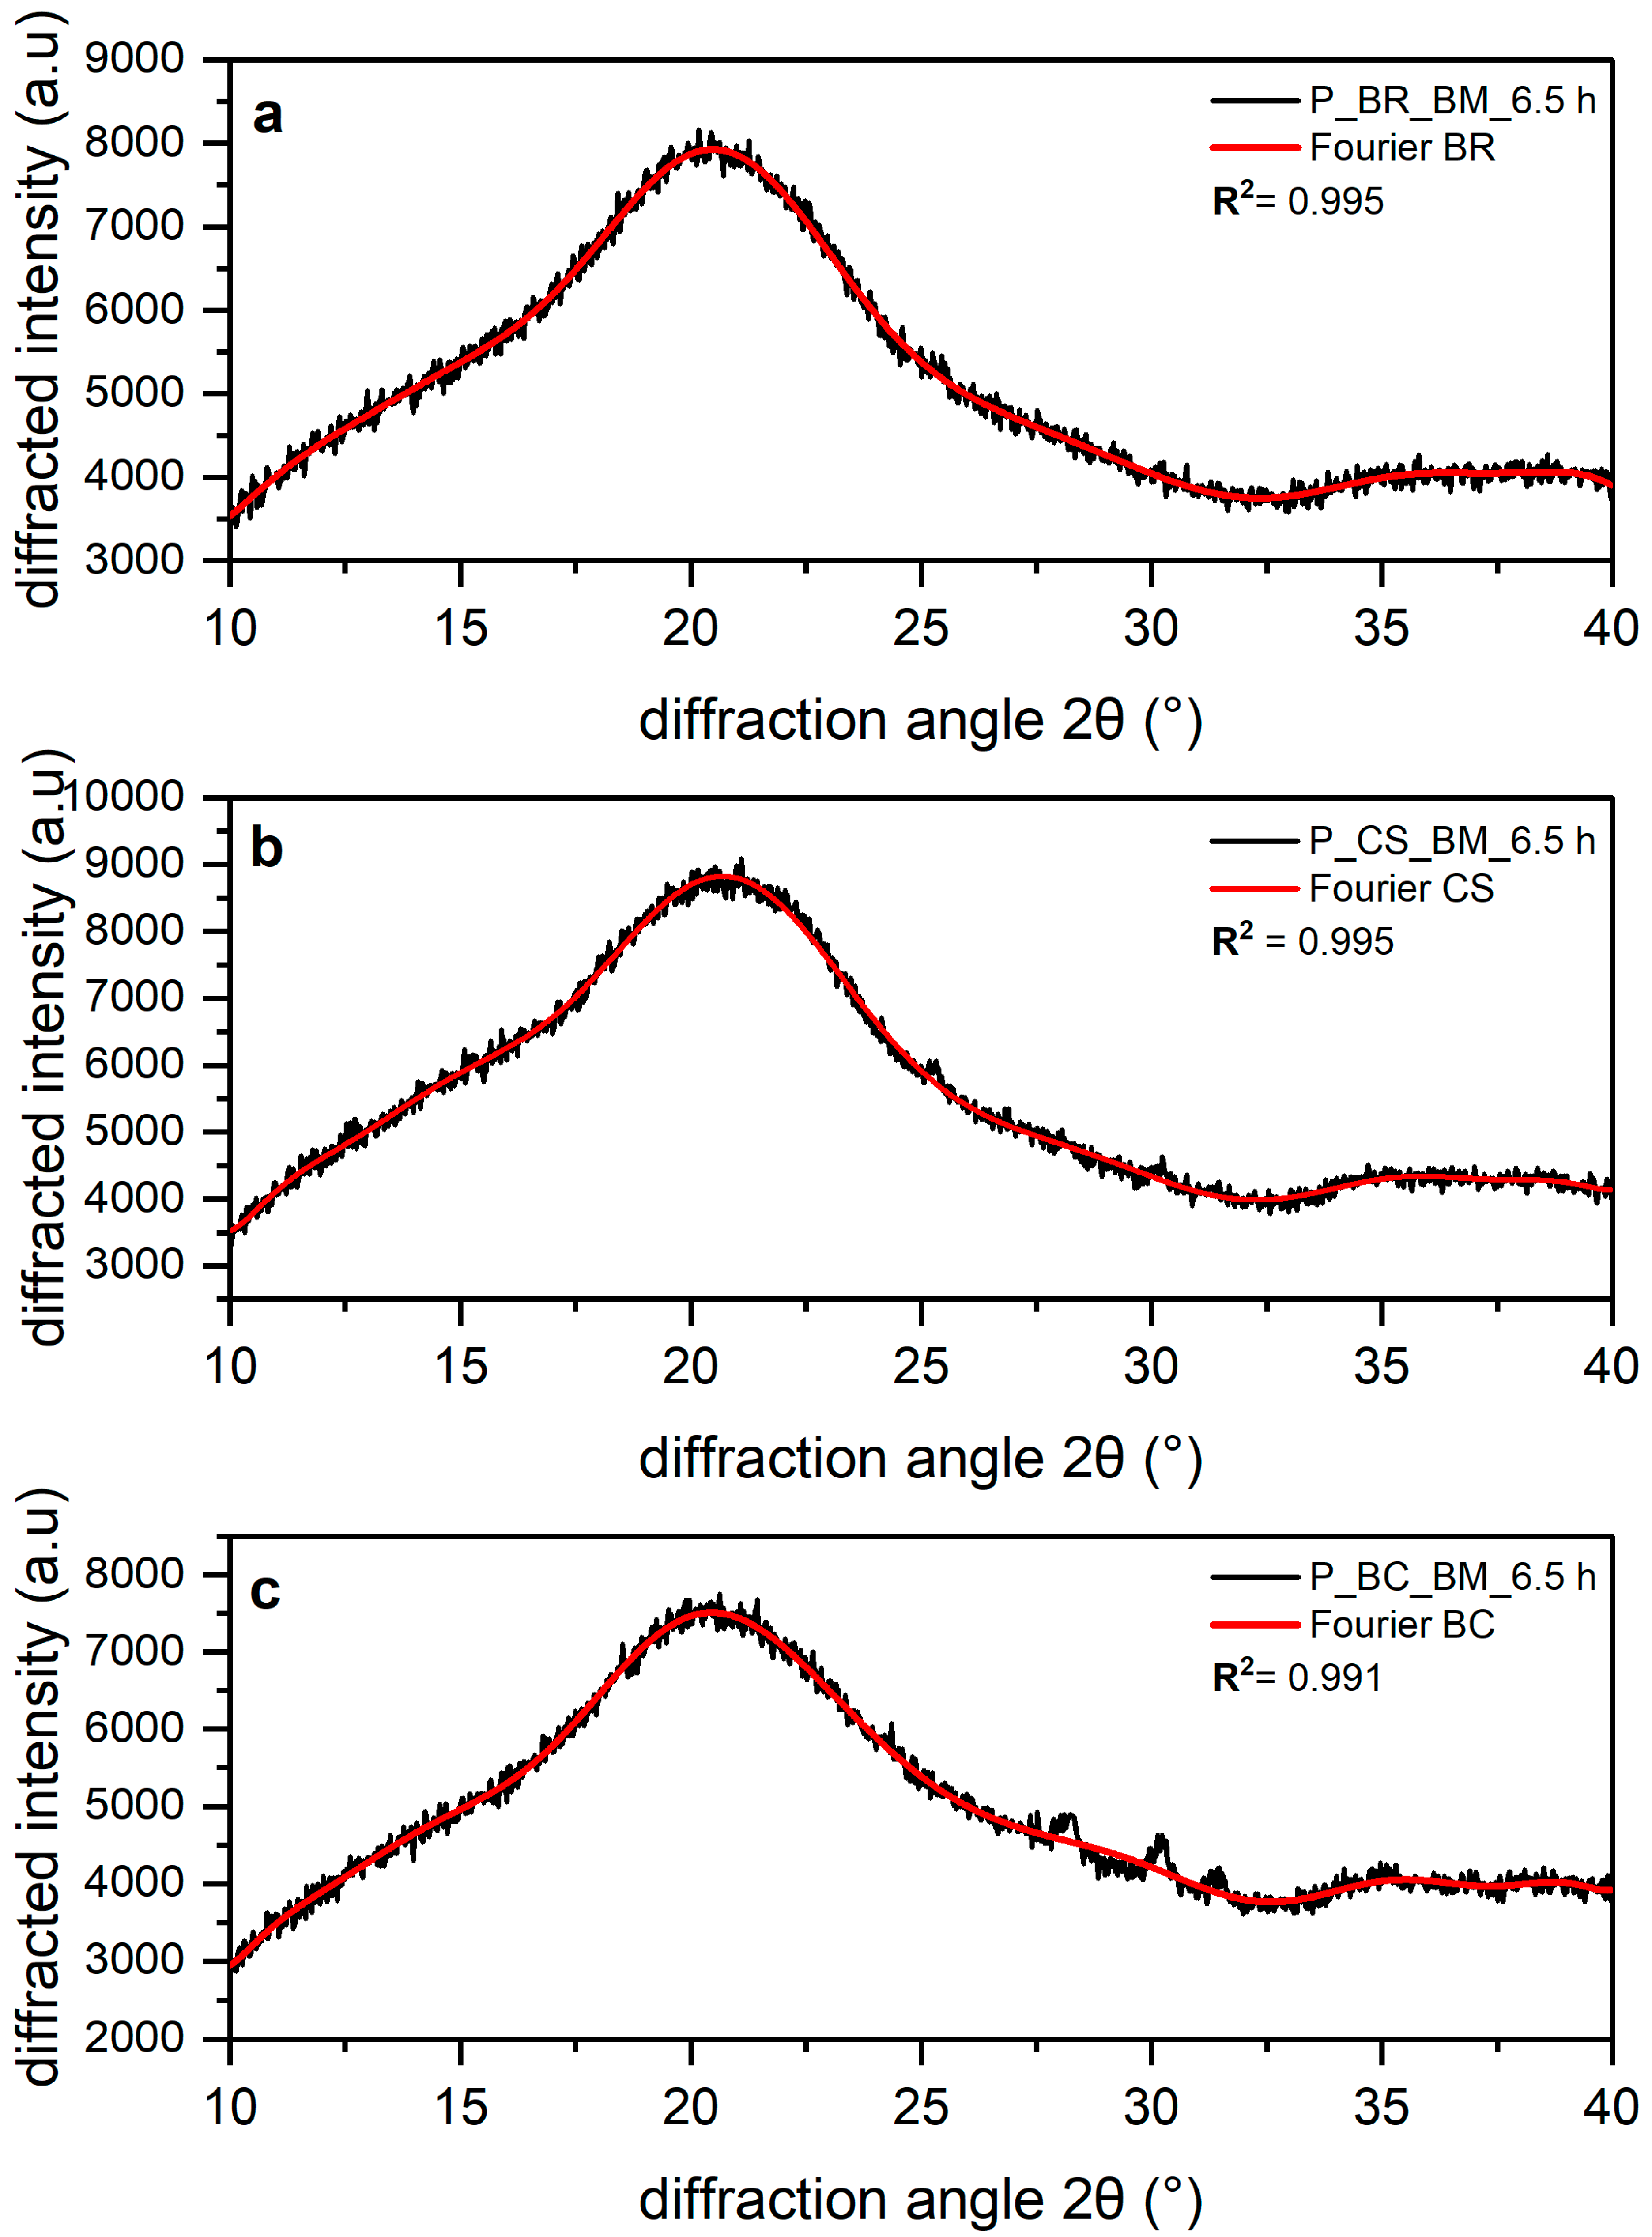
3.1. Amorphous Equation
3.2. Deconvolution with Fourier Function
4. Conclusions
Supplementary Materials
Author Contributions
Funding
Institutional Review Board Statement
Informed Consent Statement
Data Availability Statement
Conflicts of Interest
References
- Rojas, O. (Ed.) Cellulose Chemistry and Properties: Fibers, Nanocelluloses and Advanced Materials; Springer: New York, NY, USA, 2016. [Google Scholar]
- Park, S.; Baker, J.O.; Himmel, M.E.; Parilla, P.A.; Johnson, D.K. Cellulose crystallinity index: Measurement techniques and their impact on interpreting cellulase performance. Biotechnol. Biofuels 2010, 3, 10. [Google Scholar] [CrossRef] [PubMed]
- Ahvenainen, P.; Kontro, I.; Svedström, K. Comparison of sample crystallinity determination methods by X-ray diffraction for challenging cellulose I materials. Cellulose 2016, 23, 1073–1086. [Google Scholar] [CrossRef]
- Nelson, M.L. Relation of certain infrared bands to cellulose crystallinity and crystal lattice type. Part II. A new infrared ratio for estimation of crystallinity in celluloses I and II. J. Appl. Polym. Sci. 1964, 8, 1325–1341. [Google Scholar] [CrossRef]
- Taylor, L.; Zografi, G. The Quantitative Analysis of Crystallinity Using FT-Raman Spectroscopy. Pharm. Res. 1998, 15, 755–761. [Google Scholar] [CrossRef] [PubMed]
- Ward, K. Crystallinity of Cellulose and Its Significance for the Fiber Properties. Text. Res. J. 1950, 20, 363–372. [Google Scholar] [CrossRef]
- Mokhena, T.C.; Sadiku, E.R.; Mochane, M.J.; Ray, S.S.; John, M.J.; Mtibe, A. Mechanical properties of cellulose nanofibril papers and their bionanocomposites: A review. Carbohydr. Polym. 2021, 273, 118507. [Google Scholar] [CrossRef] [PubMed]
- Bansal, P. Computational and Experimental Investigation of The Enzymatic Hydrolysis of Cellulose. Ph.D. Thesis, Georgia Institute of Technology, Atlanta, GA, USA, 2011. [Google Scholar]
- Park, S.; Johnson, D.K.; Ishizawa, C.I.; Parilla, P.A.; Davis, M.F. Measuring the crystallinity index of cellulose by solid state 13C nuclear magnetic resonance. Cellulose 2009, 16, 641–647. [Google Scholar] [CrossRef]
- Newman, R.H. Homogeneity in Cellulose Crystallinity between Samples of Pinus Radiata Wood. Wood Res. Technol. 2004, 58, 91–96. [Google Scholar] [CrossRef]
- French, A.D.; Cintron, M.S. Cellulose polymorphy, crystallite size, and the Segal Crystallinity Index. Cellulose 2013, 20, 583–588. [Google Scholar] [CrossRef]
- Yao, W.; Weng, Y.; Catchmark, J.M. Improved cellulose X-ray diffraction analysis using Fourier series modeling. Cellulose 2020, 27, 5563–5579. [Google Scholar] [CrossRef]
- Torlopov, M.A.; Mikhaylov, V.I.; Udoratina, E.V.; Aleshina, L.A.; Prusskii, A.I.; Tsvetkov, N.V.; Krivoshapkin, P.V. Cellulose nanocrystals with different length-to-diameter ratios extracted from various plants using novel system acetic acid/phosphotungstic acid/octanol-1. Cellulose 2018, 25, 1031–1046. [Google Scholar] [CrossRef]
- Ruland, W. X-ray determination of crystallinity and diffuse disorder scattering. Acta Crystallogr. 1961, 14, 1180–1185. [Google Scholar] [CrossRef]
- French, A.D. Increment in evolution of cellulose crystallinity analysis. Cellulose 2020, 27, 5445–5448. [Google Scholar] [CrossRef]
- Nam, S.; French, A.D.; Condon, B.D.; Concha, M. Segal crystallinity index revisited by the simulation of X-ray diffraction patterns of cotton cellulose I and cellulose II. Carbohydr. Polym. 2016, 135, 1–9. [Google Scholar] [CrossRef] [PubMed]
- Zuluaga, R.; Putaux, J.L.; Cruz, J.; Vélez, J.; Mondragon, I.; Gañán, P. Cellulose microfibrils from banana rachis: Effect of alkaline treatments on structural and morphological features. Carbohydr. Polym. 2009, 76, 51–59. [Google Scholar] [CrossRef]
- Velásquez-Cock, J.; Gañán, P.; Posada, P.; Castro, C.; Serpa, A.; Gómez, H.C.; Putaux, J.-L.; Zuluaga, R. Influence of combined mechanical treatments on the morphology and structure of cellulose nanofibrils: Thermal and mechanical properties of the resulting films. Ind. Crop. Prod. 2016, 85, 1–10. [Google Scholar] [CrossRef]
- Castro, C.; Zuluaga, R.; Álvarez, C.; Putaux, J.-L.; Caro, G.; Rojas, O.J.; Mondragon, I.; Gañán, P. Bacterial cellulose produced by a new acid-resistant strain of Gluconacetobacter genus. Carbohydr. Polym. 2012, 89, 1033–1037. [Google Scholar] [CrossRef]
- Retegi, A.; Algar, I.; Martin, L.; Altuna, F.; Stefani, P.; Zuluaga, R.; Gañán, P.; Mondragon, I. Sustainable optically transparent composites based on epoxidized soy-bean oil (ESO) matrix and high contents of bacterial cellulose (BC). Cellulose 2012, 19, 103–109. [Google Scholar] [CrossRef]
- Ioelovich, M. Preparation, Characterization and Application of Amorphized Cellulose—A Review. Polymers 2021, 13, 4313. [Google Scholar] [CrossRef] [PubMed]
- Niskanen, I.; Suopajärvi, T.; Liimatainen, H.; Fabritius, T.; Heikkilä, R.; Thungström, G. Determining the complex refractive index of cellulose nanocrystals by combination of Beer-Lambert and immersion matching methods. J. Quant. Spectrosc. Radiat. Transf. 2019, 235, 1–6. [Google Scholar] [CrossRef]
- Cullity, B.D. Elements of X-ray Diffraction; Addison-Wesley: Boston, MA, USA, 1978. [Google Scholar]
- McCusker, L.B.; Von Dreele, R.B.; Cox, D.E.; Louër, D.; Scardi, P. Rietveld refinement guidelines. J. Appl. Crystallogr. 1999, 32, 36–50. [Google Scholar] [CrossRef]
- Lanson, B. Decomposition of experimental X-ray diffraction patterns (profile fitting): A convenient way to study clay minerals. Clays Clay Miner. 1997, 45, 132–146. [Google Scholar] [CrossRef]
- Buerger, M.J.; Klein, G.E. Correction of X-ray Diffraction Intensities for Lorentz and Polarization Factors. J. Appl. Phys. 1945, 16, 408–418. [Google Scholar] [CrossRef]
- He, J.; Cui, S.; Wang, S.-Y. Preparation and crystalline analysis of high-grade bamboo dissolving pulp for cellulose acetate. J. Appl. Polym. Sci. 2008, 107, 1029–1038. [Google Scholar] [CrossRef]
- Garvey, C.J.; Parker, I.H.; Simon, G.P. On the Interpretation of X-Ray Diffraction Powder Patterns in Terms of the Nanostructure of Cellulose I Fibres. Macromol. Chem. Phys. 2005, 206, 1568–1575. [Google Scholar] [CrossRef]
- French, A.D. Idealized powder diffraction patterns for cellulose polymorphs. Cellulose 2014, 21, 885–896. [Google Scholar] [CrossRef]
- Hult, E.-L.; Iversen, T.; Sugiyama, J. Characterization of the supermolecular structure of cellulose in wood pulp fibres. Cellulose 2003, 10, 103–110. [Google Scholar] [CrossRef]
- Fawcett, T.G.; Crowder, C.E.; Kabekkodu, S.N.; Needham, F.; Kaduk, J.A.; Blanton, T.N.; Petkov, V.; Bucher, E.; Shpanchenko, R. Reference materials for the study of polymorphism and crystallinity in cellulosics. Powder Diffr. 2013, 28, 18–31. [Google Scholar] [CrossRef]
- Bogolitsyn, K.; Parshina, A.; Aleshina, L. Structural features of brown algae cellulose. Cellulose 2020, 27, 9787–9800. [Google Scholar] [CrossRef]
- Ling, Z.; Chen, S.; Zhang, X.; Takabe, K.; Xu, F. Unraveling variations of crystalline cellulose induced by ionic liquid and their effects on enzymatic hydrolysis. Sci. Rep. 2017, 7, 10230. [Google Scholar] [CrossRef]
- Oh, S.Y.; Yoo, D.I.; Shin, Y.; Kim, H.C.; Kim, H.Y.; Chung, Y.S.; Park, W.H.; Youk, J.H. Crystalline structure analysis of cellulose treated with sodium hydroxide and carbon dioxide by means of X-ray diffraction and FTIR spectroscopy. Carbohydr. Res. 2005, 340, 2376–2391. [Google Scholar] [CrossRef] [PubMed]
- Sugiyama, J.; Persson, J.; Chanzy, H. Combined infrared and electron diffraction study of the polymorphism of native celluloses. Macromol. 1991, 24, 2461–2466. [Google Scholar] [CrossRef]
- Ciolacu, D.; Ciolacu, F.; Popa, V.I. Amorphous cellulose—structure and characterization. Cellul. Chem. Technol. 2011, 45, 13. [Google Scholar]
- Liang, C.Y.; Marchessault, R.H. Infrared spectra of crystalline polysaccharides. I. Hydrogen bonds in native celluloses. J. Polym. Sci. 1959, 37, 385–395. [Google Scholar]
- Schwanninger, M.; Rodrigues, J.; Pereira, H.; Hinterstoisser, B. Effects of short-time vibratory ball milling on the shape of FT-IR spectra of wood and cellulose. Vib. Spectrosc. 2004, 36, 23–40. [Google Scholar] [CrossRef]
- Teeäär, R.; Serimaa, R.; Paakkarl, T. Crystallinity of Cellulose, as Determined by CP/MAS NMR and XRD Methods. Polym. Bull. 1987, 17, 231–237. [Google Scholar] [CrossRef]
- Sugiyama, J.; Vuong, R.; Chanzy, H. Electron Diffraction Study on the Two Crystalline Phases Occurring in Native Cellulose from an Algal Cell Wall. Macromolecules 1991, 199, 4168–4175. [Google Scholar] [CrossRef]
- Holder, C.F.; Schaak, R.E. Tutorial on Powder X-ray Diffraction for Characterizing Nanoscale Materials. ACS Nano 2019, 13, 7359–7365. [Google Scholar] [CrossRef]
- Hooshmand, S.; Aitomäki, Y.; Norberg, N.; Mathew, A.P.; Oksman, K. Dry-Spun Single-Filament Fibers Comprising Solely Cellulose Nanofibers from Bioresidue. ACS Appl. Mater. Interfaces 2015, 7, 13022–13028. [Google Scholar] [CrossRef]
- Watanabe, K.; Tabuchi, M.; Morinaga, Y.; Yoshinaga, F. Structural features and properties of bacterial cellulose produced in agitated culture. Cellulose 1998, 5, 187–200. [Google Scholar] [CrossRef]
- Tabarsa, T.; Sheykhnazari, S.; Ashori, A.; Mashkour, M.; Khazaeian, A. Preparation and characterization of reinforced papers using nano bacterial cellulose. Int. J. Biol. Macromol. 2017, 101, 334–340. [Google Scholar] [CrossRef] [PubMed]
- Aleshina, L.A.; Gladysheva, E.K.; Budaeva, V.V.; Skiba, E.A.; Arkharova, N.A.; Sakovich, G.V. X-ray Diffraction Study of Bacterial Nanocellulose Produced by the Medusomyces gisevii Sa-12 Culture in Enzymatic Hydrolysates of Oat Hulls. Crystallogr. Rep. 2018, 63, 955–960. [Google Scholar] [CrossRef]


| Vibrational Frequency | 30 Hz |
|---|---|
| Sample amount | 1.5 g |
| Max. feed size (mm) | 6 mm |
| Temperature | 24 °C |
| Pre-cooling | None |
| Grinding cooling | None |
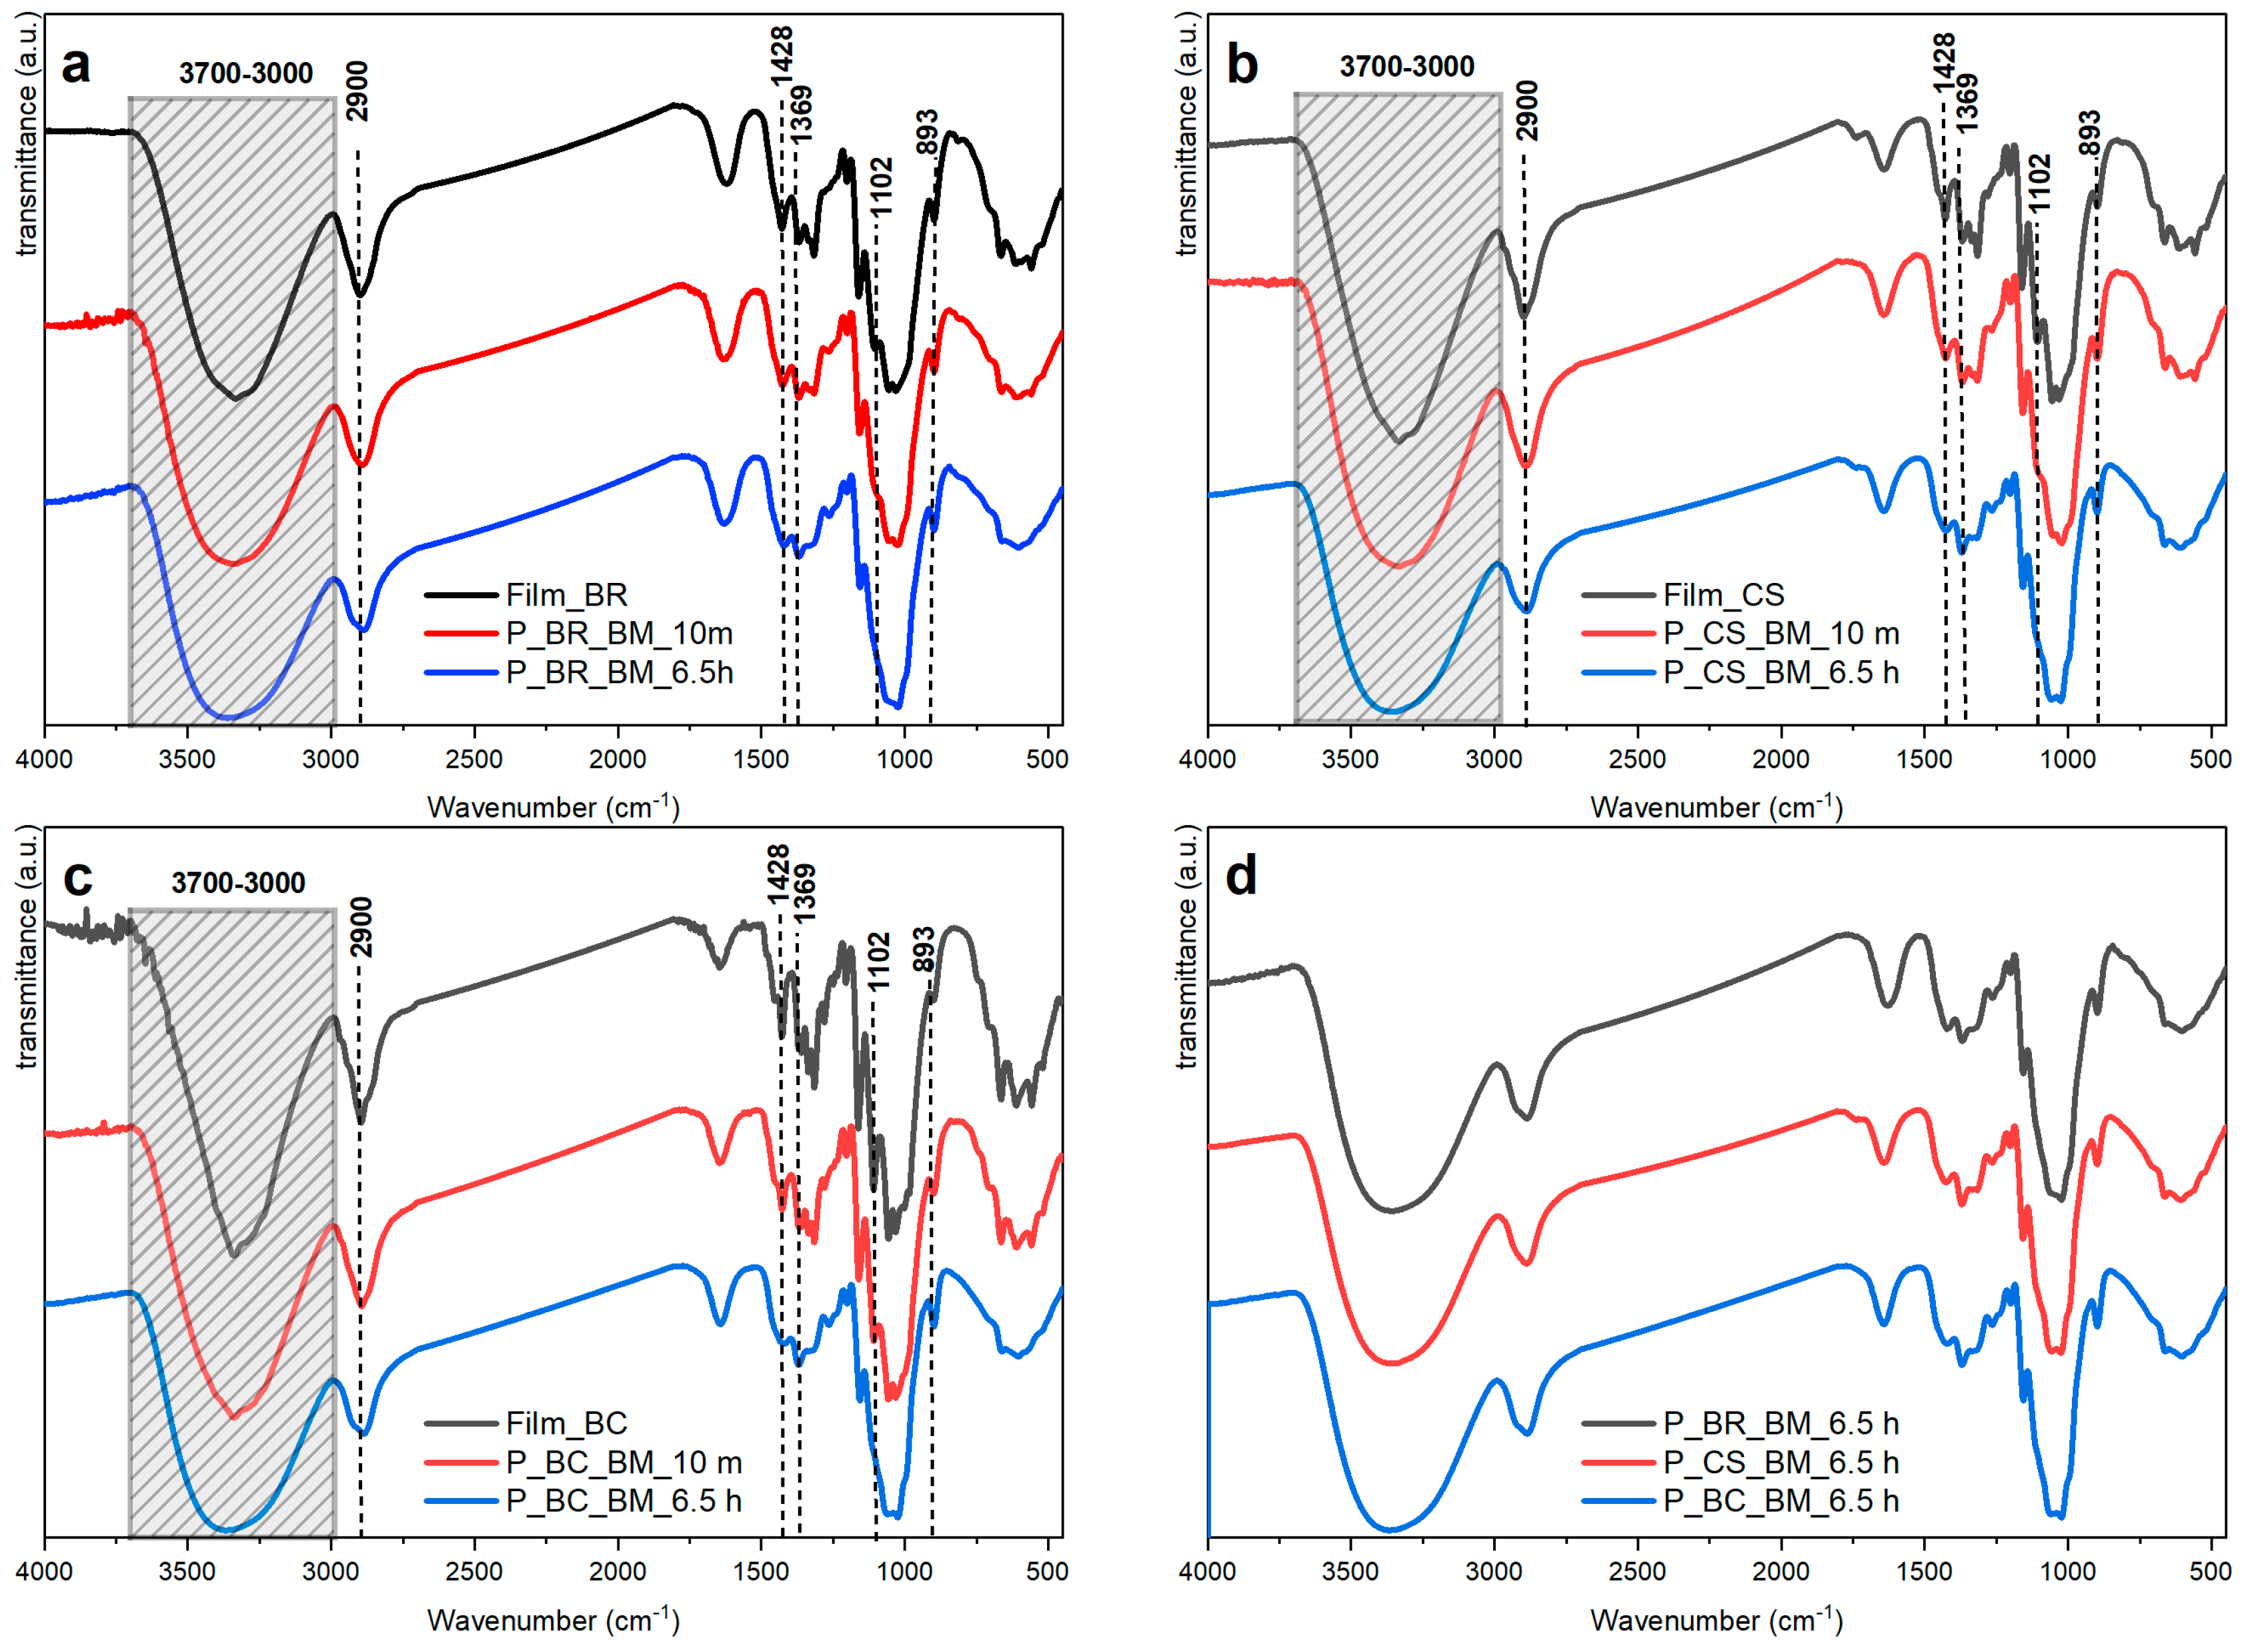
| Absorbance (cm−1) | Discussion | References |
|---|---|---|
| 3000–3700 | Assigned to the symmetric and antisymmetric OH stretching of inter- and intramolecular hydrogen bonds. A broadening or shifting of the absorbances in the spectra presented in Figure 3a–c is related to scission of the inter- and intramolecular hydrogen bonds with progressively increased milling. This disruption is believed to be the cause of the apparent intensity reduction seen when the milling time is increased. | [35,36,37] |
| 2900 | Assigned to the extension of the CH and CH2 bond. It shows a significant reduction in intensity with increasing milling time for all samples. | [4] |
| 1428 | Assigned to CH2 scissoring motion or bending. It also shows a reduction in intensity with the increase in milling time for all samples. | [4,37] |
| 1369 | Assigned to CH bending. The absorbance of this band is unaffected by water adsorbed onto cellulose. A slight decrease in intensity is observed for this absorbance with increased milling time. It has been used for estimation of CI. This band and those at 1335 and 1315 cm−1 show the greatest progressive changes with the extension of ball milling. | [4] |
| 1102 | Association band analogous to those found near 1111 cm−1 in primary and secondary alcohols. Attributed to the hydrogen bonding effect on the vibrations of the skeleton surrounding the extension of the C–O bond. Reductions in absorbance intensity are associated with amorphous cellulose. It is important to emphasize that the IR spectrum of cellulose II is quite similar to that of the amorphous cellulose regarding this band. | [4] |
| 893 | Absorbance characteristic of C1–H bond stretching in β-bonds of glucose and the four atoms attached to it. A slight increase is observed with extended milling time, which would be expected if the oxygen atoms attached to C1 are involved in this vibration, and changes around the glycosidic linkage and in the hydrogen bonds may also affect its intensity. | [4,37] |
| Coefficient | Banana Rachis (BR) | Commercial Sample (CS) | Bacterial Cellulose (BC) |
|---|---|---|---|
| w | 0.1293 | 0.1071 | 0.1049 |
| a0 | 1.923 × 10⁴ | 1.763 × 10⁶ | 3.142 × 10⁶ |
| a1 | 2.638 × 10⁴ | 2.944 × 10⁶ | 5.013 × 10⁶ |
| b1 | 4629 | −1.386 × 10⁶ | −2.93 × 10⁶ |
| a2 | 2.331 × 10⁴ | 1.641 × 10⁶ | 2.251 × 10⁶ |
| b2 | 5994 | −1.986 × 10⁶ | −3.999 × 10⁶ |
| a3 | 1.666 × 10⁴ | 4.328 × 10⁵ | −4.97 × 10⁴ |
| b3 | 8217 | −1.672 × 10⁶ | −3.068 × 10⁶ |
| a4 | 1.037 × 10⁴ | −1.754 × 10⁵ | −8.87 × 10⁵ |
| b4 | 6608 | −9.482 × 10⁵ | −1.46 × 10⁶ |
| a5 | 5550 | −2.509 × 10⁵ | −6.769 × 10⁵ |
| b5 | 4824 | −3.562 × 10⁵ | −3.653 × 10⁵ |
| a6 | 2132 | −1.301 × 10⁵ | −2.659 × 10⁵ |
| b6 | 2544 | −7.663 × 10⁴ | 9603 |
| a7 | 786.1 | −3.613 × 10⁴ | −5.408 × 10⁴ |
| b7 | 1032 | −4452 | 3.443 × 10⁴ |
| a8 | 101.8 | −4359 | −3748 |
| b8 | 270 | 993 | 7154 |
| R2 | 0.9948 | 0.995 | 0.9915 |
| RMSE | 96.24 | 110.1 | 113.7 |
| Sample | CI (%) | d-Spacing ((200)-Iα. (110)-Iβ) (nm) | R2 |
|---|---|---|---|
| Film BR | 58.354 | 3.578 3.594 | 0.999 |
| P_BR_BM_10 m | 28.922 | 0.998 | |
| Film CS | 59.532 | 4.425 4.341 | 0.998 |
| P_CS_BM_10 m | 34.303 | 0.996 | |
| Film BC | 70.706 | 6.069 5.974 | 0.992 |
| P_BC_BM_10 m | 32.791 | 0.997 |
| Sample | CI Value (%) | Method | Sample Form | Reference |
|---|---|---|---|---|
| Banana Rachis | 63 | Segal | Film | [42] |
| Commercial sample | 60 | Deconvolution (Gauss peaks) | Avicel | [2] |
| Commercial sample | 54 | Deconvolution (Gauss peaks) | Avicel | [39] |
| Bacterial Cellulose | 71 | Deconvolution (Gauss peaks) | Film | [43] |
| 83 | Segal | Film | [44] | |
| 33.43 ± 3.16 | Deconvolution (Voigt peaks and Fourier series) | Powder (10 min milled) | [12] | |
| 86 | Rietveld method | Film | [45] |
Publisher’s Note: MDPI stays neutral with regard to jurisdictional claims in published maps and institutional affiliations. |
© 2022 by the authors. Licensee MDPI, Basel, Switzerland. This article is an open access article distributed under the terms and conditions of the Creative Commons Attribution (CC BY) license (https://creativecommons.org/licenses/by/4.0/).
Share and Cite
Montoya-Escobar, N.; Ospina-Acero, D.; Velásquez-Cock, J.A.; Gómez-Hoyos, C.; Serpa Guerra, A.; Gañan Rojo, P.F.; Vélez Acosta, L.M.; Escobar, J.P.; Correa-Hincapié, N.; Triana-Chávez, O.; et al. Use of Fourier Series in X-ray Diffraction (XRD) Analysis and Fourier-Transform Infrared Spectroscopy (FTIR) for Estimation of Crystallinity in Cellulose from Different Sources. Polymers 2022, 14, 5199. https://doi.org/10.3390/polym14235199
Montoya-Escobar N, Ospina-Acero D, Velásquez-Cock JA, Gómez-Hoyos C, Serpa Guerra A, Gañan Rojo PF, Vélez Acosta LM, Escobar JP, Correa-Hincapié N, Triana-Chávez O, et al. Use of Fourier Series in X-ray Diffraction (XRD) Analysis and Fourier-Transform Infrared Spectroscopy (FTIR) for Estimation of Crystallinity in Cellulose from Different Sources. Polymers. 2022; 14(23):5199. https://doi.org/10.3390/polym14235199
Chicago/Turabian StyleMontoya-Escobar, Nicolás, Daniel Ospina-Acero, Jorge Andrés Velásquez-Cock, Catalina Gómez-Hoyos, Angélica Serpa Guerra, Piedad Felisinda Gañan Rojo, Lina Maria Vélez Acosta, Juan Pablo Escobar, Natalia Correa-Hincapié, Omar Triana-Chávez, and et al. 2022. "Use of Fourier Series in X-ray Diffraction (XRD) Analysis and Fourier-Transform Infrared Spectroscopy (FTIR) for Estimation of Crystallinity in Cellulose from Different Sources" Polymers 14, no. 23: 5199. https://doi.org/10.3390/polym14235199
APA StyleMontoya-Escobar, N., Ospina-Acero, D., Velásquez-Cock, J. A., Gómez-Hoyos, C., Serpa Guerra, A., Gañan Rojo, P. F., Vélez Acosta, L. M., Escobar, J. P., Correa-Hincapié, N., Triana-Chávez, O., Zuluaga Gallego, R., & Stefani, P. M. (2022). Use of Fourier Series in X-ray Diffraction (XRD) Analysis and Fourier-Transform Infrared Spectroscopy (FTIR) for Estimation of Crystallinity in Cellulose from Different Sources. Polymers, 14(23), 5199. https://doi.org/10.3390/polym14235199