
Effect of the Mixing Technique of Graphene Nanoplatelets and Graphene Nanofibers on Fracture Toughness of Epoxy Based Nanocomposites and Composites
 ,
,  ,
,  , ,
, , 
Abstract
1. Introduction
2. Materials and Methods
2.1. Materials
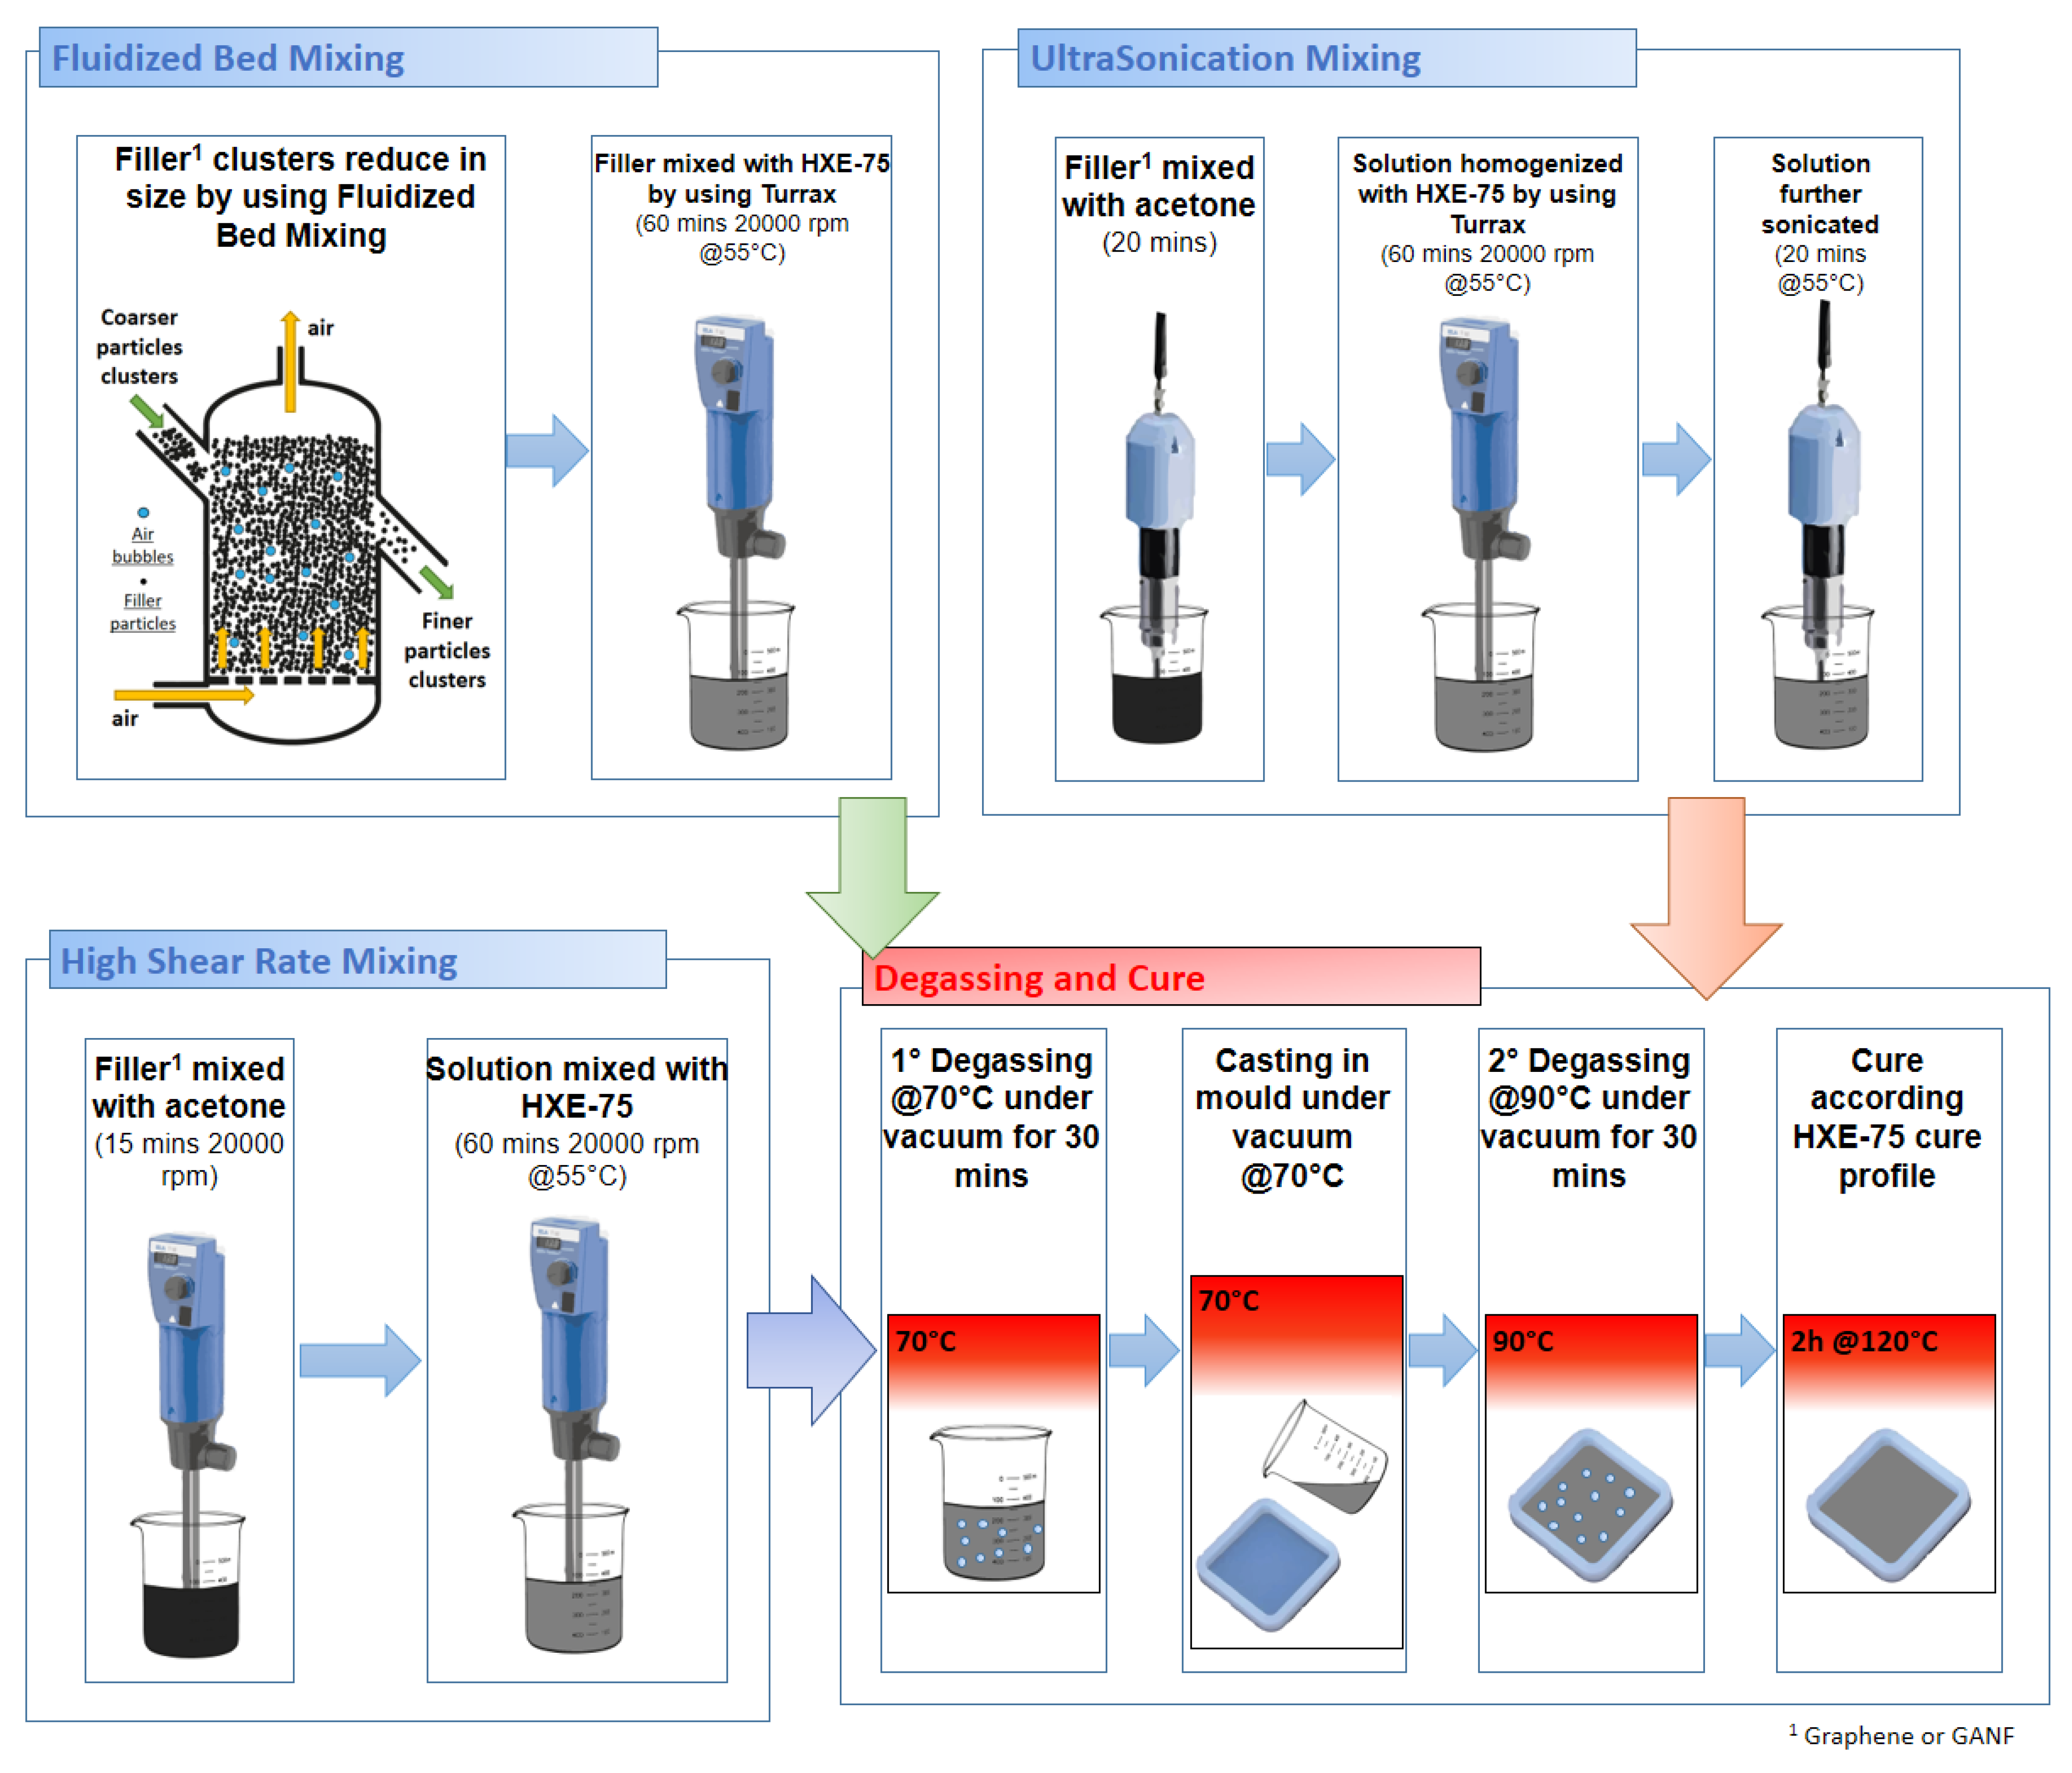
2.2. Nanocomposite Preparation
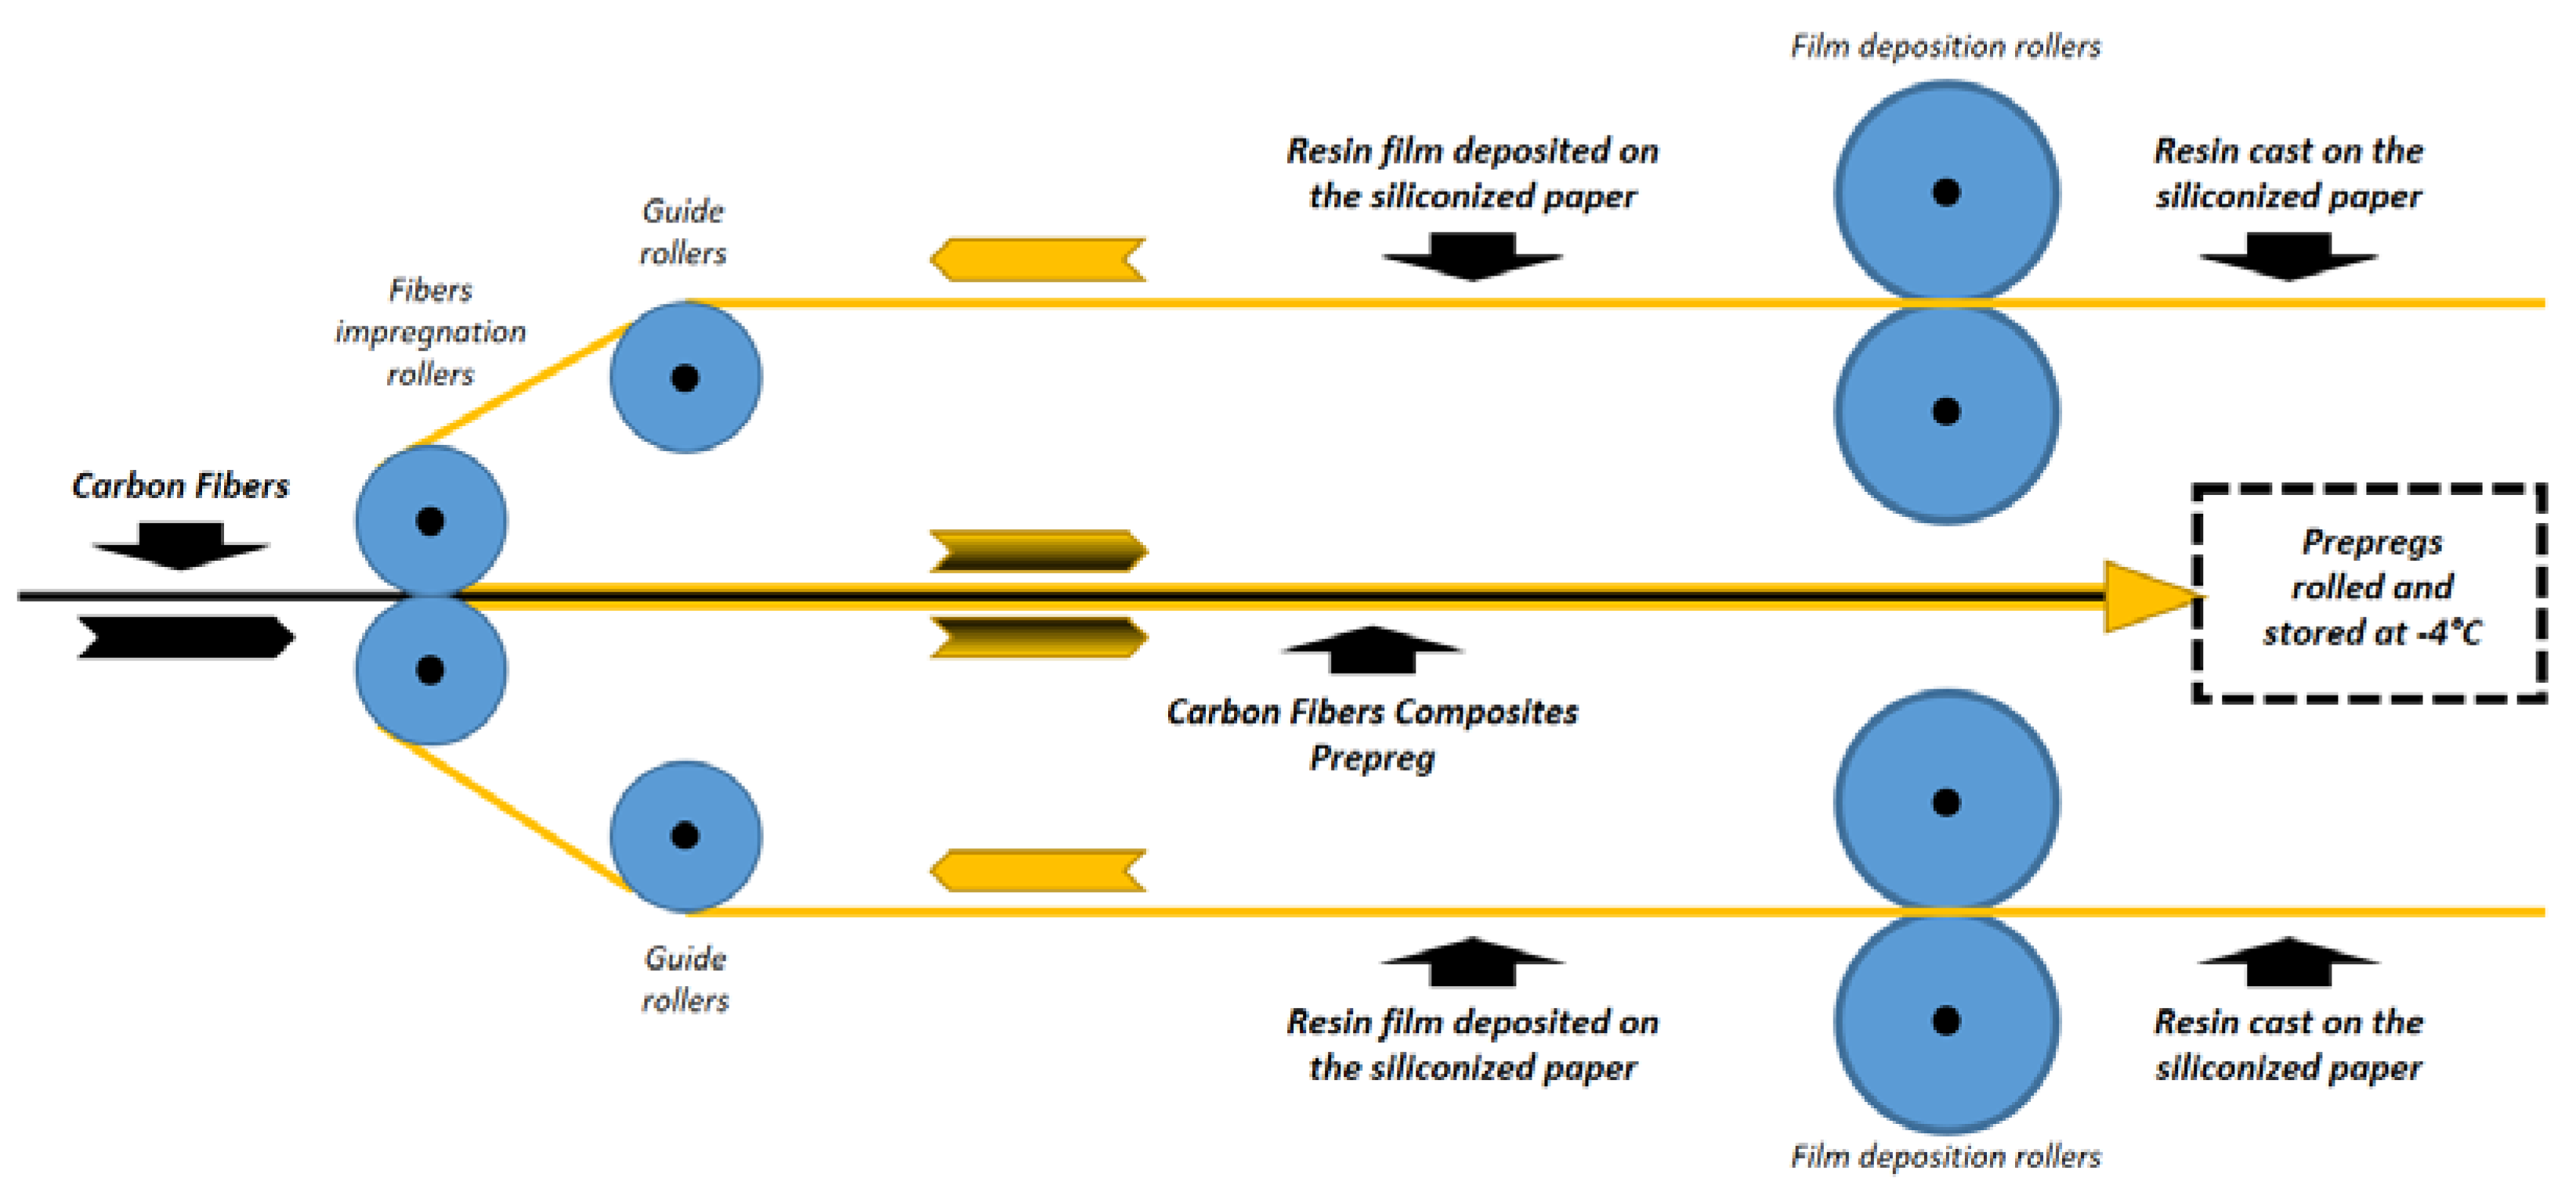
2.3. Composites Manufacturing
2.4. Nanocomposites Characterization
2.5. Composites Characterization
3. Results and Discussion
3.1. GNP Loaded Nanocomposites
3.2. GANF Loaded Nanocomposites
3.3. Composites Chatacterization
4. Conclusions
Author Contributions
Funding
Institutional Review Board Statement
Informed Consent Statement
Data Availability Statement
Acknowledgments
Conflicts of Interest
References
- Cheng, C.; Chen, Z.; Huang, Z.; Zhang, C.; Tusiime, R.; Zhou, J.; Sun, Z.; Liu, C.; Yu, M.; Zhang, H. Simultaneously improving mode I and mode II fracture toughness of the carbon fiber/epoxy composite laminates via interleaved with uniformly aligned PES fiber webs. Compos. Part A 2019, 129, 105696. [Google Scholar] [CrossRef]
- Xusheng, D.; Helezi, Z.; Weifu, S.; Hong-Yuan, L.; Guangnan, Z.; Huamin, Z.; Yiu-Wing, M. Graphene/epoxy interleaves for delamination toughening and monitoring of crack damage in carbon fibre/epoxy composite laminates. Compos. Part A 2017, 140, 123–133. [Google Scholar]
- Liu, H.L.; Wang, G.T.; Mai, Y.W.; Zeng, Y. On fracture toughness of nano-particle modified epoxy. Compos. Part B Eng. 2011, 42, 2170–2175. [Google Scholar] [CrossRef]
- Elmahdy, A.; Zotti, A.; Zuppolini, S.; Zarrelli, M.; Borriello, A.; Verleysen, P. Effect of Strain Rate and Silica Filler Content on the Compressive Behavior of RTM6 Epoxy-Based Nanocomposites. Polymers 2021, 13, 3735. [Google Scholar] [CrossRef] [PubMed]
- Domun, N.; Hadavinia, H.; Zhang, T.; Sainsbury, T.; Liaghat, G.H.; Vahid, S. Improving the fracture toughness and the strength of epoxy using nanomaterials—A review of the current status. Nanoscale 2015, 7, 10294–10329. [Google Scholar] [CrossRef]
- Ismail, H.; Galpaya, D.; Ahmad, Z. The compatibilizing effect of epoxy resin (EP) on polypropylene (PP)/recycled acrylonitrile butadiene rubber (NBRr) blends. Polym. Test. 2009, 28, 363–370. [Google Scholar] [CrossRef]
- Zotti, A.; Zuppolini, S.; Borriello, A.; Zarrelli, M. Thermal properties and fracture toughness of epoxy nanocomposites loaded with hyperbranched-polymers-based core/shell nanoparticles. Nanomaterials 2019, 9, 418. [Google Scholar] [CrossRef]
- Prabhua, R.; Kakarla, T.J.; Reddy, R.; Raghu, A.V. Polyaniline-fly ash nanocomposites synthesized via emulsion polymerization: Physicochemical, thermal and dielectric properties. Mater. Sci. Energy Technol. 2021, 4, 107–112. [Google Scholar] [CrossRef]
- Chandrasekaran, S.; Satoa, N.; Tölle, F.; Mülhaupt, R.; Fiedler, B.; Schulte, K. Fracture toughness and failure mechanism of graphene based epoxy composites. Compos. Sci. Technol. 2016, 97, 90–99. [Google Scholar] [CrossRef]
- Naebe, M.; Wang, J.; Amini, A.; Khayyam, H.; Hameed, N.; Li, L.H.; Chen, Y.; Fox, B. Mechanical Property and Structure of Covalent Functionalised Graphene/Epoxy Nanocomposites. Sci. Rep. 2014, 4, 4375. [Google Scholar] [CrossRef]
- Atif, R.; Shyha, I.; Inam, F. Mechanical, Thermal, and Electrical Properties of Graphene-Epoxy Nanocomposites—A Review. Polymers 2016, 8, 281. [Google Scholar] [CrossRef] [PubMed]
- Glaskova-Kuzmina, T.; Zotti, A.; Borriello, A.; Zarrelli, M.; Aniskevich, A. Basalt Fibre Composite with Carbon Nanomodified Epoxy Matrix under Hydrothermal Ageing. Polymers 2021, 13, 532. [Google Scholar] [CrossRef] [PubMed]
- Endo, M.; Kim, Y.A.; Ezaka, M.; Osada, K. Selective and efficient impregnation of metal nanoparticles on cup-stacked-type carbon nanofibers. Nano Lett. 2003, 3, 723–726. [Google Scholar] [CrossRef]
- Wu, S.; Ladani, R.; Zhang, J.; Kinloch, A.; Zhao, Z.; Ma, J.; Zhang, X.; Mouritz, A.; Ghorbani, K.; Wang, C. Epoxy nanocomposites containing magnetite-carbon nanofibers aligned using a weak magnetic field. Polymer 2015, 68, 25–34. [Google Scholar] [CrossRef]
- Tang, L.C.; Wan, Y.J.; Yan, D.; Pei, Y.B.; Zhao, L.; Li, Y.B.; Wu, L.B.; Jiang, J.X.; Lai, G.Q. The effect of graphene dispersion on the mechanical properties of graphene/epoxy composites. Carbon 2013, 60, 16–27. [Google Scholar] [CrossRef]
- Zotti, A.; Zuppolini, S.; Borriello, A.; Zarrelli, M. Polymer nanocomposites based on Graphite Nanoplatelets and amphiphilic graphene platelets. Compos. Part B Eng. 2022, 246, 110223–110246. [Google Scholar] [CrossRef]
- Wei, J.; Vo, T.; Inam, F. Epoxy/graphene nanocomposites—Processing and properties: A review. RSC Adv. 2015, 5, 73510–73524. [Google Scholar] [CrossRef]
- Kang, W.S.; Rhee, K.Y.; Parka, S.J. Influence of surface energetics of graphene oxide on fracture toughness of epoxy nanocomposites. Compos. Part B Eng. 2017, 114, 175–183. [Google Scholar] [CrossRef]
- Rana, S.; Alagirusamy, R.; Joshi, M. Effect of carbon nanofiber dispersion on the tensile properties of epoxy nanocomposites. J. Compos. Mater. 2011, 45, 2247–2256. [Google Scholar] [CrossRef]
- Wei, J.; Atif, R.; Vo, T.; Inam, F. Graphene Nanoplatelets in Epoxy System: Dispersion, Reaggregation, and Mechanical Properties of Nanocomposites. J. Nanomater. 2015, 16, 374. [Google Scholar] [CrossRef]
- Singer, G.; Rennhofer, H.; Sinn, G.; Unterlass, M.M.; Wendrinsky, J.; Windberger, U.; Lichtenegge, H.C. Processing of Carbon Nanotubes and Carbon Nanofibers towards High Performance Carbon Fiber Reinforced Polymers. Key Eng. Mater. 2017, 742, 31–37. [Google Scholar] [CrossRef]
- Horta Muñoz, S.; Serna Moreno, M.d.C.; González-Domínguez, J.M.; Morales-Rodríguez, P.A.; Vázquez, E. Experimental, Numerical, and Analytical Study on The Effect of Graphene Oxide in The Mechanical Properties of a Solvent-Free Reinforced Epoxy Resin. Polymers 2019, 11, 2115. [Google Scholar] [CrossRef] [PubMed]
- Yao, T.T.; Zhang, X.F.; Zhang, W.F.; Liu, Y.T.; Liu, Q.; Wu, C.P. Controlled attachment of polycarbonate nanoparticles on carbon fibers for increased resin impregnation and interfacial adhesion in carbon fiber composites. Compos. Part B Eng. 2021, 224, 109218. [Google Scholar] [CrossRef]
- Bafakeeh, O.T.; Shewakh, W.M.; Abu-Oqail, A.; Abd-Elaziem, W.; Abdel Ghafaar, M.; Abu-Okail, M. Synthesis and Characterization of Hybrid Fiber-Reinforced Polymer by Adding Ceramic Nanoparticles for Aeronautical Structural Applications. Polymers 2021, 13, 4116. [Google Scholar] [CrossRef]
- Mostovoy, A.; Shcherbakov, A.; Yakovlev, A.; Arzamastsev, S.; Lopukhova, M. Reinforced Epoxy Composites Modified with Functionalized Graphene Oxide. Polymers 2022, 14, 338. [Google Scholar] [CrossRef]
- Alsaadi, M. A Study on the Delamination and Flexural Behavior of Carbon- and Aramid-Fiber-Reinforced Epoxy Composites with Silicon Carbide Particle Inclusions. Mech. Compos. Mater. 2022, 57, 847–856. [Google Scholar] [CrossRef]
- Di Cosmo, A.; D’andrea, B.; Vinti, V. Polymeric Formulations with Chemically Adjustable Rheology for the Manufacture of Prepregs and Articles Made of Composite Material. U.S. Patent 9217082, 22 December 2015. [Google Scholar]
- Zhang, J.; Xu, S.; Li, W. High shear mixers: A review of typical applications and studies on power draw,flow pattern, energy dissipation and transfer properties. Chem. Eng. Process. 2012, 57–58, 25–41. [Google Scholar] [CrossRef]
- Shah, T.R.; Koten, H.; Ali, H.M. Chapter 5—Performance effecting parameters of hybrid nanofluids. In Hybrid Nanofluids for Convection Heat Transfer; Academic Press: Cambridge, MA, USA, 2020; pp. 179–213. [Google Scholar]
- Shen, L.; Zhang, M.; Xu, Y. Solids mixing in fluidized beds. Powder Technol. 1995, 84, 207–212. [Google Scholar] [CrossRef]
- Shokrieh, M.M.; Ghoreishi, S.M.; Esmkhani, M.; Zhao, Z. Effects of graphene nanoplatelets and graphene nanosheets on fracture toughness of epoxy nanocomposites. Fatigue Fract. Eng. Mater. Struct. 2014, 37, 1116–1123. [Google Scholar] [CrossRef]
- ASTM D7905/D7905M; Standard Test Method for Determination of the Mode II Interlaminar Fracture Toughness of Unidirectional Fiber-Reinforced Polymer Matrix Composites. ASTM International: West Conshohocken, PE, USA, 2019.
- Loos, M.R.; Coelho, L.A.F.; Pezzin, S.H.; Amico, S.C. The Effect of Acetone Addition on the Properties of Epoxy. Polímeros Ciência e Tecnologia 2008, 18, 76–80. [Google Scholar] [CrossRef]
- Hielscher, K. Ultrasonic Milling and Dispersing Technology for Nano-Particles. Mater. Res. Soc. Symp. Proc. 2012, 1479, 21–26. [Google Scholar] [CrossRef]
- Liu, Q.; Zhou, X.; Fan, X.; Zhu, C.; Yao, X.; Liu, Z. Mechanical and Thermal Properties of Epoxy Resin Nanocomposites Reinforced with Graphene Oxide. Polym.-Plast. Technol. Eng. 2012, 51, 251–256. [Google Scholar] [CrossRef]
- Miyagawa, H.; Drzal, L.T. Thermo-physical and impact properties of epoxy nanocomposites reinforced by single-wall carbon nanotubes. Polymer 2004, 45, 5163–5170. [Google Scholar] [CrossRef]
- Le, M.T.; Huang, S.C. Thermal and Mechanical Behavior of Hybrid Polymer Nanocomposite Reinforced with Graphene Nanoplatelets. Materials 2015, 8, 5526–5536. [Google Scholar] [CrossRef]
- Pathak, A.K.; Garg, H.; Singh, M.; Yokozeki, T.; Dhakate, S.R. Enhanced interfacial properties of graphene oxide incorporated carbon fiber reinforced epoxy nanocomposite: A systematic thermal properties investigation. J. Polym. Res. 2019, 26, 23. [Google Scholar] [CrossRef]
- Domun, N.; Hadavinia, H.; Zhang, T.; Liaghat, G.; Vahid, S.; Spacie, C.; Paton, K.R.; Sainsbury, T. Improving the fracture toughness properties of epoxy using graphene nanoplatelets at low filler content. Nanocomposites 2017, 3, 85–96. [Google Scholar] [CrossRef]
- Chatterjee, S.; Nafezarefi, F.; Tai, N.H.; Schlagenhauf, L.; Nuesch, F.A.; Chu, B.T.T. Size and synergy effects of nanofiller hybrids including graphene nanoplatelets and carbon nanotubes in mechanical properties of epoxy composites. Carbon 2012, 50, 5380–5386. [Google Scholar] [CrossRef]
- Choi, Y.K.; Sugimoto, K.; Song, S.M.; Gotoh, Y.; Ohkoshi, Y.; Endo, M. Mechanical and physical properties of epoxy composites reinforced by vapor grown carbon nanofibers. Carbon 2005, 43, 2199–2208. [Google Scholar] [CrossRef]
- Wanga, H.; Niu, N.; Wang, H.; Wang, W.; Jin, X.; Wang, H.; Zhouc, H.; Lin, H. Micro-meso porous structured carbon nanofibers with ultra-high surface area and large supercapacitor electrode capacitance. J. Power Sources 2021, 482, 228986. [Google Scholar] [CrossRef]
- Bica, I.; Anitas, E.M. Graphene Platelets-Based Magnetoactive Materials with Tunable Magnetoelectric and Magnetodielectric Properties. Nanomaterials 2020, 10, 1783. [Google Scholar] [CrossRef]
- Bortza, D.R.; Merino, C.; Martin-Gullon, I. Carbon nanofibers enhance the fracture toughness and fatigue performance of a structural epoxy system. Compos. Sci. Technol. 2011, 71, 31–38. [Google Scholar] [CrossRef]
- Palmeri, M.J.; Putz, K.W.; Ramanathan, T.; Brinson, L.C. Multi-scale reinforcement of CFRPs using carbon nanofibers. Compos. Sci. Technol. 2011, 71, 79–86. [Google Scholar] [CrossRef]
- Zhou, Y.; Pervin, F.; Jeelani, S.; Mallick, P.K. Improvement in mechanical properties of carbon fabric–epoxy composite using carbon nanofibers. J. Mater. Processing Technol. 2008, 198, 445–453. [Google Scholar] [CrossRef]
- Tareq, M.S.; Zainuddin, S.; Woodside, E.; Syed, F. Investigation of the flexural and thermomechanical properties of nanoclay/graphene reinforced carbon fiber epoxy composites. J. Mater. Res. 2019, 34, 3678–3687. [Google Scholar] [CrossRef]
- Zafeiropoulou, K.; Kostagiannakopoulou, K.; Sotiriadis, G.; Kostopoulos, V. A Preliminary Study of the Influence of Graphene Nanoplatelet Specific Surface Area on the Interlaminar Fracture Properties of Carbon Fiber/Epoxy Composites. Polymers 2020, 12, 3060. [Google Scholar] [CrossRef]
- Zotti, A.; Zuppolini, S.; Borriello, A.; Zarrelli, M. Thermal and mechanical characterization of an aeronautical graded epoxy resin loaded with hybrid nanoparticles. Nanomaterials 2020, 10, 1388. [Google Scholar] [CrossRef] [PubMed]
- Wang, P.N.; Hsieh, T.H.; Chiang, C.L.; Shen, M.Y. Synergetic Effects of Mechanical Properties on Graphene Nanoplatelet and Multiwalled Carbon Nanotube Hybrids Reinforced Epoxy/Carbon Fiber Composites. J. Nanomater. 2015, 2015, 838032. [Google Scholar] [CrossRef]
- Zotti, A.; Zuppolini, S.; Borriello, A.; Zarrelli, M. Fracture toughening mechanisms in epoxy adhesives. In Adhesives-Applications and Properties; InTech: London, UK, 2016; p. 237. [Google Scholar]
- Ahmadi-Moghadam, B.; Taheri, F. Influence of graphene nanoplatelets on modes I, II and III interlaminar fracture toughness of fiber-reinforced polymer composites. Eng. Fract. Mech. 2015, 143, 97–107. [Google Scholar] [CrossRef]
- Ahmadi-Moghadam, B.; Taheri, F. Fracture and toughening mechanisms of GNP-based nanocomposites in modes I and II fracture. Eng. Fract. Mech. 2014, 131, 329–339. [Google Scholar] [CrossRef]


| Sample ID | Filler | Filler Concentration [wt%] | Mixing Method |
|---|---|---|---|
| HXE75 | - | 0 | - |
| HXE75 SOLV | - | 0 | HSR |
| HXE75 + 0.5 wt% G_T | GNP | 0.5 | HSR |
| HXE75 + 0.5 wt% G_S | GNP | 0.5 | US |
| HXE75 + 0.5 wt% G_FBM | GNP | 0.5 | FBM |
| HXE75 + 0.5 wt% GANF_T | GANF | 0.5 | HSR |
| HXE75 + 0.5 wt% GANF_S | GANF | 0.5 | US |
| HXE75 + 0.5 wt% GANF_FBM | GANF | 0.5 | FBM |
| Sample | TgDSC [°C] | TOnset [°C] | TEndSet [°C] | TMAX [°C] | Char Yield [%] |
|---|---|---|---|---|---|
| HXE75 | 126.0 ± 1.1 | 354.1 ± 1.0 | 437.3 ± 0.7 | 419.7 ± 0.8 | 10.1 ± 0.1 |
| HXE75 + 0.5 wt%_G_FBM | 129.8 ± 1.1 | 353.5 ± 1.2 | 445.5 ± 0.9 | 422.0 ± 0.5 | 14.5 ± 0.3 |
| HXE75_SOLV | 127.8 ± 1.5 | 353.5 ± 0.1 | 445.0 ± 2.0 | 425.1 ± 2.2 | 10.1 ± 0.5 |
| HXE75 + 0.5 wt%_G_T | 127.4 ± 1.3 | 355.1 ± 1.3 | 445.6 ± 0.2 | 426.9 ± 0.9 | 10.1 ± 0.2 |
| HXE75 + 0.5 wt%_G_S | 128.2 ± 0.8 | 354.3 ± 0.8 | 443.3 ± 1.4 | 423.8 ± 1.0 | 10.2 ± 0.1 |
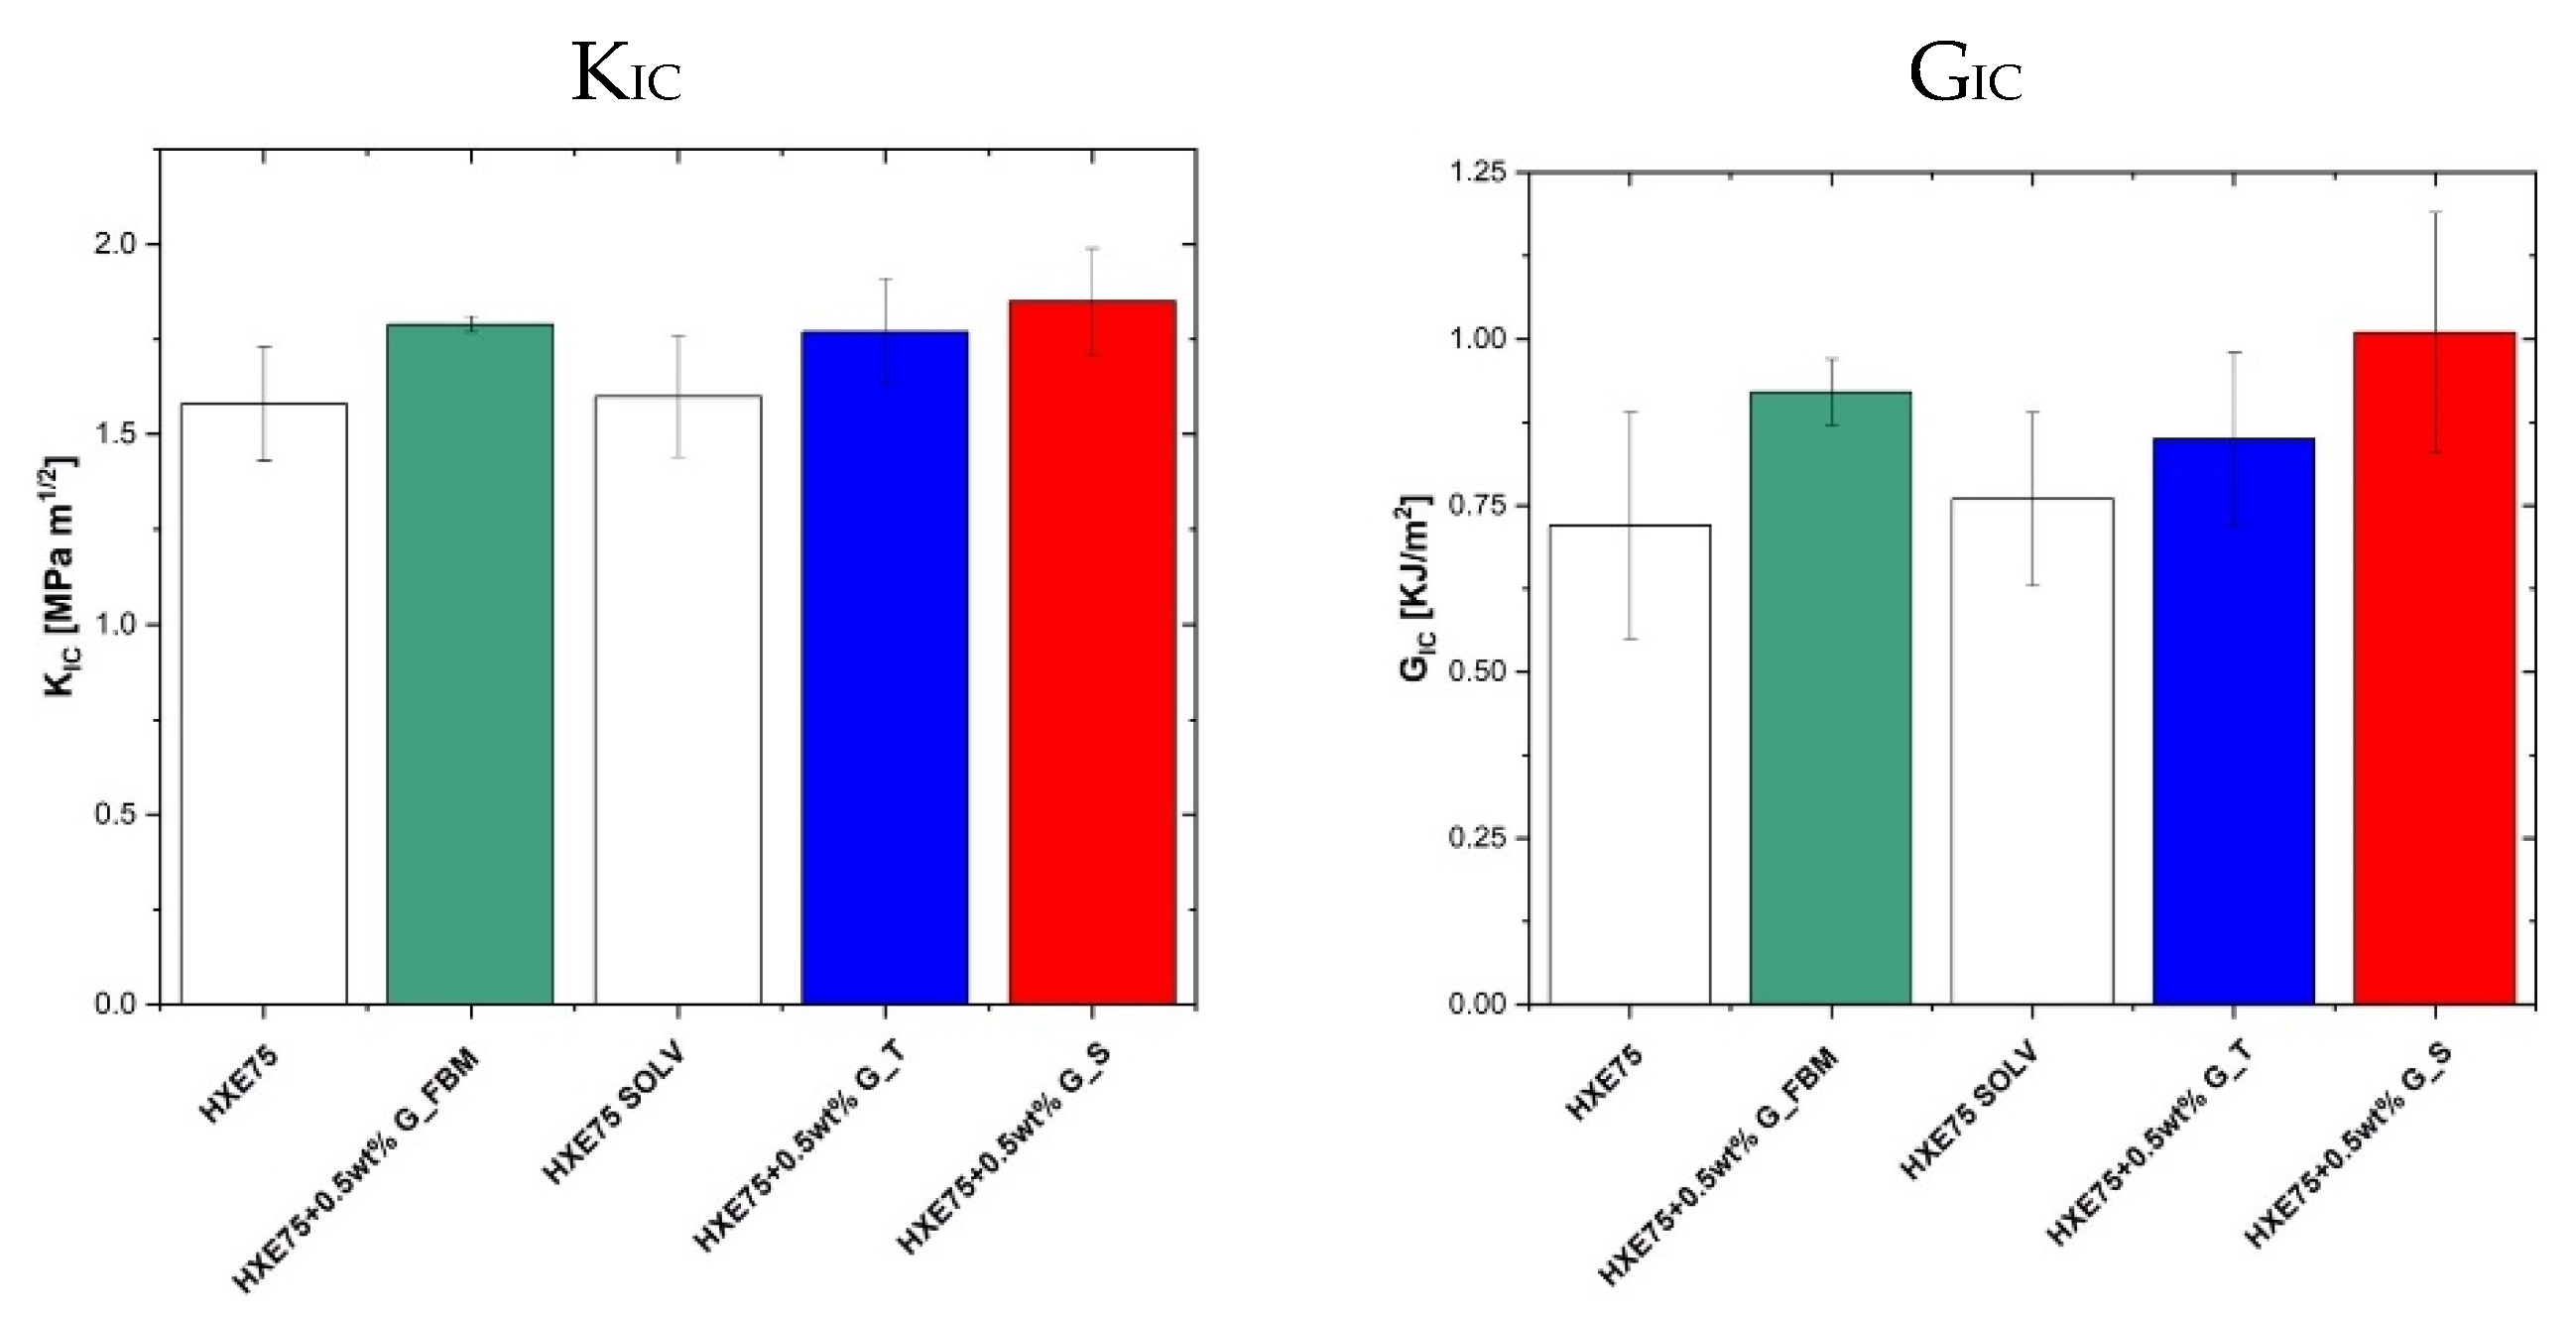
| Sample | TgDMA * [°C] | E’@30 °C ** [MPa] | KC [MPa m1/2] | ΔKC [%] | GC [KJ/m2] | ΔGC [%] |
|---|---|---|---|---|---|---|
| HXE75 | 137.8 ± 1.5 | 2859 ± 62 | 1.58 ± 0.15 | - | 0.72 ± 0.17 | - |
| HXE75 + 0.5 wt%_G_FBM | 142.5 ± 1.2 | 3069 ± 47 | 1.79 ± 0.02 | +13.3 | 0.92 ± 0.05 | +27.8 |
| HXE75_SOLV | 139.6 ± 2.1 | 2876 ± 52 | 1.60 ± 0.16 | - | 0.76 ± 0.13 | - |
| HXE75 + 0.5 wt%_G_T | 141.0 ± 1.6 | 2956 ± 34 | 1.77 ± 0.14 | +10.6 | 0.85 ± 0.13 | +11.8 |
| HXE75 + 0.5 wt%_G_S | 138.4 ± 2.1 | 2970 ± 46 | 1.85 ± 0.14 | +15.6 | 1.01 ± 0.18 | +32.9 |
| Sample | TgDSC [°C] | TOnset [°C] | TOffSet [°C] | TMAX [°C] | Char Yield [%] |
|---|---|---|---|---|---|
| HXE75 | 126.0 ± 1.1 | 354.1 ± 1.0 | 437.3 ± 0.7 | 419.7 ± 0.8 | 10.1 ± 0.1 |
| HXE75 + 0.5 wt% GANF_FBM | 129.1 ± 1.2 | 350.4 ± 0.4 | 436.4 ± 0.6 | 417.9 ± 1.3 | 11.0 ± 0.4 |
| HXE75 SOLV | 127.8 ± 1.5 | 353.5 ± 0.1 | 445.0 ± 2.0 | 425.1 ± 2.2 | 10.1 ± 0.5 |
| HXE75 + 0.5 wt% GANF _T | 126.9 ± 1.4 | 347.2 ± 0.4 | 434.1 ± 0.3 | 415.8 ± 0.4 | 10.8 ± 0.2 |
| HXE75 + 0.5 wt% GANF _S | 130.4 ± 2.0 | 353.7 ± 0.4 | 442.1 ± 0.8 | 424.1 ± 1.3 | 10.3 ± 0.5 |
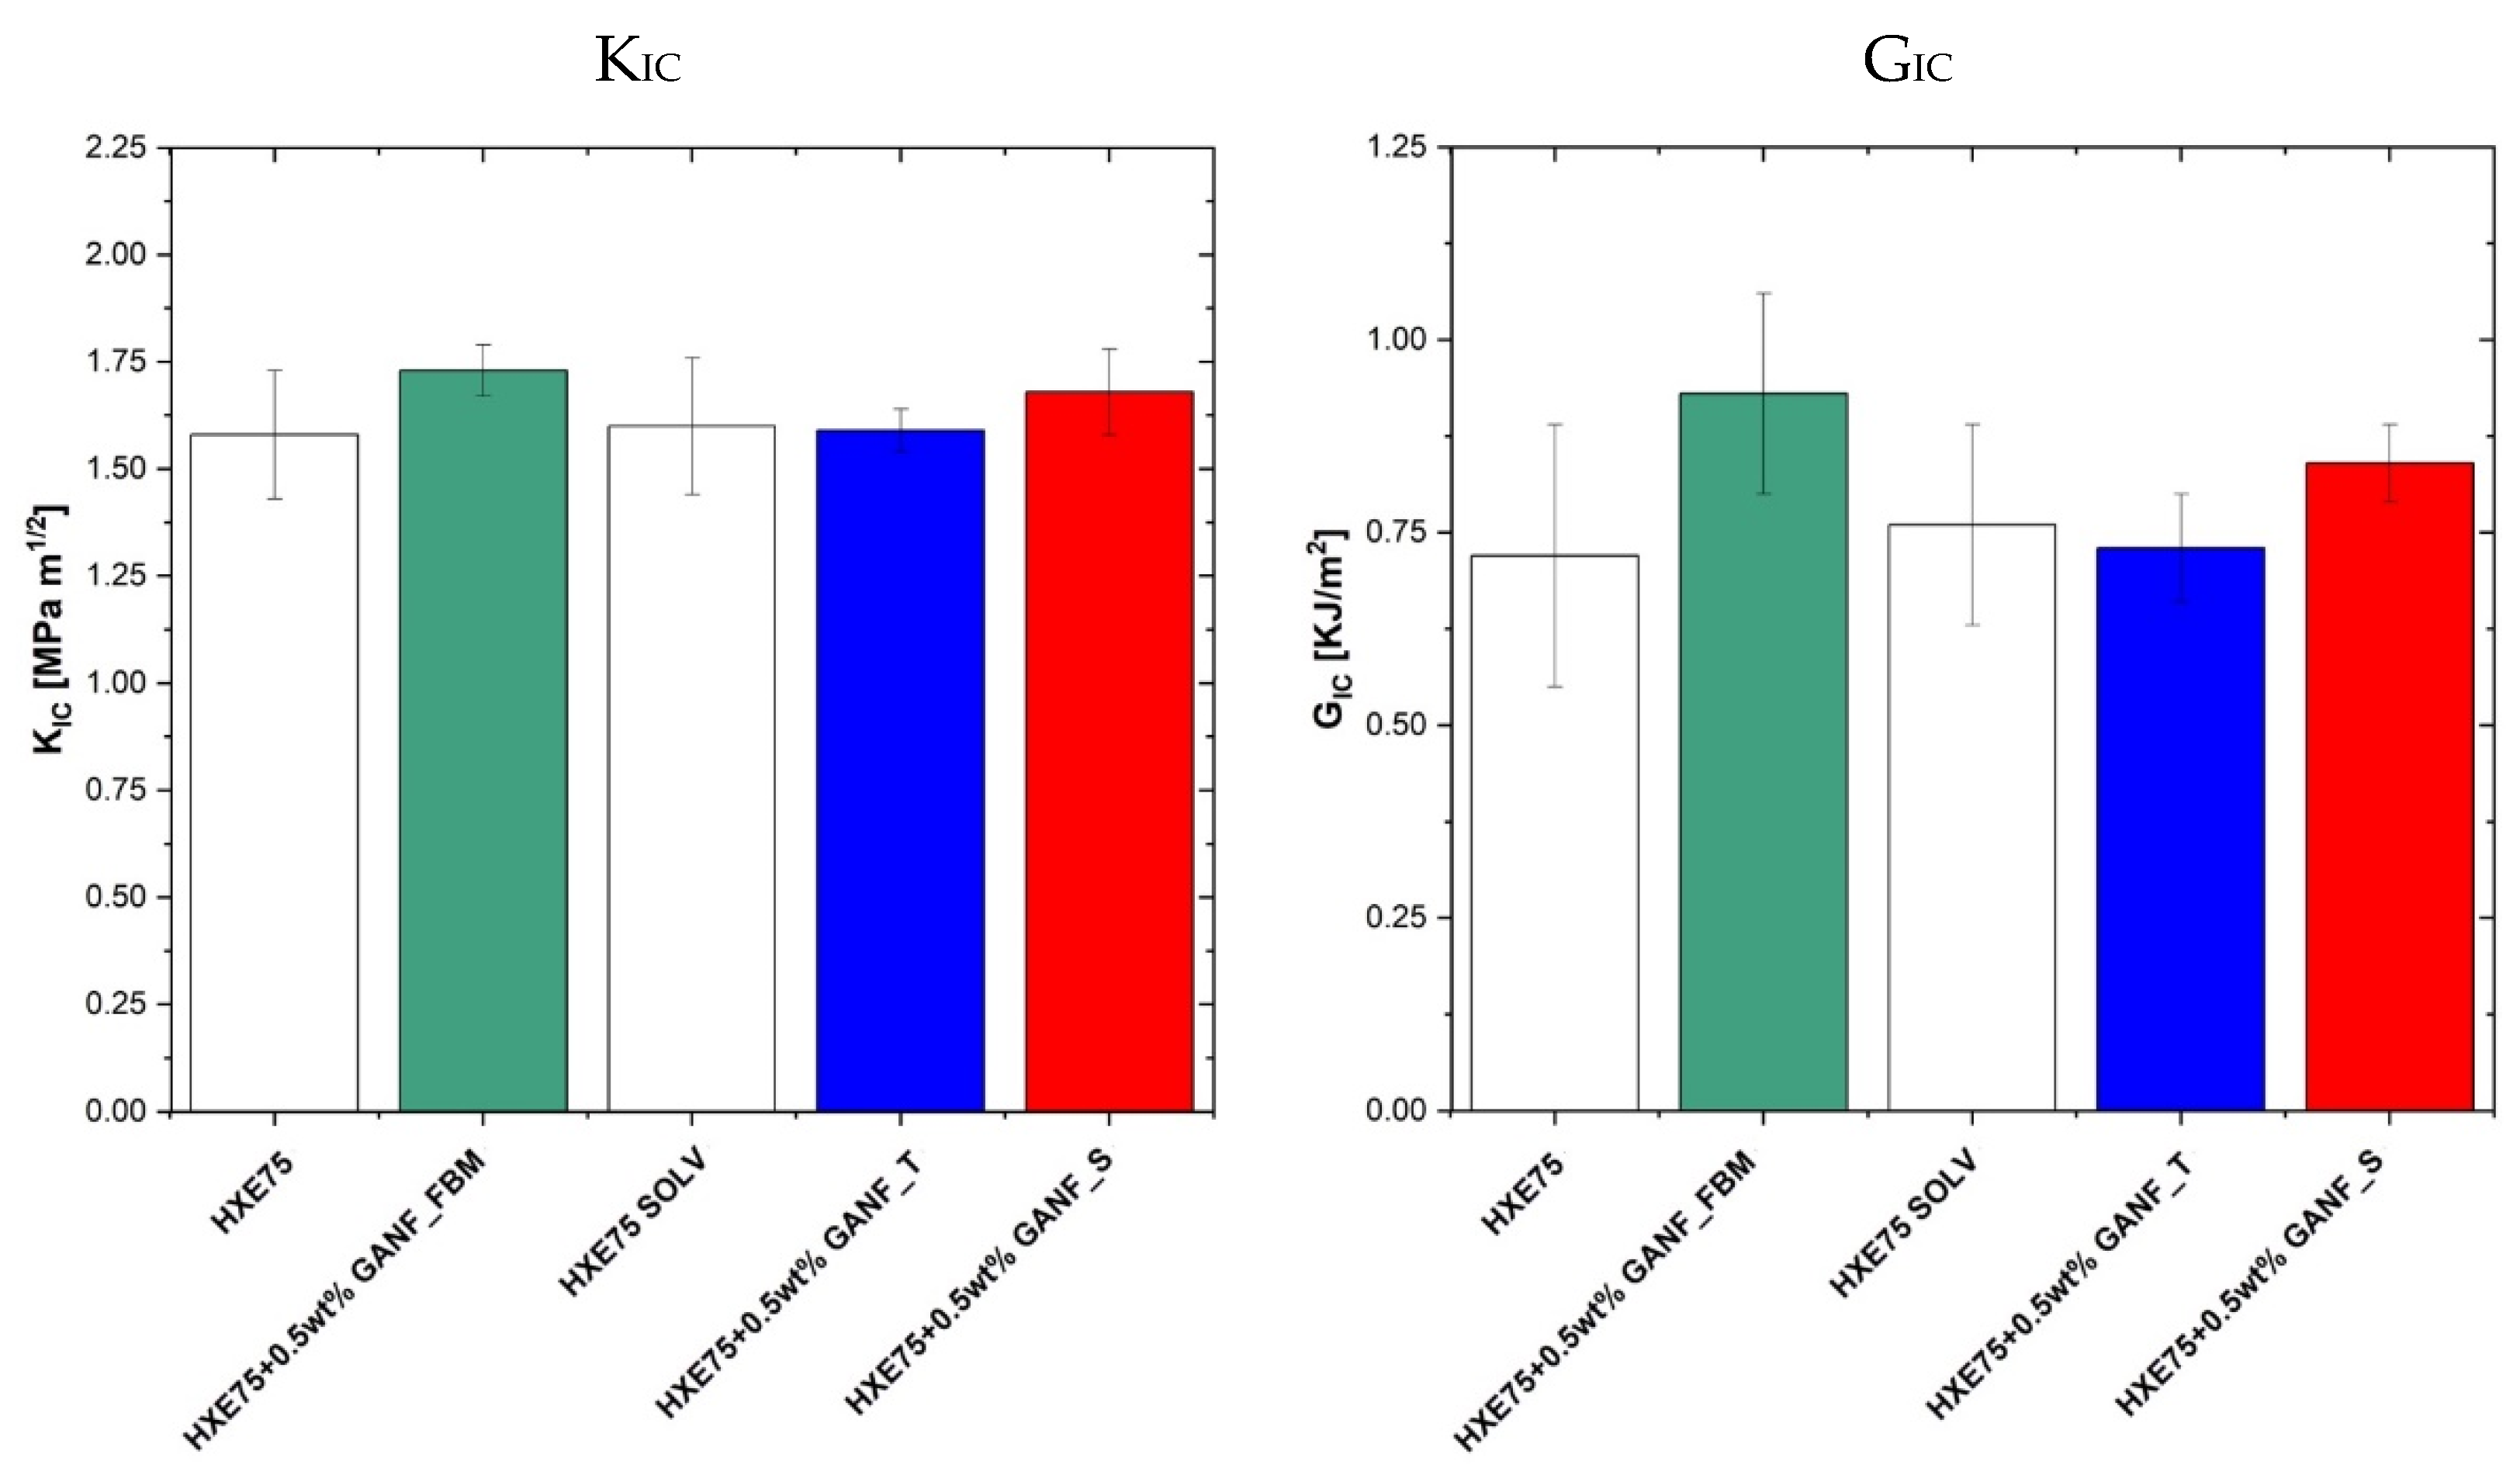
| Sample | TgDMA * [°C] | E’@30 °C ** [MPa] | KC [MPa m1/2] | ΔKC [%] | GC [KJ/m2] | ΔGC [%] |
|---|---|---|---|---|---|---|
| HXE75 | 137.8 ± 1.5 | 2859 ± 62 | 1.58 ± 0.15 | - | 0.72 ± 0.17 | - |
| HXE75 SOLV | 139.6 ± 2.1 | 2876 ± 52 | 1.60 ± 0.16 | - | 0.76 ± 0.13 | - |
| HXE75 + 0.5 wt% GANF _T | 140.1 ± 2.4 | 2941 ± 134 | 1.59 ± 0.05 | −0.6 | 0.73 ± 0.07 | −3.9 |
| HXE75 + 0.5 wt% GANF _S | 142.8 ± 1.8 | 2911 ± 74 | 1.68 ± 0.10 | +5 | 0.84 ± 0.05 | +10.5 |
| HXE75 + 0.5 wt% GANF_FBM | 144.5 ± 2.4 | 2896 ± 137 | 1.73 ± 0.06 | +9.5 | 0.93 ± 0.13 | +29.2 |
| ΔKIC [%] | ΔGIC [%] | Large-Scale Production Capability | |
|---|---|---|---|
| HXE75 + 0.5 wt% G_FBM | +13.3 | +27.8 | Yes |
| HXE75 + 0.5 wt% G_T | +10.6 | +11.8 | No |
| HXE75 + 0.5 wt% G_S | +15.6 | +32.9 | No |
| HXE75 + 0.5 wt% GANF_FBM | +9.5 | +29.2 | Yes |
| HXE75 + 0.5 wt% GANF _T | −0.6 | −3.9 | No |
| HXE75 + 0.5 wt% GANF _S | +5 | +10.5 | No |
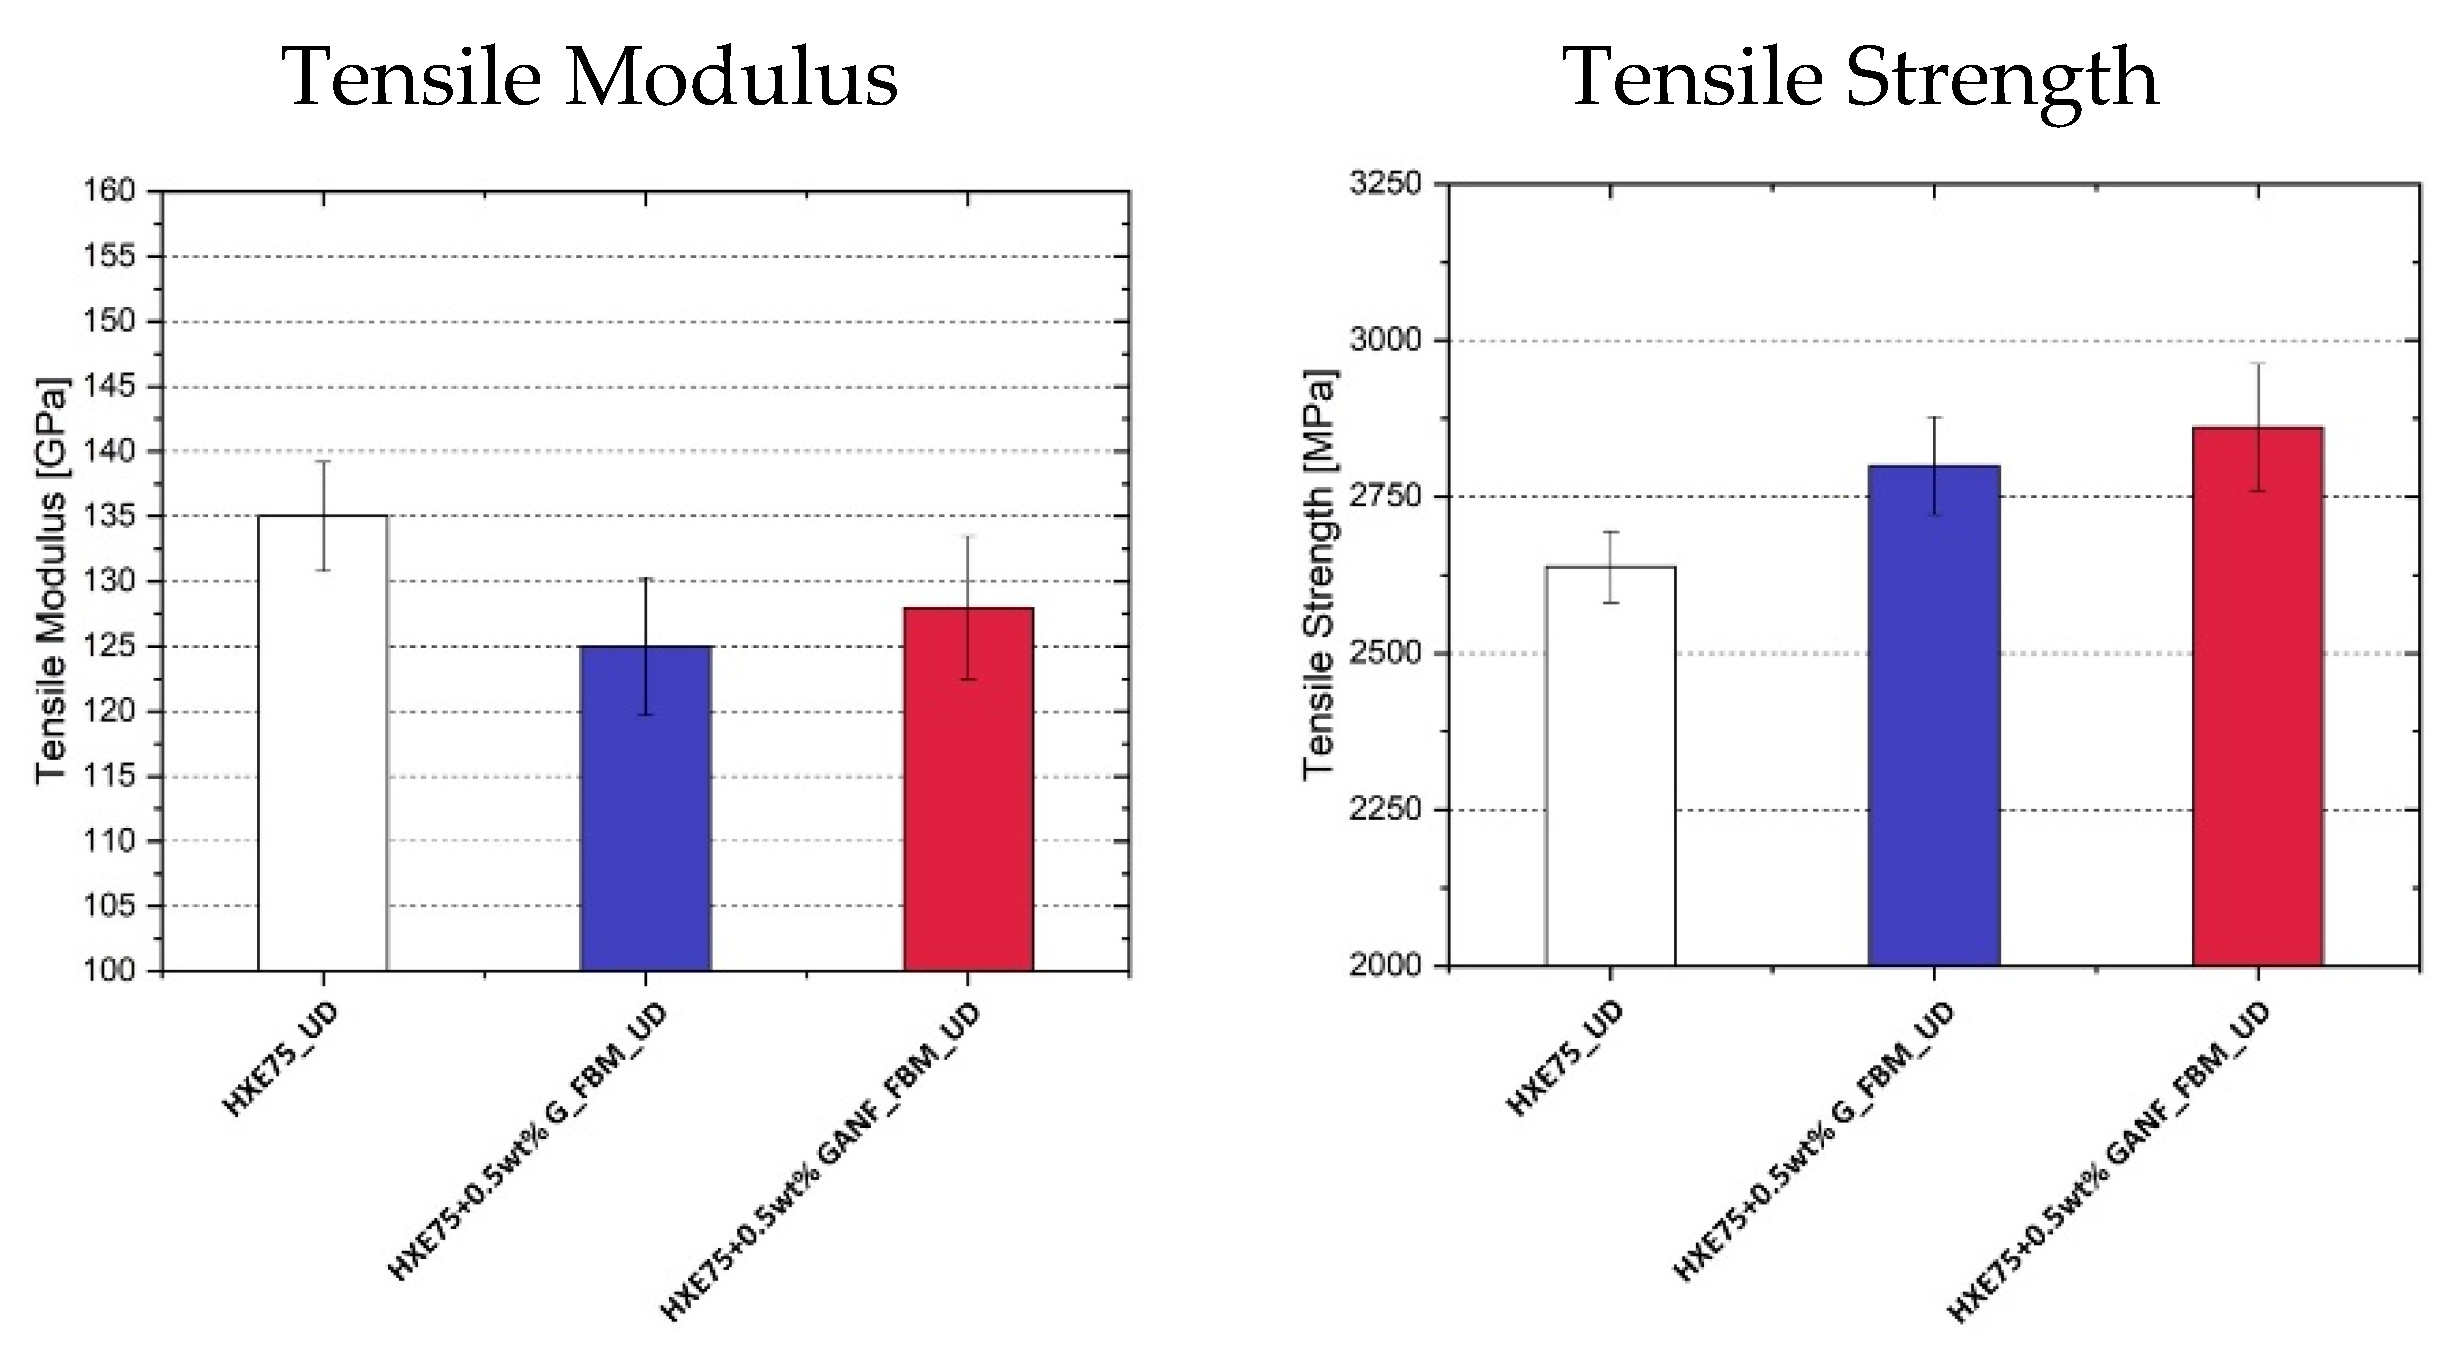
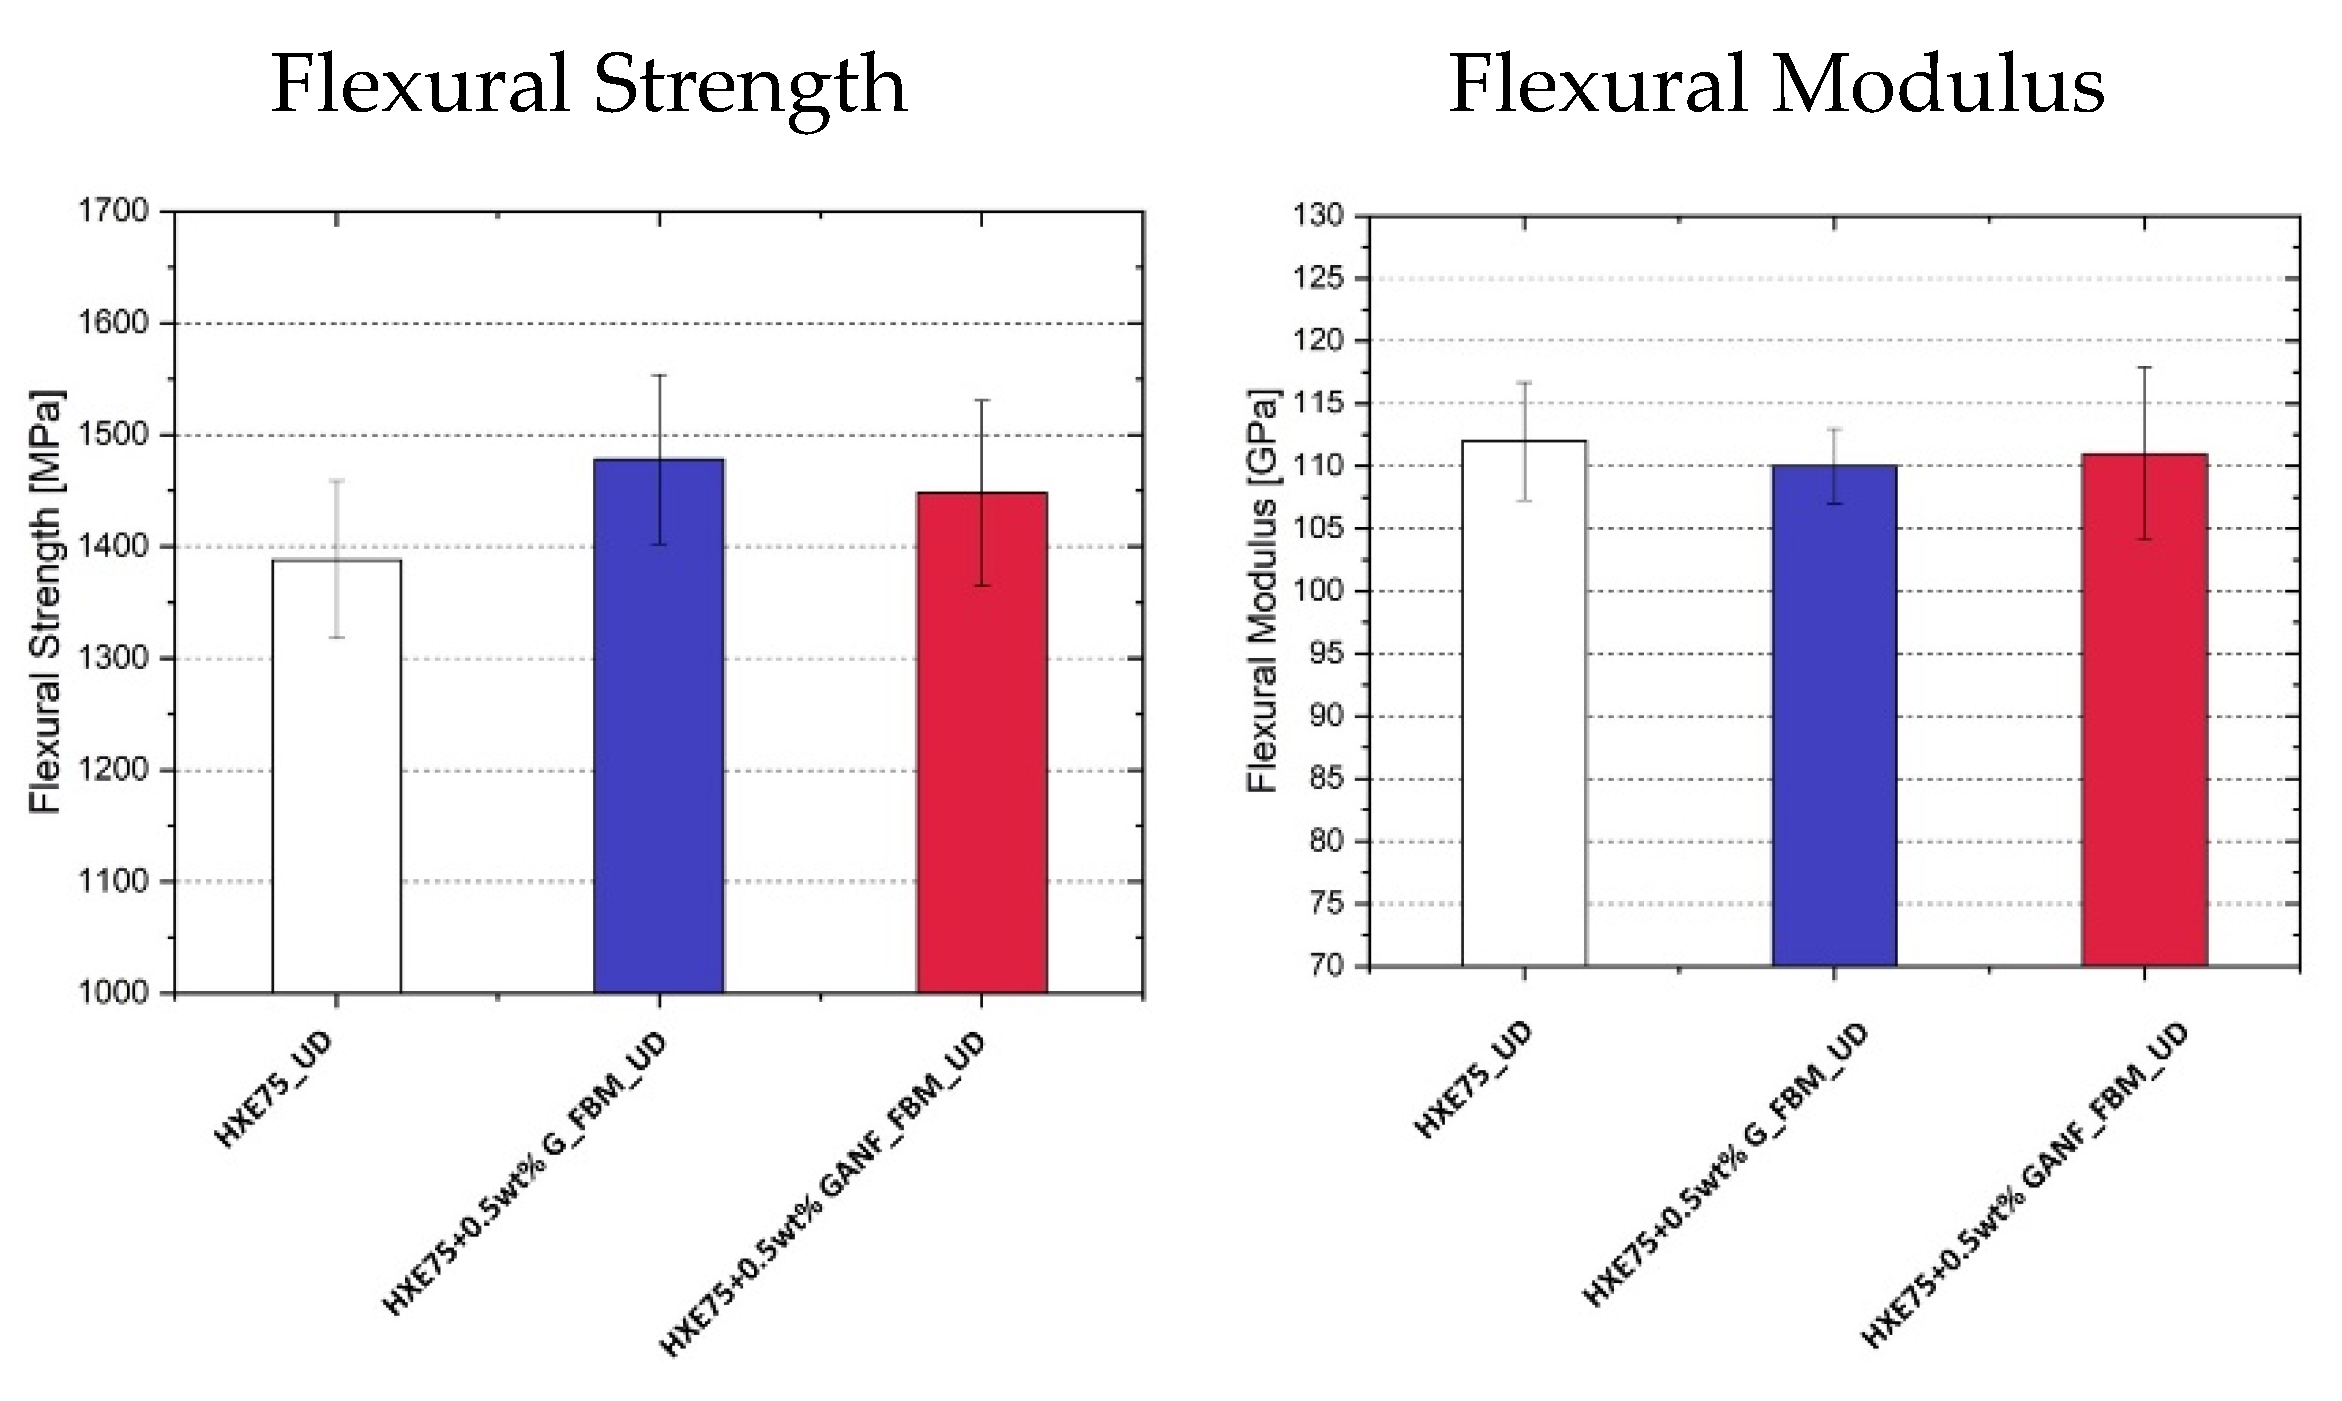
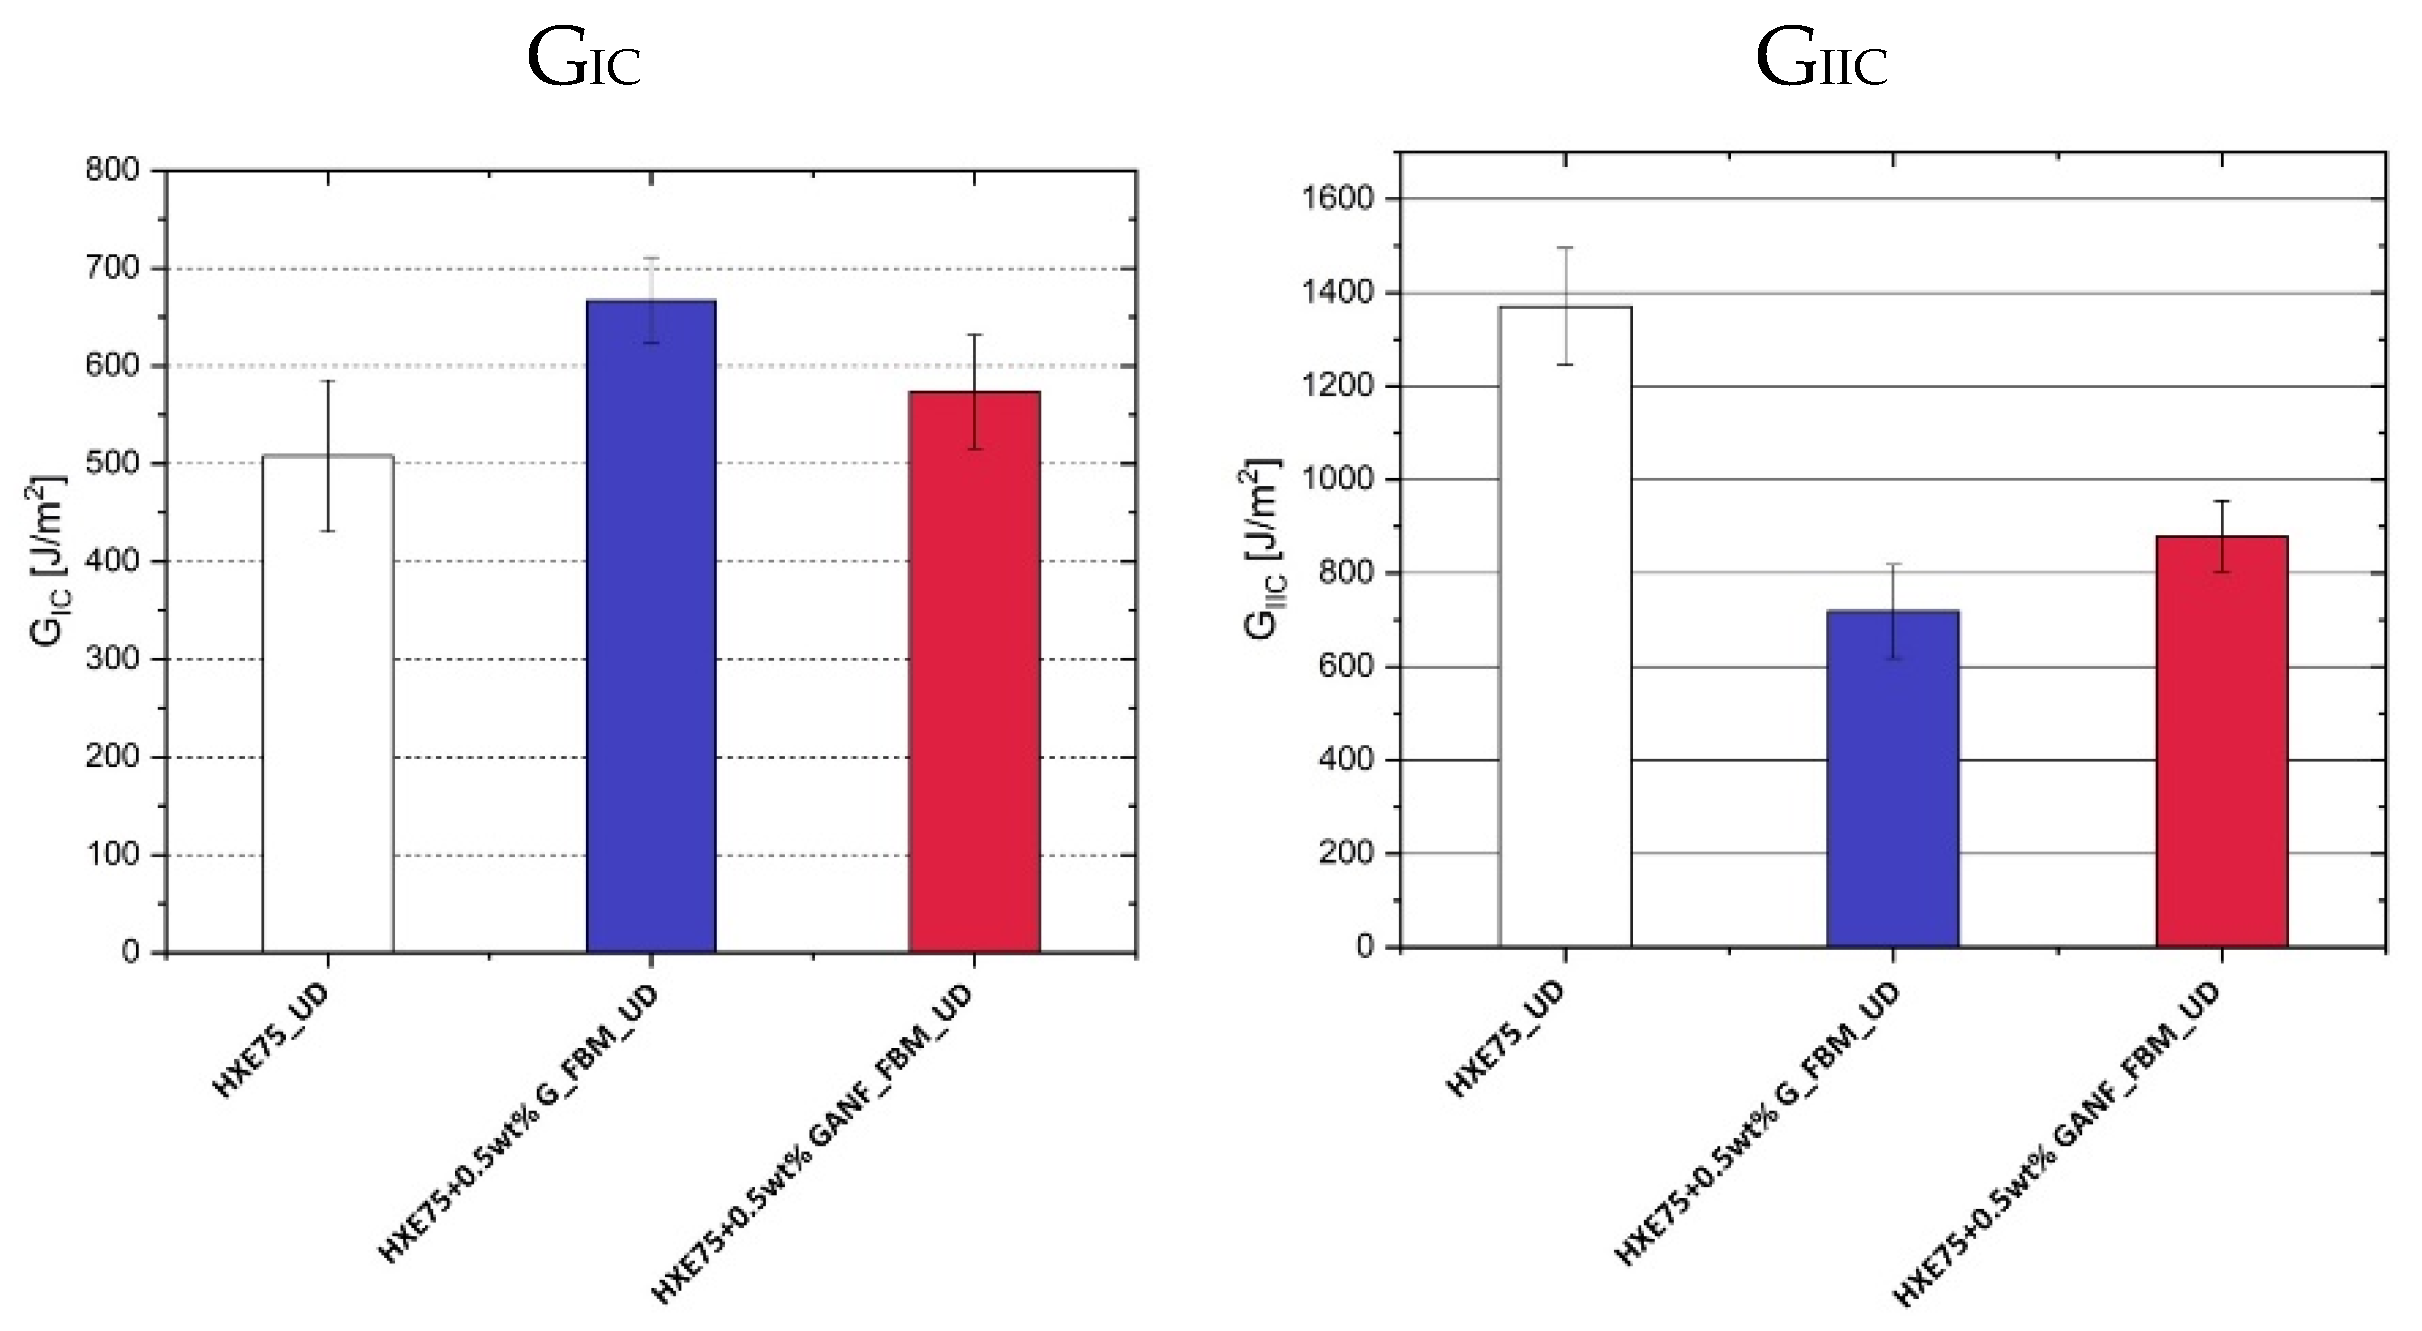
| Tensile Strength [MPa] | Tensile Modulus [GPa] | Flexural Strength [MPa] | Flexural Modulus [GPa] | GIC [J/m2] | GIIC [J/m2] | |
|---|---|---|---|---|---|---|
| HXE75_UD | 2638 ± 57 | 135 ± 4.2 | 1388 ± 98 | 112 ± 4.7 | 508 ± 77 | 1370 ± 125 |
| HXE75 + 0.5 wt% G_FBM_UD | 2800 ± 78 | 125 ± 5.3 | 1478 ± 76 | 110 ± 3.0 | 667 ± 44 | 718 ± 100 |
| HXE75 + 0.5 wt% GANF_FBM_UD | 2861 ± 101 | 128 ± 5.5 | 1448 ± 83 | 111 ± 6.9 | 573 ± 58 | 879 ± 76 |
Publisher’s Note: MDPI stays neutral with regard to jurisdictional claims in published maps and institutional affiliations. |
© 2022 by the authors. Licensee MDPI, Basel, Switzerland. This article is an open access article distributed under the terms and conditions of the Creative Commons Attribution (CC BY) license (https://creativecommons.org/licenses/by/4.0/).
Share and Cite
Zotti, A.; Zuppolini, S.; Borriello, A.; Vinti, V.; Trinchillo, L.; Borrelli, D.; Caraviello, A.; Zarrelli, M. Effect of the Mixing Technique of Graphene Nanoplatelets and Graphene Nanofibers on Fracture Toughness of Epoxy Based Nanocomposites and Composites. Polymers 2022, 14, 5105. https://doi.org/10.3390/polym14235105
Zotti A, Zuppolini S, Borriello A, Vinti V, Trinchillo L, Borrelli D, Caraviello A, Zarrelli M. Effect of the Mixing Technique of Graphene Nanoplatelets and Graphene Nanofibers on Fracture Toughness of Epoxy Based Nanocomposites and Composites. Polymers. 2022; 14(23):5105. https://doi.org/10.3390/polym14235105
Chicago/Turabian StyleZotti, Aldobenedetto, Simona Zuppolini, Anna Borriello, Valeria Vinti, Luigi Trinchillo, Domenico Borrelli, Antonio Caraviello, and Mauro Zarrelli. 2022. "Effect of the Mixing Technique of Graphene Nanoplatelets and Graphene Nanofibers on Fracture Toughness of Epoxy Based Nanocomposites and Composites" Polymers 14, no. 23: 5105. https://doi.org/10.3390/polym14235105
APA StyleZotti, A., Zuppolini, S., Borriello, A., Vinti, V., Trinchillo, L., Borrelli, D., Caraviello, A., & Zarrelli, M. (2022). Effect of the Mixing Technique of Graphene Nanoplatelets and Graphene Nanofibers on Fracture Toughness of Epoxy Based Nanocomposites and Composites. Polymers, 14(23), 5105. https://doi.org/10.3390/polym14235105