Article

Application of High-Photoelasticity Polyurethane to Tactile Sensor for Robot Hands

1
Research Organization of Science and Technology, Ritsumeikan University, Kusatsu 525-8577, Japan
2
Electrical Engineering Department, Graduate School of Science and Engineering, Kansai University, Suita 564-8680, Japan
3
Cloud Robotics Laboratory, Department of Robotics, Ritsumeikan University, Kusatsu 525-8577, Japan
4
Ritsumeikan Global Innovation Research Organization, Ritsumeikan University, Kusatsu 525-8577, Japan
*
Author to whom correspondence should be addressed.
Polymers 2022, 14(23), 5057; https://doi.org/10.3390/polym14235057
Submission received: 13 October 2022 / Revised: 18 November 2022 / Accepted: 18 November 2022 / Published: 22 November 2022

Abstract

:
We developed a tactile sensor for robot hands that can measure normal force (FZ) and tangential forces (FX and FY) using photoelasticity. This tactile sensor has three photodiodes and three light-emitting diode (LED) white light sources. The sensor is composed of multiple elastic materials, including a highly photoelastic polyurethane sheet, and the sensor can detect both normal and tangential forces through the deformation, ben sding, twisting, and extension of the elastic materials. The force detection utilizes the light scattering resulting from birefringence.

Graphical Abstract

1. Introduction

1.1. History

Various methods have been studied to detect the stress inside polymers using the birefringence of light [1,2,3,4,5,6,7,8,9,10,11,12,13,14,15,16,17,18,19,20,21,22,23,24,25,26,27,28,29]. A tactile sensor for stress detection using photoelastic, transparent, flexible, and robust polyurethane is expected to realize a highly sensitive robot hand tactile sensor that imitates the tactile sensation of a human finger, but the performance in grasping and lifting objects has not yet been fully verified [18,25].
Thus, we have found that polyurethane with a specific structure exhibits high photoelasticity, as we constructed a flexible force sensor using this polyurethane, as published previously [27]. Scheme 1 shows the mechanism for detecting the force perpendicular to the polyurethane sheet; in other words, the normal force. The birefringence generated inside a polymer scatters the incident light [30,31,32,33]. The mechanism of force-induced birefringence is explained in Appendix A [27].

1.2. Purpose of This Study

Our previously developed force sensor could not measure the force horizontal to the polyurethane sheet; in other words, the tangential force. Therefore, in this study, we devised a tactile sensor that can measure both normal and tangential forces.
One of the envisioned applications of this tactile sensor is a two-finger manipulator for robots [26]. Figure 1 shows the two-finger manipulator used in this study.
In this manipulator, the rotating shaft of a motor is connected to a pinion gear, and when the pinion gear rotates, the two opposing rack gears move parallel to each other, in opposite directions.
Two fingers are attached, one to each of these two rack gears, and the two fingers open and close as the rack gears move in parallel. The finger spacing is controlled by the rotation angle of the pinion gear.
Scheme 2 shows the manipulator grasping and lifting a soft bottle on a table. In the initial state, the bottle is stationary on the floor and the fingers of the manipulator do not touch the bottle. In the grasping stage, the manipulator’s fingers close and grasp the bottle. In this stage, the tactile sensor measures the normal force. In the lifting stage, the manipulator lifts the bottle, while maintaining the distance between the fingers. In this stage, the tactile sensor measures the tangential force due to the weight of the bottle. If the tangential force can be measured, the weight of the bottle can be determined. If the bottle slips during lifting, the tangential force is no longer detected, immediately confirming that the robot failed to grasp the bottle.
A robot also typically uses a camera and artificial intelligence image analysis to determine the position of grasped objects on a table. However, due to image analysis limitations, the robot may misidentify the position of the object. By measuring the tangential force, the robot can confirm that the bottle was grasped securely. This technology is very useful for systems that use mobile robotic dollies to serve food and drink, and to clear dishes [34,35,36]. The mobile robot may incorrectly measure the position of the tableware. This sensor helps the robot to instantly determine whether the tableware is fully grasped or not.
The goal of our research was to construct a low-cost grasping system, using a commercially available robot hand, and to apply it to a mobile robotic dolly system. The strain gauges used in traditional force sensors require expensive electronics to obtain a signal. In this study, we develop a tactile sensor that can detect signals with inexpensive measurement equipment.
Furthermore, in order to use a commercially available two-finger robot hand, the tactile sensor needs, not only a sensing function but also a cushioning function that does not lose the shape of the object when grasping a soft and fragile object [27]. This is because the ordinary commercially available robot hands do not have a function to control the grasping force of the hand by feeding back the grasping force detected by the tactile sensor. The tactile sensor’s cushioning function avoids applying a sudden force to the object.
This technology also has potential applications as a wearable human–machine interface [37,38,39,40,41,42,43,44].

2. Experimental Section
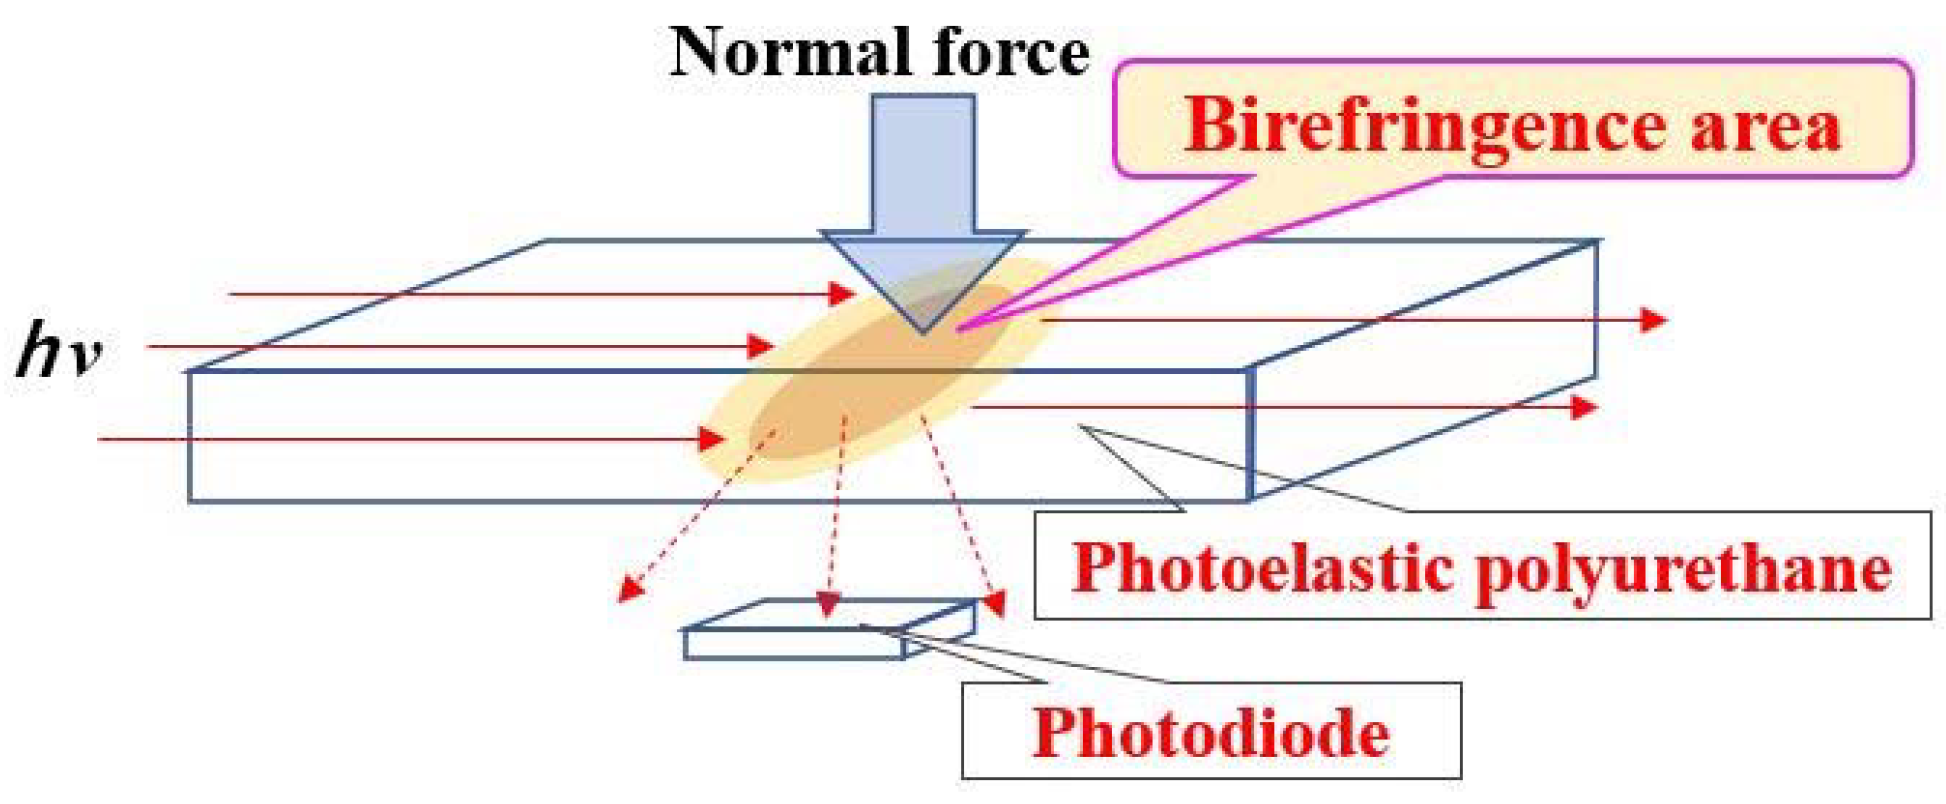
2.1. Outline

Figure 2 shows the structure of the tactile sensor in this work. The basic structure is almost the same as that of the force sensor in our previous paper [27], but the number of photodiodes is different. Three photodiodes, which detect scattered light, are embedded in a soft, black, 3 mm thick base rubber sheet with a Young’s modulus of 3.4 MPa. A silicone sheet of 0.2 mm thickness is laminated on the base rubber. The role of the silicone sheet was described in the previous paper [27].
Furthermore, a 2 mm thick polyurethane sheet and a 0.2 mm thick silicon sheet are sequentially laminated on the upper surface of the laminate. The Young’s modulus of the polyurethane sheet is 4.7 MPa. The layers are glued together with an elastic adhesive [27], and then a top cover made of soft black rubber with a thickness of 1 mm and a Young’s modulus of 3.4 MPa is glued on top of these layers. Then, the whole laminate is adhered to a support material made of hard resin. The support material is concave in the center, and the polyurethane sheet flexes into a convex shape when the cover material is pressured from above. The polyurethane used in this study has the sample name AR-2, whose composition and properties are described in detail elsewhere [27,28].
The entire sensor has the flexibility of rubber. The grasping surface of the sensor can be deformed into a concave shape of 1 mm or more in the normal direction, so that an object can be grasped without applying a sudden force. As a result, damage to the grasping object is avoided.
In this paper, the direction of force is indicated by the coordinate axes fixed to the tactile sensor, with the Cartesian x-axis parallel to the short side of the polyurethane sheet, the y-axis parallel to the long side of the polyurethane sheet, and the z-axis perpendicular to the polyurethane sheet surface.
The major difference from the force sensor in the previous paper [27] is that there are three photodiodes arranged in a triangular shape, as shown in Figure 3. Photodiodes PD1 and PD2 are placed parallel to the X-direction and the same length apart from the center of the sensor in opposite directions, while photodiode PD3 is shifted from the center of the sensor in the Y-direction.
By arranging the photodiodes in this way, the normal force (FZ) can be obtained from the average value of the outputs of PD1 and PD2, the tangential force (FX) in the X-direction is obtained from the difference between the outputs of PD1 and PD2, and the tangential force (FY) in the Y-direction is obtained from the output of PD3.
Three LEDs are used to irradiate the interior of the polyurethane sheet with light of uniform intensity.
This sensor utilizes the birefringence caused by the strain generated inside the polyurethane sheet. Figure 4a schematically shows the intensity of birefringence generated inside the polyurethane sheet when a normal force (FZ) is applied to the sensor. The polyurethane sheet is flexed by the normal force, creating birefringence in the center of the sheet.
Since the birefringence intensities generated near photodiodes PD1 and PD2 are almost equal, it is reasonable to assume that the average value of output of PD1 and PD2 represents the intensity of birefringence generated by the normal force.
Figure 4b conceptually shows the twisting of the polyurethane sheet when a tangential force FX is applied to the sensor simultaneously with the normal force FZ, and the resulting change in the position at which birefringence occurs. It was also confirmed by the simulation, using a finite element method, that such a twisting is caused by the tangential force FX.
When the twisting occurs, the displacement of the polyurethane sheet in the Z-direction decreases in the vicinity of photodiode PD1 and increases in the vicinity of photodiode PD2. As a result, the center of the birefringence region moves away from photodiode PD1 and approaches photodiode PD2. Such changes are detected as a decrease in output of PD1 and an increase in output of PD2.
Figure 4c conceptually illustrates the extension of the polyurethane sheet when a tangential force FY is applied to the sensor simultaneously with the normal force FZ and the resulting change in the position of the birefringence. This extension, caused by the tangential force FY, was also confirmed by finite element simulation.
When extension occurs, the displacement of the polyurethane sheet in the Z-direction decreases in the vicinity of the photodiode PD3, and the center of the region of birefringence moves away from PD3. Such a change in the central position of birefringence is detected as a decrease in output of the PD3.
This tactile sensor is characterized by its simplicity, in that the normal and tangential forces applied to the grasping object can be obtained from the output of only three photodiodes without any complicated amplification circuits.
Scheme 3 shows the circuits used for detecting the outputs of the photodiodes. Each photodiode is connected in series with a DC power supply and a resistor.
The current flowing out of each photodiode is detected by measuring the potential difference between the two ends of the resistor. From the values of current (jn) and resistance (Rn), the output Vn is obtained using
Vn = jn × Rn
where n = 1, 2, and 3 correspond to PD1, PD2, and PD3.
Hamamatsu Photonics S9066-211SB photodiodes are used, and these photodiodes have a built-in amplification circuit that amplifies the generated photocurrent by a factor of several thousand and outputs it [45].
Next, we describe how to adjust the resistance of the circuit. When the light-emitting diode (LED) is turned on with no stress applied to the tactile sensor, part of the incident light is detected by the photodiode. The resistor value Rn is adjusted so that the output Vn (n = 1, 2, or 3) becomes 2.0 V. Figure 5a is an oscillogram showing the outputs of the three photodiodes when an object is grasped and lifted. Figure 5b shows the effective output as Vefn (n = 1, 2, 3), which is obtained by subtracting the output before grasping (about 2.0 V) from each output.

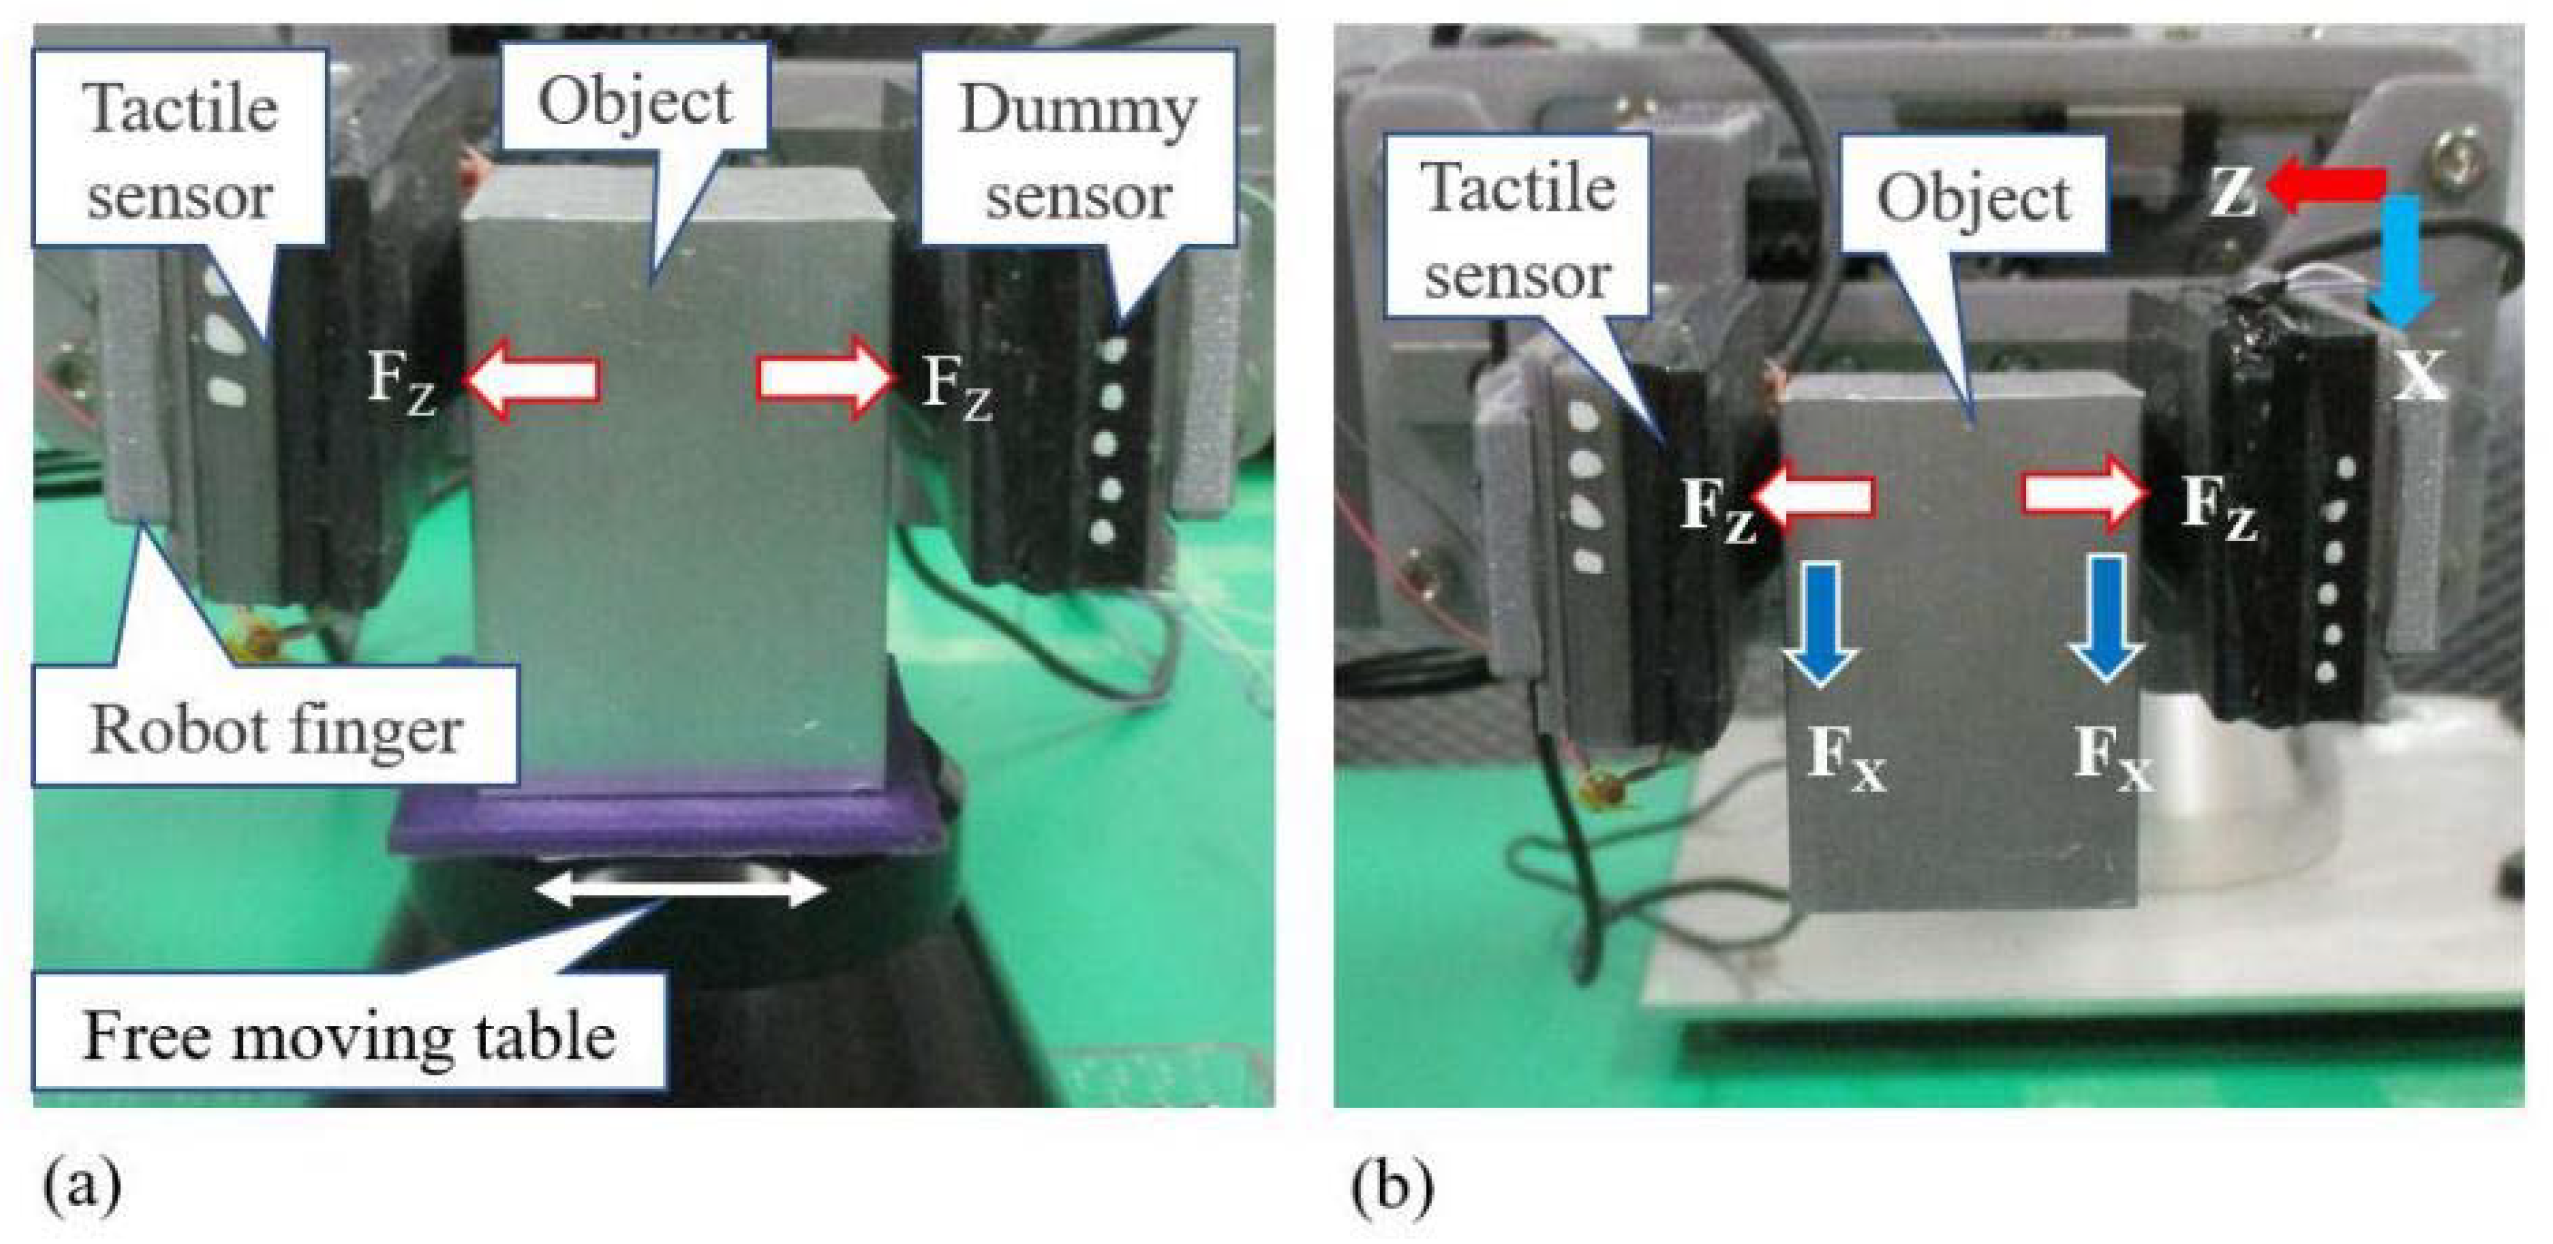
2.2. Measurement of Normal Force FZ

Figure 6a shows how the normal force FZ is measured using a force gauge. V12Z is the mean of Vef1 and Vef2 when the normal force is FZ:
V12Z = (Vef1 + Vef2)/2
Figure 6b is a graph showing the relationship between V12Z and FZ. FZ can be expressed as a quadratic function of V12Z:
FZ = C1 × V12Z + C2 × (V12Z)2
where C1 and C2 are constants.
Equation (4) is obtained by finding the constants that best match the values calculated using Equation (3) and the measured values:
FZ = 25.2 × V12Z − 13.6 × (V12Z)2
Figure 7a is a photograph of a robot hand grasping a cuboid object; the object is sandwiched between the left and right tactile sensors. The normal force is measured with the left tactile sensor. The right tactile sensor, which has the same elastic properties as the left tactile sensor, does not measure the force.
The object rests on a table that can move freely horizontally. Therefore, when the object is grasped from both sides, the normal forces FZ applied to the tactile sensors on both sides are opposite in direction but of the same in magnitude. The normal force FZ is obtained from the measured value of V12Z and using Equation (4).

2.3. Measurement of Tangential Force FX

Figure 7b is a photograph of the robot hand lifting a cuboid parallel to the sensor’s x-axis and perpendicular to the table.
The grasping surface of the sensor was made with 3D printing technology and is made of flexible, flat rubber, but is not adhesive.
Cuboids were used in these experiments because the center of gravity of cuboids is at the center and the sides of the cuboid are vertical, which simplified the analysis of tangential forces. The cuboids were made of aluminum or iron, and their surfaces were smooth. The experiments were conducted to the extent that slippage did not occur.
A tangential force FX was applied to the tactile sensor in the X-direction; the x-axis of the sensor was vertical. Figure 8a is an oscillogram showing the time variation of Vef1, which decreases by ΔV1X when transitioning from the grasping stage to the lifting stage (Video S1).
Figure 8b is an oscillogram showing the time variation of Vef2, which increases by ΔV2X when transitioning from the grasping stage to the lifting stage.
The sum of ΔV1X and ΔV2X is ΔV12X:
ΔV12X = ΔV1X + ΔV2X
The outputs in Figure 8 rapidly decreases or increases when the object is lifted. This is the result of immediate twisting of the polyurethane sheet. The relationship between the sheet twisting and the output change is explained in Figure 4b.

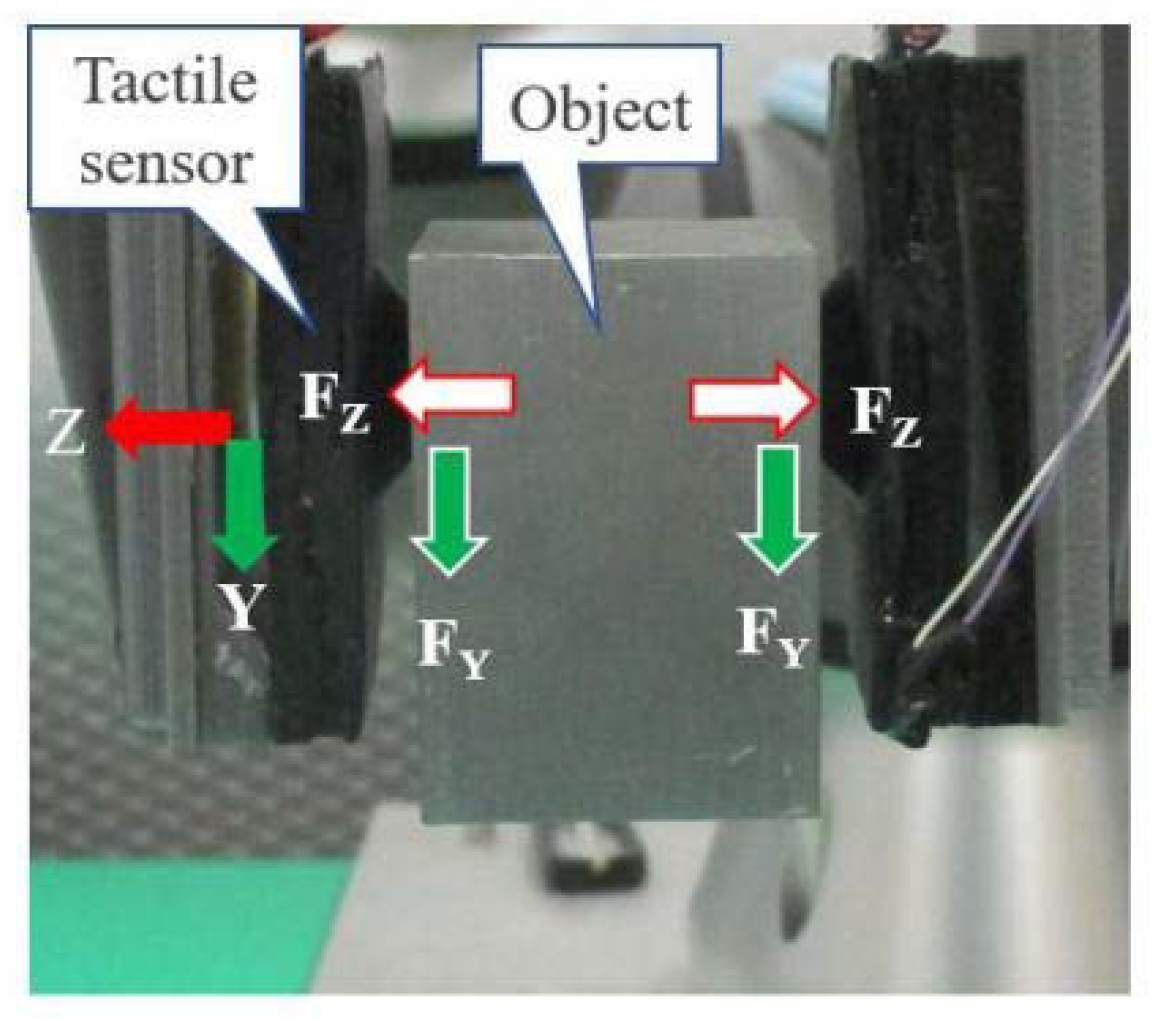
2.4. Measurement of Tangential Force FY

Figure 9 is a photograph of the object lifted parallel to the y-axis of the sensor and perpendicular to the table. A tangential force FY is applied to the tactile sensor in the Y-direction. Figure 10a is an oscillogram showing the time variations of Vef 1, Vef 2, and Vef 3. Figure 10b shows a rescaled graph of Vef 3. Vef 3 decreases by ΔV3Y from the grasping stage to the lifting stage.
The output in Figure 10b decreases rapidly when the object is lifted. This is a result of the force applied to the polyurethane sheet, causing the sheet to immediately extend in the Y-direction (Video S2). The relationship between the sheet extension and the output reduction is explained in Figure 4c.

3. Results and Discussion

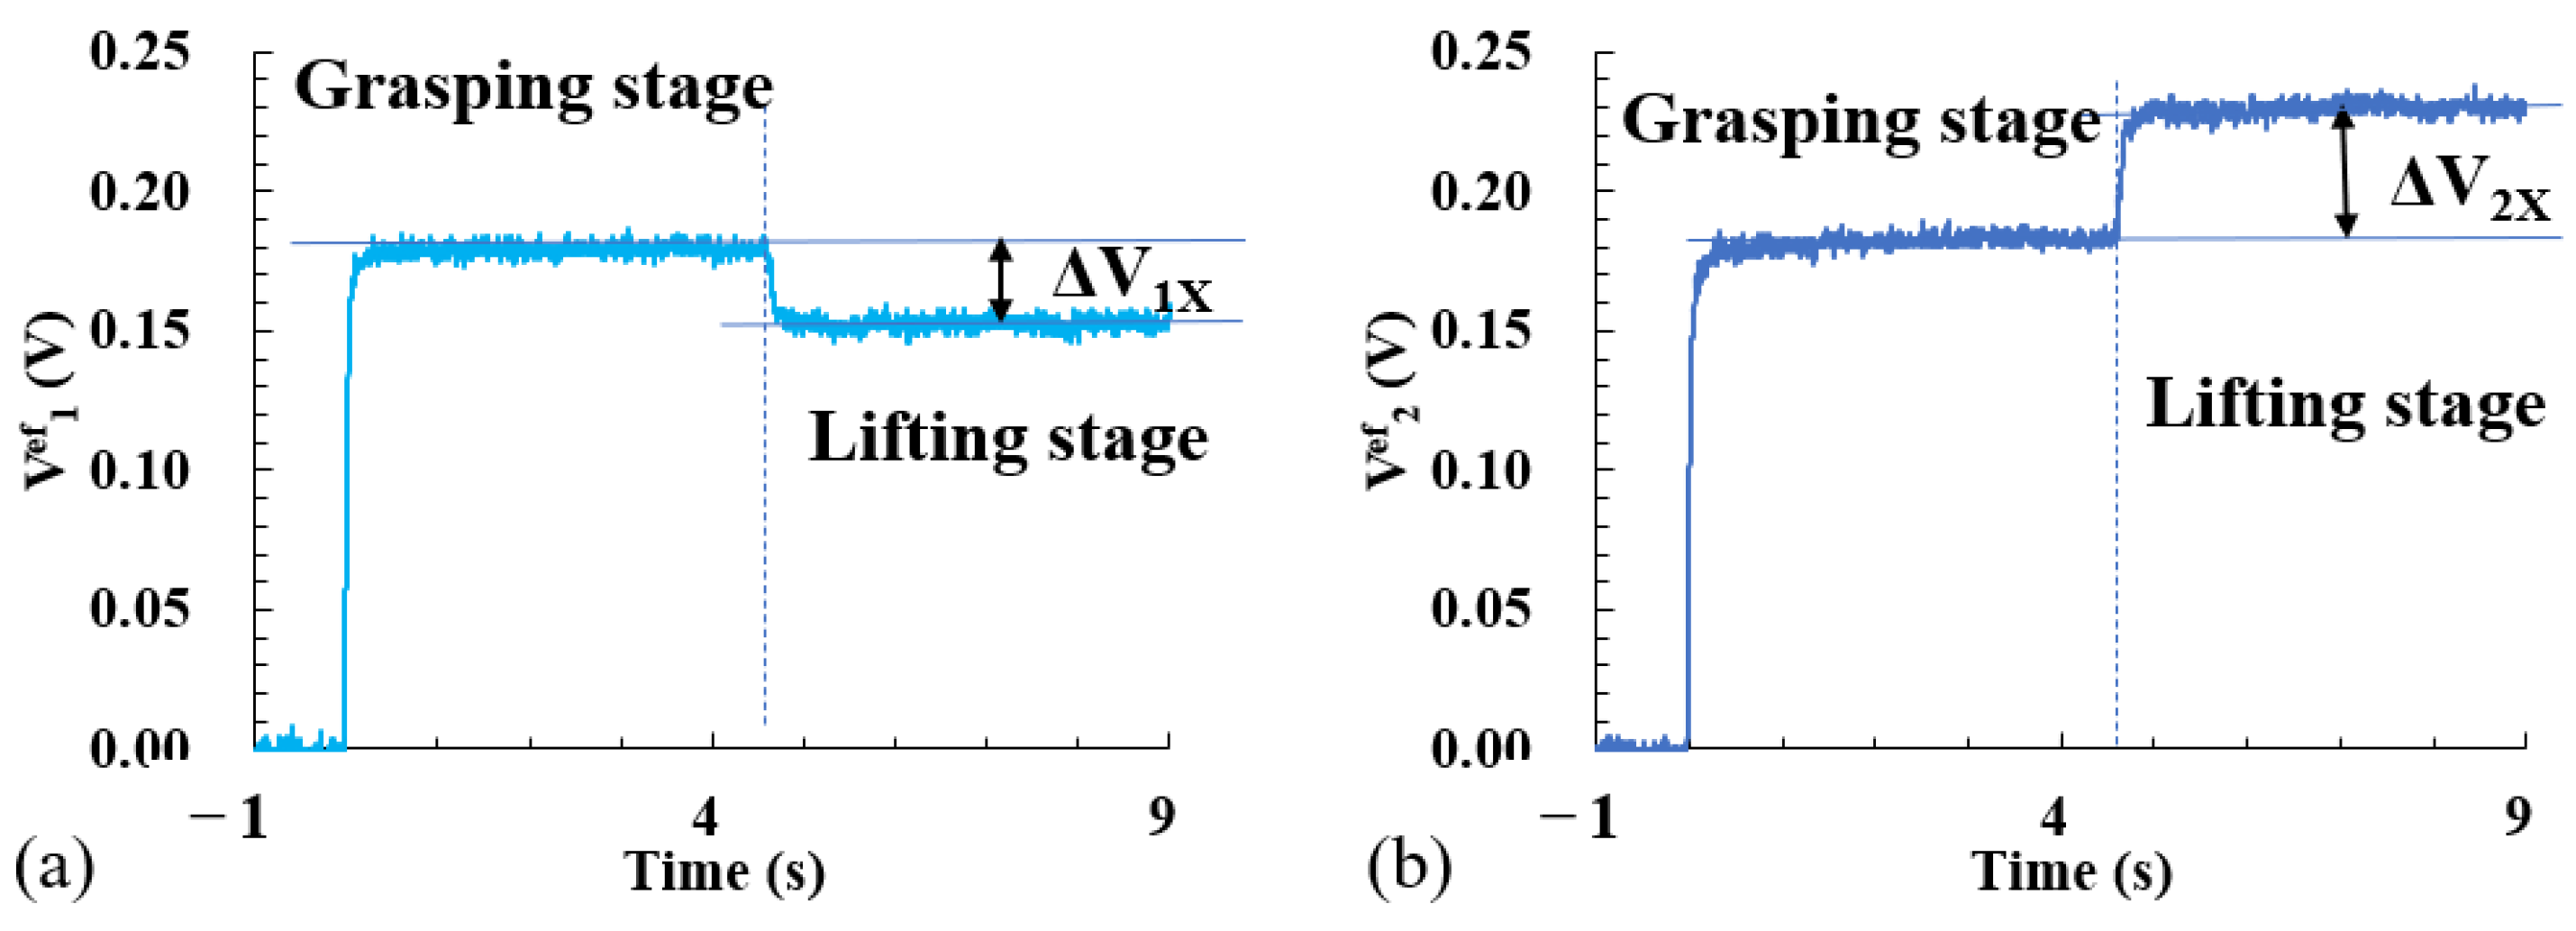
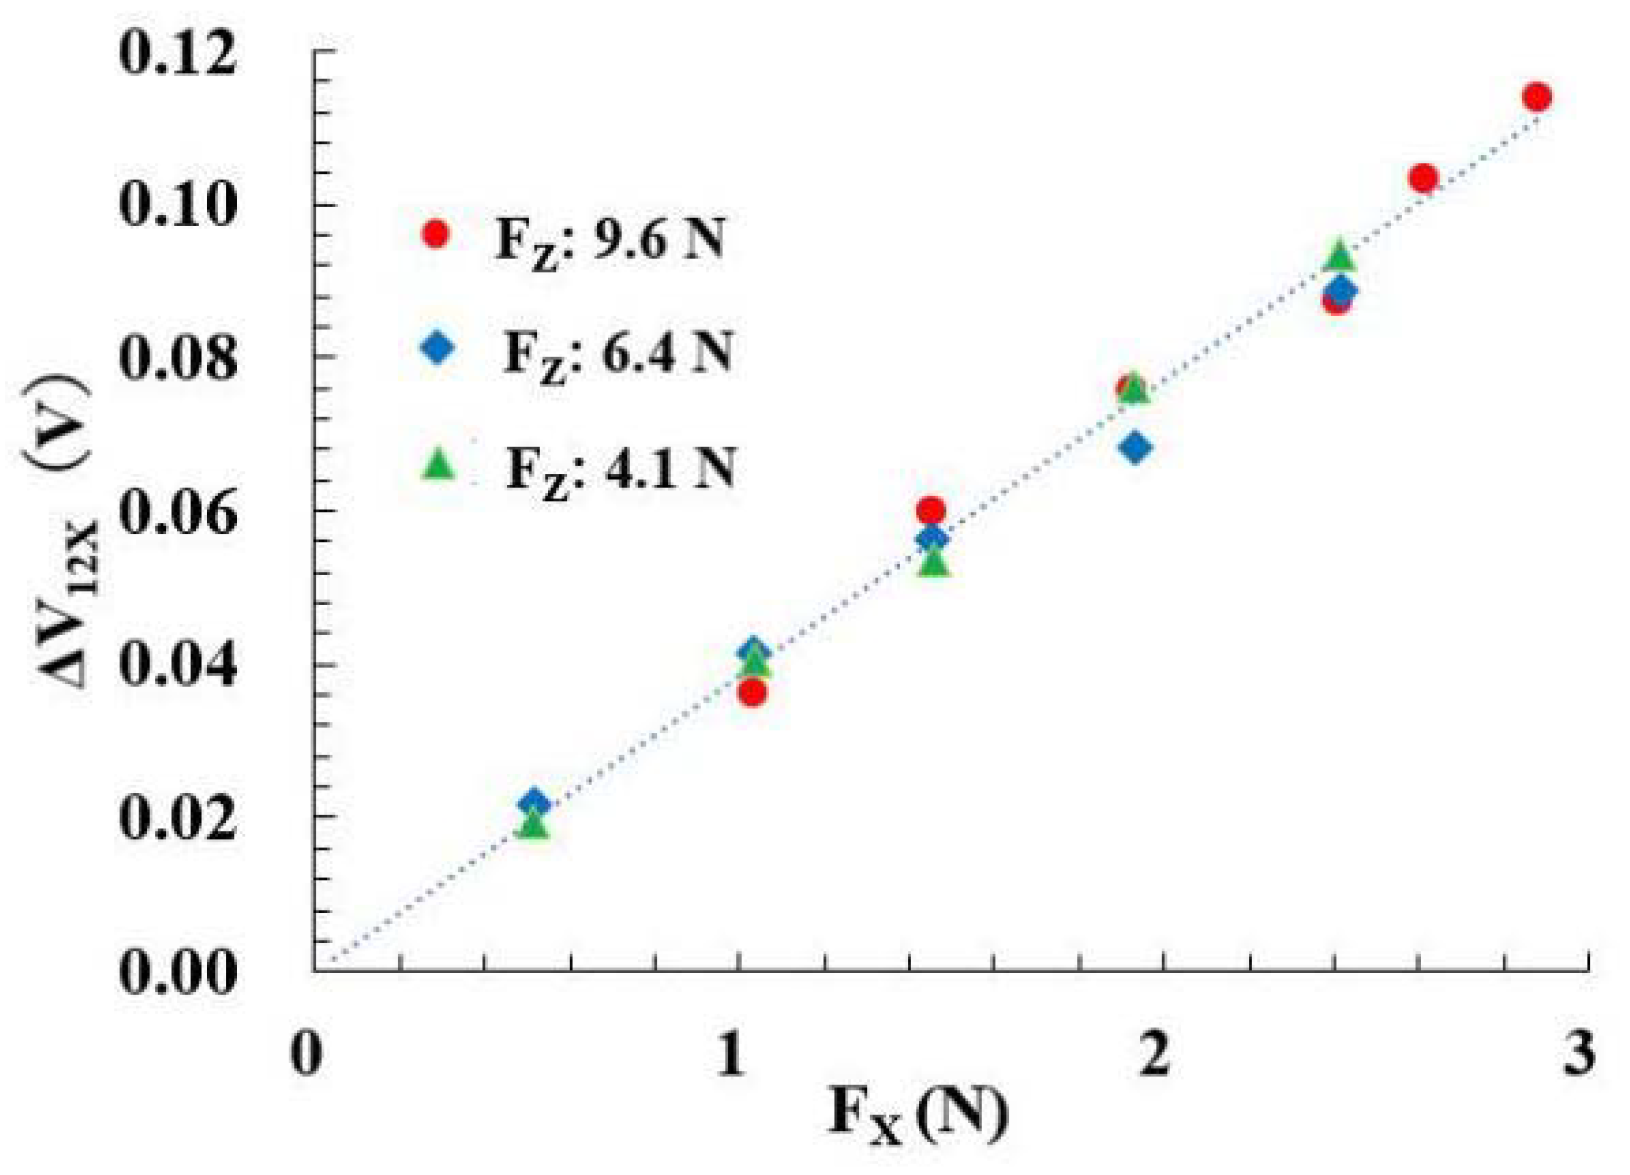
3.1. Analysis Result of Tangential Force FX

For the cuboid-lifting test shown in Figure 7, seven metal cuboids with different weights, ranging from 105 g to 589 g, were used.
The tangential force FX is given by the following formula:
FX = m × g/2
here, m is the weight of the cuboid and the g is gravitational acceleration.
The lifting test was conducted for grasping forces FZ of 9.6 N, 6.4 N, and 4.1 N. The results are shown in Figure 11. Each plot is the average of three measurements.
All measurements were on a straight line through the origin. The slope of the straight line did not change even when the normal force FZ was changed.
Therefore, when the value of ΔV12X is obtained from the output of the tactile sensor, the tangential force FX can be obtained using the following formula, independently of the normal force:
FX = 25.9 × ΔV12X

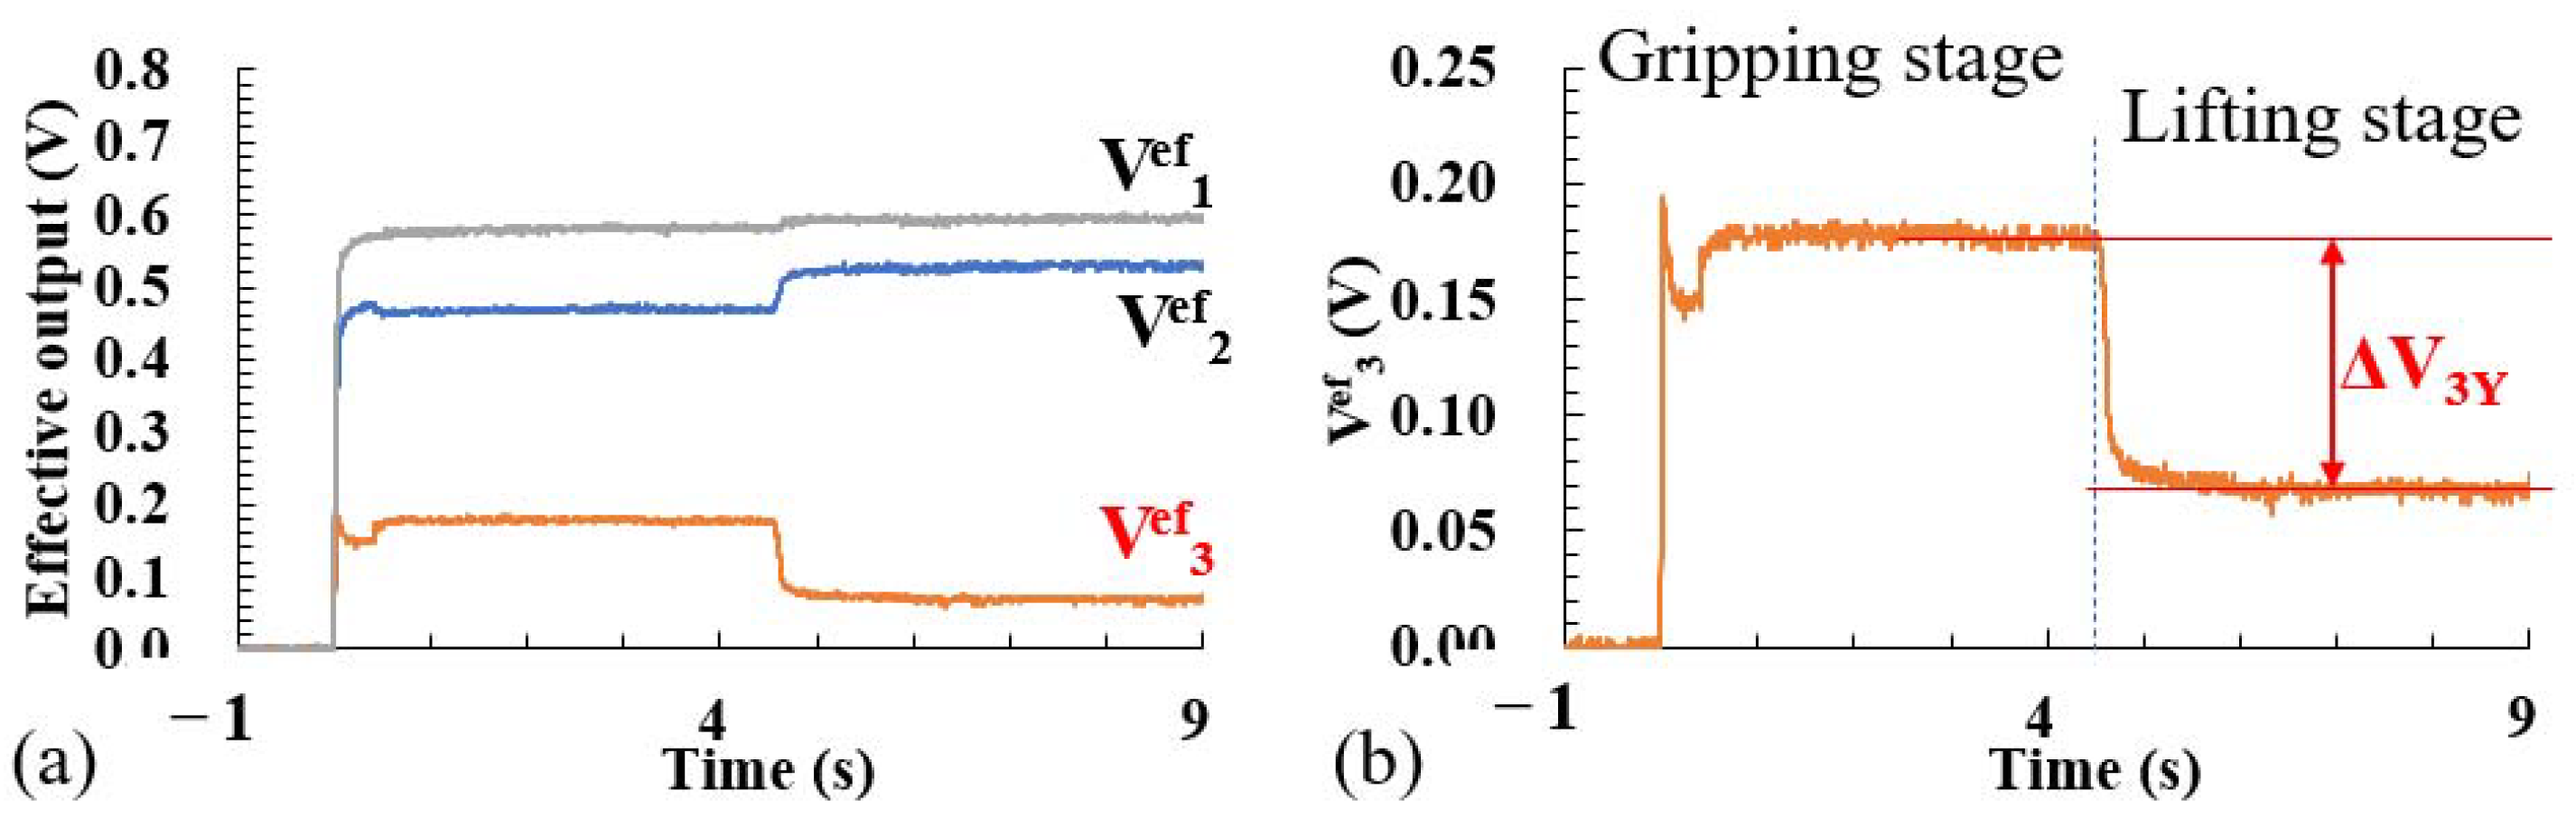
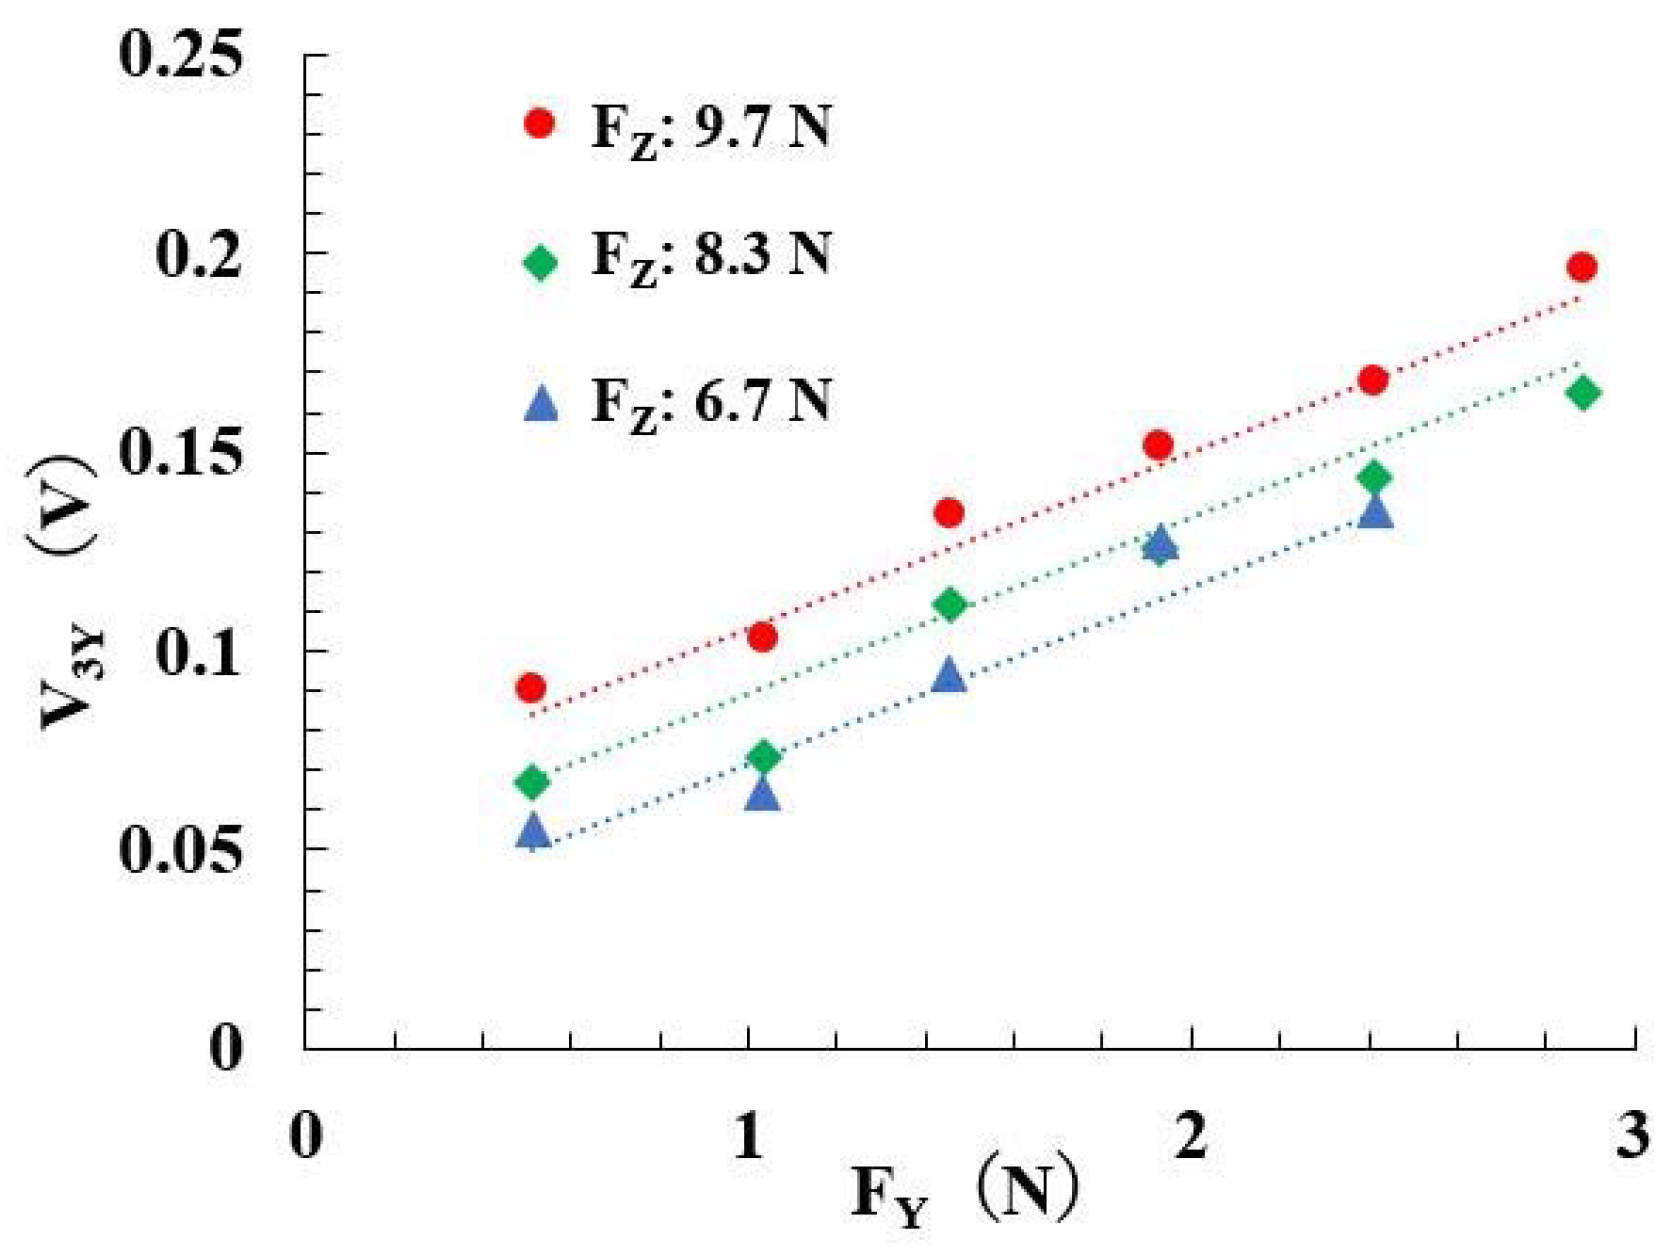
3.2. Analysis Result of Tangential Force FY

For the cuboid-lifting test shown in Figure 9, six metal cuboids, with weights ranging from 105 g to 589 g, were used.
Denoting the weight of the object by m and gravitational acceleration by g, the tangential force FY is obtained using the following formula:
FY = m × g/2
Lifting tests were carried out for normal forces FZ of 9.7 N, 8.3 N, and 6.7 N. The results are shown in Figure 12. Each plot is the average of three measurements.
The measurement results were plot on different straight lines for each FZ, but the slopes of the straight lines were the same.
Therefore, the relationship between ΔV3Y, normal force FZ, and tangential force FY is expressed by the following equation:
ΔV3Y = C3 + C4 × FZ + C5 × FY
where C3, C4, and C5 are constants.
Since the normal force FZ and the tangential force FY are known, the constants that give the best agreement between the values of ΔV3Y calculated using Equation (9) and the measured values of ΔV3Y yield
ΔV3Y = −0.0529 + 0.0118 × FZ + 0.0443 × FY
The dotted line in Figure 12 shows the result of Equation (10). From this equation, the tangential force FY can be obtained using the values of the normal force FZ and the measured value of ΔV3Y.

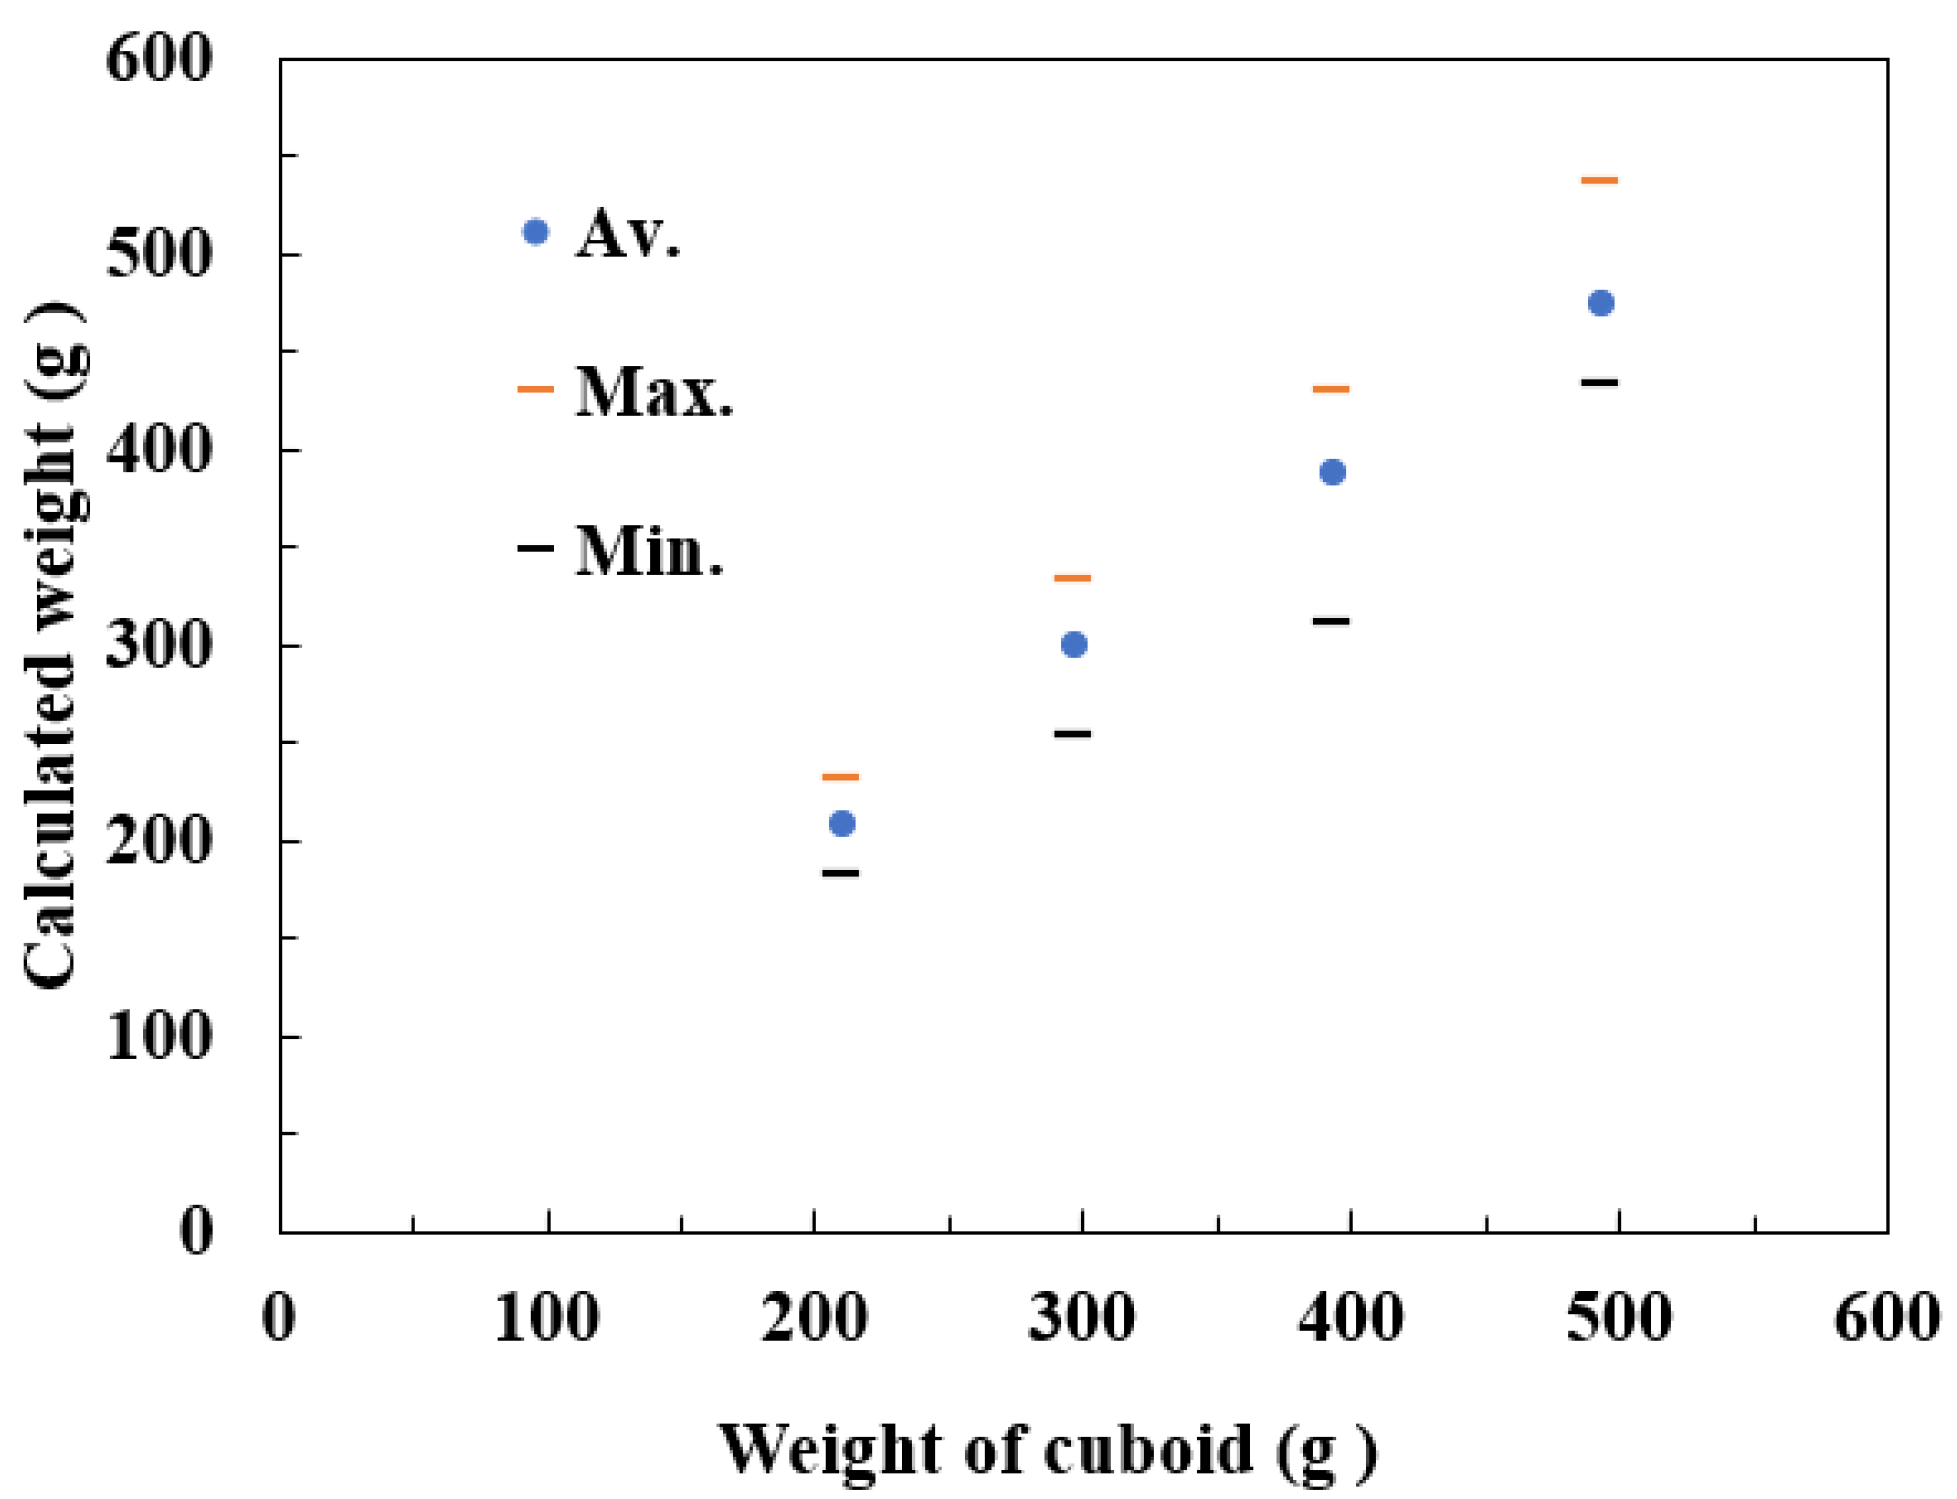
3.3. Accuracy of Measured Tangential Force

The iron cuboids weighing 211 g, 297 g, 394 g, and 493 g were each grasped and lifted nine times, with the sensor’s x-axis vertical. Figure 13 shows the relationship between the actual cuboid weight and the weight calculated from the sensor output ΔV12X using Equations (6) and (7). The circles in the figure indicate the average values of nine measurements, and the horizontal bars indicate the maximum and minimum values. The error between the average value of nine measurements and the actual cuboid weight was less than 4% of the actual weight. The standard deviations of nine measurements were 15.6 g for the 211 g cuboid and 42.0 g for the 493 g cuboid.

3.4. Discussion

Figure 4a schematically shows the intensity of birefringence generated inside a polyurethane sheet when a normal force FZ is applied to the sensor. The average values of Vef1 and Vef2 shown in Figure 5 are expected to represent the strength of birefringence due to normal force. Equation (3) shows the relationship between the output V12Z defined by Equation (2) and the normal force. Below, we use Equation (3) to evaluate the normal force.
When the polyurethane sheet is twisted, as shown in Figure 4b, the Z-direction displacement of the polyurethane sheet decreases near the photodiode PD1 and increases near the photodiode PD2. Such changes are detected as a decrease in Vef1 and an increase in Vef2. This change is expressed as an increase in ΔV12X, defined by Equation (5).
As shown in Figure 11, ΔV12X and FX are proportional, as shown in Equation (7). It can be seen that this relationship is independent of the magnitude of the normal force.
When the polyurethane sheet is stretched, as shown in Figure 4c, the Z-direction displacement of the polyurethane sheet decreases in the vicinity of the photodiode PD3, and the center of the birefringent region moves away from PD3. Such a change in the center position of birefringence was detected as a decrease in Vef3, as shown in Figure 10.
The tangential force along the y-axis is expressed as a function of V3Y and the normal force, as shown in Equation (10).
As shown in Figure 13, the tangential force measurement accuracy of this sensor is limited. When a 211g cuboid was weighed nine times, the average weight (μ) was 208 g and the standard deviation (σ) was 15.6 g. Assuming that the measurement results follow a normal distribution, one measurement result will fall within the range μ ± 3σ with a probability of 99.7%. It is estimated that re-weighing the 211 g cuboid would give a value in the range of 161 g to 255 g with a probability of more than 99%. Therefore, the measurement accuracy of the tangential force of this sensor is sufficient to confirm that an object, such as tableware or a soft bottle, has been lifted.
Interestingly, the measurement error tended to increase as the weight of the cuboid increased. This phenomenon can be considered as follows:
The heavier the cuboid, the greater the deformation of the rubber of the top cover of the tactile sensor, causing a partial slipping phenomenon at the contact interface between the rubber and the cuboid; and the degree of twisting of the polyurethane sheet may vary for each measurement. Clarifying the relationship between the weight of the cuboid and this error is an issue for the future.

4. Conclusions

The sensor we developed previously could only measure the normal force. However, this sensor, which has three LEDs and three photodiodes arranged at specific positions, can measure, not only the normal force in the z-axis, but also the x-axis tangential force and the y-axis tangential force.
The magnitude of the normal force FZ applied to the tactile sensor in the grasping stage can be estimated from the mean value V12Z of the effective outputs of photodiodes PD1 and PD2:
FZ = 25.2 × V12Z − 13.6 × (V12Z)2
The tangential force FX to the tactile sensor when the normal force FZ is applied to the tactile sensor can be obtained from the following equation:
FX = 25.9 × ΔV12X
where ΔV12X is the sum of the effective decrease in output ΔV1X of photodiode PD1 and the effective increase in output ΔV2X of photodiode PD2.
The tangential force FY to the tactile sensor can be estimated from the following equation, when the normal force FZ is applied to the tactile sensor:
ΔV3Y = −0.0529 + 0.0118 × FZ + 0.0443 × FY
where ΔV3Y is the decrease in the effective output of photodiode PD3.
The measurement accuracy of the tangential force of this sensor is sufficient for confirming that an object, such as tableware or a soft bottle, has been lifted.
Moreover, the strain gauges used in traditional force sensors require low noise, high accuracy, and expensive electronics to deliver the signal to the end user. Therefore, they is not suitable for low-cost grasping systems.
Various grasp sensors have been proposed [46,47,48,49,50,51,52,53,54,55,56,57,58,59,60,61,62,63,64,65], including MEMS sensors [51,52,53,54,55,56,57,58,59,60,61,62,63], some of which were able to measure normal and tangential forces [58,59,60]. However, they had complex structures and required special detection circuits.
Vibro Touch technology [65] can detect the contact between an object and a robot finger with high sensitivity, by detecting attenuation of vibration. This sensor is expected to be cheaper to manufacture than MEMS and strain gauge sensors. Furthermore, since this sensor has a cushion function, it can be attached to a commercially available manipulator.
However, quantification of the grasping force and the tangential force has not yet been demonstrated. In addition, there is the issue of high noise levels, due to the use of an acceleration sensor. Furthermore, vibration attenuation is concerned as it depends on the shape, hardness, density, and elastic modulus of the object, but these have not yet been studied.
The tactile sensor in this study is expected to be low cost because it detects force by converting the photocurrent from the photodiode into a voltage without an amplifier circuit. In addition, the signal noise is low, and almost no processing is required to remove noise. The photodiodes and LEDs used are inexpensive commercial items.
Furthermore, since this tactile sensor has a cushion function, a commercially available robot hand can be used. This is because the ordinary commercially available robot hands do not have a function to control the grasping force of the hand by feeding back the grasping force detected by a tactile sensor. This tactile sensor avoids exerting a strong impact on the object by deforming the grasping surface.
Furthermore, this tactile sensor has a flexible structure, deforms according to the magnitude of the normal force, and follows the shape of the surface of the object. We plan to study the ability to measure normal and tangential forces, even for spherical objects and soft objects.
The development of low-cost grasping systems is desirable, not only in the field of mobile robotic dollies, but also in the medical and nursing care fields [66]. In this system, when a robot hand grasps a cup filled with a drink and carries it to a care recipient, the operator performs grasping operations while observing the cup and the robot hand with the robot’s camera. If the tactile sensor developed in this study is used, the sensor can detect the strength of grasping the cup and the weight when the cup is lifted, so that operation will be easier than when relying only on camera images.

Supplementary Materials

The following supporting information can be downloaded at: https://www.mdpi.com/article/10.3390/polym14235057/s1, Video S1: MVI_1596_x-axis-vertical, Video S2: MVI_1605_y-axis-vertical.

Author Contributions

Conceptualization, M.M., Y.T. and S.K.; methodology, M.M; validation, M.M., Y.T. and S.K; formal analysis, M.M.; investigation, M.M.; resources, S.K.; data curation, M.M., J.T., I.K., and R.M.; computer simulation, M.M. and Z.W.; writing—original draft preparation, M.M.; writing—review and editing, M.M. and Y.T.; visualization, M.M.; supervision, Y.T.; project administration, S.K.; funding acquisition, S.K.; All authors have read and agreed to the published version of the manuscript.

Funding

This work was supported by the Cabinet Office (CAO) Cross-Ministerial Strategic Innovation Promotion Program (SIP), “An intelligent knowledge processing infrastructure, integrating physical and virtual domains” (funding agency: NEDO, project code: P18014).

Institutional Review Board Statement

Not applicable.

Data Availability Statement

We complied with all laws and other requirements.

Acknowledgments

The polyurethane used in this study was provided by Mitsui Chemicals, Inc.

Conflicts of Interest

The authors declare no conflict of interest.

Appendix A

Scheme A1 shows how a polyurethane sheet produces photoelasticity when subjected to a tensile force [27]. As shown in this figure, polyurethane forms a network by polymerizing a bifunctional polyol, a bifunctional aromatic diisocyanate, and a small amount of trifunctional triol as a crosslinker. The aromatic diisocyanate is bound to the polyol along the long axis of its molecule, and when the sheet is stretched in the vertical direction, the long axis of the aromatic diisocyanate is partially oriented in the vertical direction.
Scheme A1. Mechanism of light scattering in polyurethane.
Polymers 14 05057 sch0a1
The aromatic diisocyanate group has a large anisotropy in dielectric constant. By the orientation of the diisocyanate groups, the refractive index changes slightly according to the tilt of the plane of polarization of the incident light. Due to this refractive index anisotropy, part of the incident light is scattered away from the direction of incidence [30,31,32,33].
As the sheet deforms, incident light is scattered and escapes from the sides and surfaces of the sheet. This light scattering phenomenon is observed not only when the sheet is stretched, but also when the sheet is bent. This phenomenon can be seen in a photograph [27].

References

  1. Ren, Z.; Xie, H.; Ju, Y. Quantification of Photoelastic Fringe Orders Using Polarized Light Camera and Continuous Loading. Opt. Lasers Eng. 2020, 134, 106263–106270. [Google Scholar] [CrossRef]
  2. Daniels, K.E.; Kollmer, J.E. Photoelastic Force Measurements in Granular Materials. Rev. Sci. Instrum. 2017, 88, 51808–51830. [Google Scholar] [CrossRef] [Green Version]
  3. Scafidi, M.; Pitarresi, G.; Toscano, A.; Petrucci, G.; Alessi, S.; Ajovalasit, A. Review of Photoelastic Image Analysis Applied to Structural Birefringent Materials: Glass and Polymers. Opt. Eng. 2015, 54, 81206–81213. [Google Scholar] [CrossRef]
  4. Ham, S.; Kown, T. Photoelastic Observation of Toughness-Dominant Hydraulic Fracture Propagation Across an Orthogonal Discontinuity in Soft, Viscoelastic Layered Formations. Int. J. Rock Mech. Min. Sci. 2020, 134, 104438–104452. [Google Scholar] [CrossRef]
  5. Adelfar, M.; Tavangar, R.; Horandghadim, N.; Khalil-Allafi, J. Evaluation Superelastic and Shape Memory Effects Using the Photostress Technique. Mater. Today Commun. 2020, 24, 101156–101164. [Google Scholar] [CrossRef]
  6. Wu, Z.L.; Sawada, D.; Kurokawa, T.; Kakugo, A.; Yang, W.; Fukuhara, H.; Gong, J.P. Strain-Induced Molecular Reorientation and Birefringence Reversion of a Robust, Anisotropic Double-network Hydrogel. Macromolecules 2011, 44, 3542–3547. [Google Scholar] [CrossRef]
  7. Mott, P.H.; Roland, C.M. Birefringence of Rubber during Creep and Recovery. Macromolecules 1996, 29, 8492–8496. [Google Scholar] [CrossRef] [Green Version]
  8. Mukashev, D.; Zhuzbay, N.; Koshkinbayeva, A.; Orazbayev, B.; Kappassov, Z. Photo Elastic Finger: Robot Tactile Fingertip Based on Photoelastic Effect. Sensors 2022, 22, 6807. [Google Scholar] [CrossRef]
  9. Shimonomura, K. Tactile Image Sensors Employing Camera: A Review. Sensors 2019, 19, 3933. [Google Scholar] [CrossRef] [Green Version]
  10. Yamaguchi, A.; Atkeson, C.G. Recent Progress in Tactile Sensing and Sensors for Robotic Manipulation: Can We Turn Tactile Sensing into Vision? Adv. Robot. 2019, 33, 661–673. [Google Scholar] [CrossRef]
  11. Lepora, N.F.; Lin, Y.; Money-Coomes, B.; Lloyd, J. DigiTac: A DIGIT-TacTip Hybrid Tactile Sensor for Comparing Low-Cost High-Resolution Robot Touch. IEEE Robot. Autom. Lett. 2022, 7, 9382–9388. [Google Scholar] [CrossRef]
  12. Yun, S.; Park, S.; Park, B.; Kim, Y.; Park, S.K.; Nam, S.; Kyung, K.U. Polymer-waveguide-based flexible tactile sensor array for dynamic response. Adv. Mater. 2014, 26, 4474–4480. [Google Scholar] [CrossRef] [PubMed]
  13. Nguyen, T.D.; Lee, J.S. Recent Development of Flexible Tactile Sensors and Their Applications. Sensors 2022, 22, 50. [Google Scholar] [CrossRef] [PubMed]
  14. Bertholds, A.; Dändliker, R. High-resolution photoelastic pressure sensor using low-birefringence fiber. Appl. Opt. 1986, 25, 340–343. [Google Scholar] [CrossRef]
  15. Agarwal, P.; Zhou, W.; Roy, R.; Chang, S.; Liu, X. Photoelastic Birefringence of Copolymers with Non-planar Structure. Polymer 2019, 164, 217–222. [Google Scholar] [CrossRef]
  16. Seif, S.; Cakmak, M. Stress-Optical Behavior of Poly (m-xylylenediamine adipamide) (NylonMXD6): Influence of Molecular Weight. Polymer 2010, 51, 3762–3773. [Google Scholar] [CrossRef]
  17. Ebisawa, M.; Otani, Y.; Umeda, N. Mechanical Characterization Measurement of Polymer Material under Stress by Birefringence Microscope. Opt. Rev. 2007, 14, 310–313. [Google Scholar] [CrossRef]
  18. Dubey, V.N.; Crowder, R.M. A Dynamic Tactile Sensor on Photoelastic Effect. Sens. Actuators A Phys. 2006, 128, 217–224. [Google Scholar] [CrossRef] [Green Version]
  19. Dubey, V.; Grewal, G.; Claremont, D. Load Extraction from Photoelastic Images using Neural Networks. Exp. Mech. 2007, 47, 263–270. [Google Scholar] [CrossRef]
  20. Chung, D.; Merat, F.L.; Discenzo, F.M.; Harris, J.S. Neural Net based Torque Sensor Using Birefringent Materials. Sens. Actuators A Phys. 1998, 70, 243–249. [Google Scholar] [CrossRef]
  21. Kollmer, J.E.; Daniels, K.E. Betweenness Centrality as Predictor for Forces in Granular Packings. Soft Matter 2019, 15, 1793–1798. [Google Scholar] [CrossRef] [PubMed] [Green Version]
  22. Dubey, V.N.; Grewal, G.S. Efficacy of Photoelasticity in Developing Whole-field Imaging Sensors. Opt. Lasers Eng. 2010, 48, 288–294. [Google Scholar] [CrossRef]
  23. Sato, T.; Mamiya, H.; Koike, H.; Fukuchi, K. Photoelastic Touch: Transparent Rubbery Tangible Interface using an LCD and Photoelasticity. In Proceedings of the 22nd Annual ACM Symposium on User Interface Software and Technology, Victoria, BC, Canada, 4–7 October 2009; pp. 43–50. [Google Scholar]
  24. Abed Zadeh, A.; Barés, J.; Brzinski, T.A.; Daniels, K.E.; Dijksman, J.; Docquier, N.; Everitt, H.O.; Kollmer, J.E.; Lantsoght, O.; Wang, D.; et al. Enlightening Force Chains: A Review of Photoelasticimetry in Granular Matter. Granul. Matter 2019, 21, 83. [Google Scholar] [CrossRef] [Green Version]
  25. Takarada, J.; Mitsuzuka, M.; Sugino, Y.; Mori, T.; Kinbara, Y.; Kageoka, M.; Tawa, T.; Kawamura, S.; Tajitsu, Y. Evaluation of Gripping Sensor using Polyurethane with High Photoelastic Constant. Jpn. J. Appl. Phys. 2021, 60, SFFD03-1–SFFD03-5. [Google Scholar] [CrossRef]
  26. Zou, L.; Ge, C.; Wang, Z.J.; Cretu, E.; Li, X. Novel Tactile Sensor Technology and Smart Tactile Sensing Systems: A Review. Sensors 2017, 17, 2653. [Google Scholar] [CrossRef]
  27. Mitsuzuka, M.; Kinbara, Y.; Fukuhara, M.; Nakahara, M.; Nakano, T.; Takarada, J.; Wang, Z.; Mori, Y.; Kageoka, M.; Tawa, T.; et al. Relationship between Photoelasticity of Polyurethane and Dielectric Anisotropy of Diisocyanate, and Application of High-photoelasticity Polyurethane to Tactile Sensor for Robot Hands. Polymers 2020, 13, 143. [Google Scholar] [CrossRef]
  28. Mitsuzuka, M.; Yamasaki, S.; Tajitsu, Y. Photoelastic Polyurethane Resin, Detection Member, Robot, and Method for Producing Photoelastic Polyurethane Resin. U.S. Patent 10,626,213, 21 April 2020. [Google Scholar]
  29. Mori, Y.; Fukuhara, M.; Zhu, M.; Kinbara, Y.; Wada, A.; Mitsuzuka, M.; Tajitsu, Y.; Kawamura, S. Feedback Control of a Pneumatically Driven Soft Fnger using a Potoelastic Plyurethane Bnding Sensor. Adv. Robot. 2021, 34, 771–786. [Google Scholar] [CrossRef]
  30. Amimori, I.; Priezjev, N.; Pelcovits, R.A.; Crawford, G.P. Optomechanical Properties of Stretched Polymer Dispersed Liquid Crystal Films for Scattering Polarizer Applications. J. Appl. Phys. 2003, 93, 3248–3252. [Google Scholar] [CrossRef] [Green Version]
  31. Sun, T.; Liu, T.; He, H.; Wu, J.; Ma, H. Distinguishing Anisotropy Orientations Originated from Scattering and Birefringence of Turbid Media Using Mueller Matrix Derived Parameters. Opt. Lett. 2018, 43, 4092–4095. [Google Scholar] [CrossRef]
  32. Asgharian, N.; Schelly, Z.A. Electric Field-induced Transient Birefringence and Light Scattering of Synthetic Liposomes. Biochim. Et Biophys. Acta-Biomembr. 1999, 1418, 295–306. [Google Scholar] [CrossRef]
  33. Borovkova, M.A.; Bykov, A.V.; Popov, A.; Meglinski, I.V. Role of Scattering and Birefringence in Phase Retardation Revealed by Locus of Stokes Vector on Poincaré Sphere. J. Biomed. Opt. 2020, 25, 057001–057013. [Google Scholar] [CrossRef] [PubMed]
  34. Garcia-Haro, J.M.; Ona, E.D.; Hernandez-Vicen, J.; Martinez, S.; Balaguer, C. Service Robot in Catering Applications: A Review and Future Challenges. Electronics 2021, 10, 47. [Google Scholar] [CrossRef]
  35. Shimmura, T.; Ichikari, R.; Okuma, T.; Ito, H.; Okada, K.; Nonaka, T. Service Robot Introduction to a Restaurant Enhances both Labor Productivity and Service Quality. Procedia CIRP 2020, 88, 589–594. [Google Scholar] [CrossRef]
  36. Gozalez-Aguirre, J.A.; Osorio-Oliveros, R.; Rodoriguez-Hernandez, K.L.; Lizarraga-Iturralde, J.; Menendez, R.M.; Ramirez-Mendoza, R.A.; Ramirez-Moreno, M.A.; Lozoya-Santos, J.J. Service Robots: Trends and Technology. Appl. Sci. 2021, 11, 10702. [Google Scholar] [CrossRef]
  37. Zhu, J.; Ji, S.; Yu, J.; Shao, H.; Wen, H.; Zhuang, H.; Xia, Z.; Zhang, Z.; Lee, C. Machine Learning-augmented Wearable Triboelectric Human-machine Interface in Motion Identification and Virtual Reality. Nano Energy 2022, 103, 107766–107774. [Google Scholar] [CrossRef]
  38. Zhuang, Q.; Jin, T.; Cai, J.; Xu, L.; He, T.; Wang, T.; Tian, Y.; Li, L.; Peng, Y.; Lee, C. Wearable Triboelectric Sensors Enable Gait Analysis and Waist Motion Capture for IoT-Based Smart Healthcare Applications. Adv. Sci. 2022, 9, 2103694–2103706. [Google Scholar] [CrossRef]
  39. Anwer, A.H.; Khan, N.; Ansari, M.Z.; Beak, S.; Yi, H.; Kim, S.; Noh, S.M.; Jeong, C. Recent Advances in Touch Sensors for Flexible Wearable Devices. Sensors 2022, 22, 4460. [Google Scholar] [CrossRef]
  40. Wang, H.; Han, M.; Song, Y.; Zhang, H. Design, Manufacturing and Application of Wearable Triboelectric Nanogenerators. Nano Energy 2021, 81, 105627–105644. [Google Scholar] [CrossRef]
  41. Zhong, W.; Ming, X.; Li, W.; Jia, K.; Jiang, H.; Ke, Y.; Li, M.; Wang, D. Wearable Human-Machine Interaction Device Integrated by All-Textile-Based Tactile Sensors Array via Facile Cross-Stich. Sens. Actuators A Phys. 2022, 333, 113240–113248. [Google Scholar] [CrossRef]
  42. Ramani, P.; Shojaei, A. A Review on the Features, Performance and Potential Applications of Hydrogel-Based Wearable Strain/Pressure Sensors. Adv. Colloid Interface Sci. 2021, 298, 102553–102578. [Google Scholar] [CrossRef]
  43. Li, X.; Chen, S.; Peng, Y.; Zheng, Z.; Li, J.; Zhong, F. Material, Preparation Strategies, and Wearable Sensors Applications of Conductive Fibers: A Review. Sensors 2022, 22, 3028. [Google Scholar] [CrossRef] [PubMed]
  44. Tajitsu, Y.; Takarada, J.; Takatani, K.; Nakanishi, R.; Yanagimoto, H.; Shiomi, S.; Nakagawa, I.; Kawahara, I.; Nakiri, T.; Shimda, S.; et al. Prototype Sensor System Using Fabricated Piezoelectric Braided Cord for Work-Environment Measurement during Work from Home. Micromachines 2021, 12, 966. [Google Scholar] [CrossRef] [PubMed]
  45. Clarke, D.E.; Perry, R.; Arora, K. Characterization of CMOS IC photodiodes using focused laser sources. In Proceedings of the SOUTHEASTCON ’96, Tampa, FL, USA, 11–14 April 1996; pp. 381–384. [Google Scholar]
  46. Lin, W.; Wang, B.; Peng, G.; Shan, Y.; Hu, H.; Yang, Z. Skin-Inspired Piezoelectric Tactile Sensor Array with Crosstalk-Free Row+Column Electrodes for Spatiotemporally Distinguishing Diverse Stimuli. Adv. Sci. 2021, 8, 2002817–2002827. [Google Scholar] [CrossRef] [PubMed]
  47. Dzedzickis, A.; Sutinys, E.; Bucinskas, V.; Samukaite-Bubniene, U.; Jakstys, B.; Ramanavicius, A.; Morkvenaite-Vilkonciene, I. Polyethylene-Carbon Composite (Velostat®) Based Tactile Sensor. Polymers 2020, 12, 2905. [Google Scholar] [CrossRef]
  48. Gao, S.; Weng, L.; Deng, Z.; Wang, B.; Huang, W. Biomimetic Tactile Sensor Array Based on Magnetostrictive Materials. IEEE Sens. J. 2021, 21, 13116–13124. [Google Scholar] [CrossRef]
  49. Jones, D.; Wang, L.; Ghanbari, A.; Vardakastani, V.; Kedgley, A.E.; Gardiner, M.D.; Vincent, T.L.; Culmer, P.R.; Alazmani, A. Design and Evaluation of Magnetic Hall Effect Tactile Sensors for Use in Sensorized Splints. Sensors 2020, 20, 1123. [Google Scholar] [CrossRef] [Green Version]
  50. Heo, J.S.; Chung, J.H.; Lee, J.J. Tactile Sensor Arrays Using Fiber Bragg Grating Sensors. Sens. Actuators A 2006, 126, 312–327. [Google Scholar] [CrossRef]
  51. Hwang, E.S.; Seo, J.H.; Kim, Y.J. A Polymer-Based Flexible Tactile Sensor for Both Normal and Shear Load Detections and Its Application for Robotics. J. Microelectromech. Syst. 2007, 16, 556–563. [Google Scholar] [CrossRef]
  52. Wisitsoraat, A.; Patthanasetakul, V.; Lomas, T.; Tuantranont, A. Low Cost Thin Film Based Piezoresistive MEMS Tactile Sensor. Sens. Actuators A Phys. 2007, 139, 17–22. [Google Scholar] [CrossRef]
  53. Abels, C.; Mastronardi, V.M.; Guido, F.; Dattoma, T.; Qualtieri, A.; Megill, W.M.; Vittorio, M.D.; Rizzi, F. Nitride-based Materials for Flexible Mems Tactile and Flow Sensors in Robotics. Sensors 2017, 17, 1080. [Google Scholar] [CrossRef]
  54. Yeo, H.G.; Jung, J.; Sim, M.; Jang, J.E.; Choi, H. Integrated Piezoelectric ALN Thin Film with SU-8/PDMS Supporting Layer for Flexible Sensor Array. Sensors 2019, 20, 315. [Google Scholar] [CrossRef] [PubMed] [Green Version]
  55. Charalambides, A.; Bergbreiter, S. A Novel All-elastomer MEMS Tactile Sensor for High Dynamic Range Shear and Normal Force Sensing. J. Micromech. Microeng. 2015, 25, 095009–095017. [Google Scholar] [CrossRef]
  56. Wu, C.; Kim, T.W.; Park, J.H.; Koo, B.; Sung, S.; Shao, J.; Zhang, C.; Wang, Z.L. Self-Powered Tactile Sensor with Learning and Memory. ACS Nano 2020, 14, 1390–1398. [Google Scholar] [CrossRef] [PubMed]
  57. Friedl, W.A.; Roa, M.A. Experimental Evaluation of Tactile Sensors for Compliant Robotic Hands. Front. Robot. AI 2021, 8, 704416–704429. [Google Scholar] [CrossRef] [PubMed]
  58. Jung, Y.; Lee, D.-G.; Park, J.; Ko, H.; Lim, H. Piezoresistive Tactile Sensor Discriminating Multidirectional Forces. Sensors 2015, 15, 25463–25473. [Google Scholar] [CrossRef] [Green Version]
  59. Cirillo, A.; Cirillo, P.; De Maria, G.; Natale, C.; Pirozzi, S. Modeling and Calibration of a Tactile Sensor for Robust Grasping. IFAC Pap. Line 2017, 50–51, 6843–6850. [Google Scholar] [CrossRef]
  60. Cheng, M.-Y.; Lin, C.-L.; Lai, Y.-T.; Yang, Y.-J. A Polymer-Based Capacitive Sensing Array for Normal and Shear Force Measurement. Sensors 2010, 10, 10211–10225. [Google Scholar] [CrossRef] [Green Version]
  61. Li, T.; Sun, X.; Shu, X.; Wang, C.; Wang, Y.; Chen, G.; Xue, N. Robot Grasping System and Grasp Stability Prediction Based on Flexible Tactile Sensor Array. Machines 2021, 9, 119. [Google Scholar] [CrossRef]
  62. Costanzo, M.; De Maria, G.; Natale, C. Two-fingered In-hand Object Handling Based on Force/Tactile Feedback. IEEE Trans. Robot. 2020, 36, 157–173. [Google Scholar] [CrossRef]
  63. Moisio, S.; Leon, B.; Korkealaakso, P.; Morales, A. Model of Tactile Sensors using Soft Contacts and Its Application in Robot Grasping Simulation. Robot. Auton. Syst. 2013, 6, 1–12. [Google Scholar] [CrossRef]
  64. Zhao, W.; Zhang, G.; Li, J. Accuracy Improvement of Demodulating the Stress Field with Stress Unet in Photoelasticity. Appl. Opt. 2022, 61, 8678–8687. [Google Scholar] [CrossRef] [PubMed]
  65. Sandybayeva, D.; Kappassov, Z.; Orazbayev, B. Vibro Touch: Active Sensor for Contact Detection and Force Sensing via Vibrations. Sensors 2022, 22, 6456. [Google Scholar] [CrossRef] [PubMed]
  66. Ding, D.; Styler, B.; Chung, C.; Houriet, A. Development of a Vision-Guided Shared-Control System for Assistive Robotic Manipulators. Sensors 2022, 22, 4351. [Google Scholar] [CrossRef] [PubMed]
Scheme 1. Principle of force detection.
Polymers 14 05057 sch001
Figure 1. Photograph of manipulator: (a) front view, (b) top view.
Polymers 14 05057 g001
Scheme 2. Schematic of grasping and lifting.
Polymers 14 05057 sch002
Figure 2. Material composition of the tactile sensor.
Polymers 14 05057 g002
Figure 3. (a) Sensor structure, (b) photograph of top view, without top cover.
Polymers 14 05057 g003
Figure 4. Schematic diagram of how the tactile sensor detects forces: (a) detection of normal force, (b) detection of FX, (c) detection of FY.
Polymers 14 05057 g004
Scheme 3. Configuration of detection circuits.
Polymers 14 05057 sch003
Figure 5. Oscillogram of the tactile sensor: (a) sensor outputs, (b) effective outputs.
Polymers 14 05057 g005
Figure 6. Measurement of normal force FZ: (a) photograph, (b) relationship between FZ and V12Z or displacement.
Polymers 14 05057 g006
Figure 7. Photographs of the robot hand grasping and lifting the object, with the x-axis of the sensor vertical: (a) grasping, (b) lifting.
Polymers 14 05057 g007
Figure 8. Oscillogram of tactile sensor: (a) effective output Vef1, (b) effective output Vef2.
Polymers 14 05057 g008
Figure 9. Photograph of the robot hand lifting the object with the y-axis of the sensor vertical.
Polymers 14 05057 g009
Figure 10. Oscillogram of tactile sensor: (a) effective outputs, (b) effective output Vef3.
Polymers 14 05057 g010
Figure 11. Relationship between tangential force FX and ΔV12X.
Polymers 14 05057 g011
Figure 12. Relationship between tangential force FY and ΔV3Y.
Polymers 14 05057 g012
Figure 13. Relationship between the weight of the cuboid and the calculated weight, measured nine times.
Polymers 14 05057 g013
Publisher’s Note: MDPI stays neutral with regard to jurisdictional claims in published maps and institutional affiliations.

