
Influence of Extruder’s Nozzle Diameter on the Improvement of Functional Properties of 3D-Printed PLA Products


Abstract
:
1. Introduction
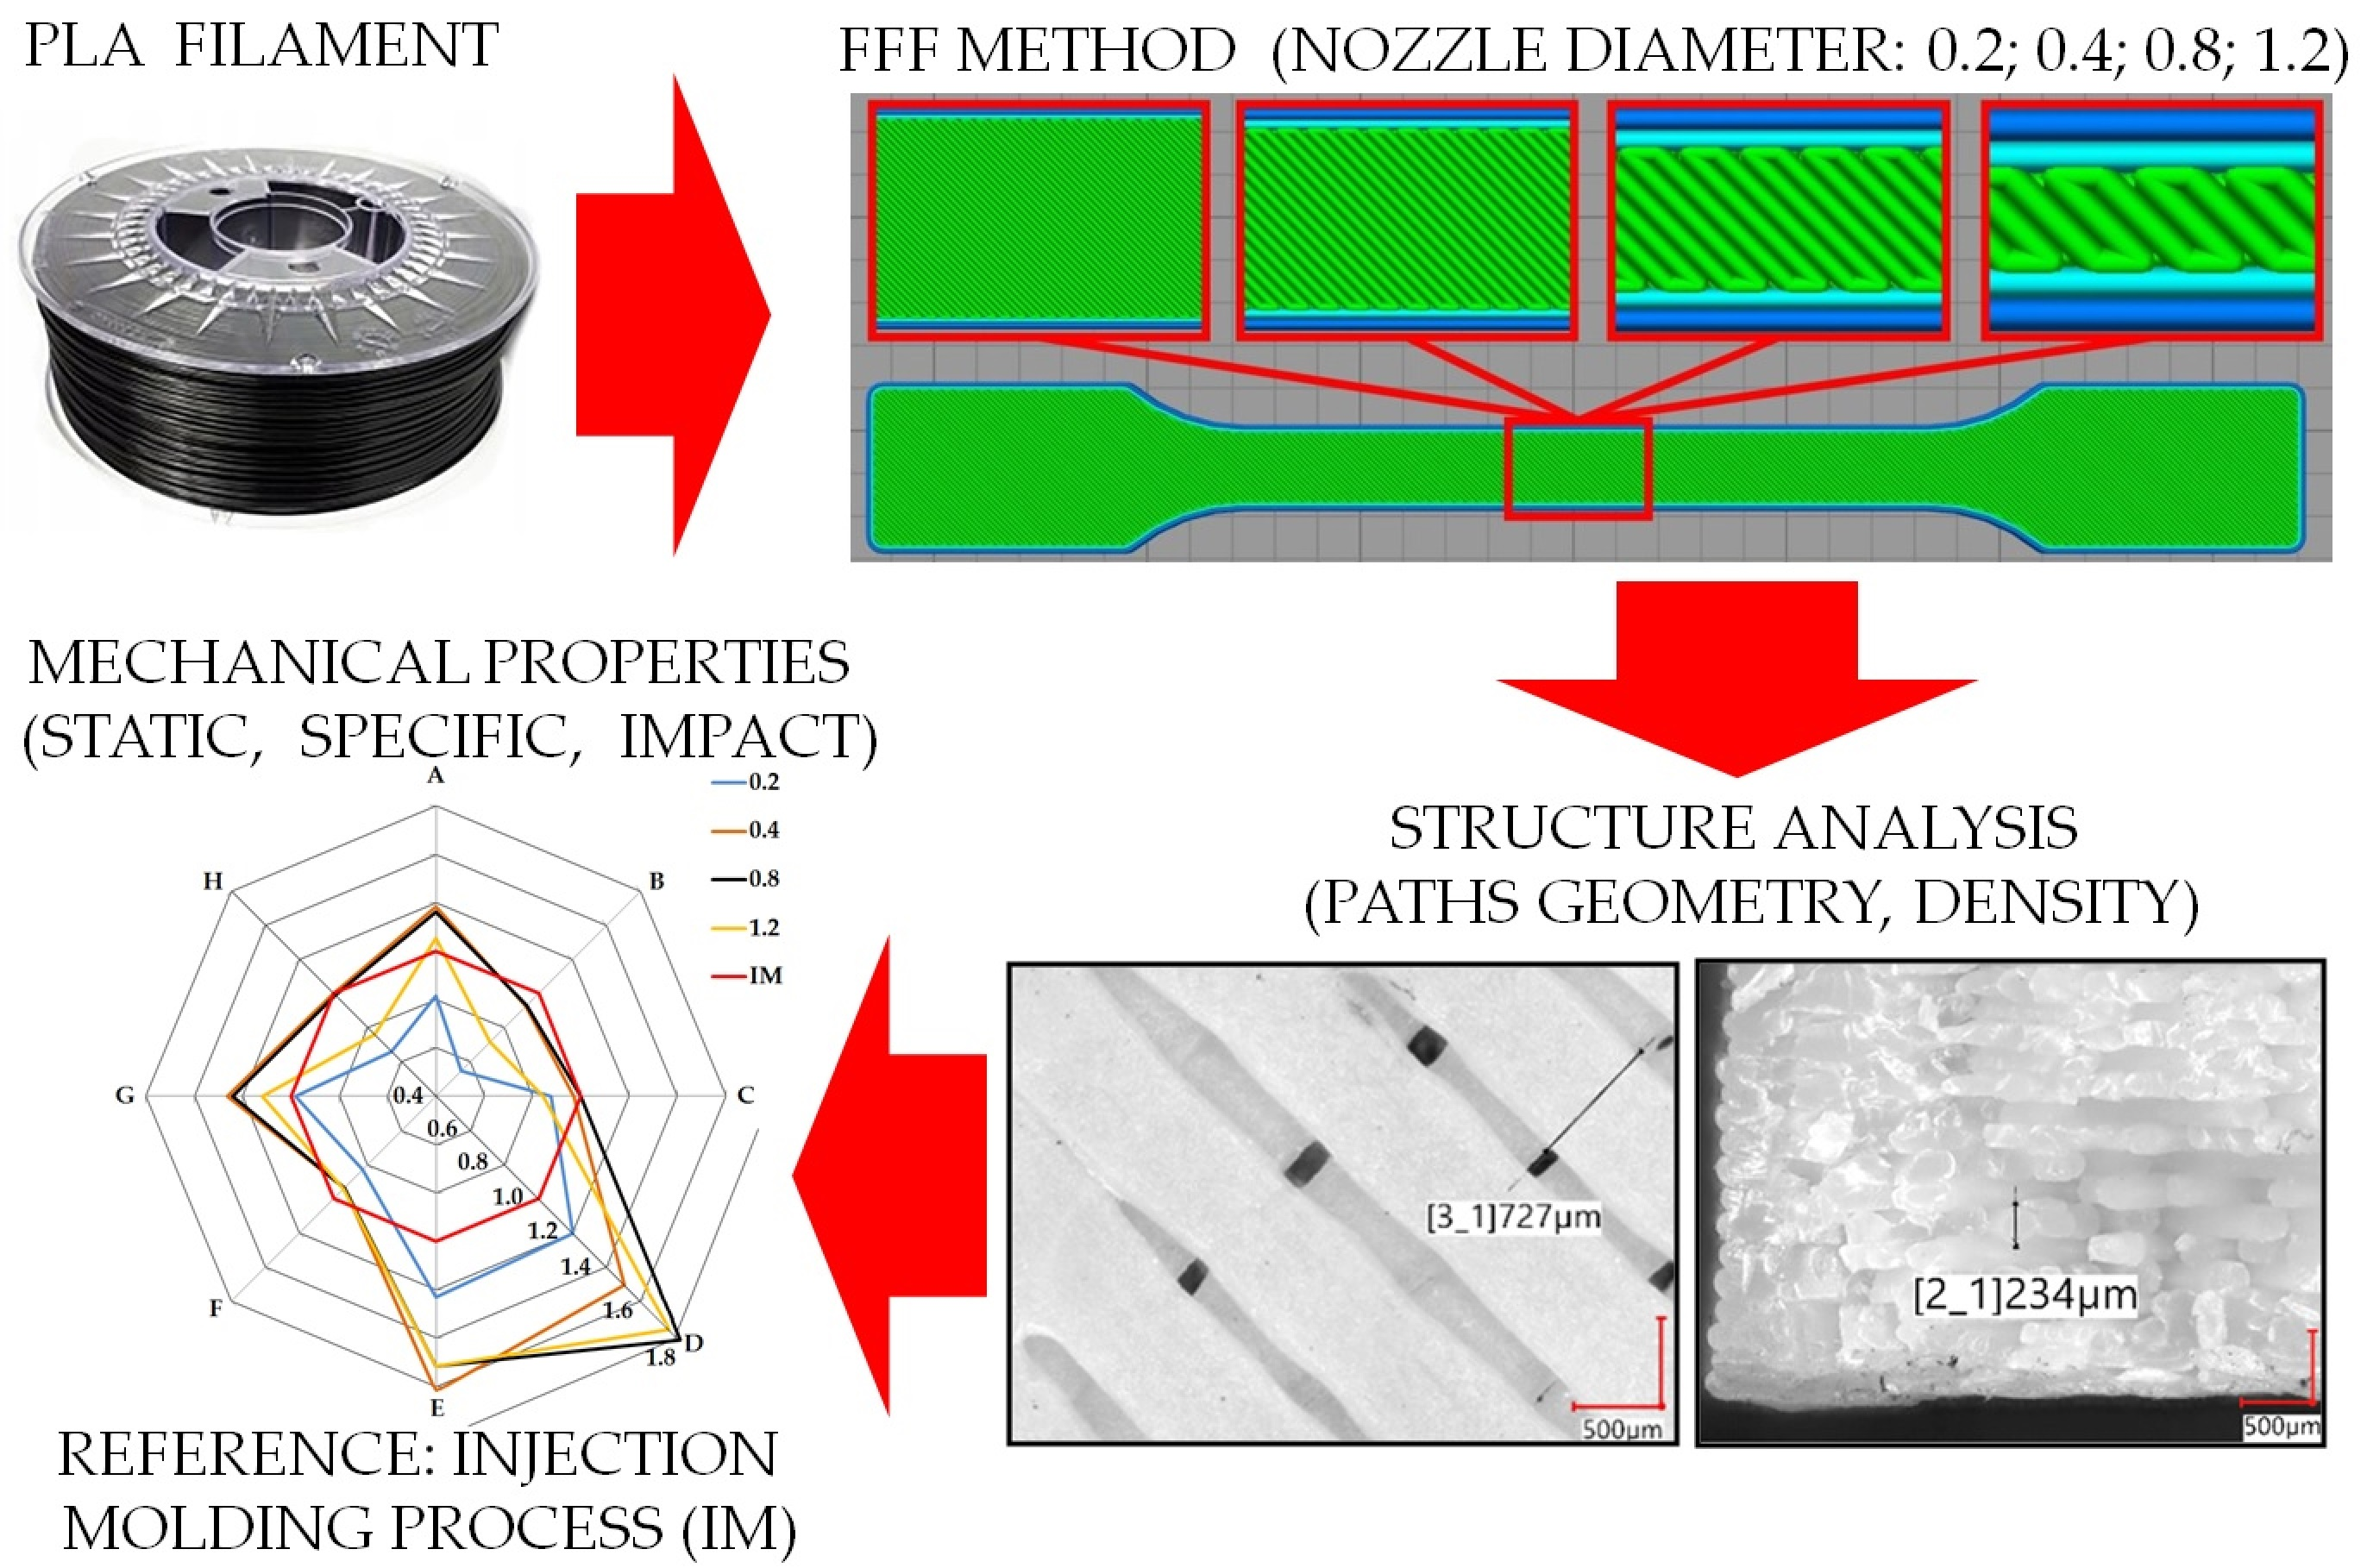
2. Materials and Methods
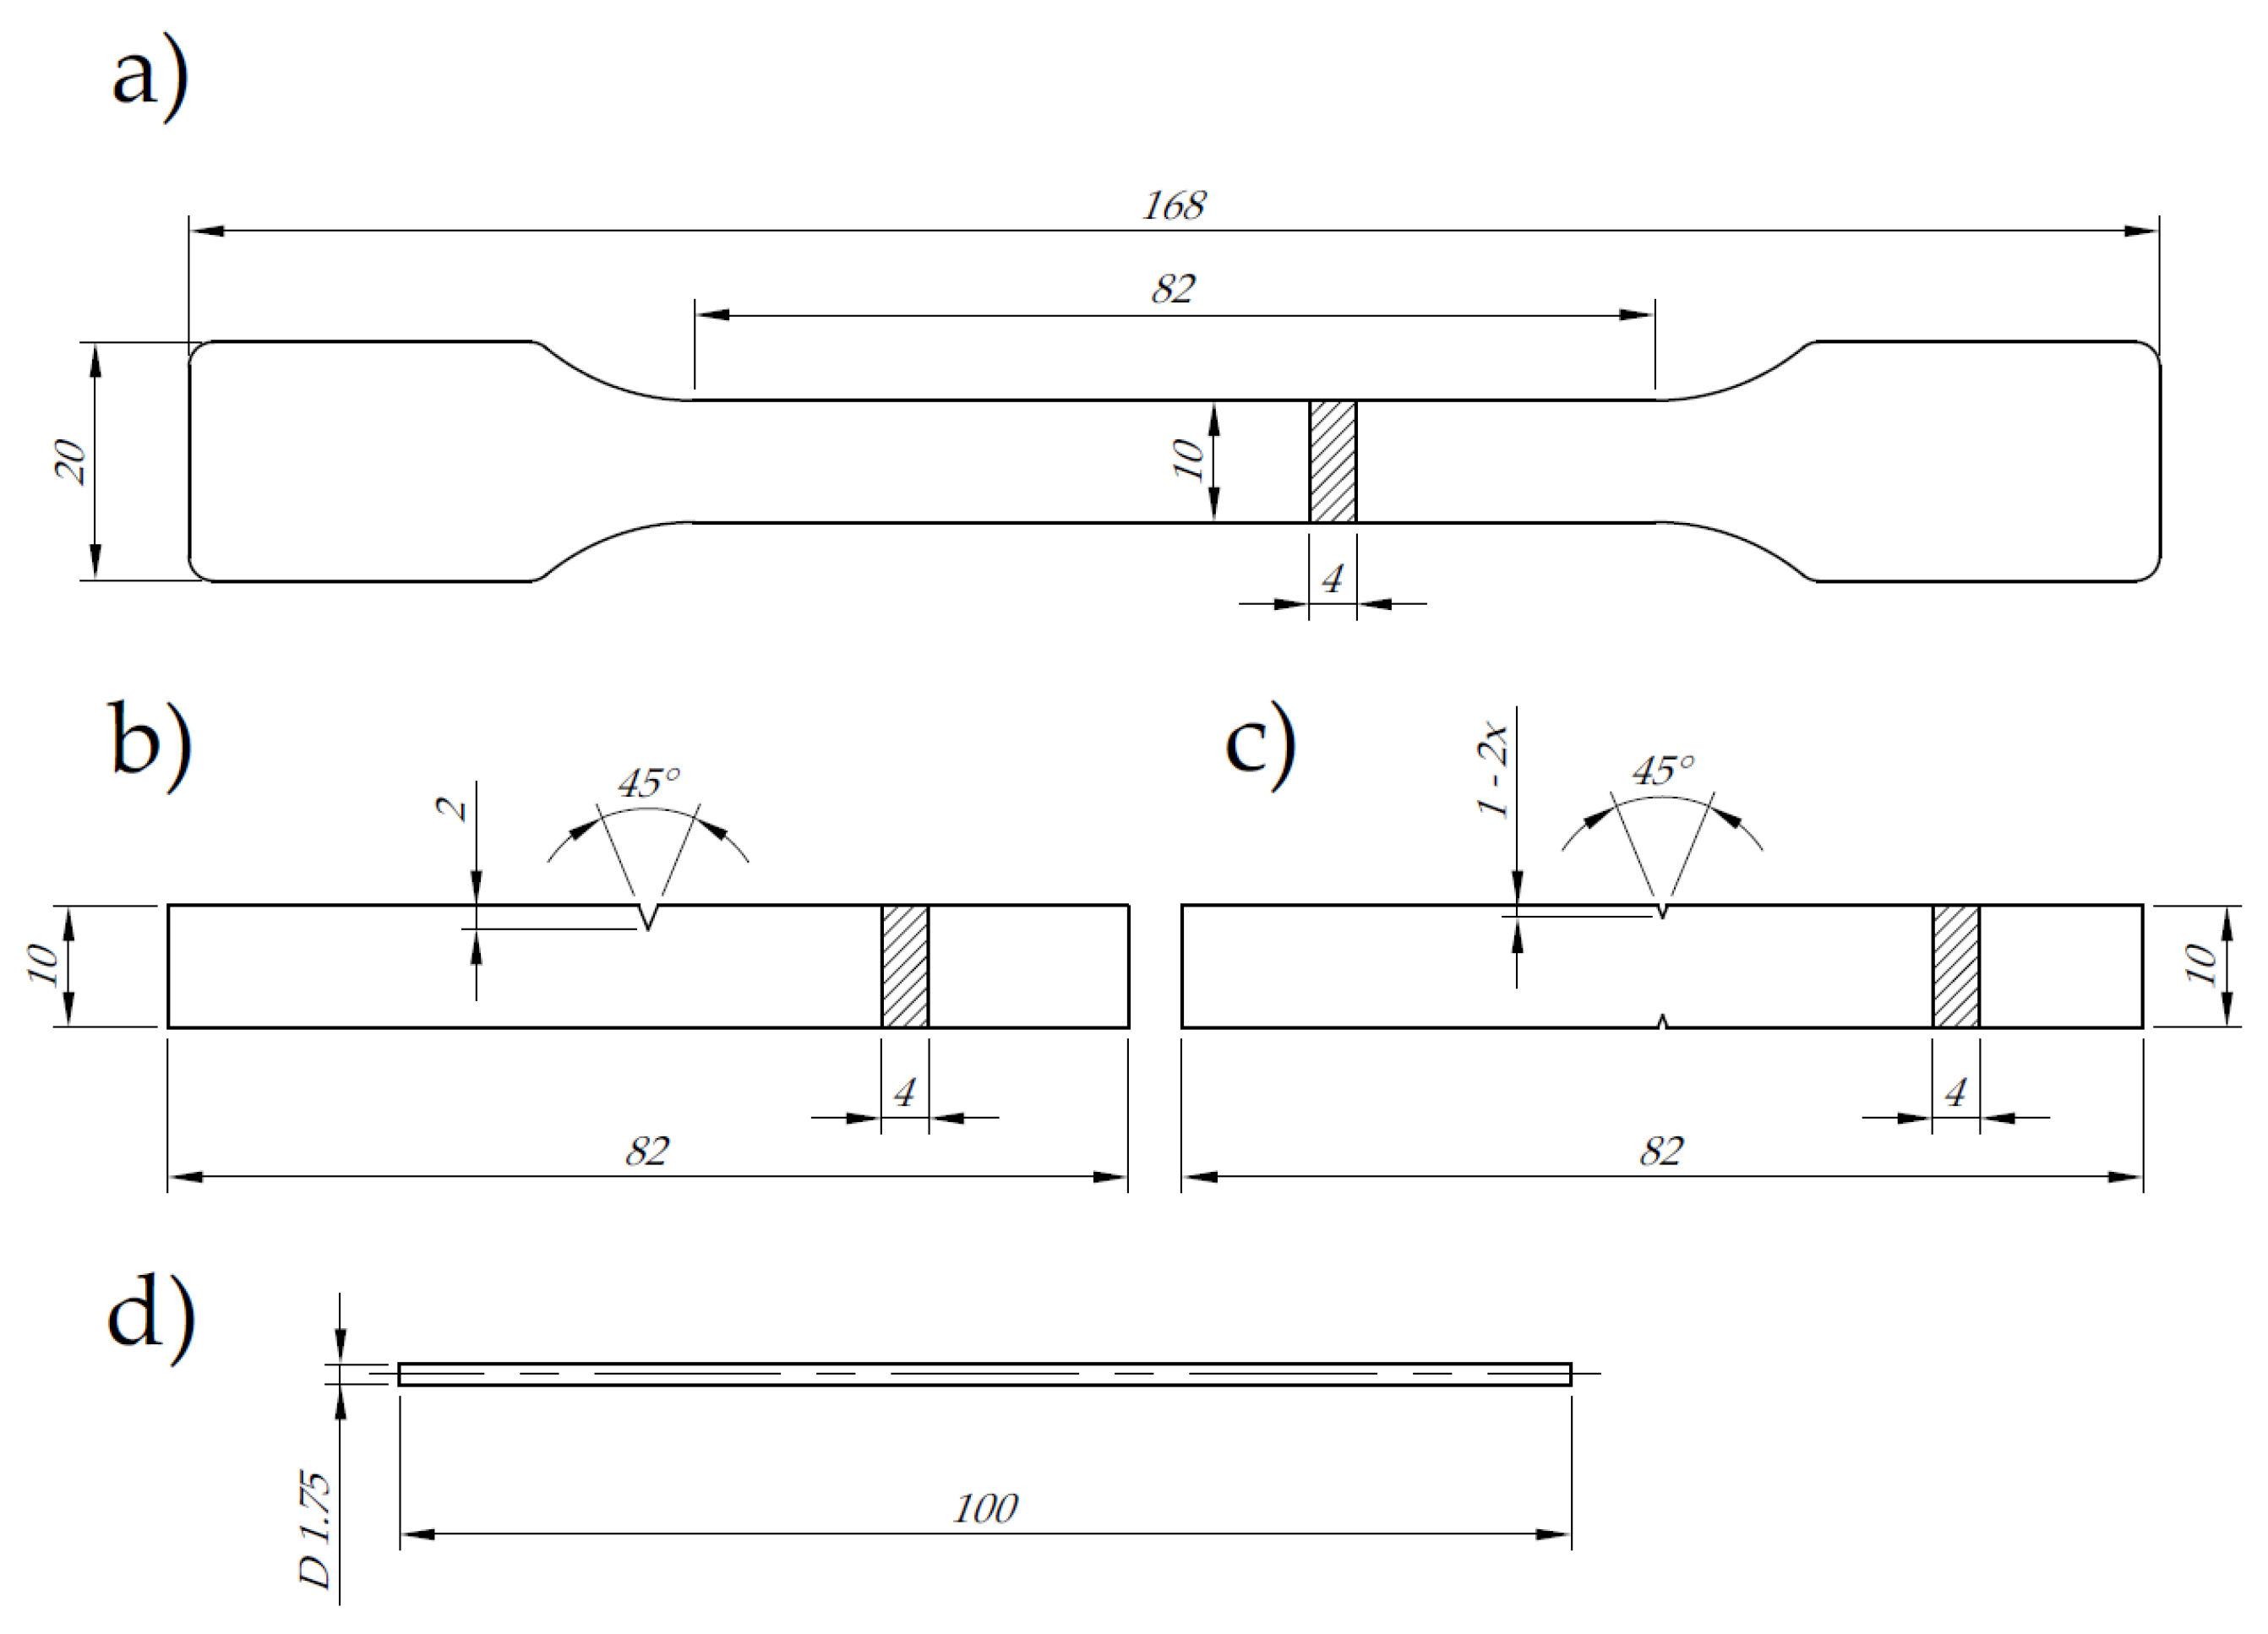
2.1. Research Objects
2.2. Material
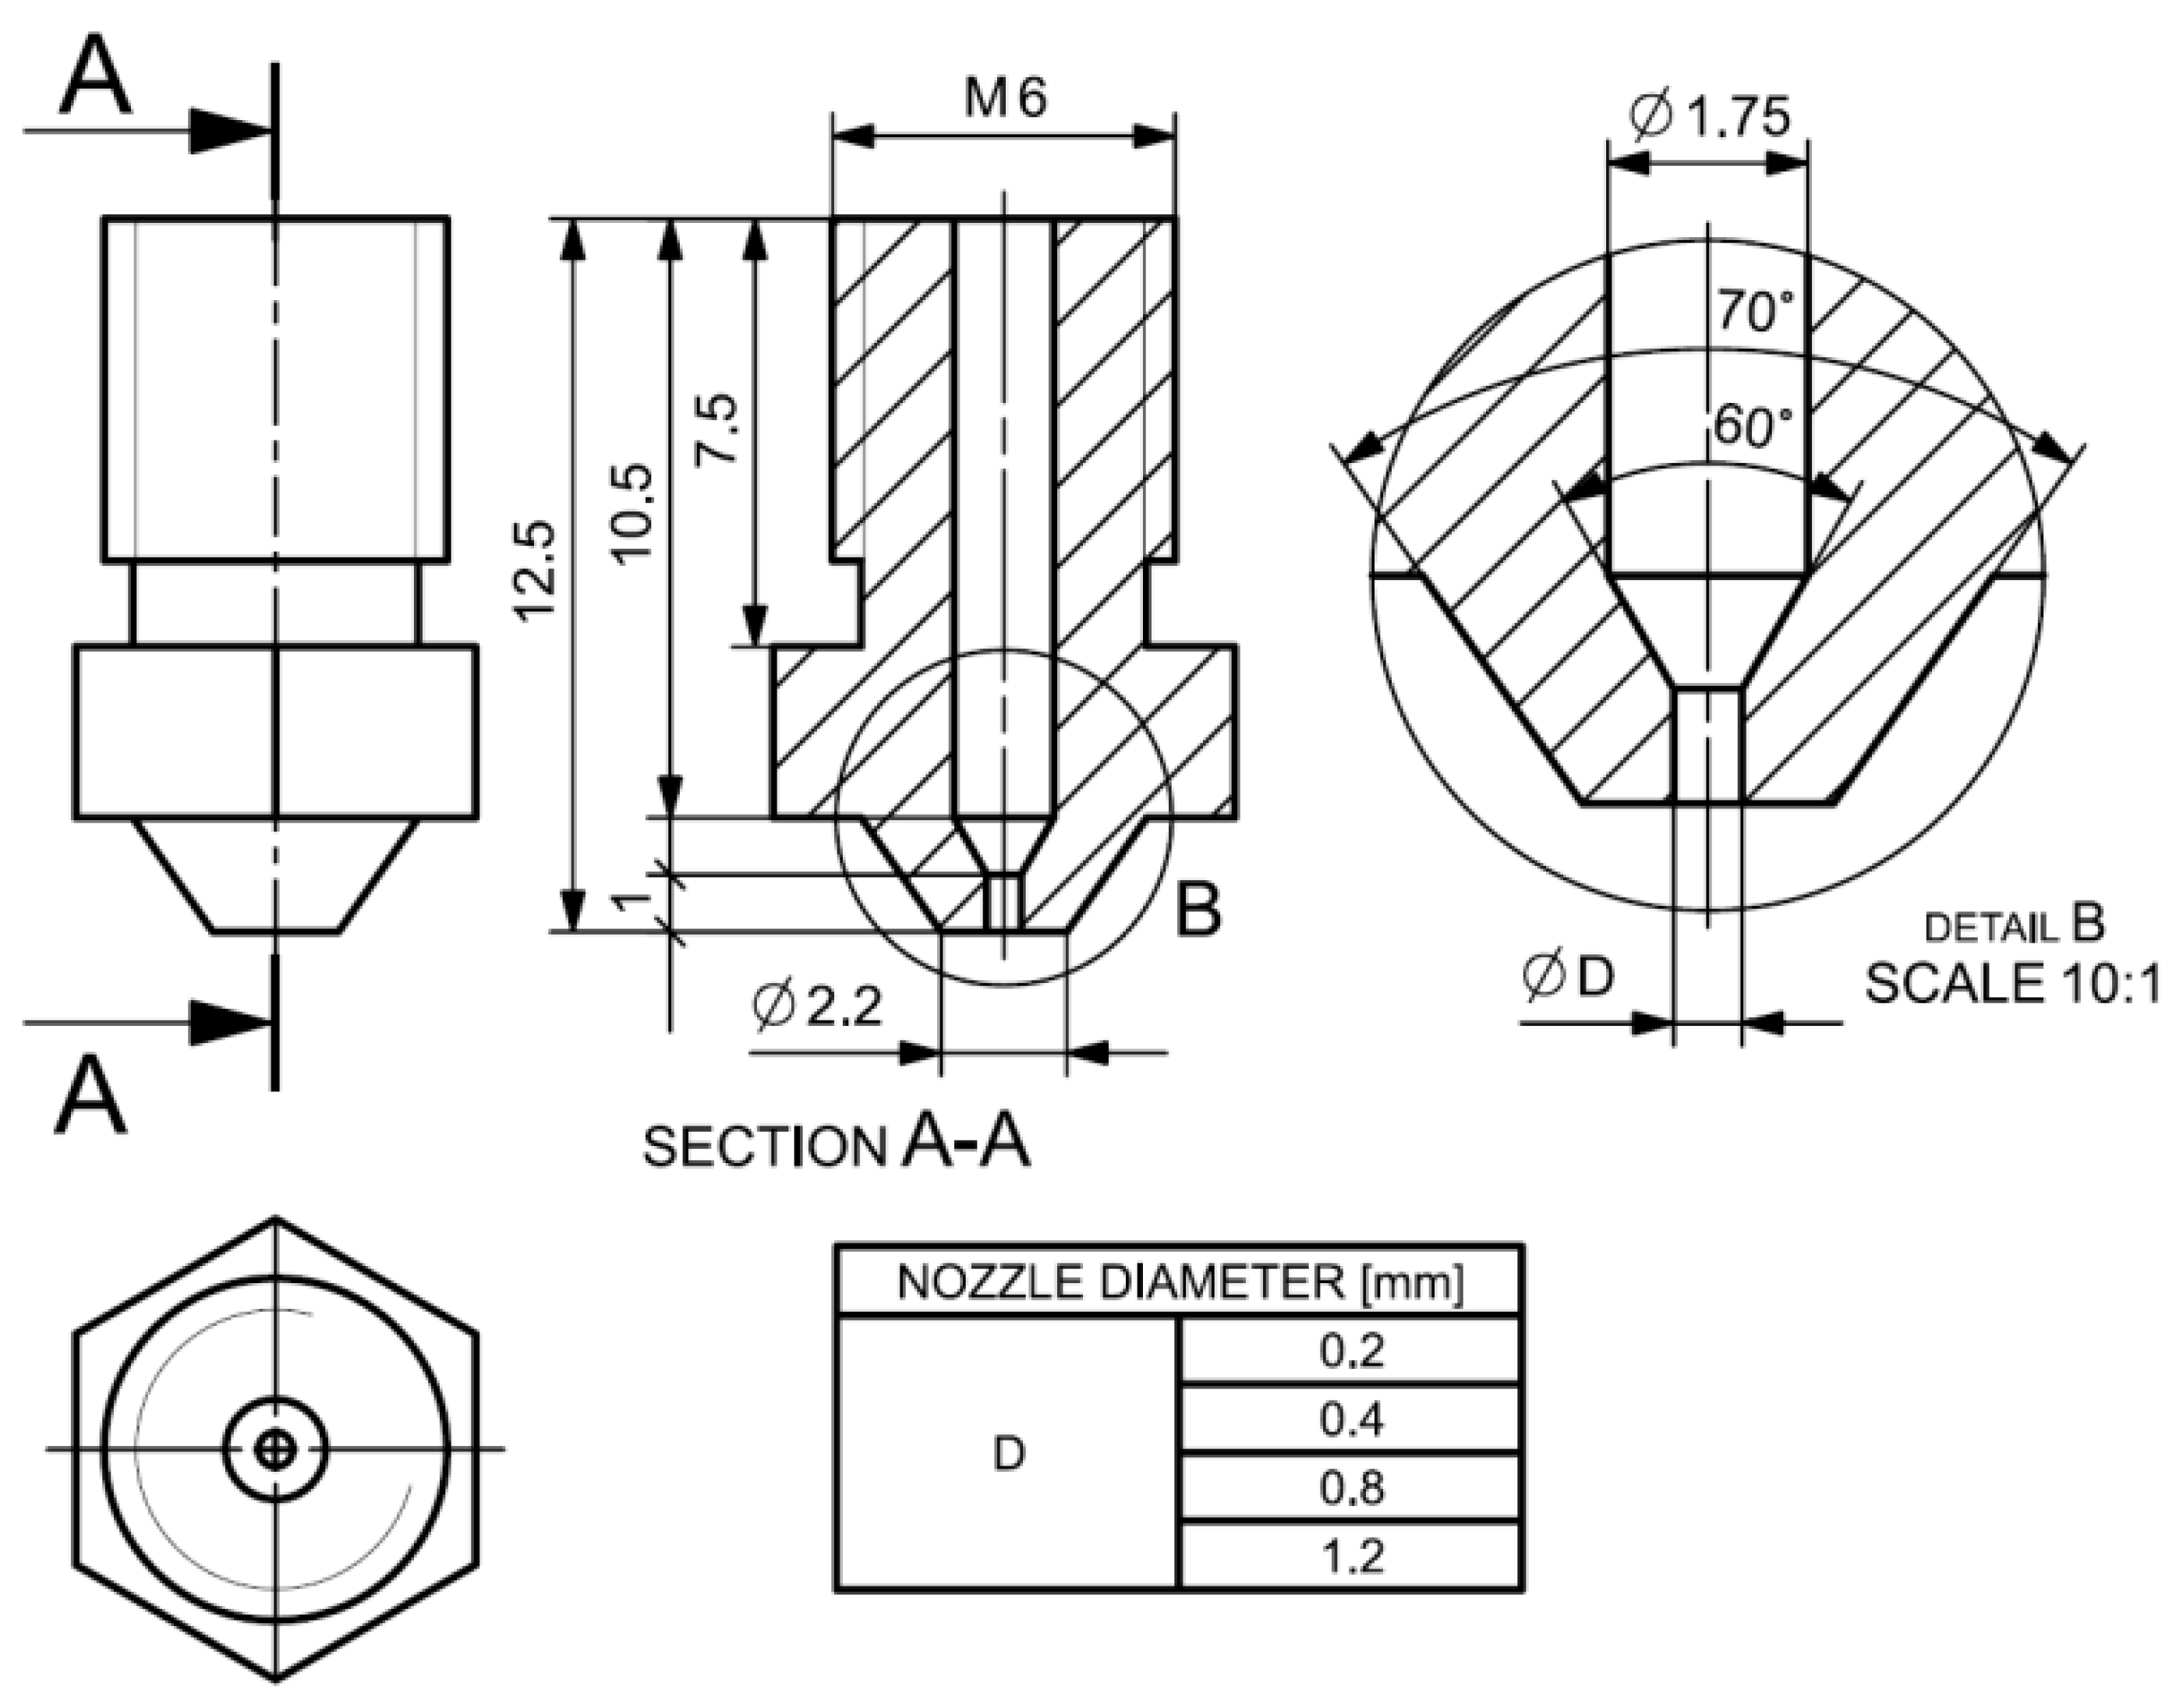
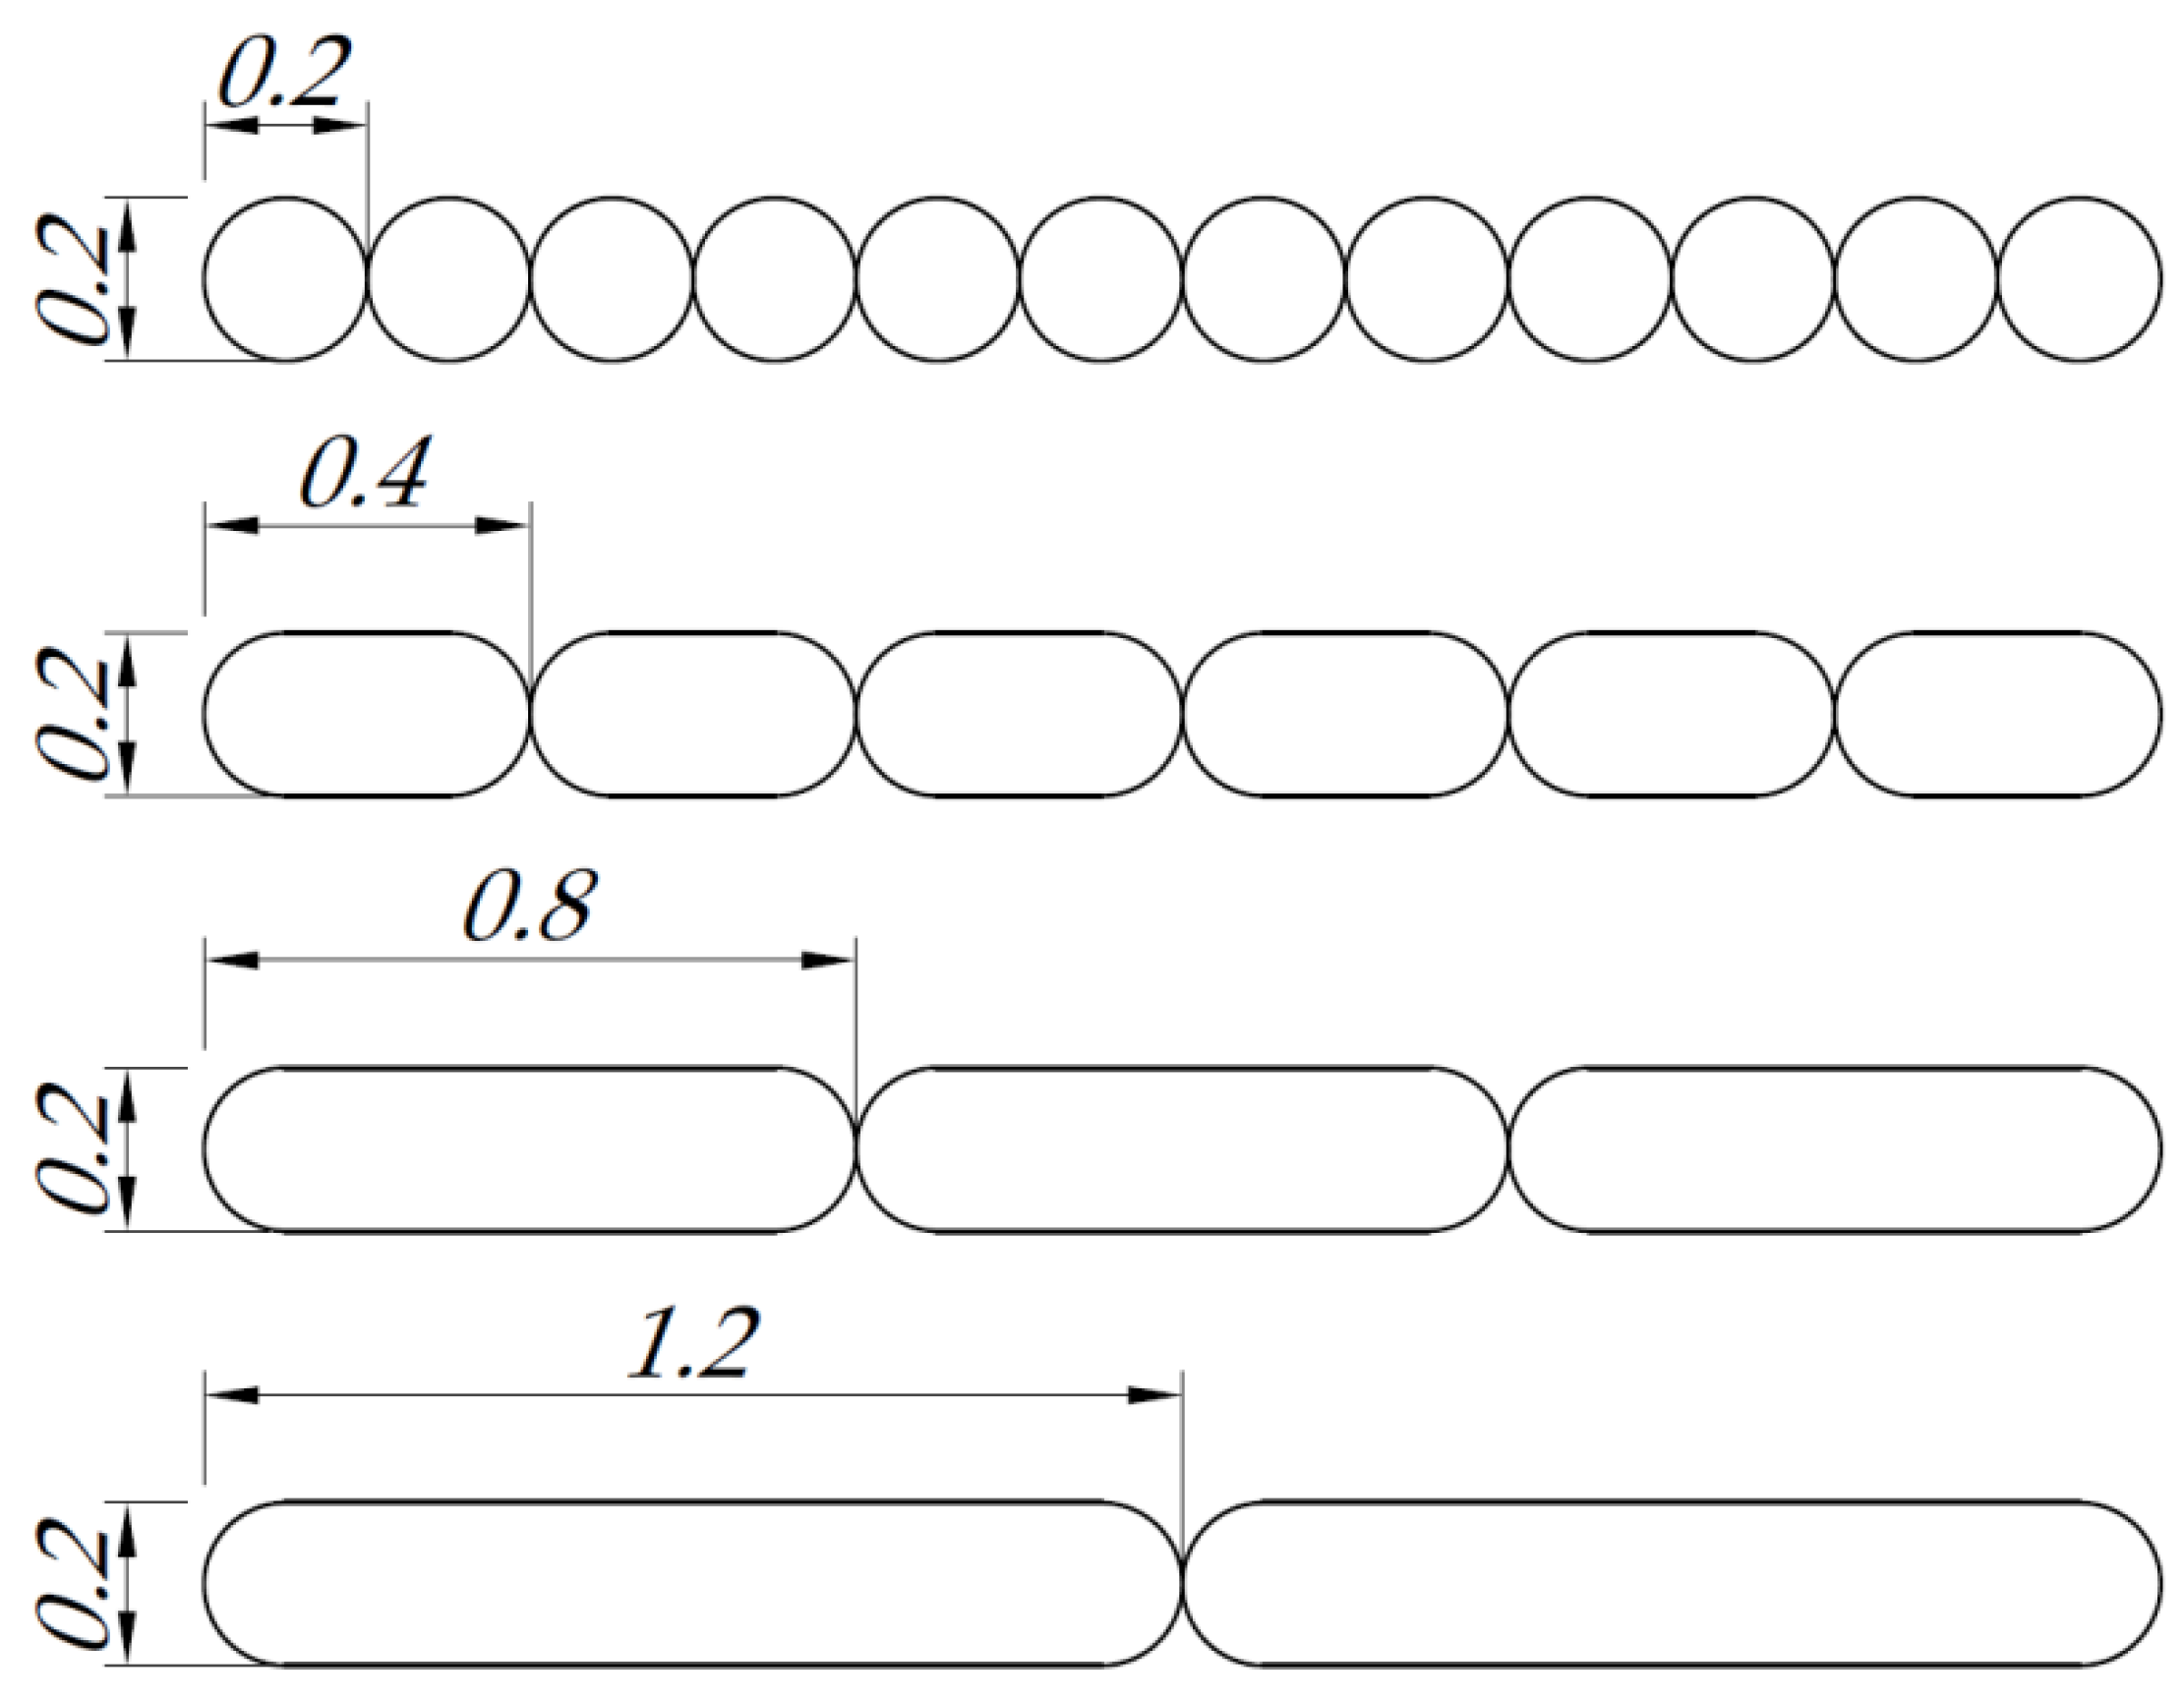
2.3. Research Stand
2.4. Sample Preparation
2.5. Microscopic Analysis
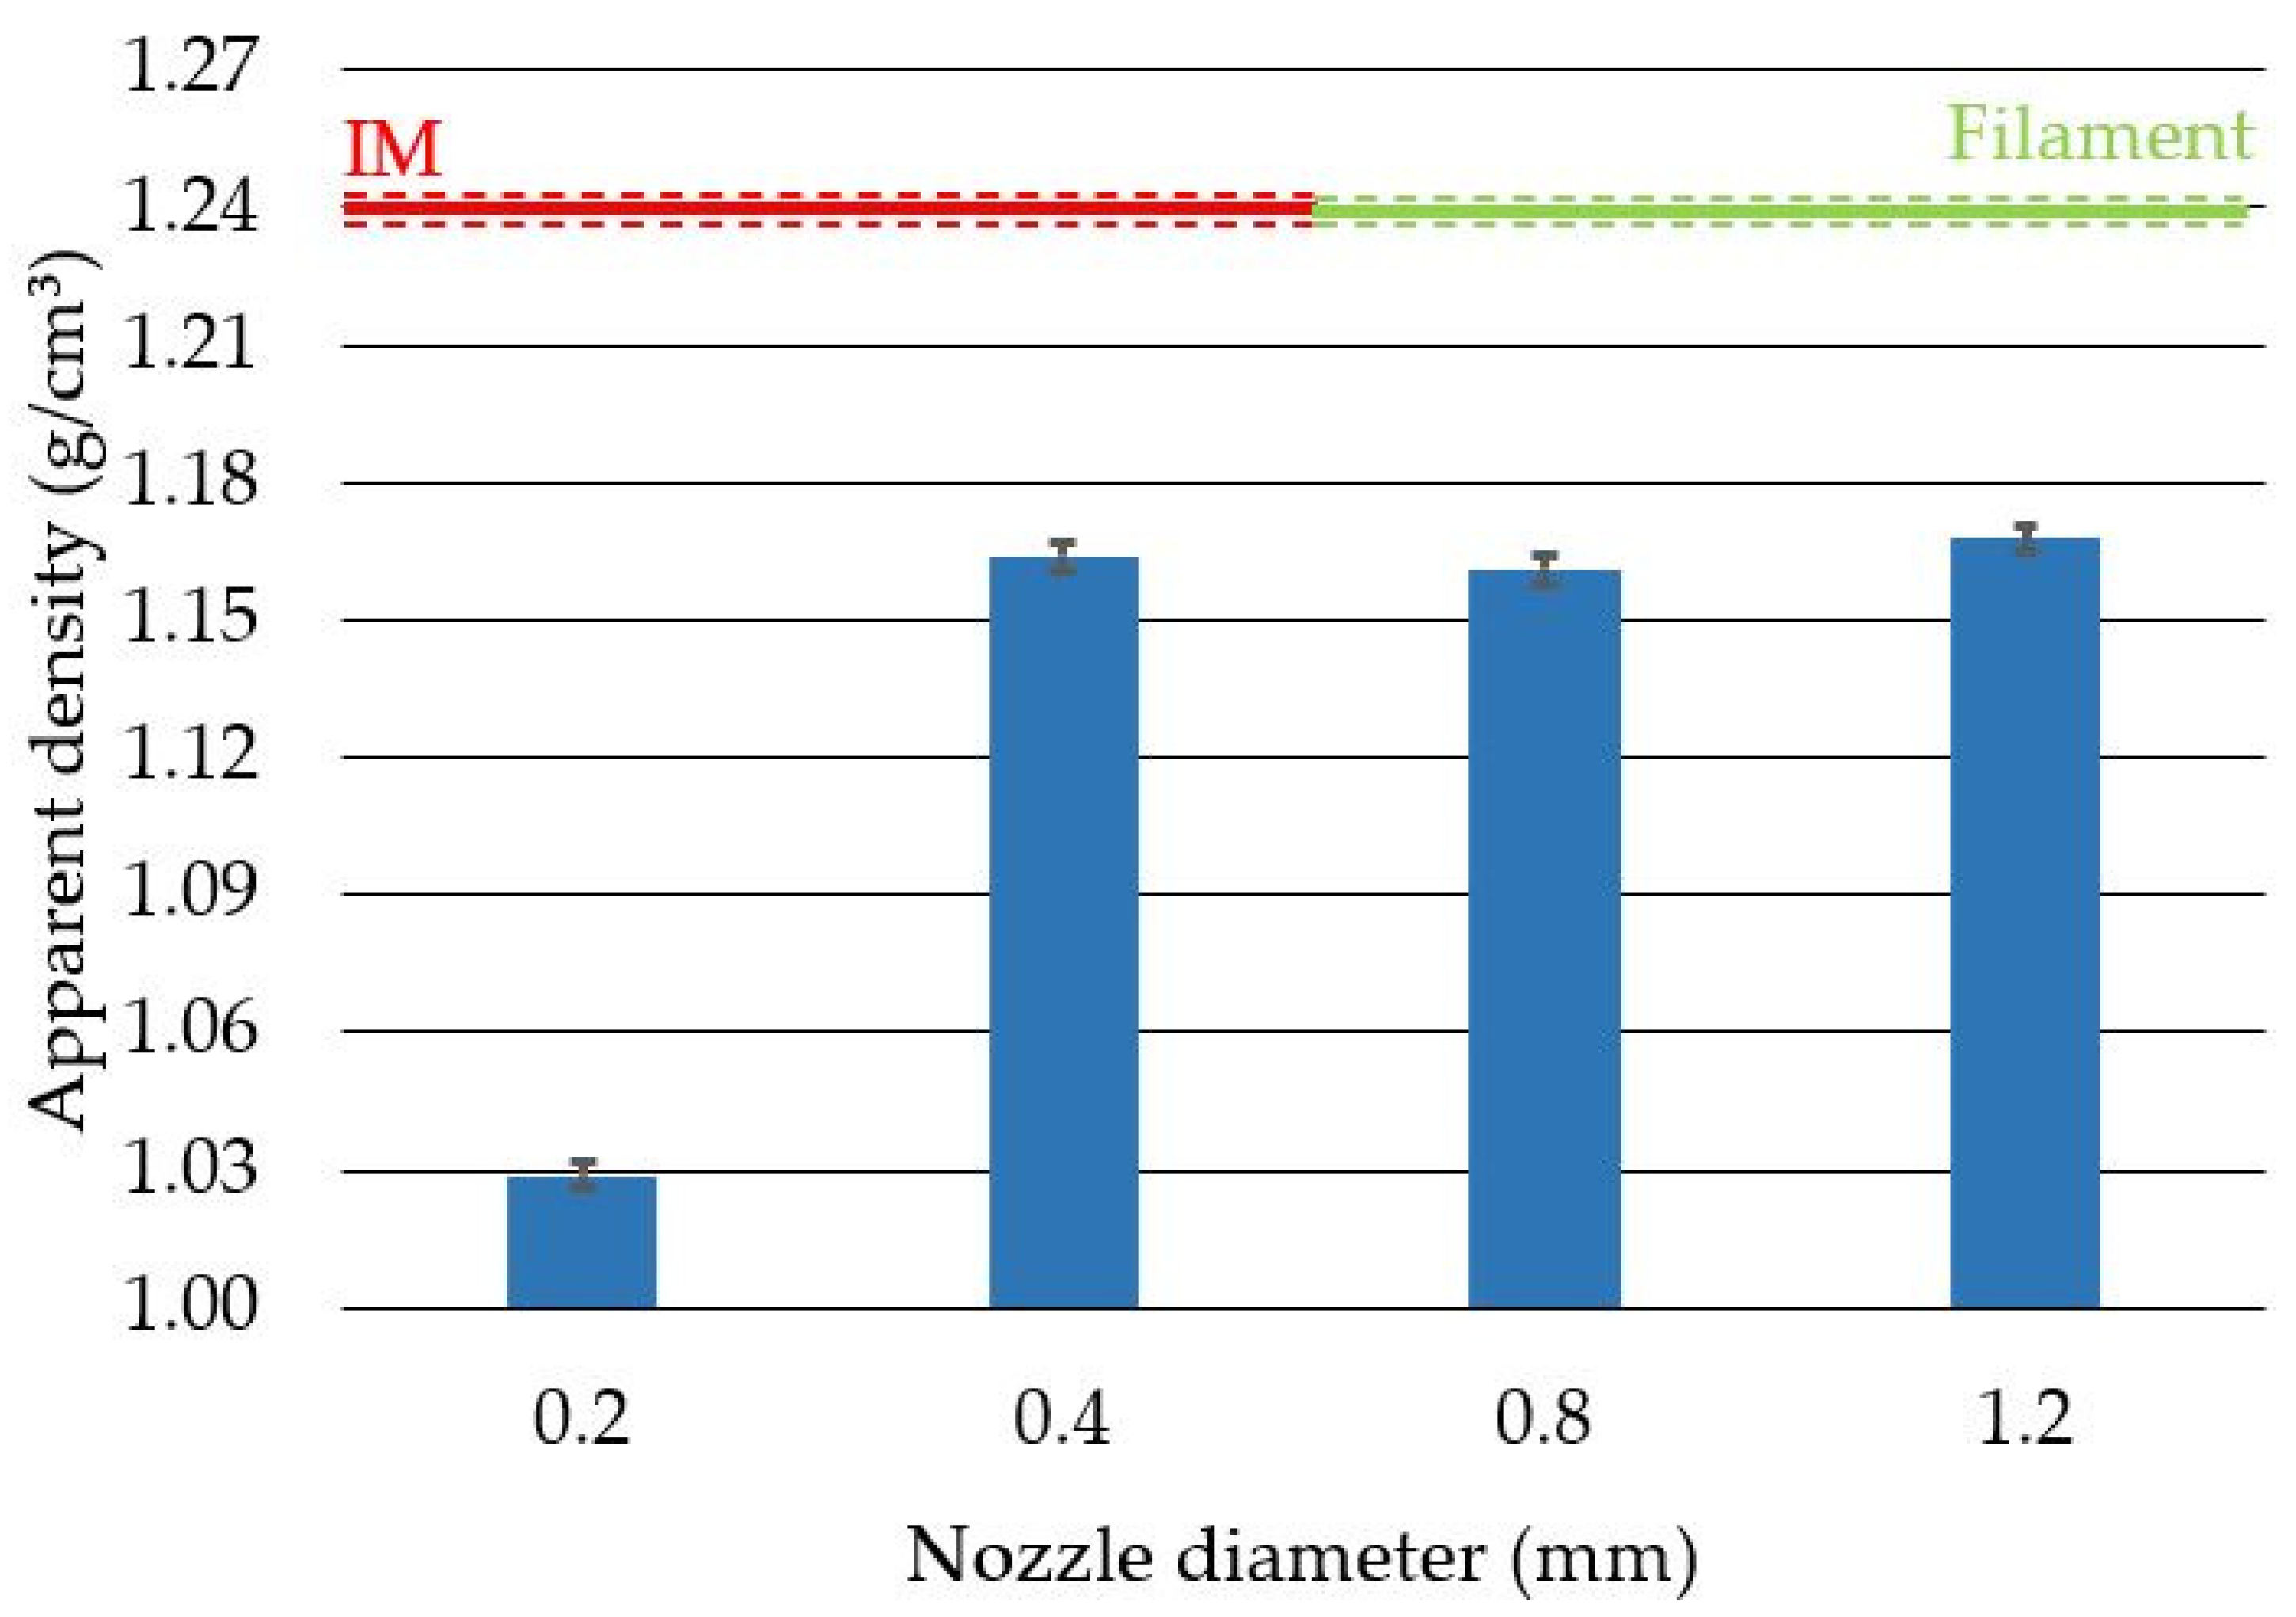
2.6. Density Analysis
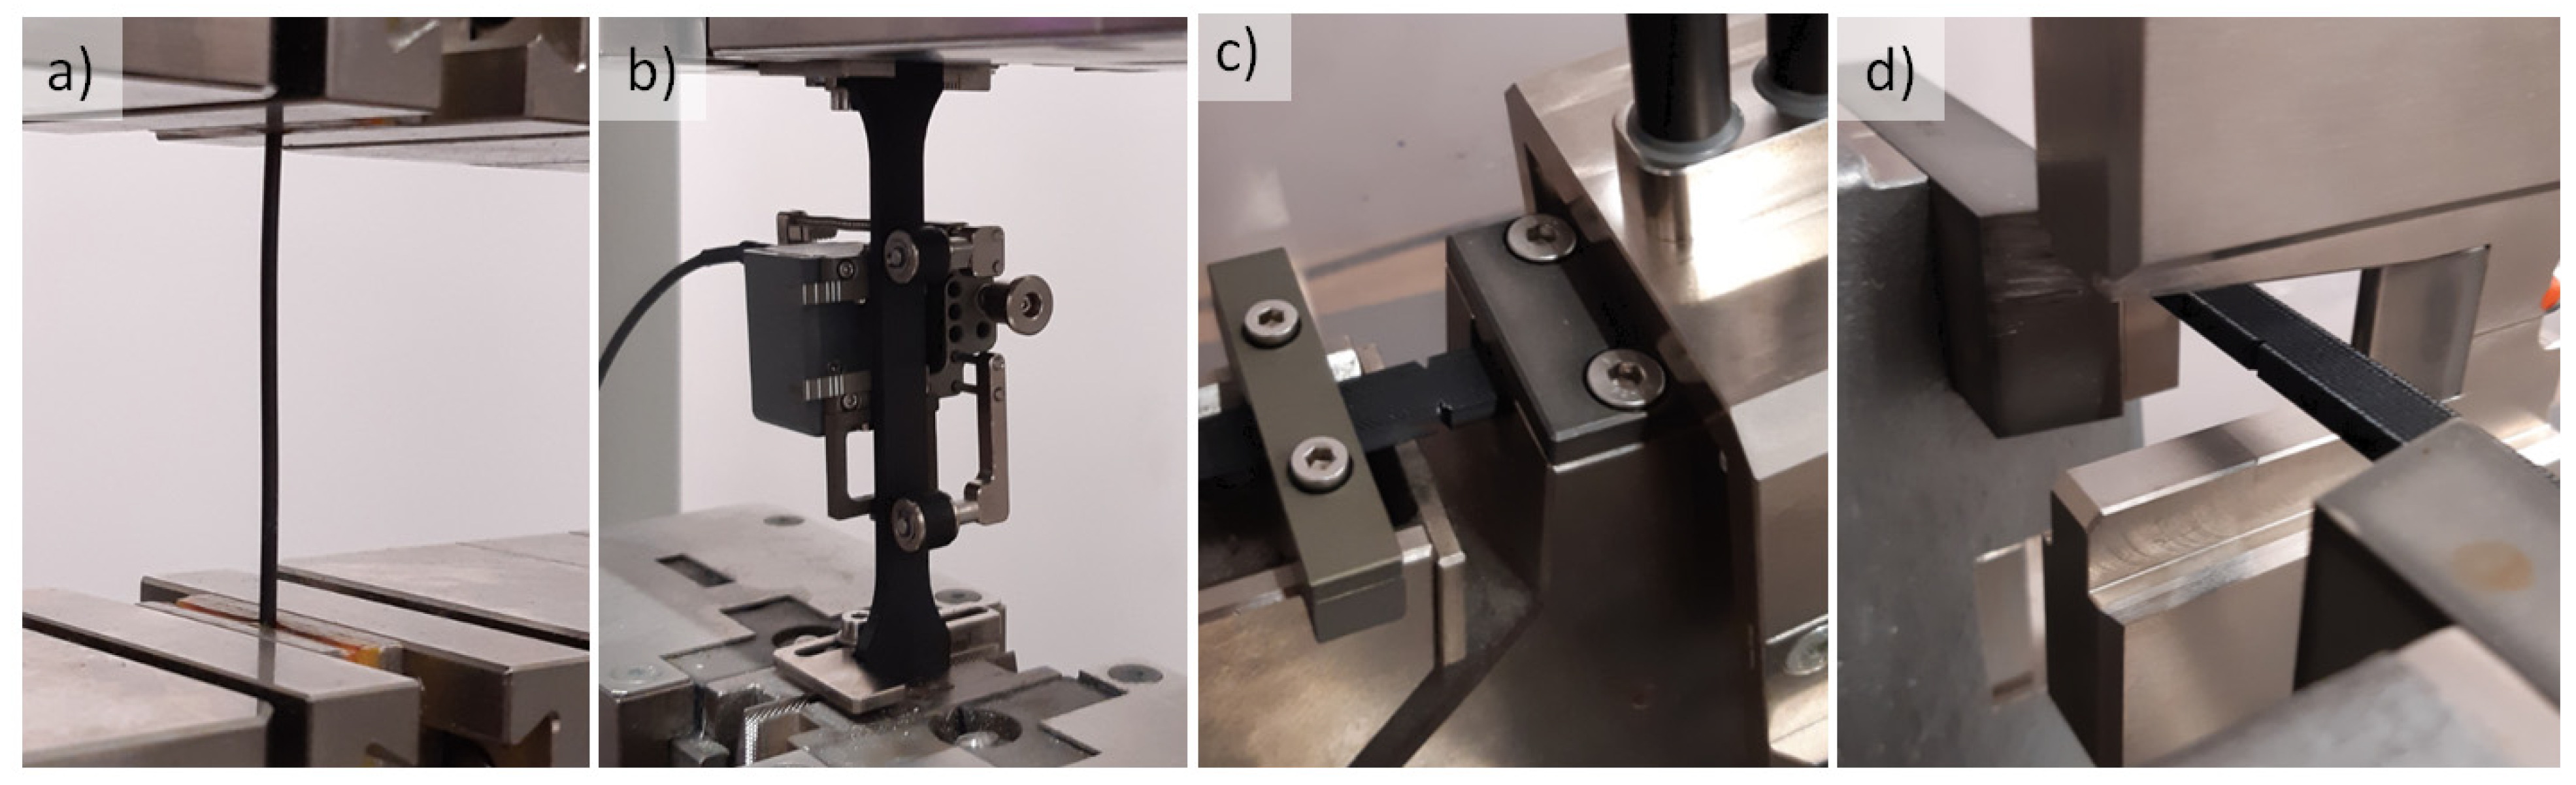
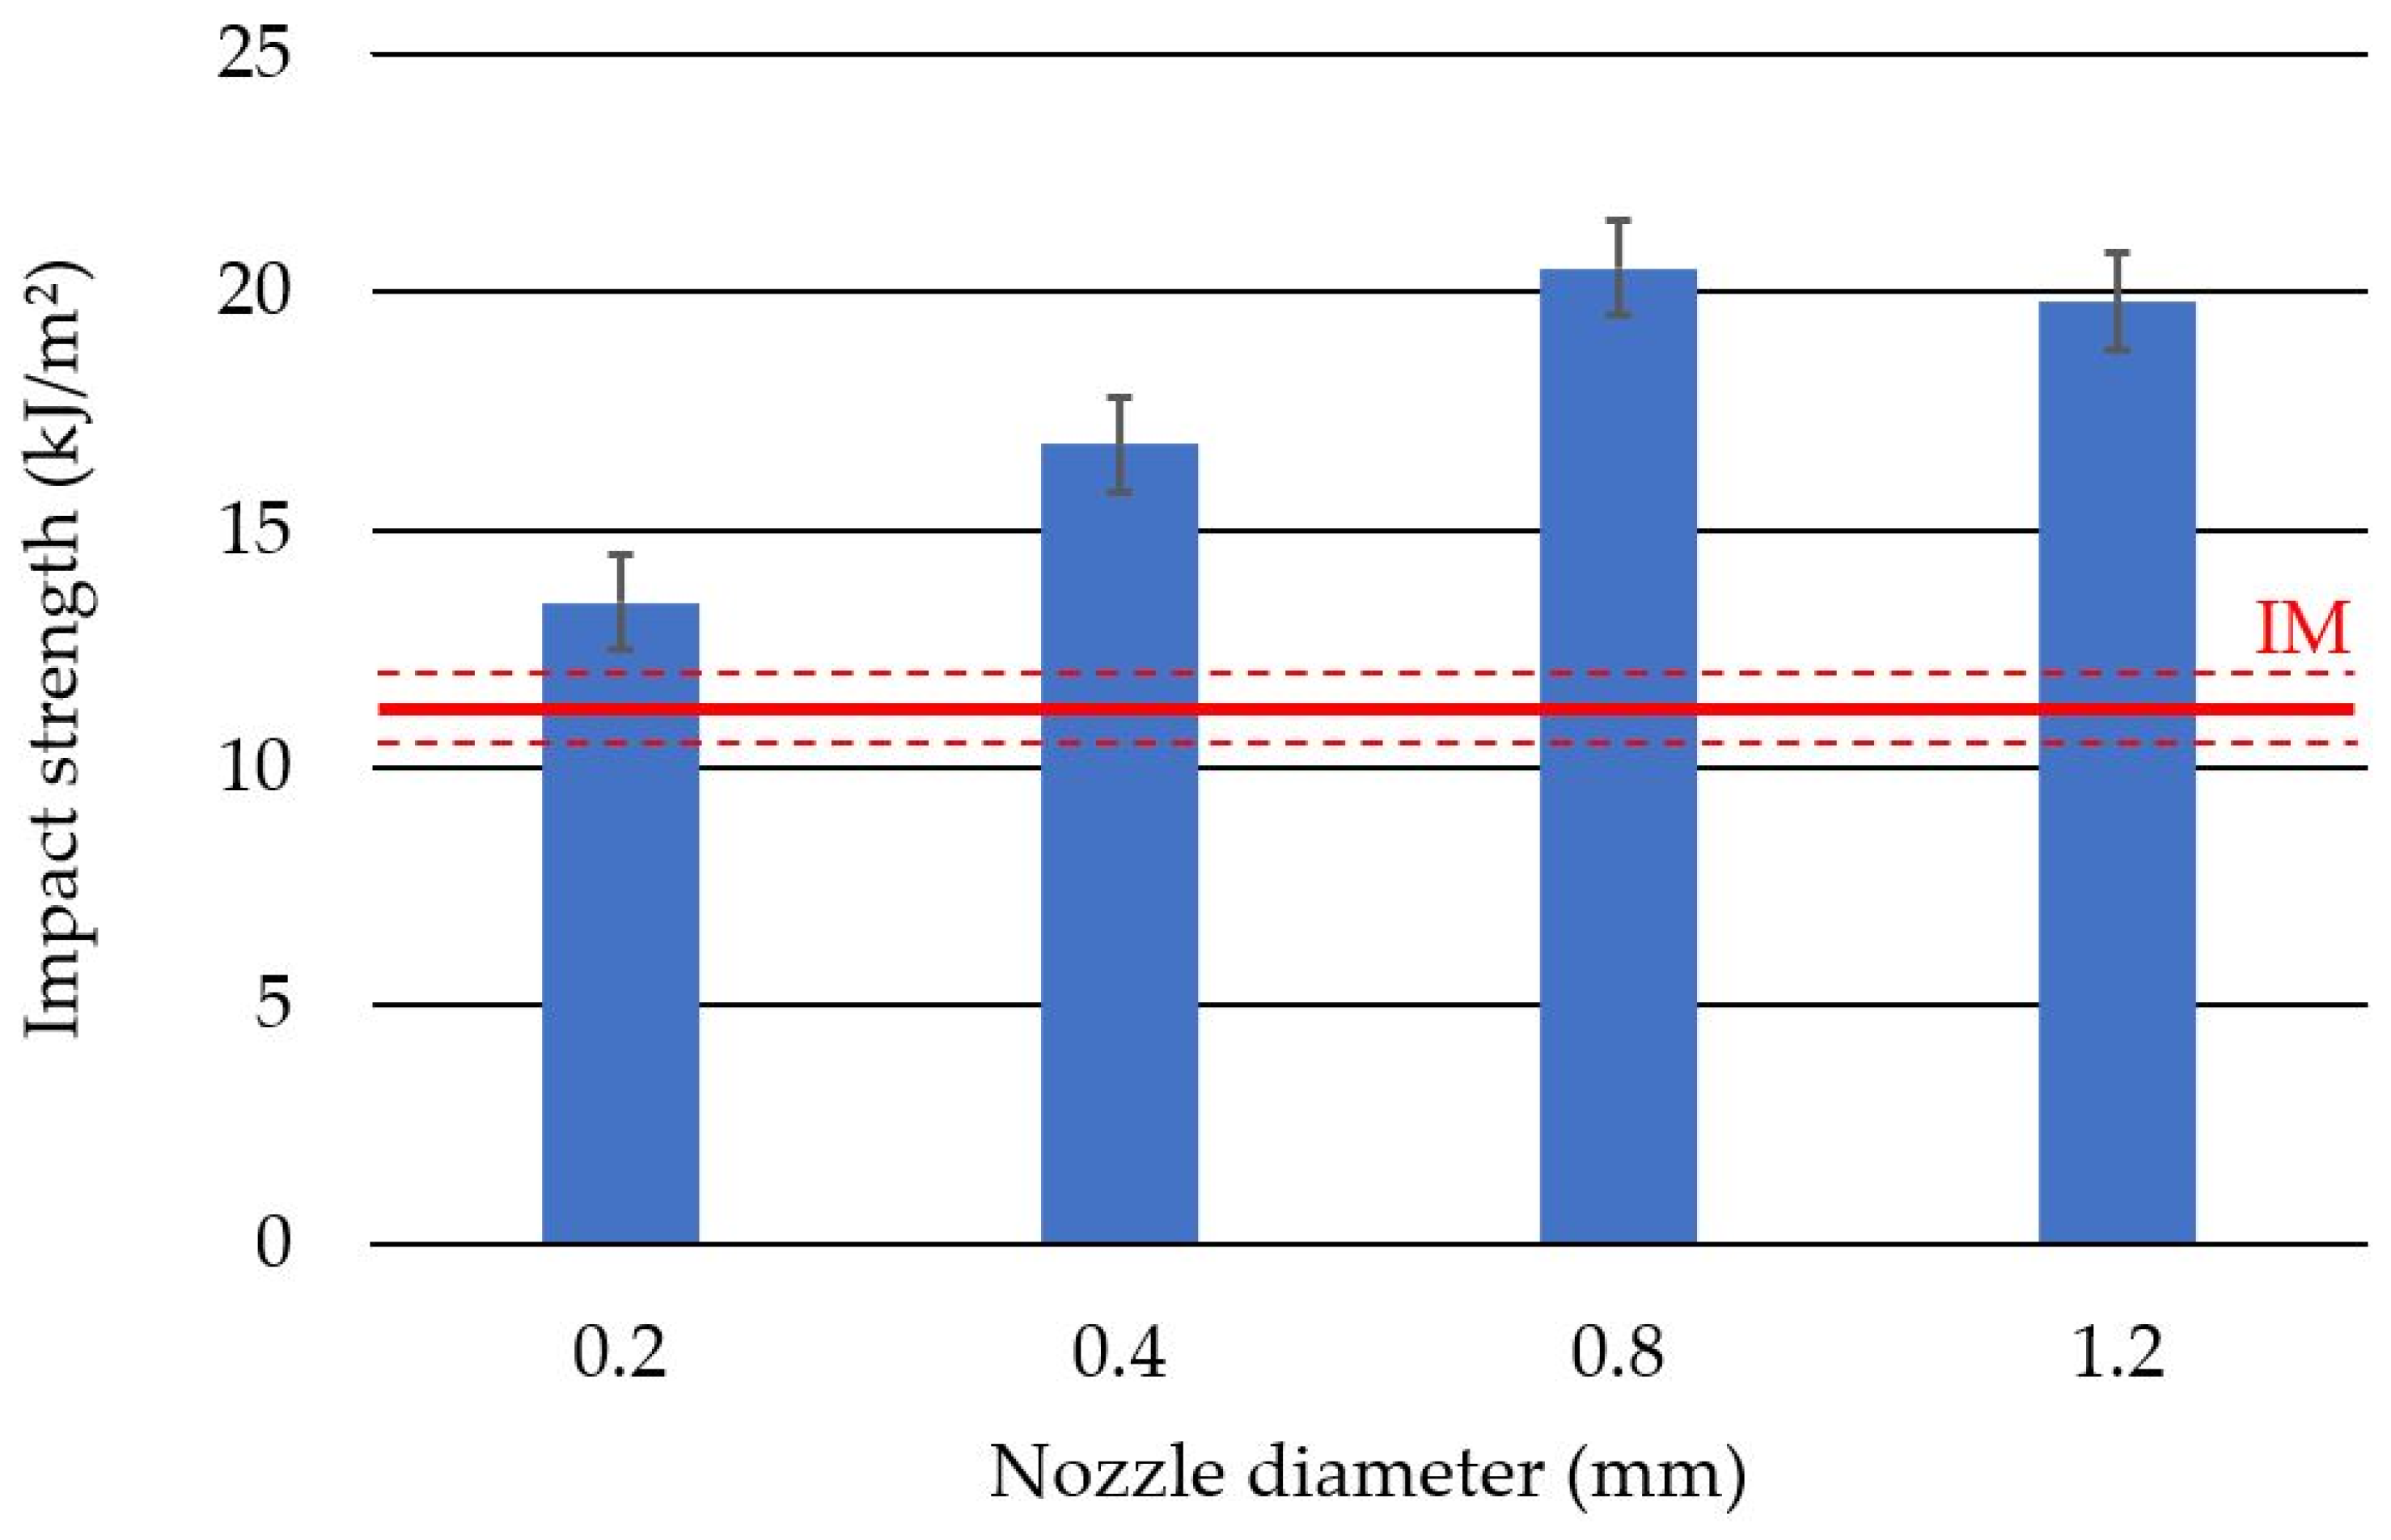
2.7. Mechanical Tests
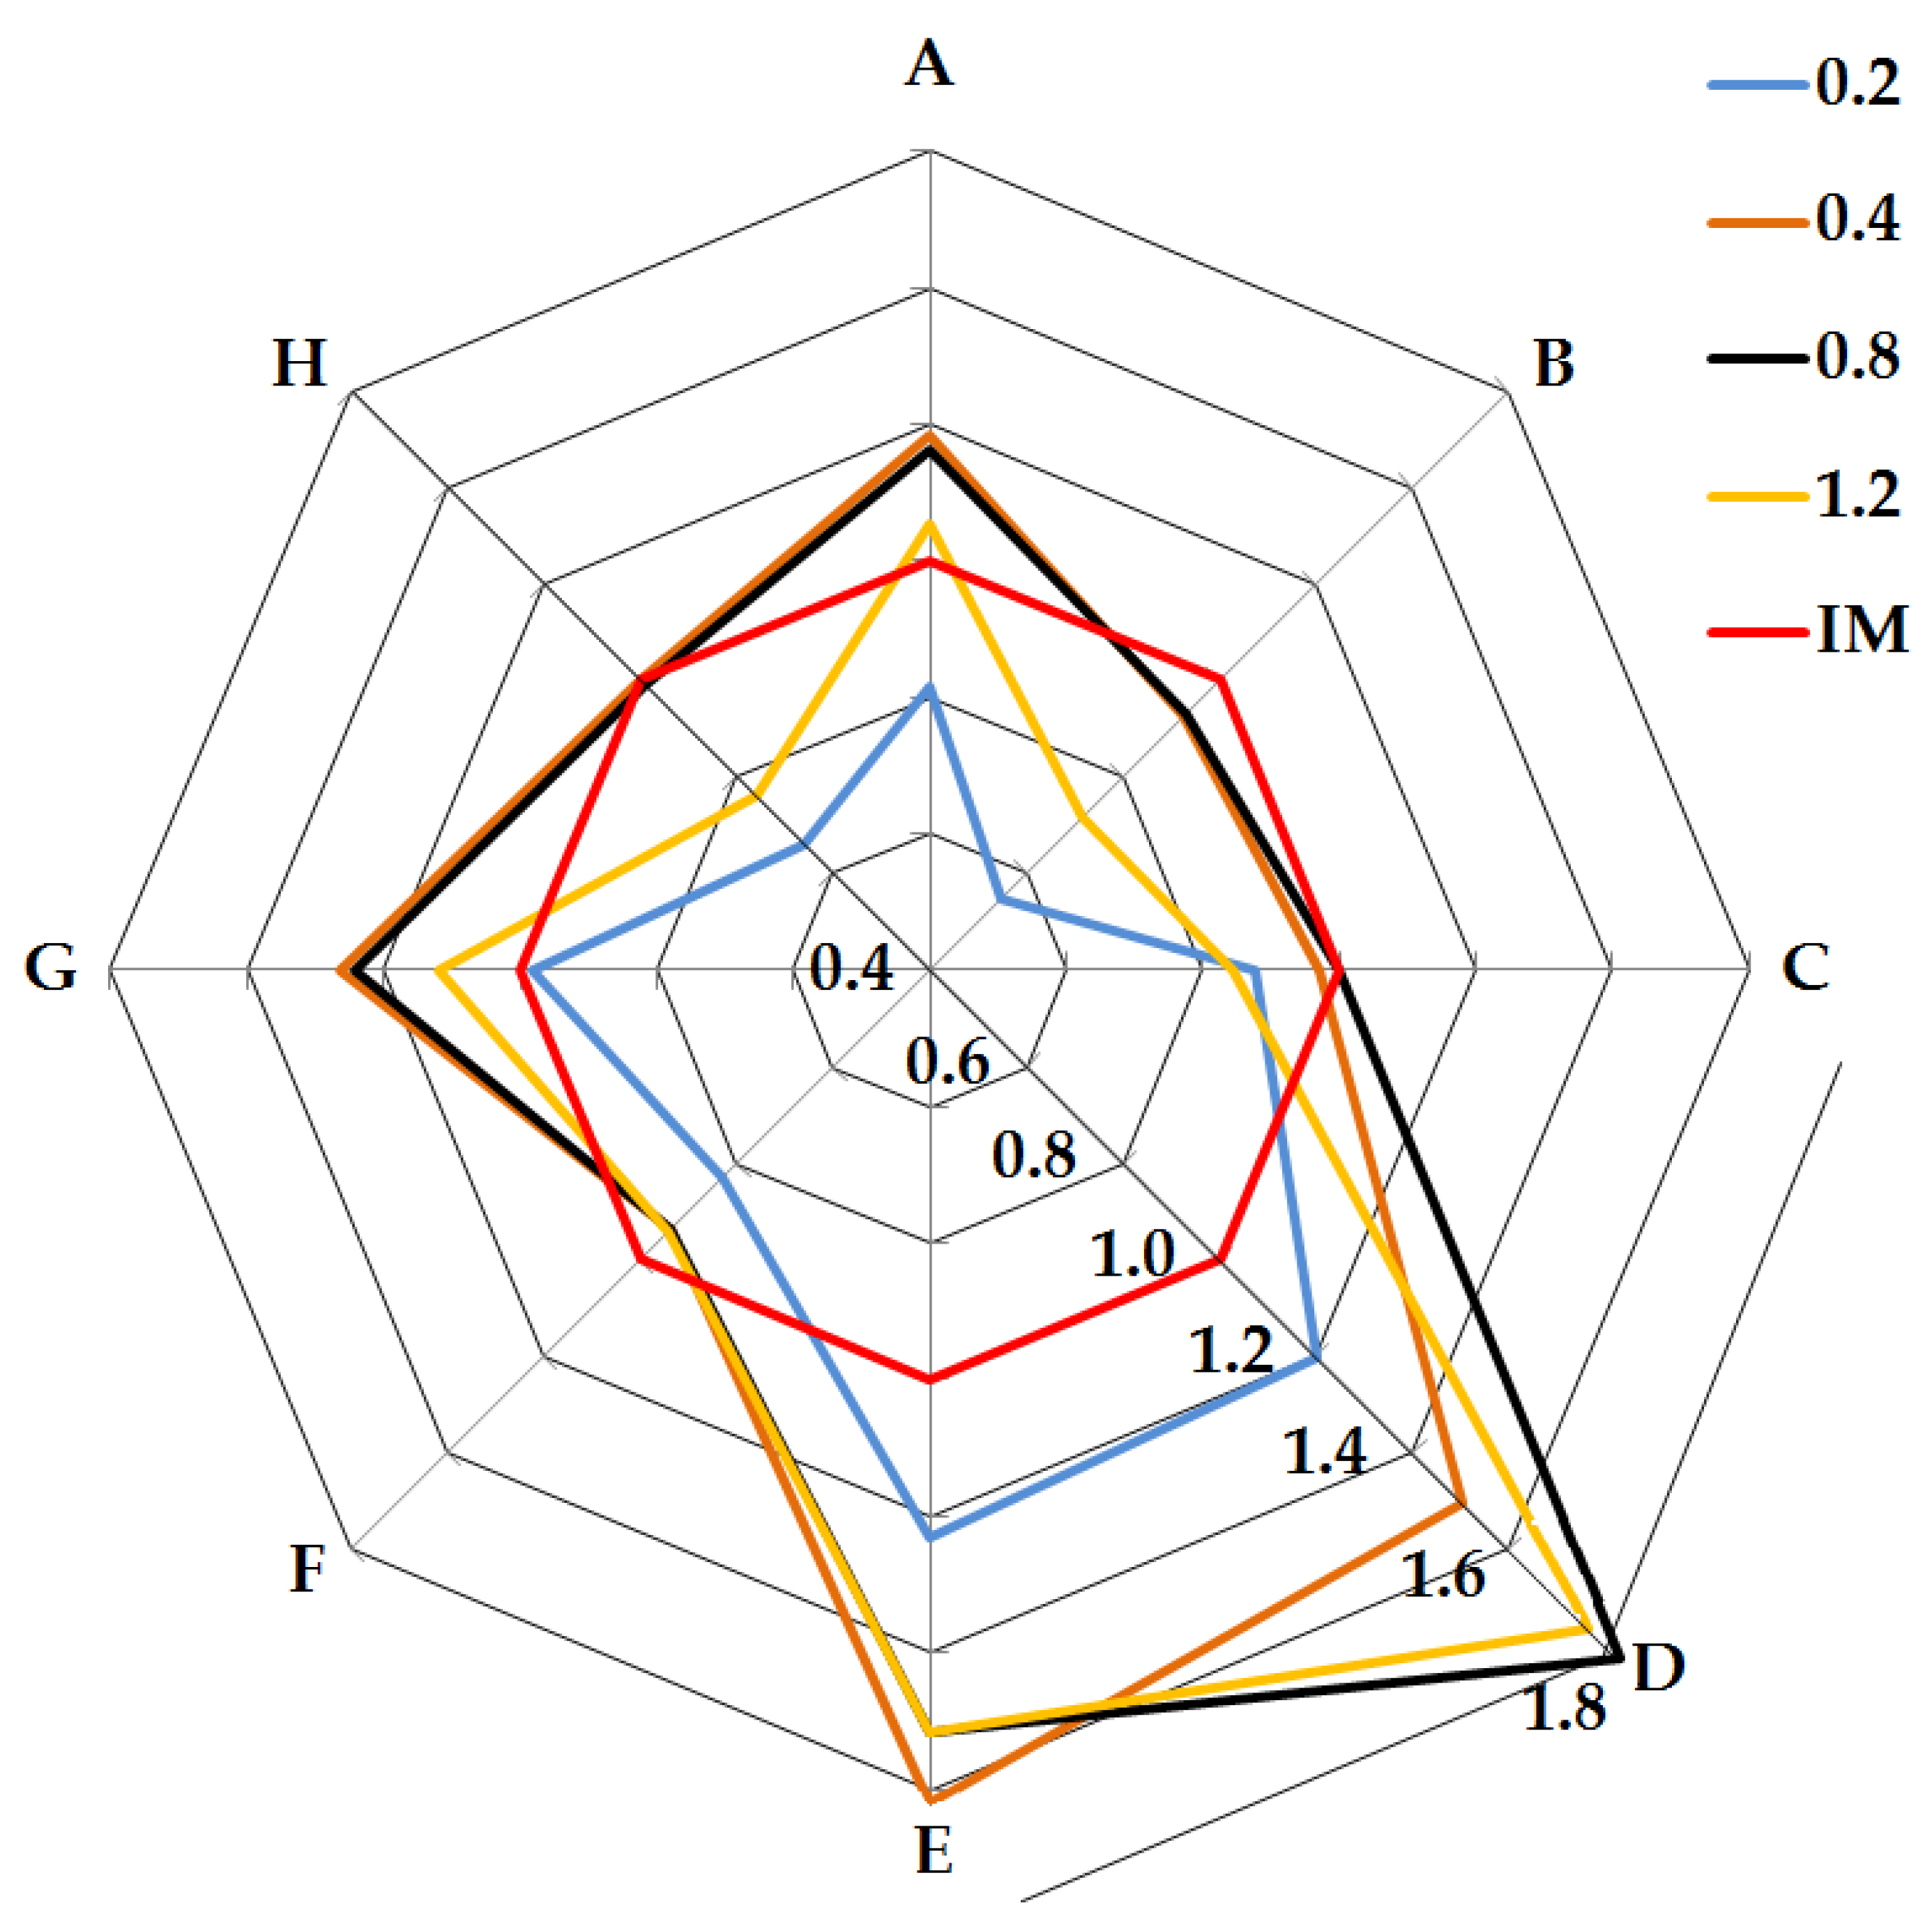
3. Results and Analysis
3.1. PLA Mechanical Properties of the Injection-Molded Samples
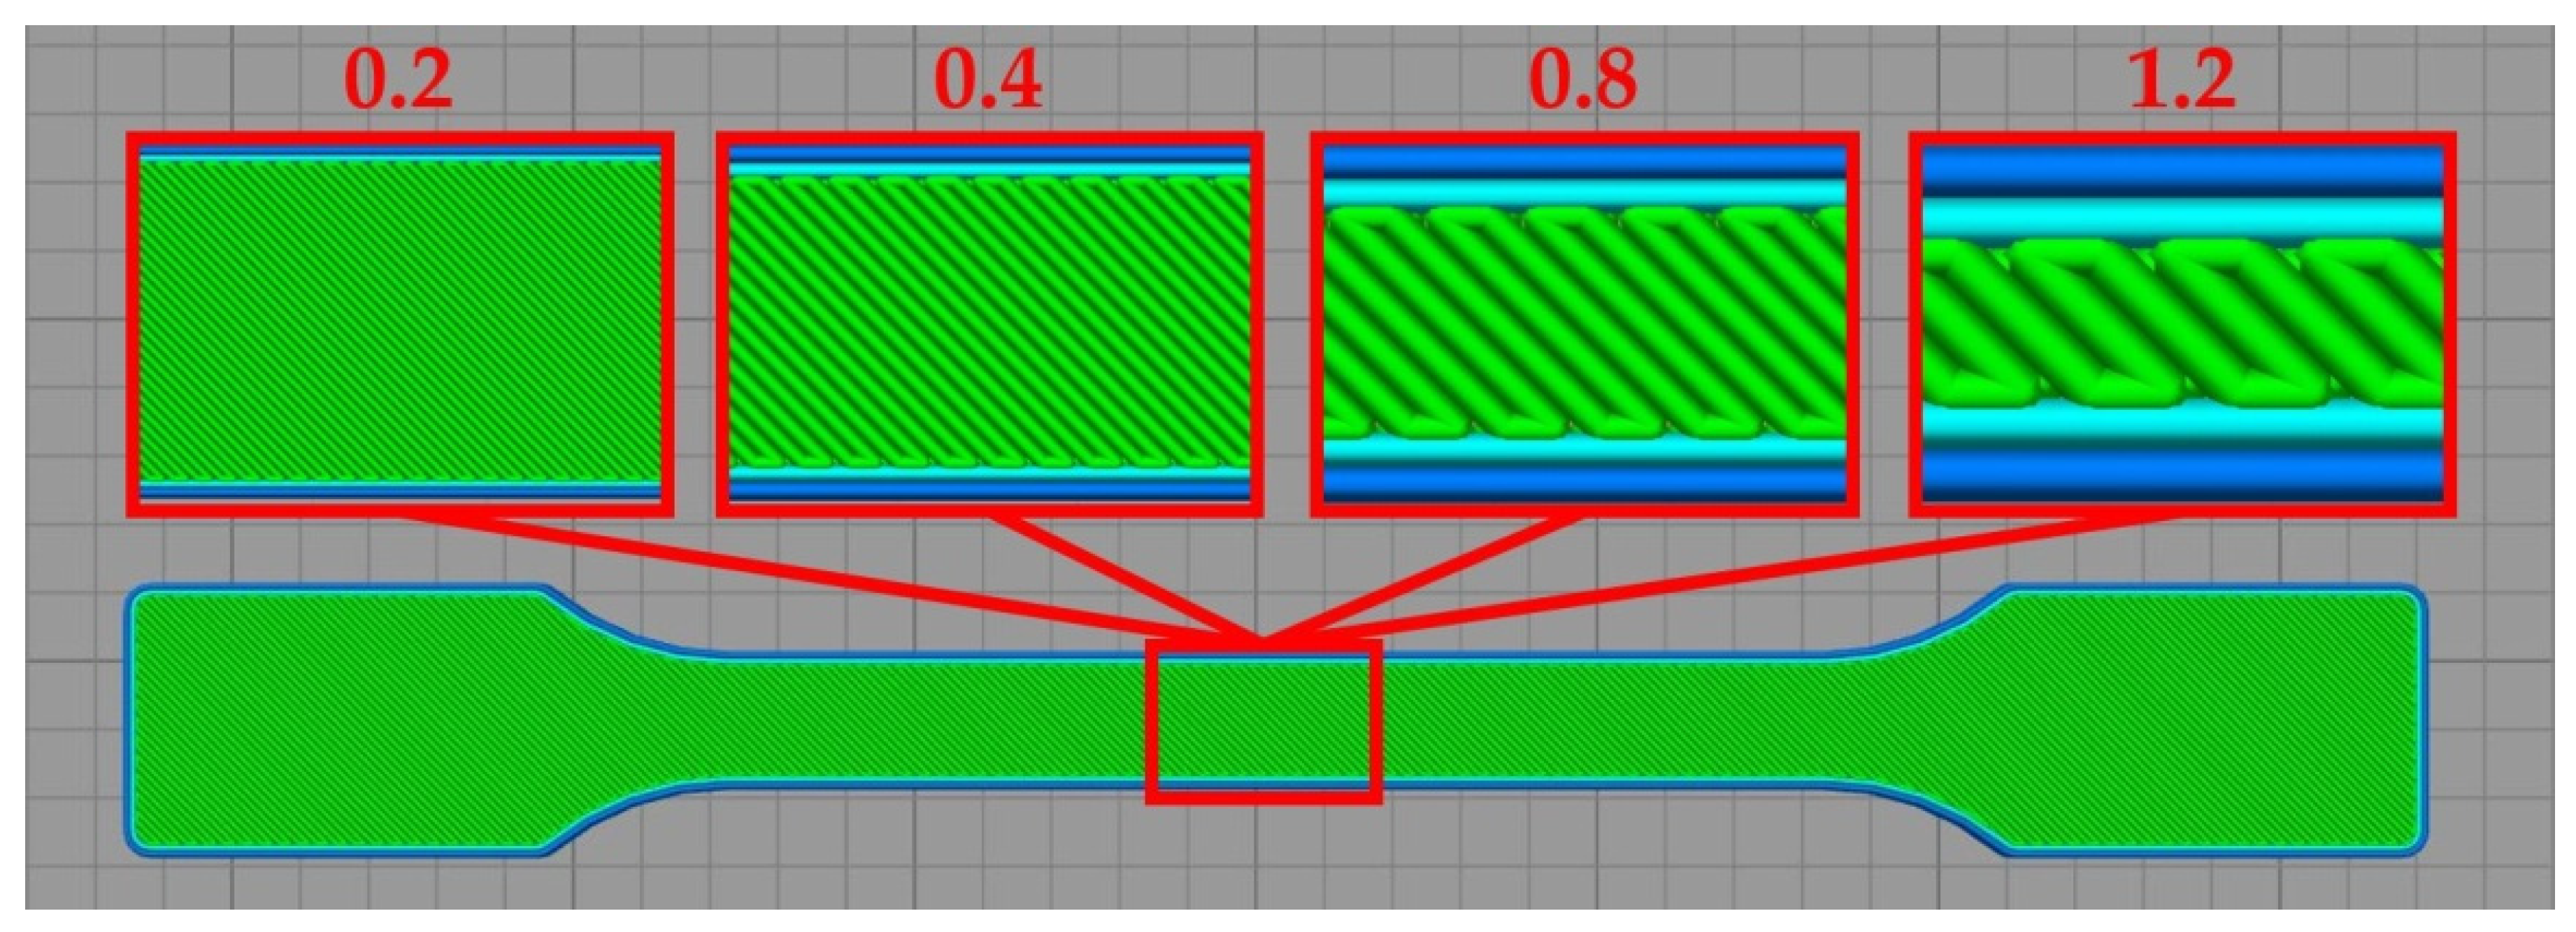
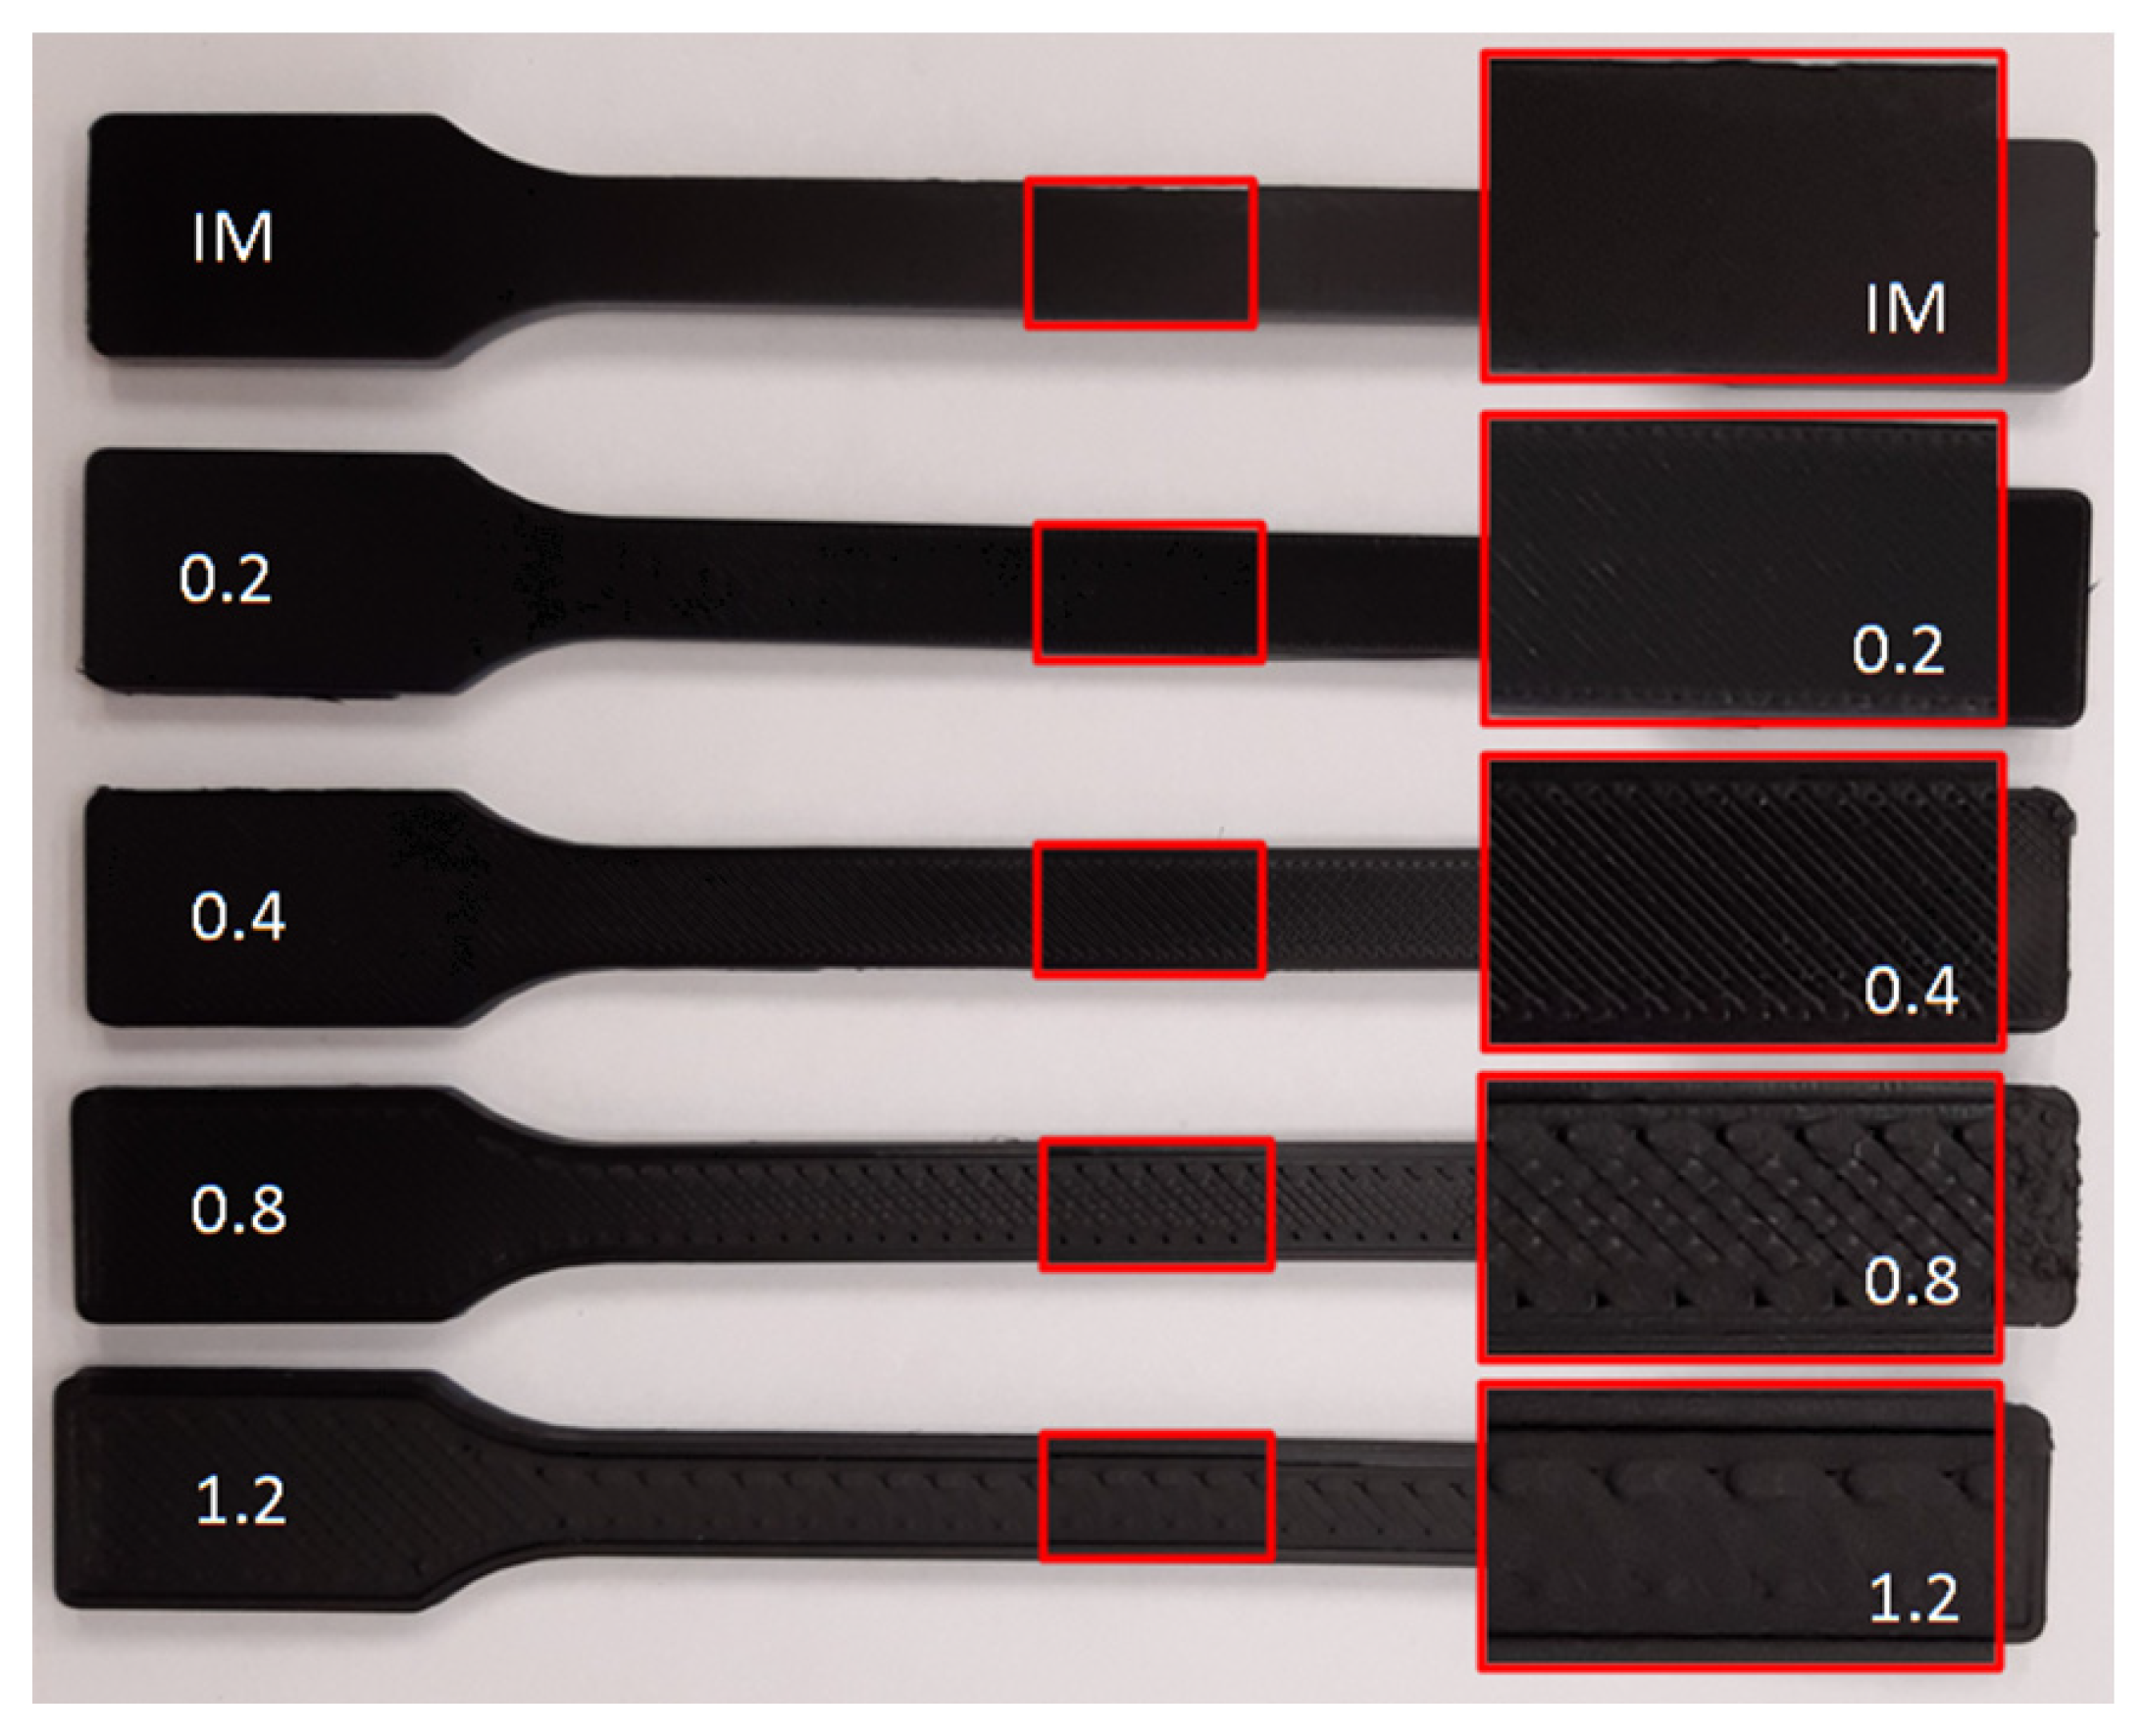
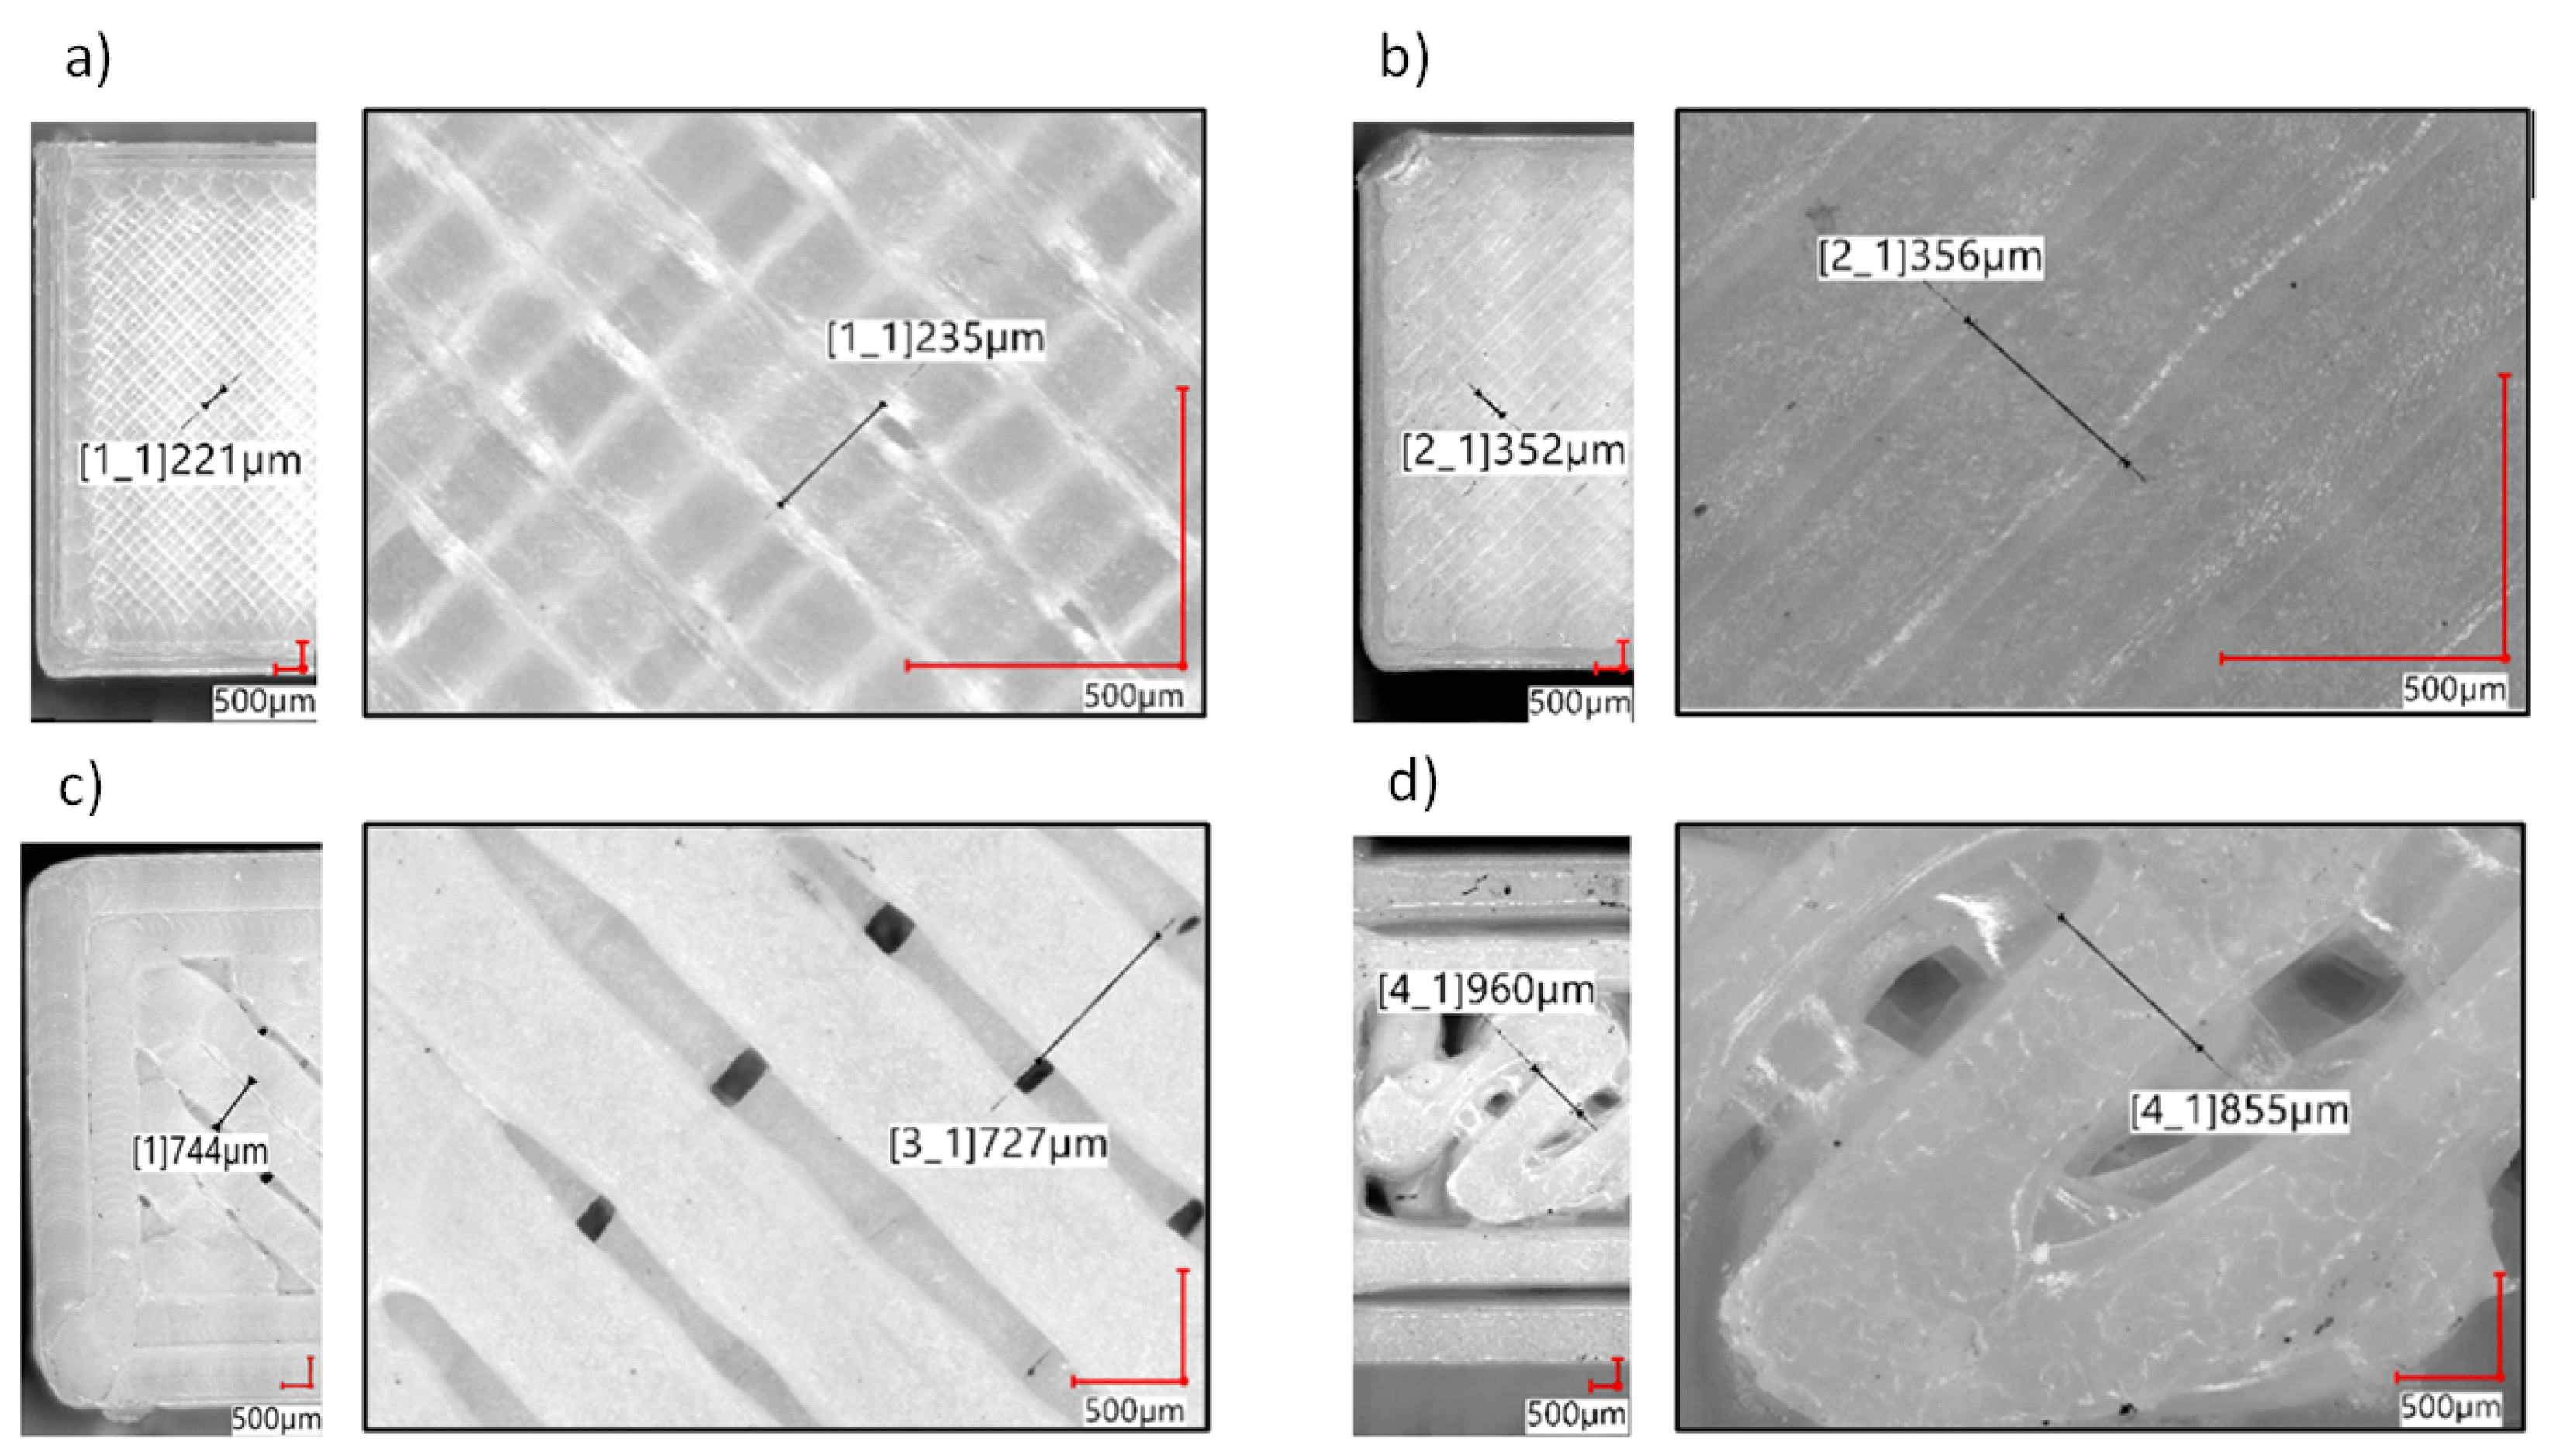
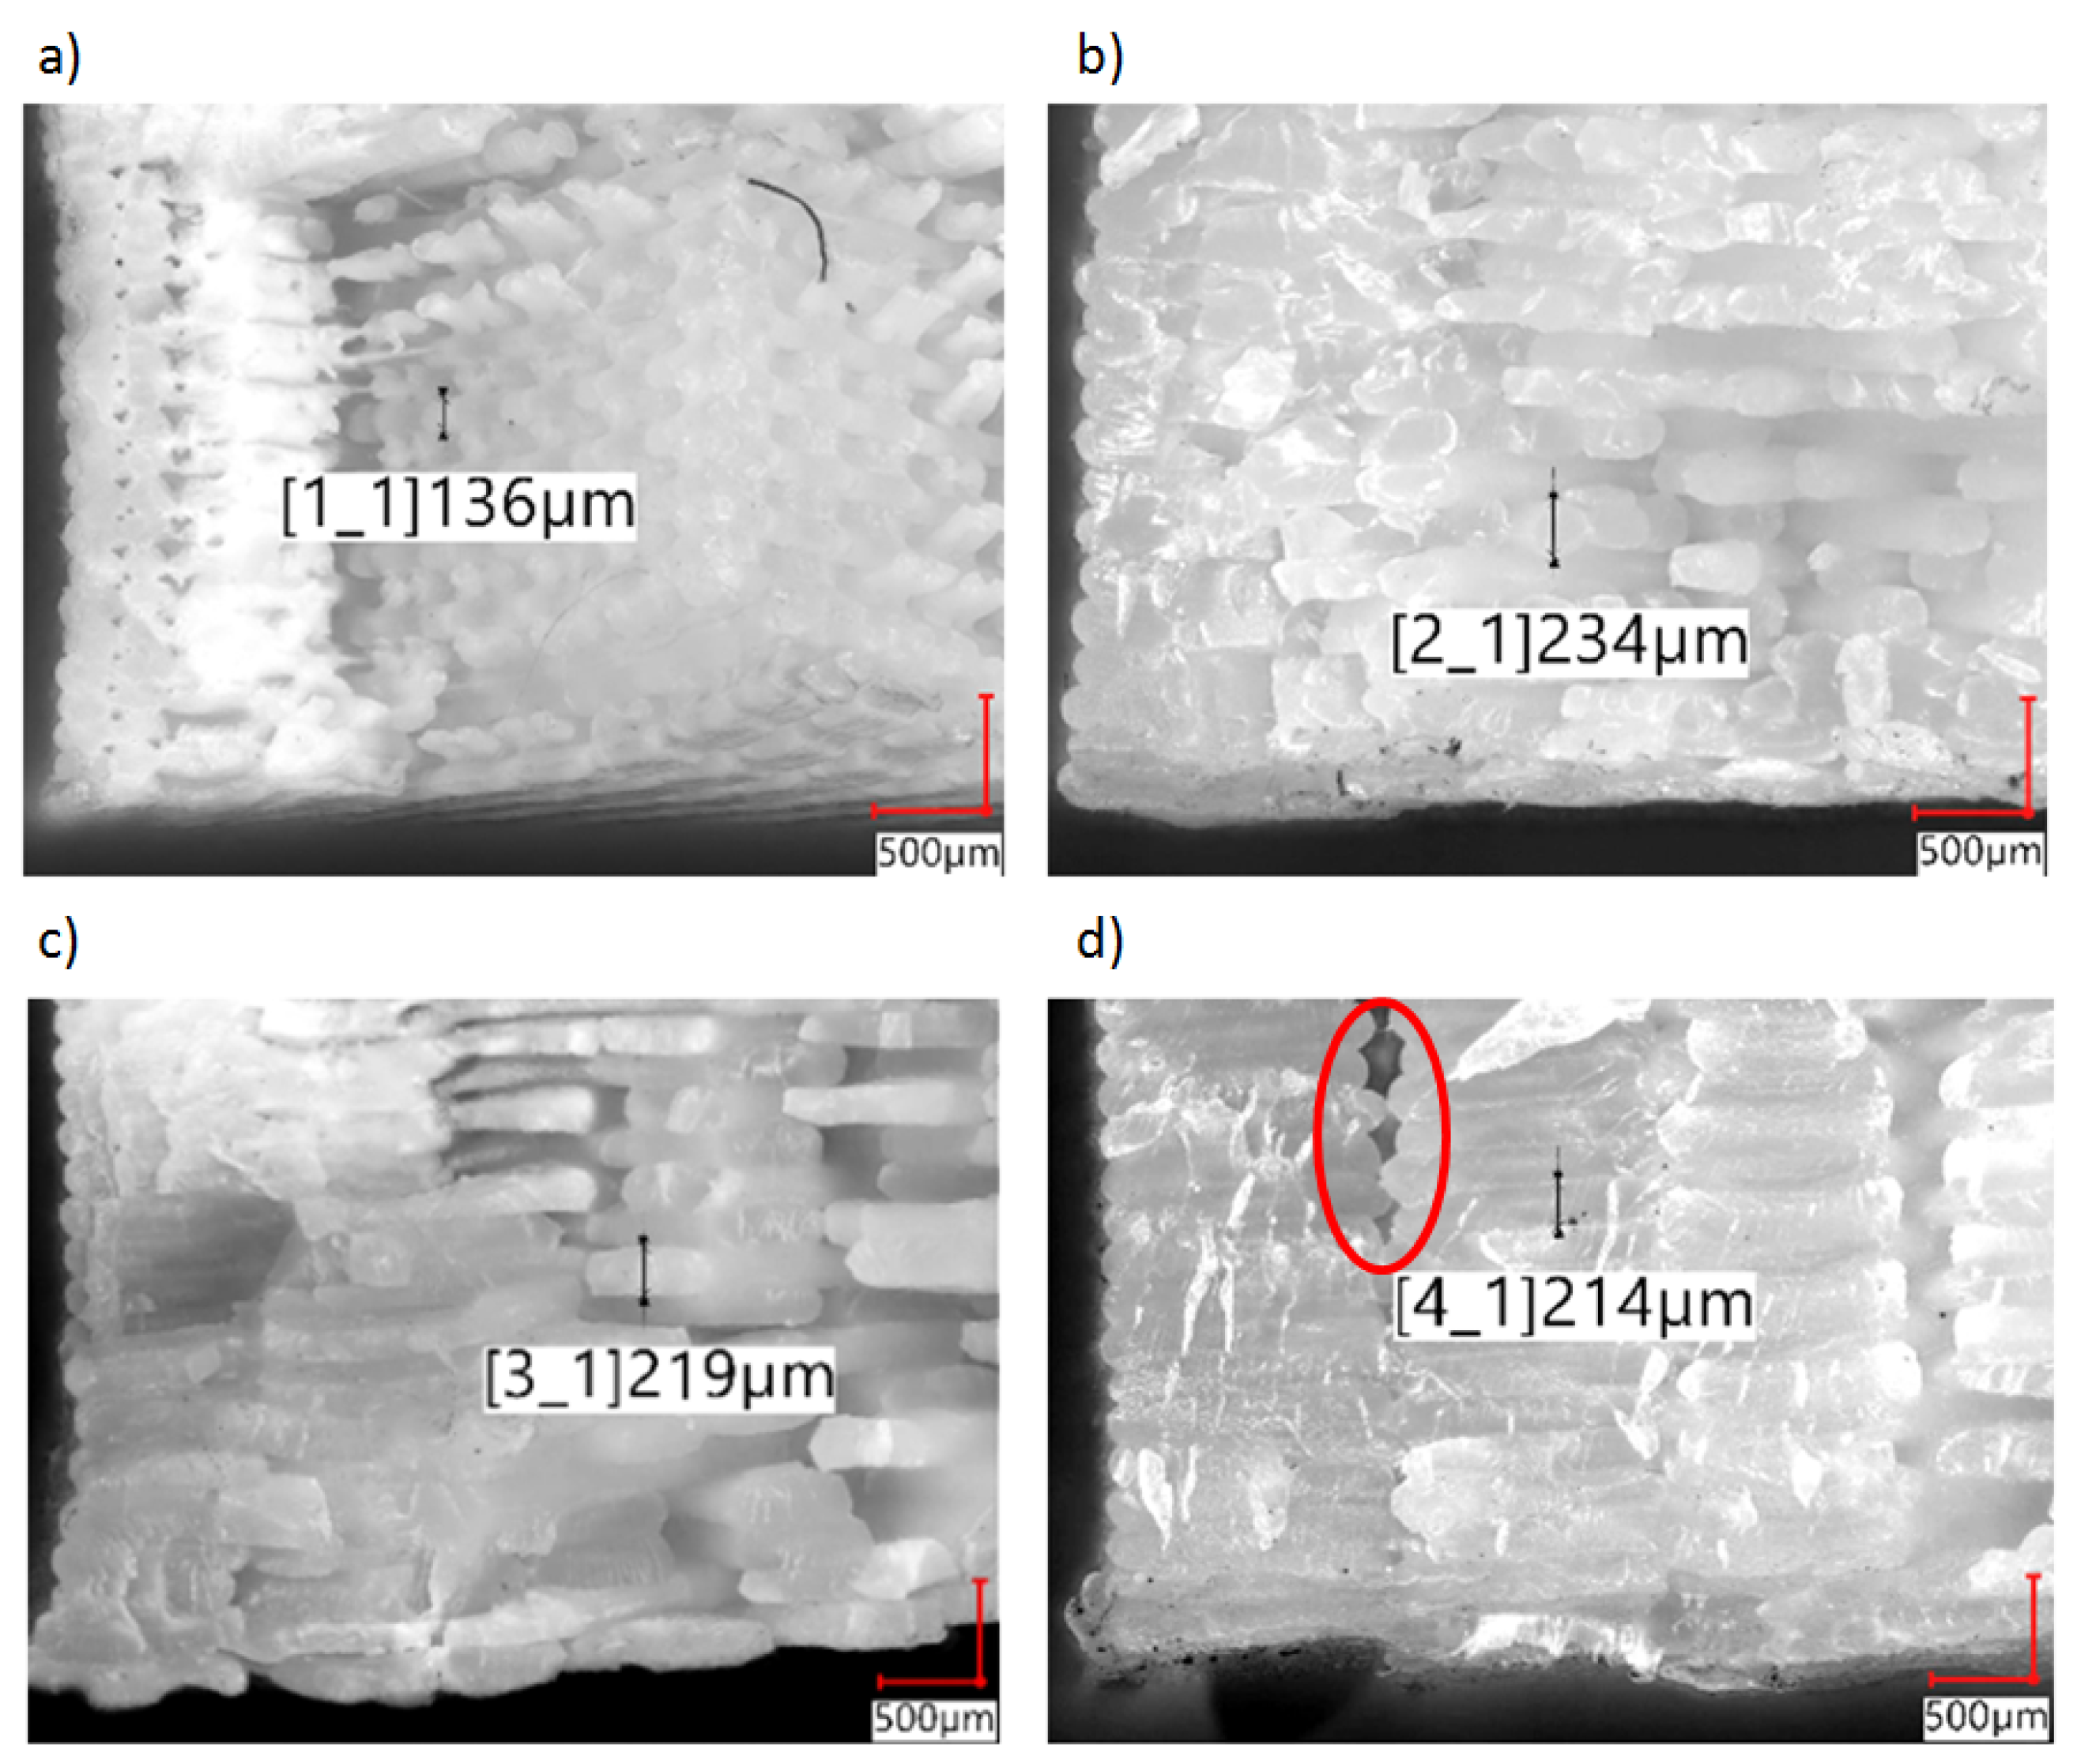
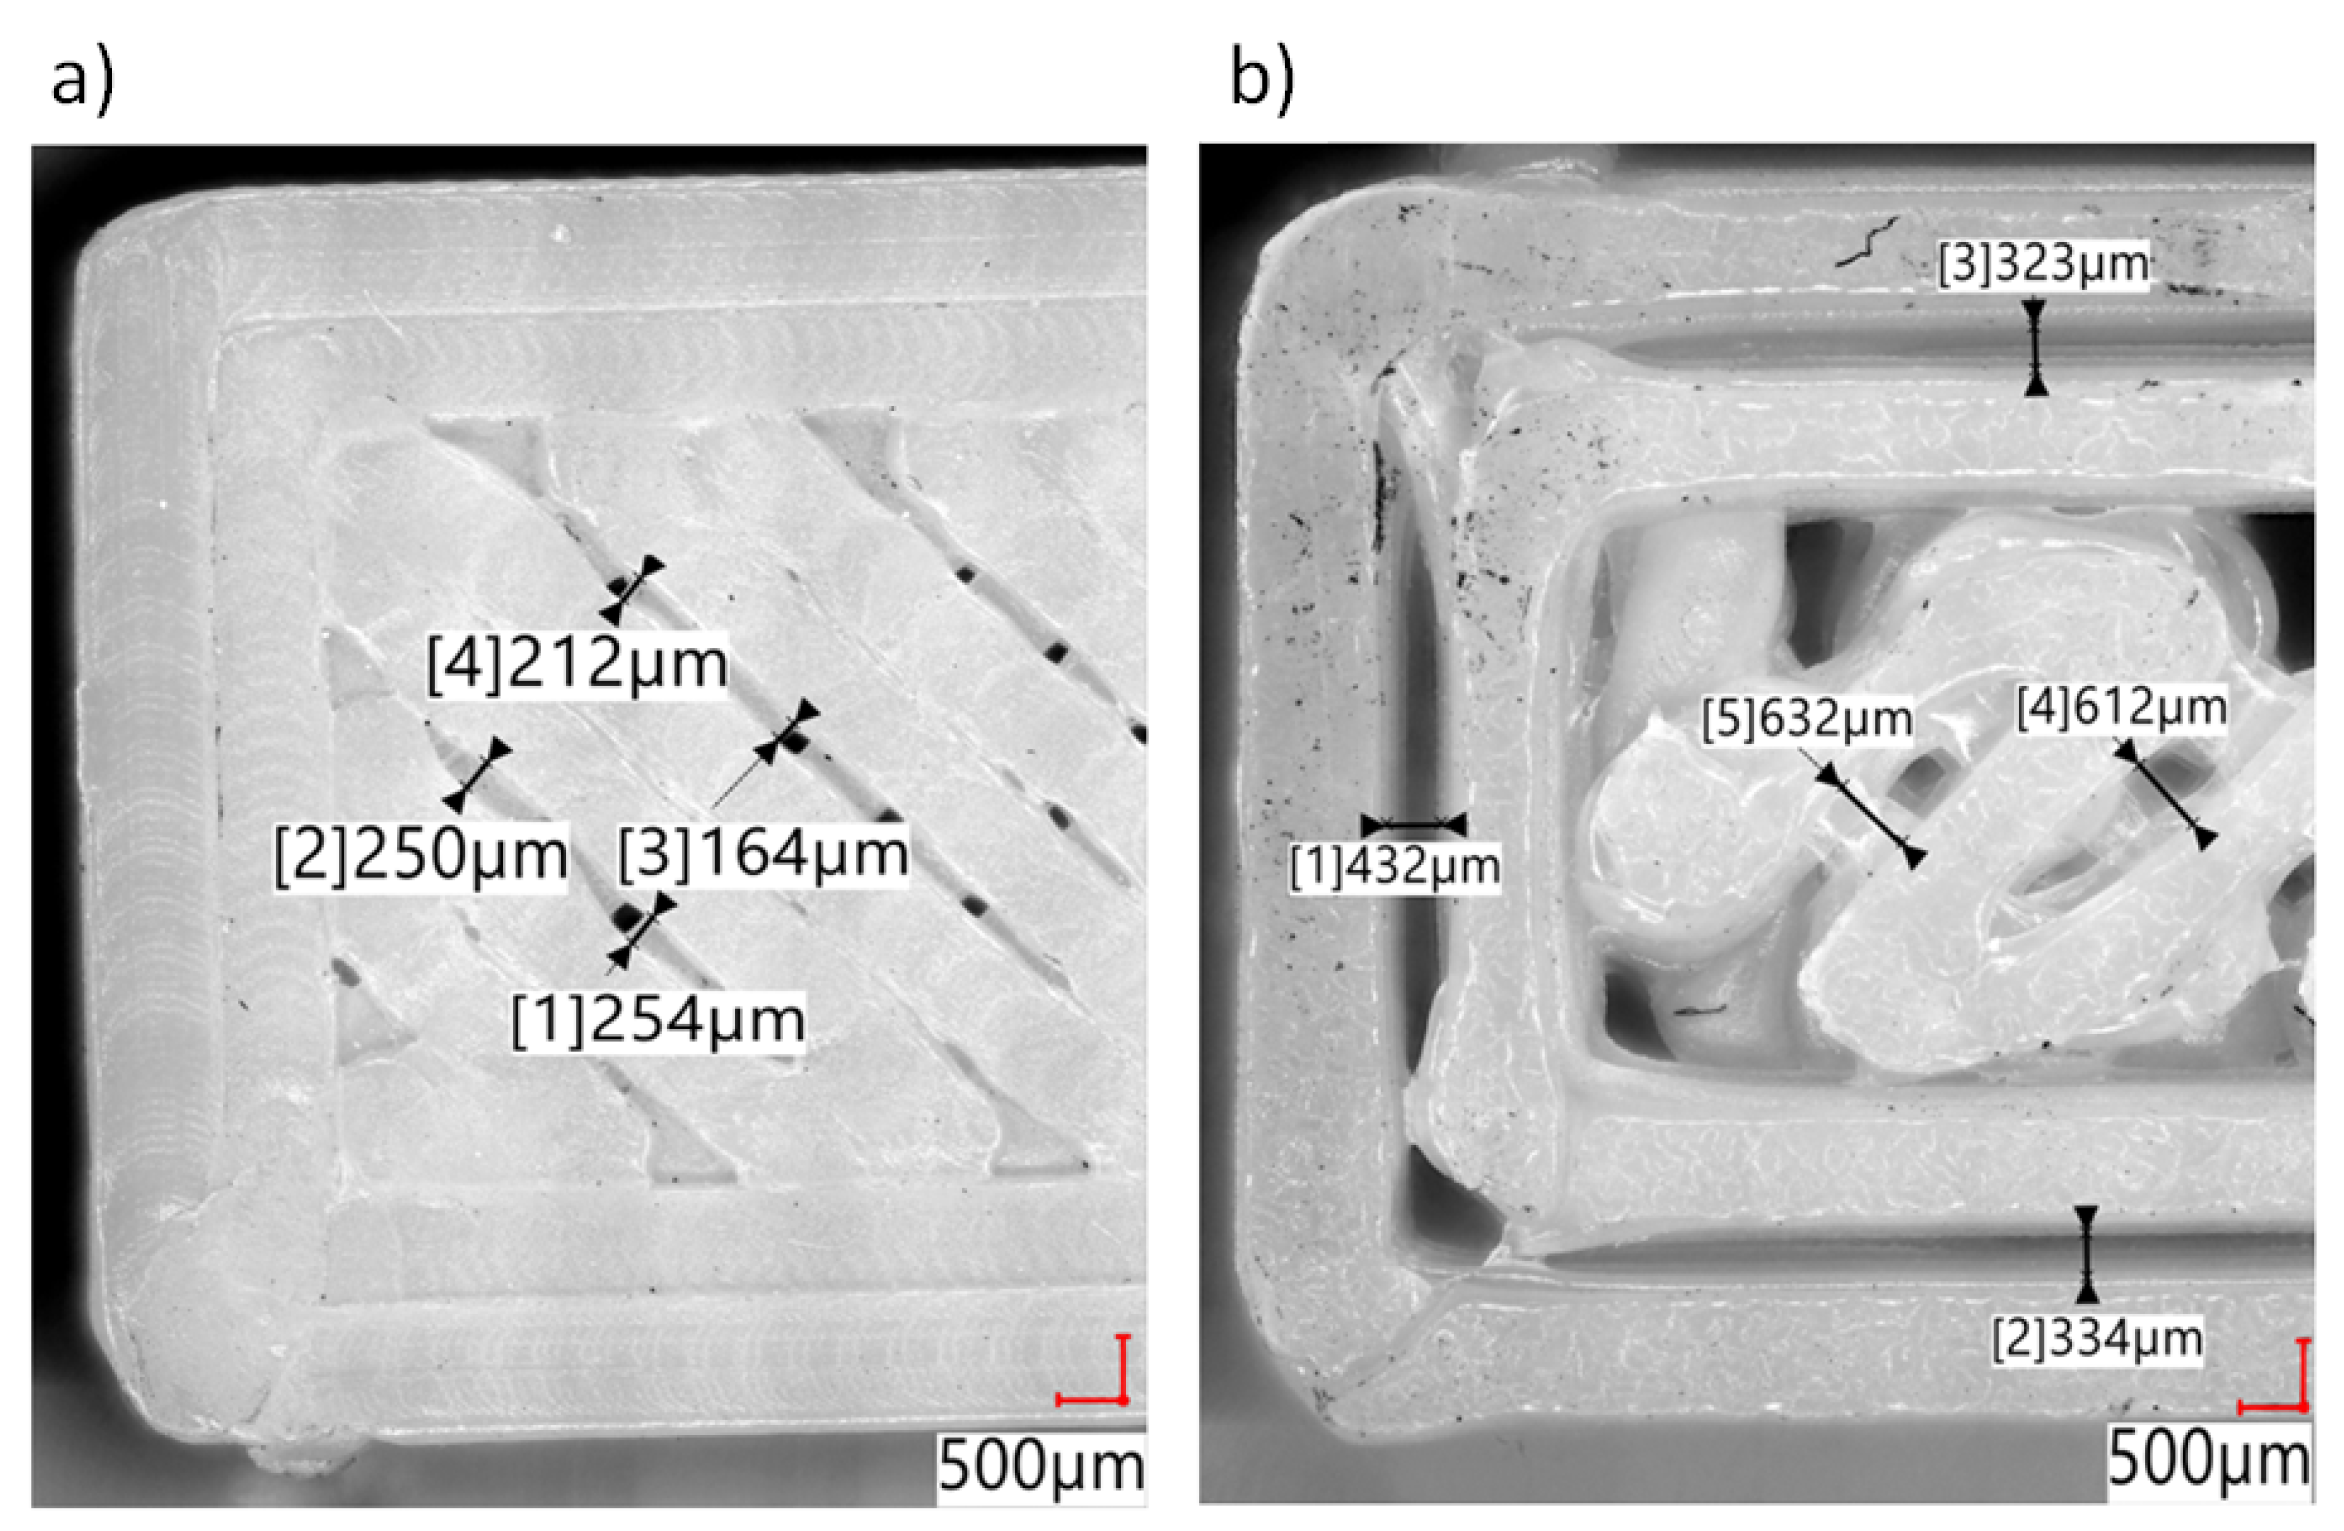
3.2. Structure Analysis 3D-Printed Objects
3.3. Mechanical Characteristics
4. Discussion
5. Conclusions
Author Contributions
Funding
Institutional Review Board Statement
Informed Consent Statement
Data Availability Statement
Acknowledgments
Conflicts of Interest
References
- Kristiawan, R.; Imaduddin, F.; Ariawan, D.; Ubaidillah; Arifin, Z. A review on the fused deposition modeling (FDM) 3D printing: Filament processing, materials, and printing parameters. Open Eng. 2021, 11, 639–649. [Google Scholar] [CrossRef]
- Khosravani, M.; Reinicke, T. On the environmental impacts of 3D printing technology. Appl. Mater. Today 2020, 20, 100689. [Google Scholar] [CrossRef]
- Kanagachidambaresan, G.R. Introduction to 3d Printing and Prototyping. In Role of Single Board Computers (SBCs) in Rapid IoT Prototyping. Internet of Things (Technology, Communications and Computing); Springer: Cham, Germany, 2021. [Google Scholar]
- Elkaseer, A.; Schneider, S.; Scholz, S. Experiment-Based Process Modeling and Optimization for High-Quality and Resource-Efficient FFF 3D Printing. Appl. Sci. 2020, 10, 2899. [Google Scholar] [CrossRef] [Green Version]
- Tümer, E.H.; Erbil, H.Y. Extrusion-Based 3D Printing Applications of PLA Composites: A Review. Coatings 2021, 11, 390. [Google Scholar] [CrossRef]
- Kuznetsov, E.V.; Solonin, N.A.; Urzhumtsey, D.O.; Schilling, R.G.; Tavitov, G.A. Strength of PLA Components Fabricated with Fused Deposition Technology. Polymers 2018, 10, 313. [Google Scholar] [CrossRef] [Green Version]
- Kreiger, M.; Pearce, M.; Tymrak, B.M. Mechanical properties of components fabricated with open-source 3D printers under realistic environmental conditions. Mater. Des. 2014, 58, 242–246. [Google Scholar]
- E3D-Online. Available online: https://e3d-online.dozuki.com/Document/SMgf2USbusbvTpKT/V6-NOZZLE-ALL-%28Edition-8.1%29.pdf (accessed on 14 October 2021).
- Kaniewski, B. Badania Wybranych Cech Konstrukcyjnych Elementów Wytworzonych w Technologii 3D. Master’s Thesis, Bydgoszcz University of Science and Technology, Bydgoszcz, Poland, 2021. Available online: https://apd.pbs.edu.pl/diplomas/23896/ (accessed on 1 October 2021).
- Naveed, N. Investigate the effects of process parameters on material properties and microstructural changes of 3D-printed specimens using fused deposition modeling (FDM). Mater. Technol. 2021, 36, 317–330. [Google Scholar] [CrossRef]
- Suteja, T.; Soesanti, A. Mechanical Properties of 3D Printed Polylactic Acid Product for Various Infill Design Parameters: A Review. J. Phys. Conf. Ser. 2020, 1569, 042010. [Google Scholar] [CrossRef]
- Solomon, J.; Sevvel, P.; Gunasekaran, J. A review on the various processing parameters in FDM. Mater. Today Proc. 2021, 37, 509–514. [Google Scholar] [CrossRef]
- Łyżwa, A. Sposoby zwiększania wydajności druku 3D w metodzie FFF. Mechanik 2016, 89, 1900–1901. [Google Scholar] [CrossRef] [Green Version]
- OlsonRuby. Available online: https://olssonruby.com/ (accessed on 14 October 2021).
- Yang, L.; Li, S.; Li, Y.; Yang, M.; Yuan, Q. Experimental Investigations for Optimizing the Extrusion Parameters on FDM PLA Printed Parts. J. Mater. Eng. Perform. 2019, 28, 169–182. [Google Scholar] [CrossRef]
- Bączkowski, M.; Marciniak, D.; Bieliński, M. Influence of FFF process parameters and macrostructure homogeneity on PLA impact strength. Polimery 2021, 66, 480–483. [Google Scholar] [CrossRef]
- Kuznetsov, V.; Tavitov, A.; Urzhumtsev, O.; Korotkov, A.; Solodov, S.; Solonin, A. Desktop Fabrication of Strong Poly (Lactic Acid) Parts: FFF Process Parameters Tuning. Materials 2019, 12, 2071. [Google Scholar] [CrossRef] [Green Version]
- Sukindar, N.A. Analyzing the effect of nozzle diameter in fused deposition modeling for extruding polylactic acid using open source 3d printing. J. Teknol. 2016, 78, 7–15. [Google Scholar] [CrossRef] [Green Version]
- Xinhua, L.; Shengpeng, L.; Zhou, L.; Xianhua, Z.; Xiaohu, C.; Zhongbin, W. An investigation on distortion of PLA thin-plate part in the FDM process. Int. J. Adv. Manuf. Technol. 2015, 79, 1117–1126. [Google Scholar] [CrossRef]
- Zemcik, O.; Sedlak, J. Application of Linear Optimization on Parameters of 3D FDM Print. Tech. Gaz. 2019, 26, 1164–1170. [Google Scholar]
- Prusa3D. Available online: https://help.prusa3d.com/pl/article/warstwy-i-obrysy_1748/ (accessed on 17 November 2021).
- Samy, A.; Golbang, A.; Harkin-Jones, E.; Archer, E.; Tormey, D.; McIlhagger, A. Finite element analysis of residual stress and warpage in a 3D printed semi-crystalline polymer: Effect of ambient temperature and nozzle speed. J. Manuf. Processes 2021, 70, 389–399. [Google Scholar] [CrossRef]
- Lim, R.; Auras, M.; Rubino, L. Processing Technologies for Poly(Lactic Acid); Progress in Polymer Science; Elsevier: Amsterdam, The Netherlands, 2008. [Google Scholar]
- Pearce, M.J.; Wittbrodt, T.B. The Effects of PLA Color on Material Properties of 3-D Printed Components. Addit. Manuf. 2015, 8, 110–111. [Google Scholar]
- Othman, F.; Abbas, T.; Ali, H. Influence of Process Parameters on Mechanical Properties and Printing Time of FDM PLA Printed Parts Using Design of Experiment. J. Eng. Res. Appl. 2018, 8, 65–69. [Google Scholar]
- Samykano, M.; Selvamani, S.; Kadirgama, K.; Ngui, W.; Kanagaraj, G.; Sudhakar, K. Mechanical property of FDM printed ABS: Influence of printing parameters. Int. J. Adv. Manuf. Technol. 2019, 102, 2779–2796. [Google Scholar] [CrossRef]
- Panes, A.; Claver, J.; Camacho, A. The Influence of Manufacturing Parameters on the Mechanical Behaviour of PLA and ABS Pieces Manufactured by FDM: A Comparative Analysis. Materials 2018, 11, 1333. [Google Scholar] [CrossRef] [PubMed] [Green Version]
- Triyono, J.; Sukanto, H.; Saputra, R.; Smaradhana, D. The effect of nozzle hole diameter of 3D printing on porosity and tensile strength parts using polylactic acid material. Open Eng. 2020, 10, 762–768. [Google Scholar] [CrossRef]
- Schiavone, N.; Verney, V.; Askanian, H. Effect of 3D Printing Temperature Profile on Polymer Materials Behavior. 3D Print. Addit. Manuf. 2020, 7. [Google Scholar] [CrossRef]
- Yao, T.; Deng, Z.; Zhang, K.; Li, S. A method to predict the ultimate tensile strength of 3D printing polylactic acid (PLA) materials with different printing orientations. Compos. Part B Eng. 2019, 163, 393–402. [Google Scholar] [CrossRef]
- Hanon, M.M.; Marczis, R.; Zsidai, L. Influence of the 3D Printing Process Settings on Tensile Strength of PLA and HT-PLA. Period. Polytech. Mech. Eng. 2021, 65, 38–46. [Google Scholar] [CrossRef]


| Parameter | Value |
|---|---|
| plasticizing zones temperature (°C) | 230/230/200/160/40 |
| injection rate (cm3/s) | 100 |
| mold temperature (°C) | 30 |
| shot volume (cm3) | 76 |
| packing pressure (MPa) | 50 |
| packing time (s) | 34 |
| cooling time (s) | 30 |
| counter pressure (MPa) | 5 |
| Printing Parameter | Value |
|---|---|
| nozzle temperature (°C) | 230 |
| platform temperature (°C) | 70 |
| printing speed (mm/s) | 20 |
| layer thickness (mm) | 0.2 |
| path angle (°) | −45/+45 |
| infill (%) | 100 |
| fan speed (%) | 50 |
| Material Parameter | Value |
|---|---|
| Young’s Modulus (MPa) | 2702 ± 38 |
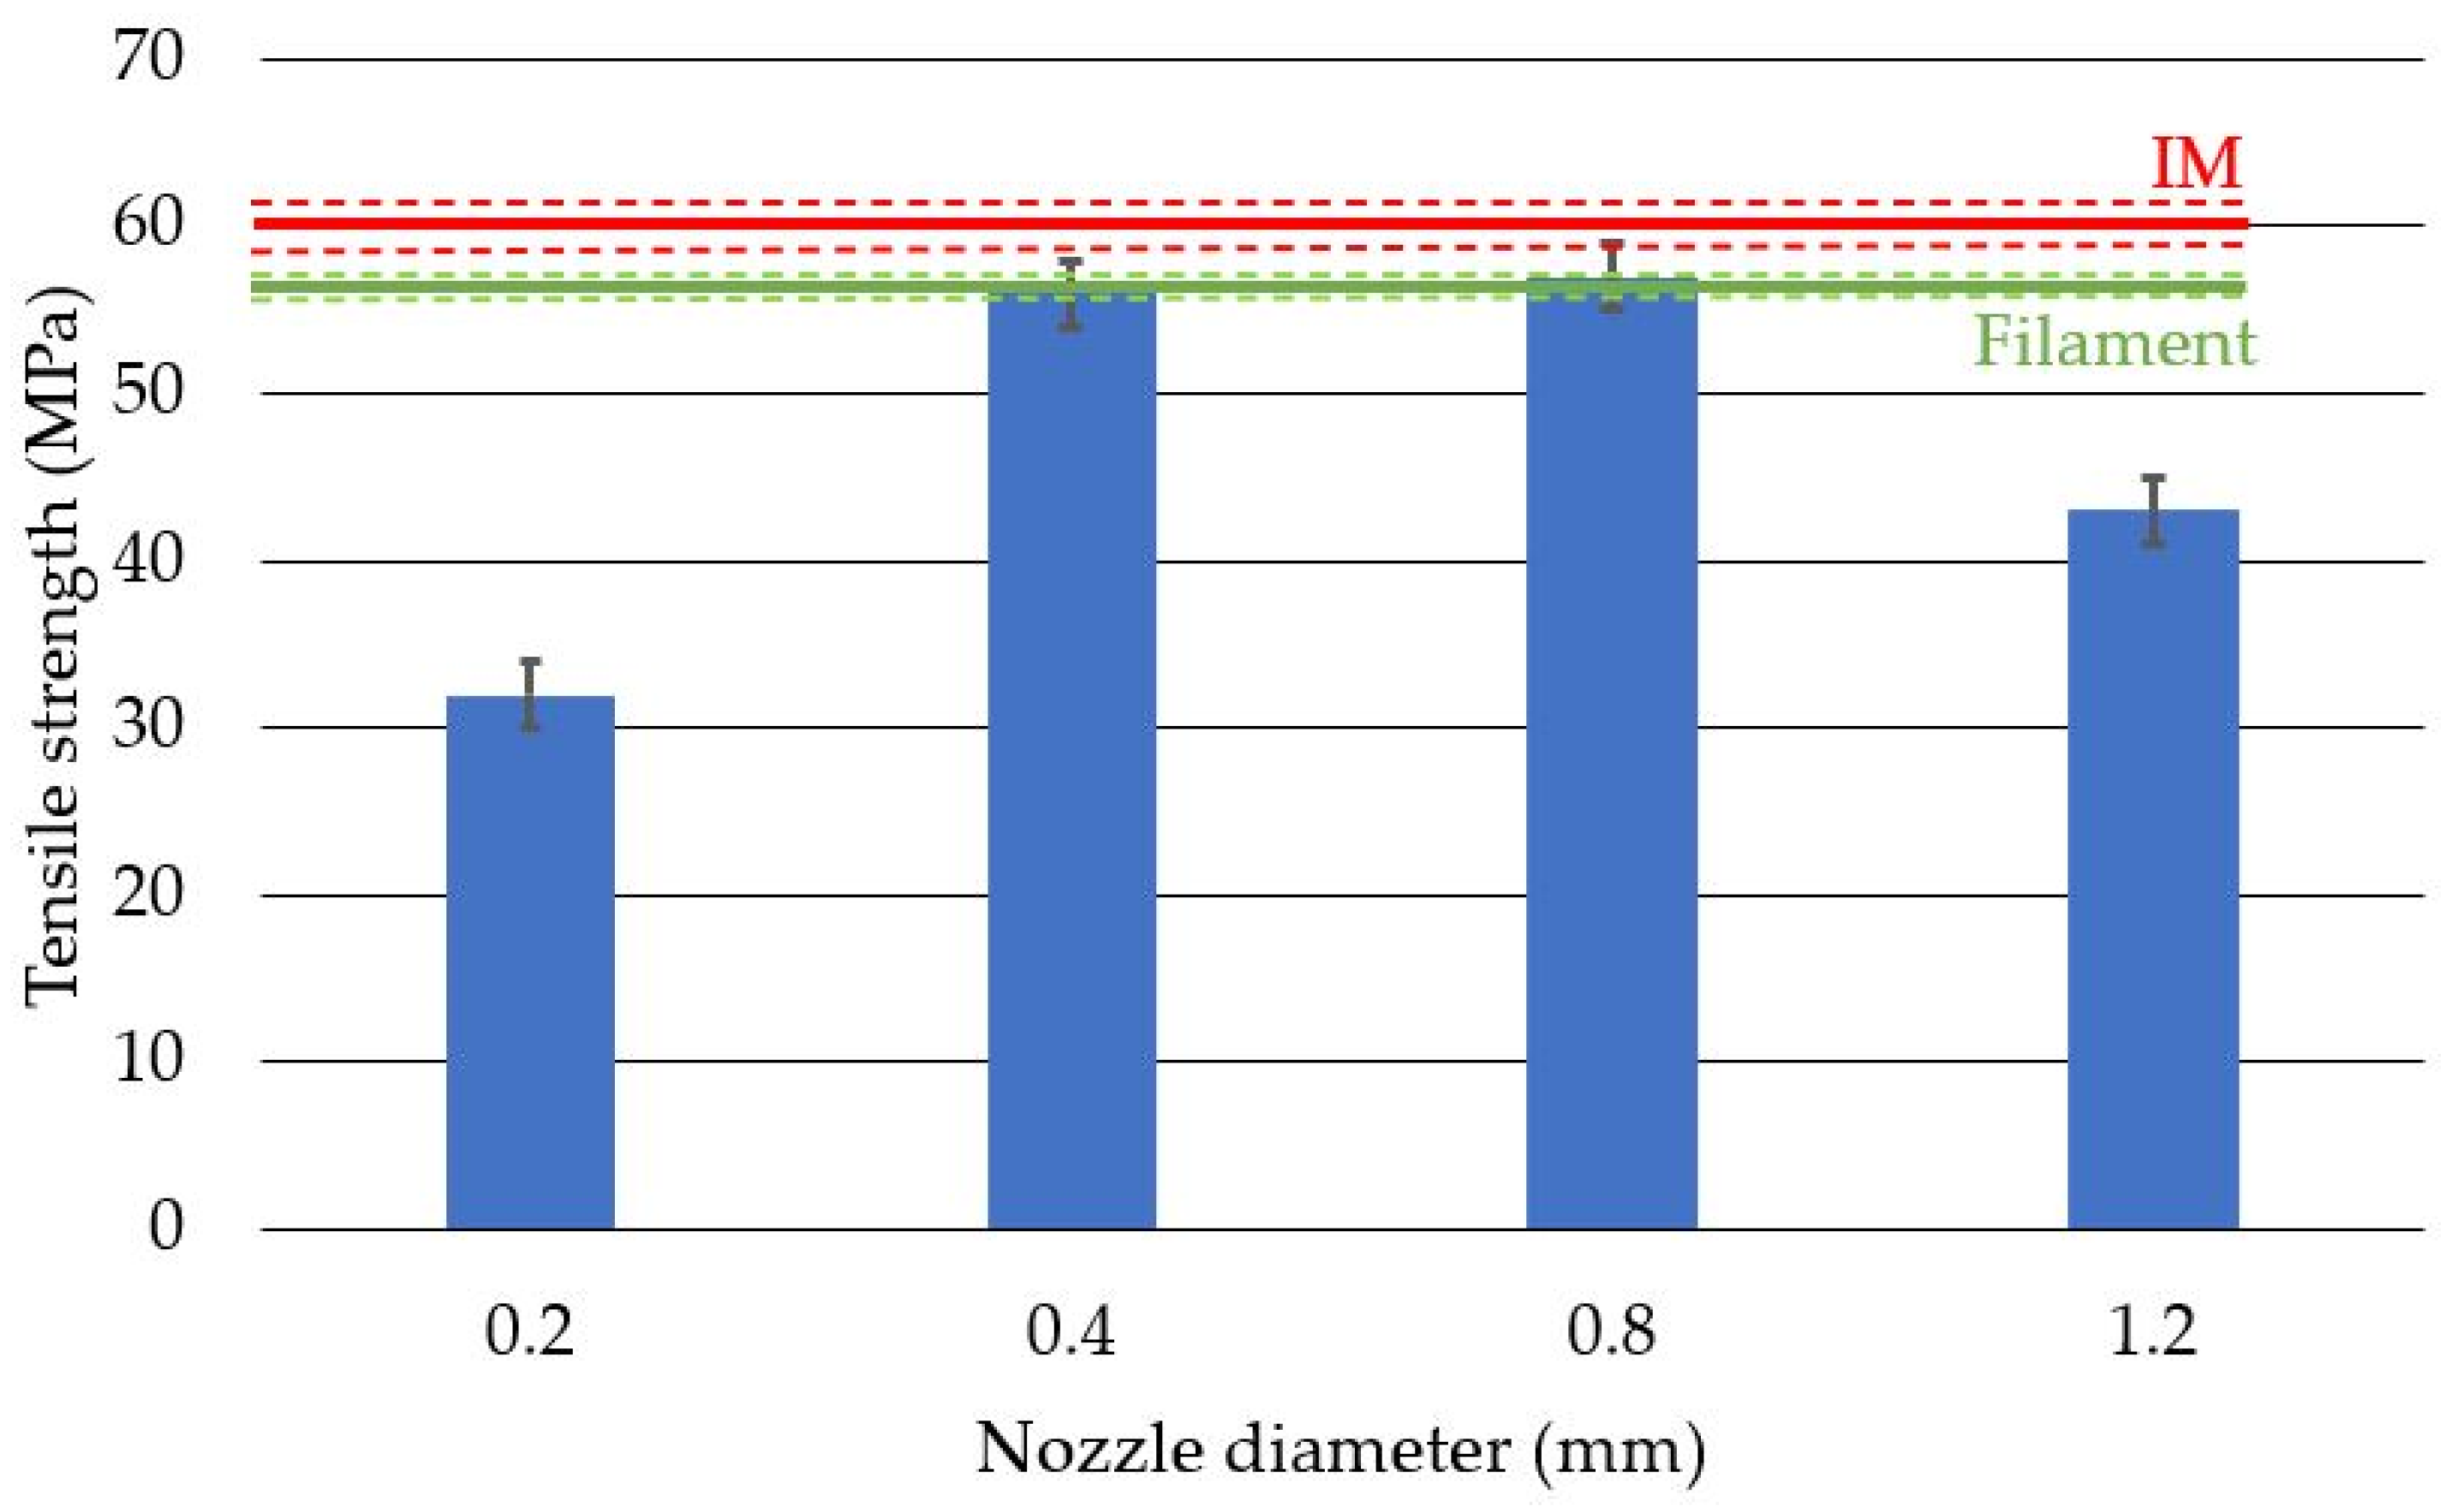
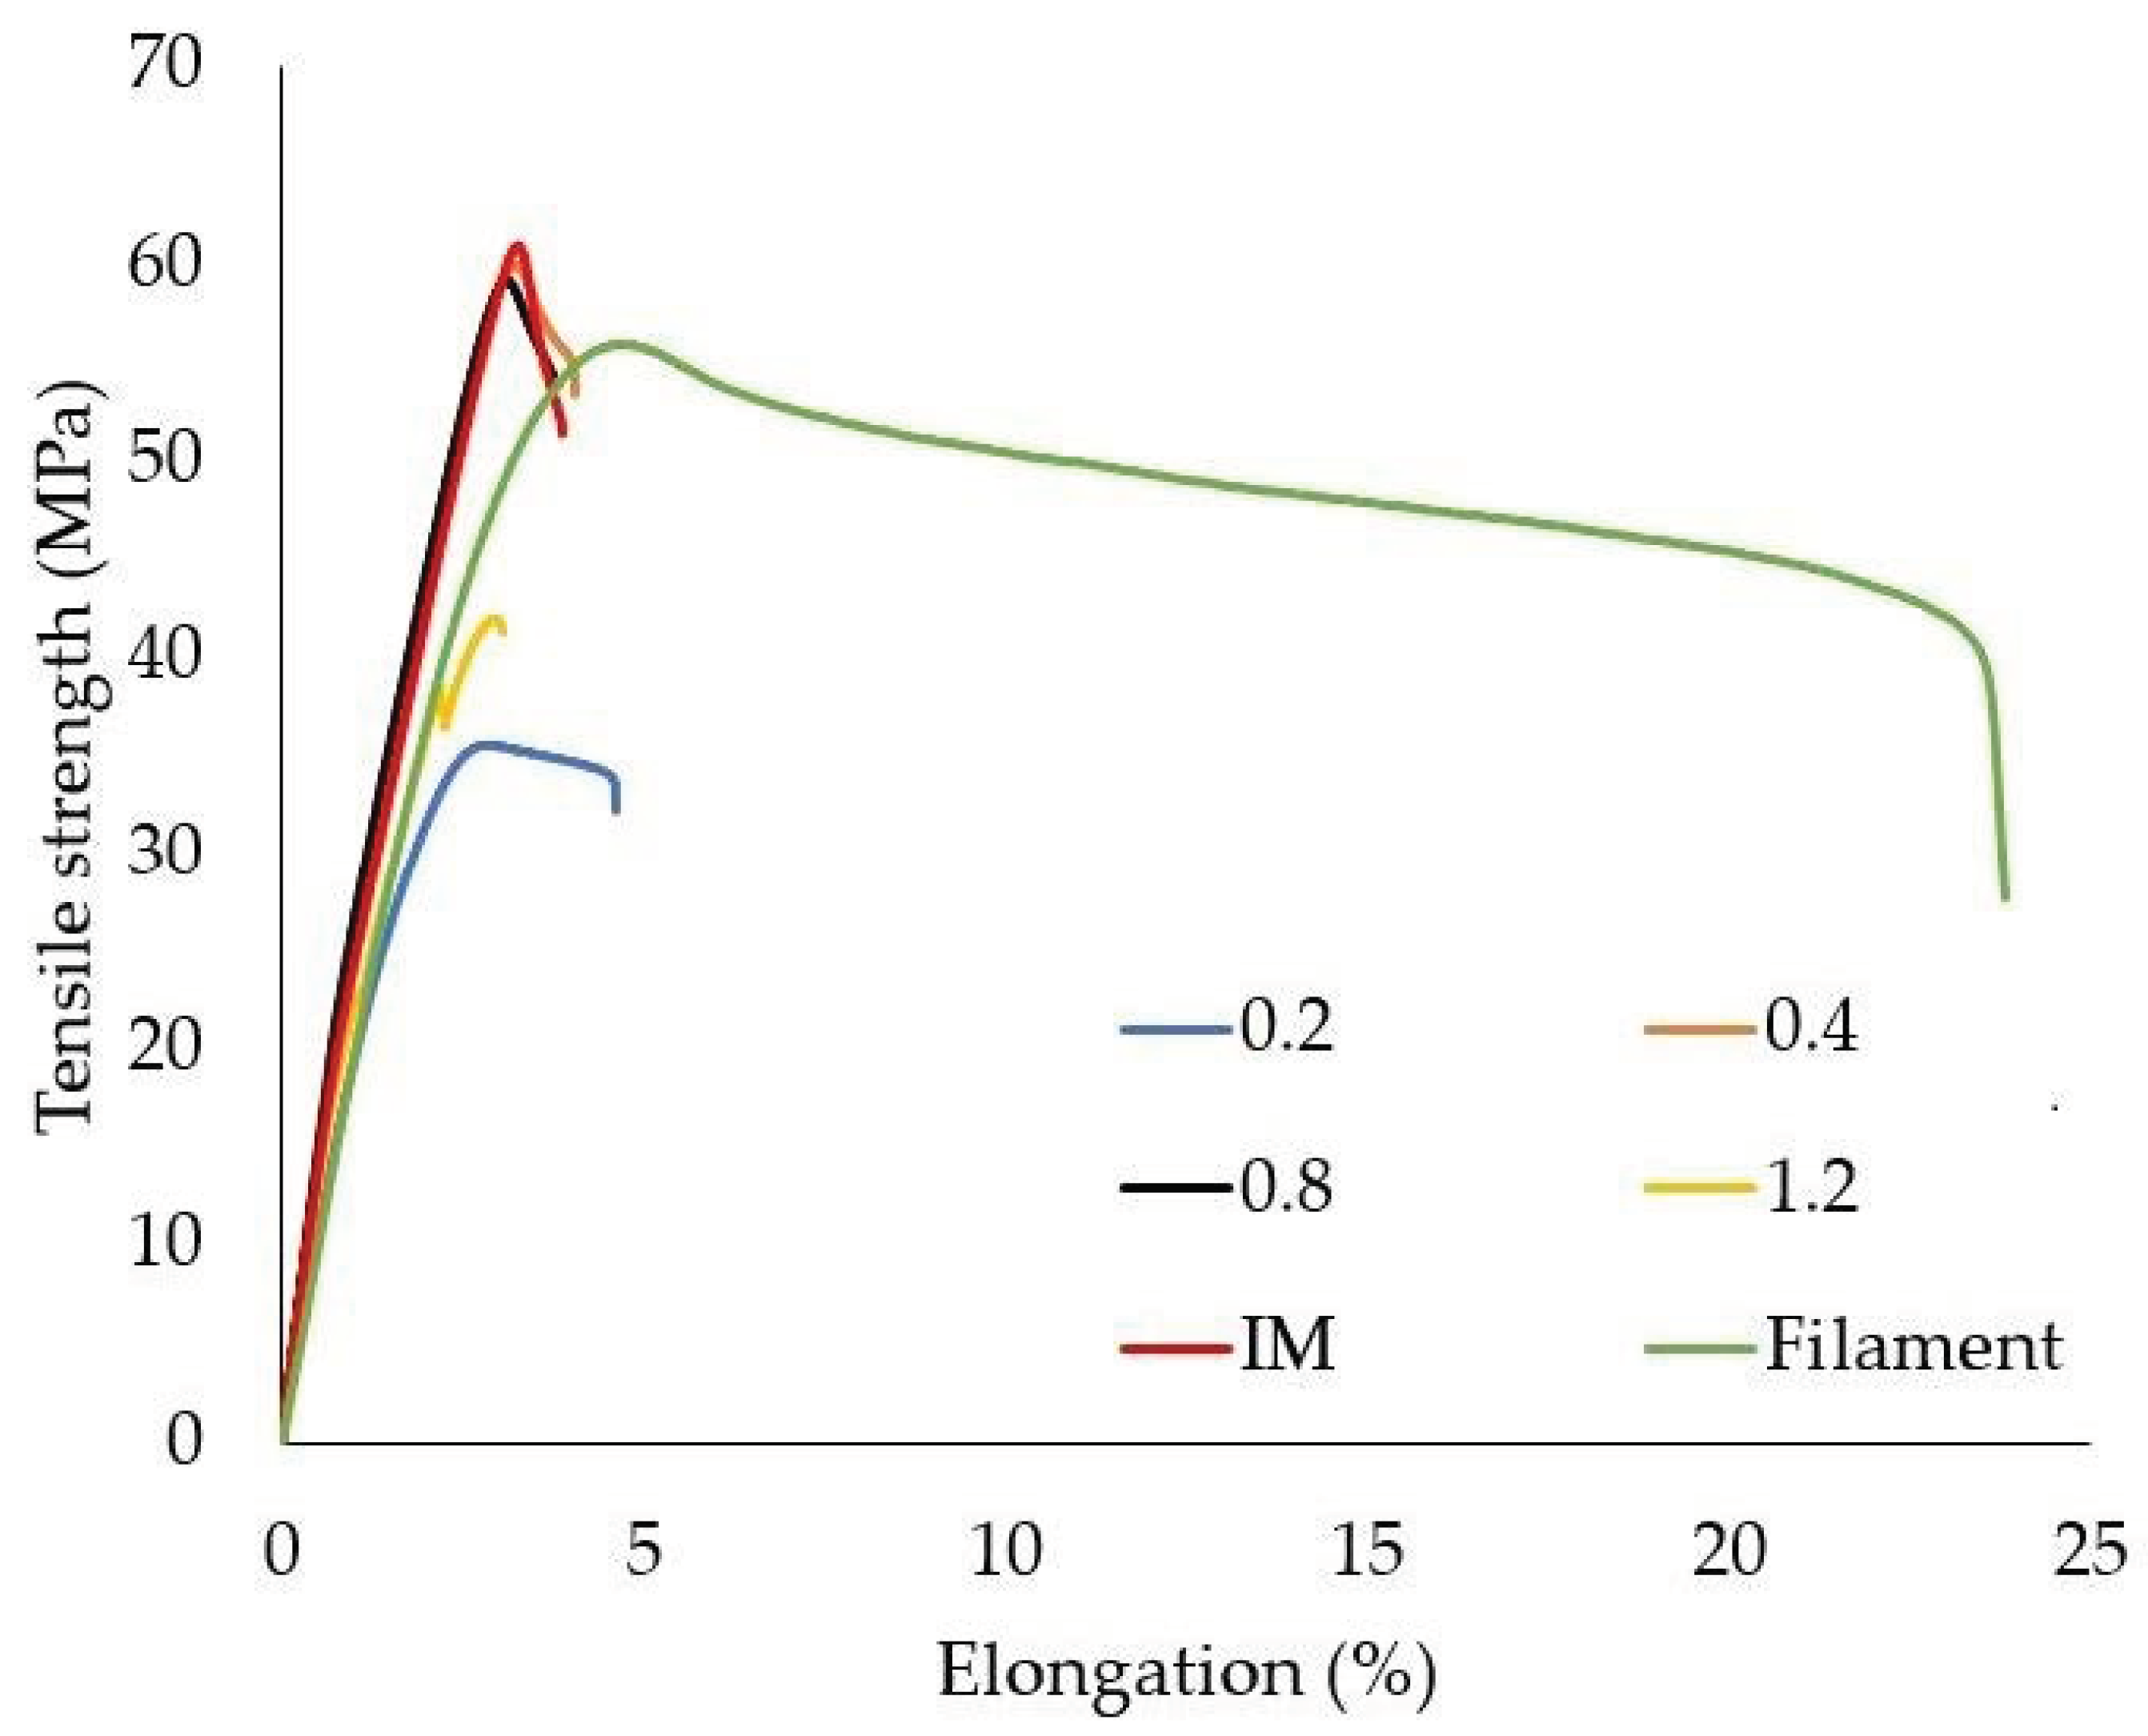
| Tensile strength (MPa) | 60.0 ± 1.1 |
| Elongation at break (%) | 3.20 ± 0.03 |
| Impact strength (kJ/m2) | 11.24 ± 1.86 |
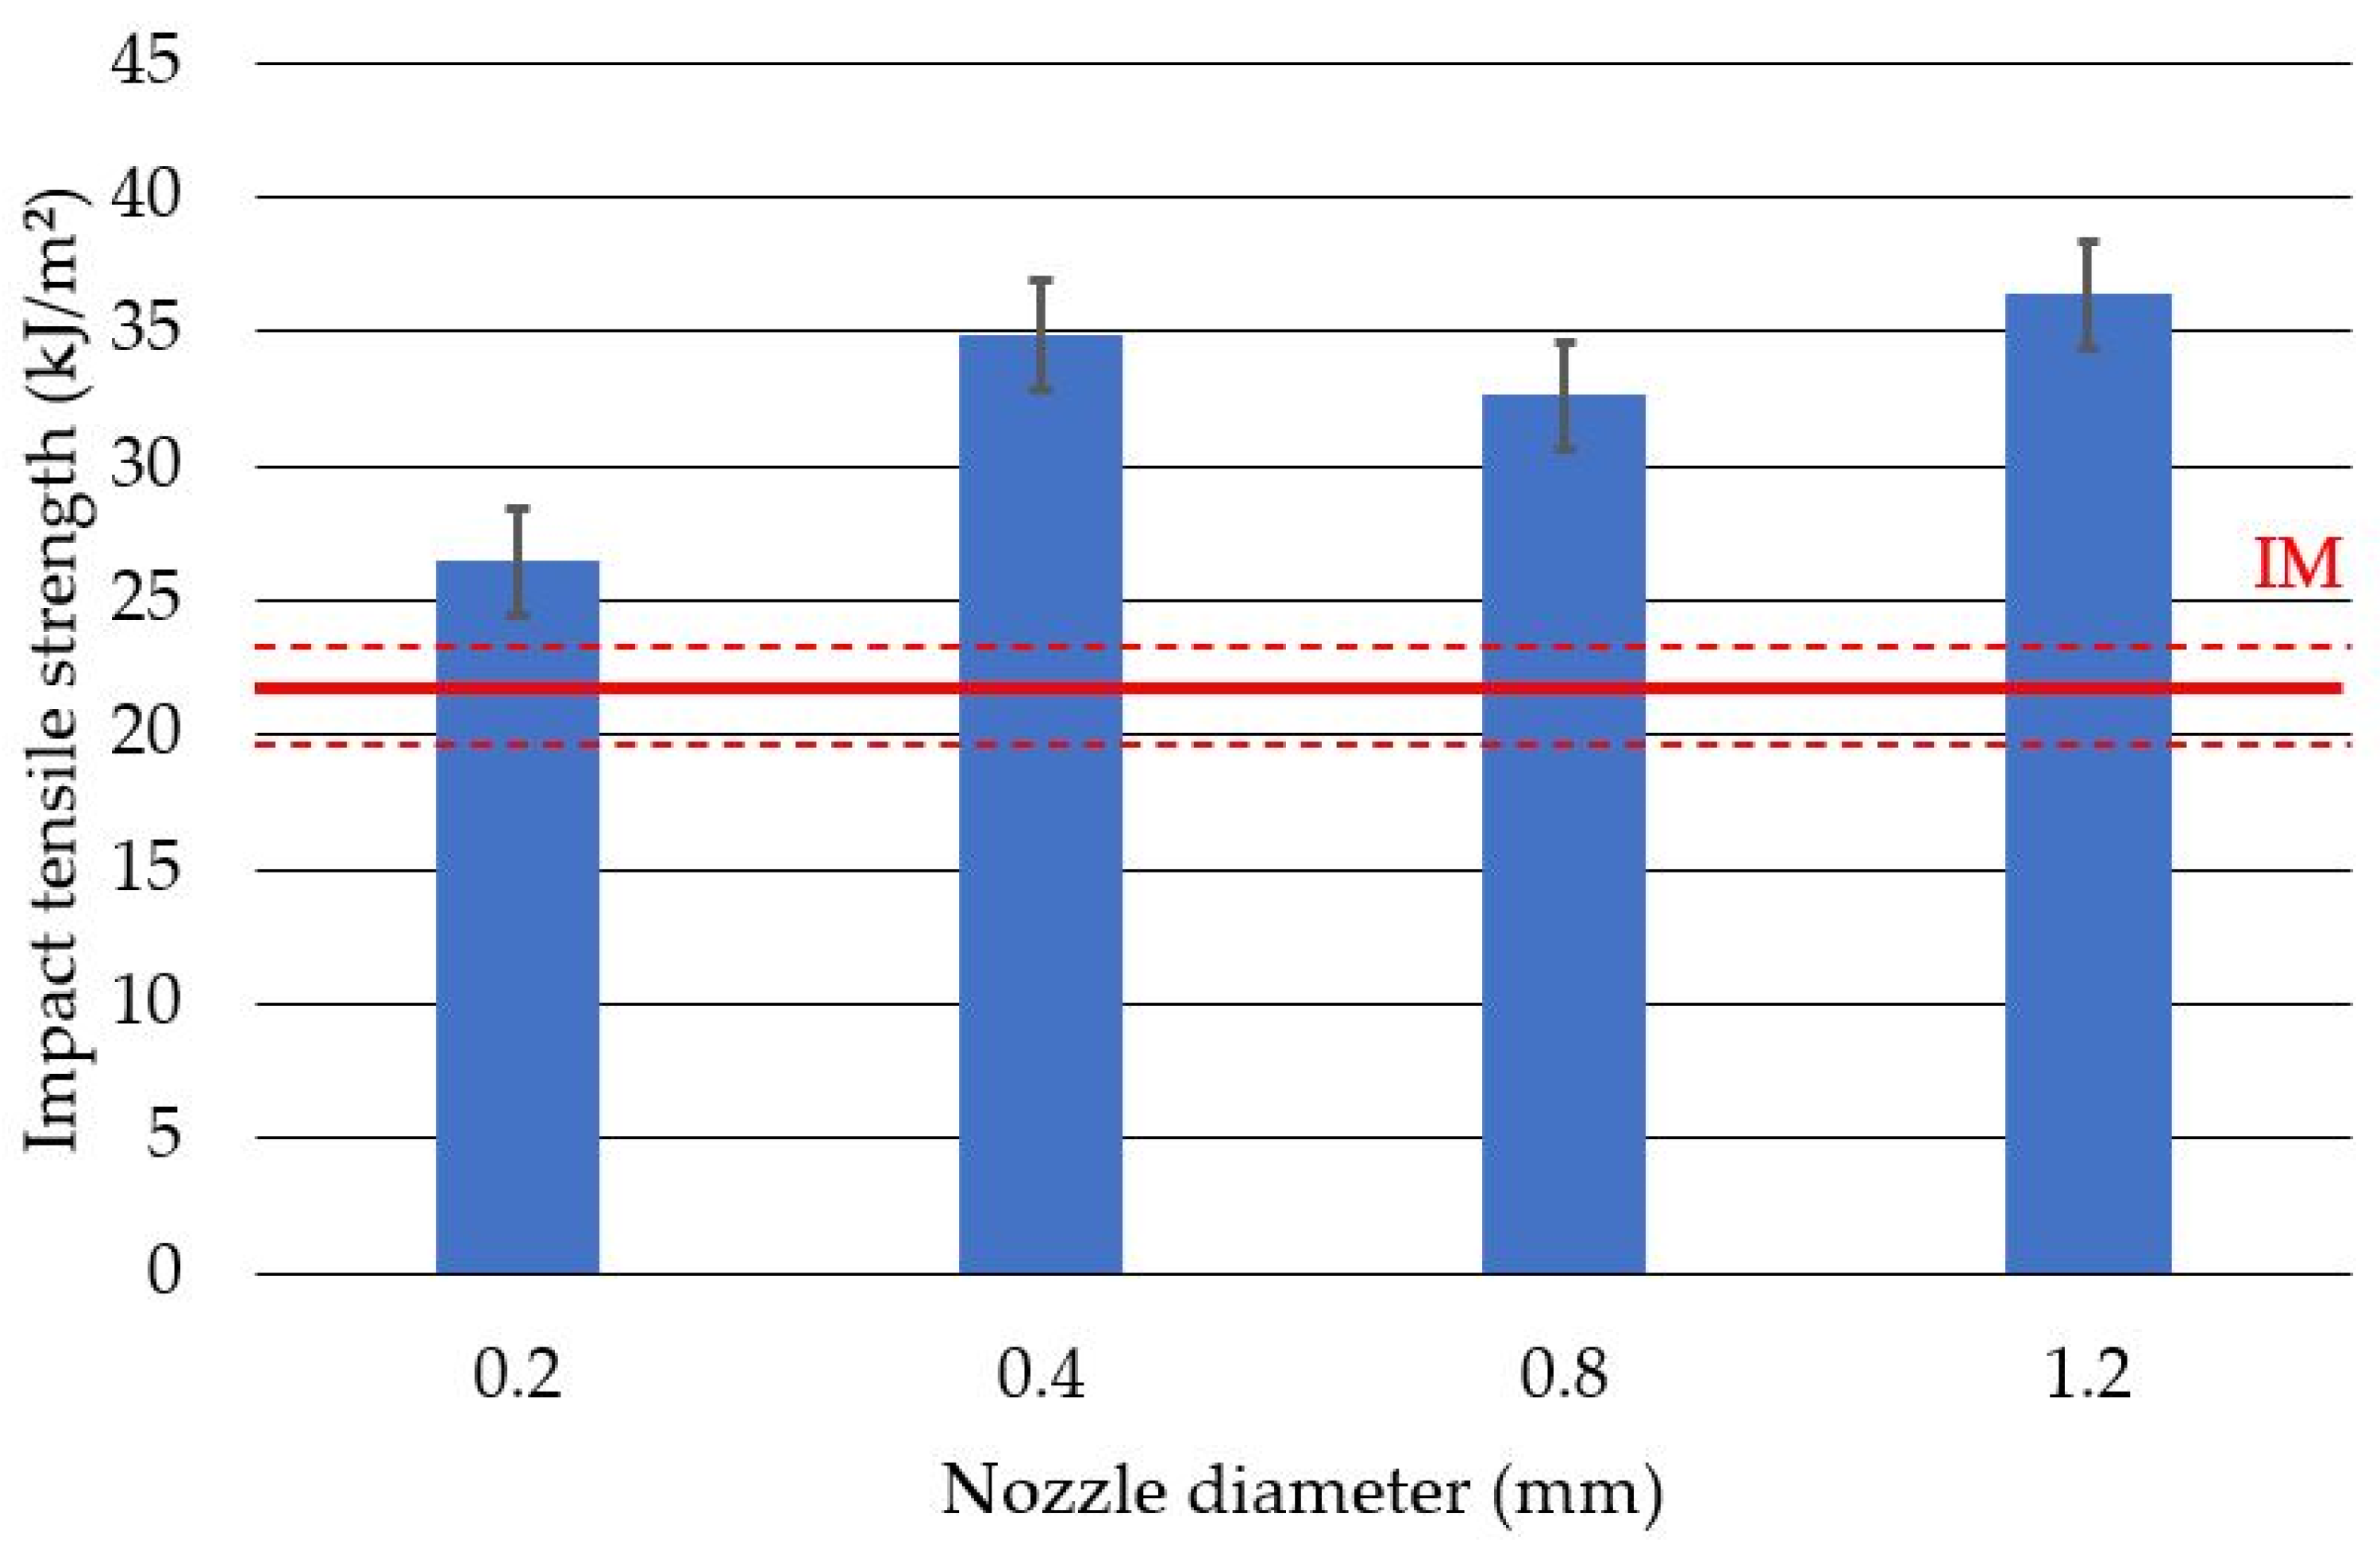
| Impact tensile strength (kJ/m2) | 21.5 ± 1.8 |
| Apparent density (g/cm3) | 1.24 ± 0.03 |
| Specific modulus ((N·m)/kg) | 2.18 × 10⁶ ± 0.03 × 10⁶ |
| Specific tensile strength ((N·m)/kg) | 4.88 × 10⁴ ± 0.07 × 10⁴ |
| Nozzle Diameter (mm) | Average Layer Thickness (mm) | Average Path Width (mm) |
|---|---|---|
| 0.2 | 0.147 ± 0.008 | 0.218 ± 0.009 |
| 0.4 | 0.228 ± 0.009 | 0.347 ± 0.003 |
| 0.8 | 0.218 ± 0.019 | 0.720 ± 0.031 |
| 1.2 | 0.210 ± 0.007 | 1.063 ± 0.019 |
Publisher’s Note: MDPI stays neutral with regard to jurisdictional claims in published maps and institutional affiliations. |
© 2022 by the authors. Licensee MDPI, Basel, Switzerland. This article is an open access article distributed under the terms and conditions of the Creative Commons Attribution (CC BY) license (https://creativecommons.org/licenses/by/4.0/).
Share and Cite
Czyżewski, P.; Marciniak, D.; Nowinka, B.; Borowiak, M.; Bieliński, M. Influence of Extruder’s Nozzle Diameter on the Improvement of Functional Properties of 3D-Printed PLA Products. Polymers 2022, 14, 356. https://doi.org/10.3390/polym14020356
Czyżewski P, Marciniak D, Nowinka B, Borowiak M, Bieliński M. Influence of Extruder’s Nozzle Diameter on the Improvement of Functional Properties of 3D-Printed PLA Products. Polymers. 2022; 14(2):356. https://doi.org/10.3390/polym14020356
Chicago/Turabian StyleCzyżewski, Piotr, Dawid Marciniak, Bartosz Nowinka, Michał Borowiak, and Marek Bieliński. 2022. "Influence of Extruder’s Nozzle Diameter on the Improvement of Functional Properties of 3D-Printed PLA Products" Polymers 14, no. 2: 356. https://doi.org/10.3390/polym14020356
APA StyleCzyżewski, P., Marciniak, D., Nowinka, B., Borowiak, M., & Bieliński, M. (2022). Influence of Extruder’s Nozzle Diameter on the Improvement of Functional Properties of 3D-Printed PLA Products. Polymers, 14(2), 356. https://doi.org/10.3390/polym14020356