

On Laminated Object Manufactured FDM-Printed ABS/TPU Multimaterial Specimens: An Insight into Mechanical and Morphological Characteristics


Abstract
1. Introduction
2. Problem Statement and Objective of the Research
3. Materials and Methods
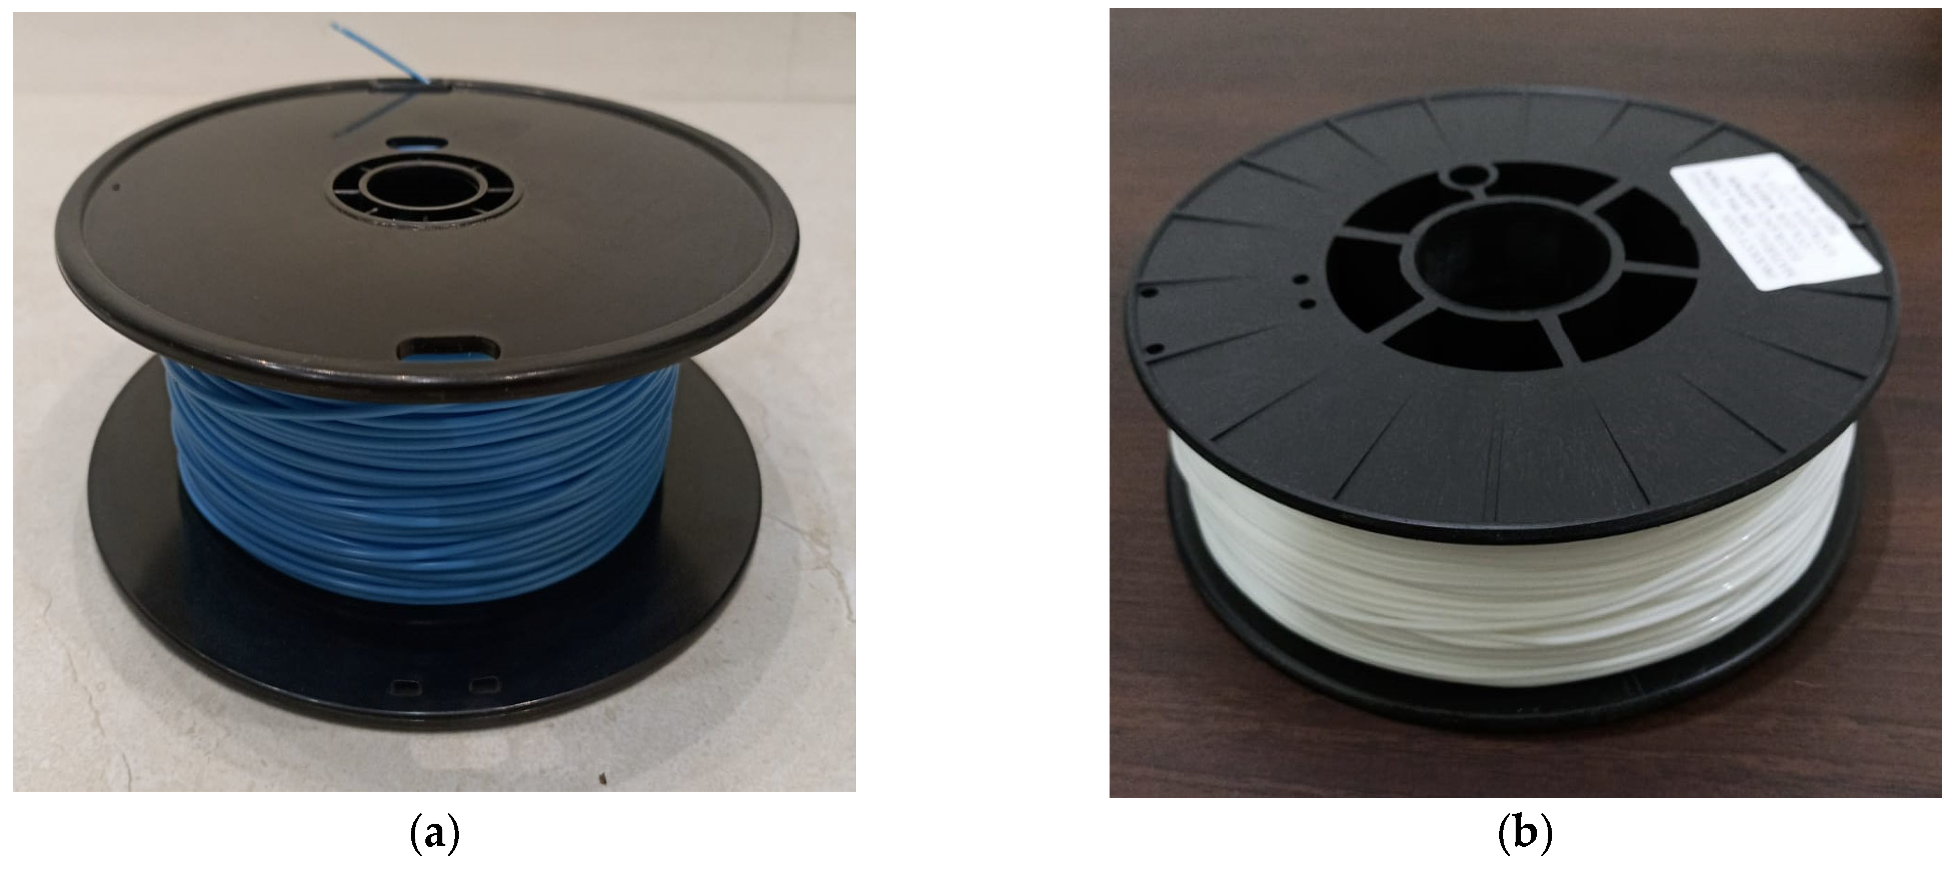
3.1. Materials
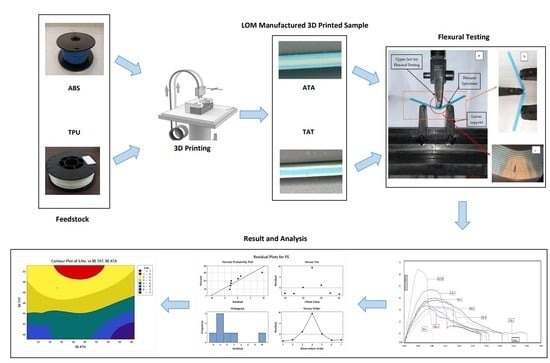
3.2. 3D Printing
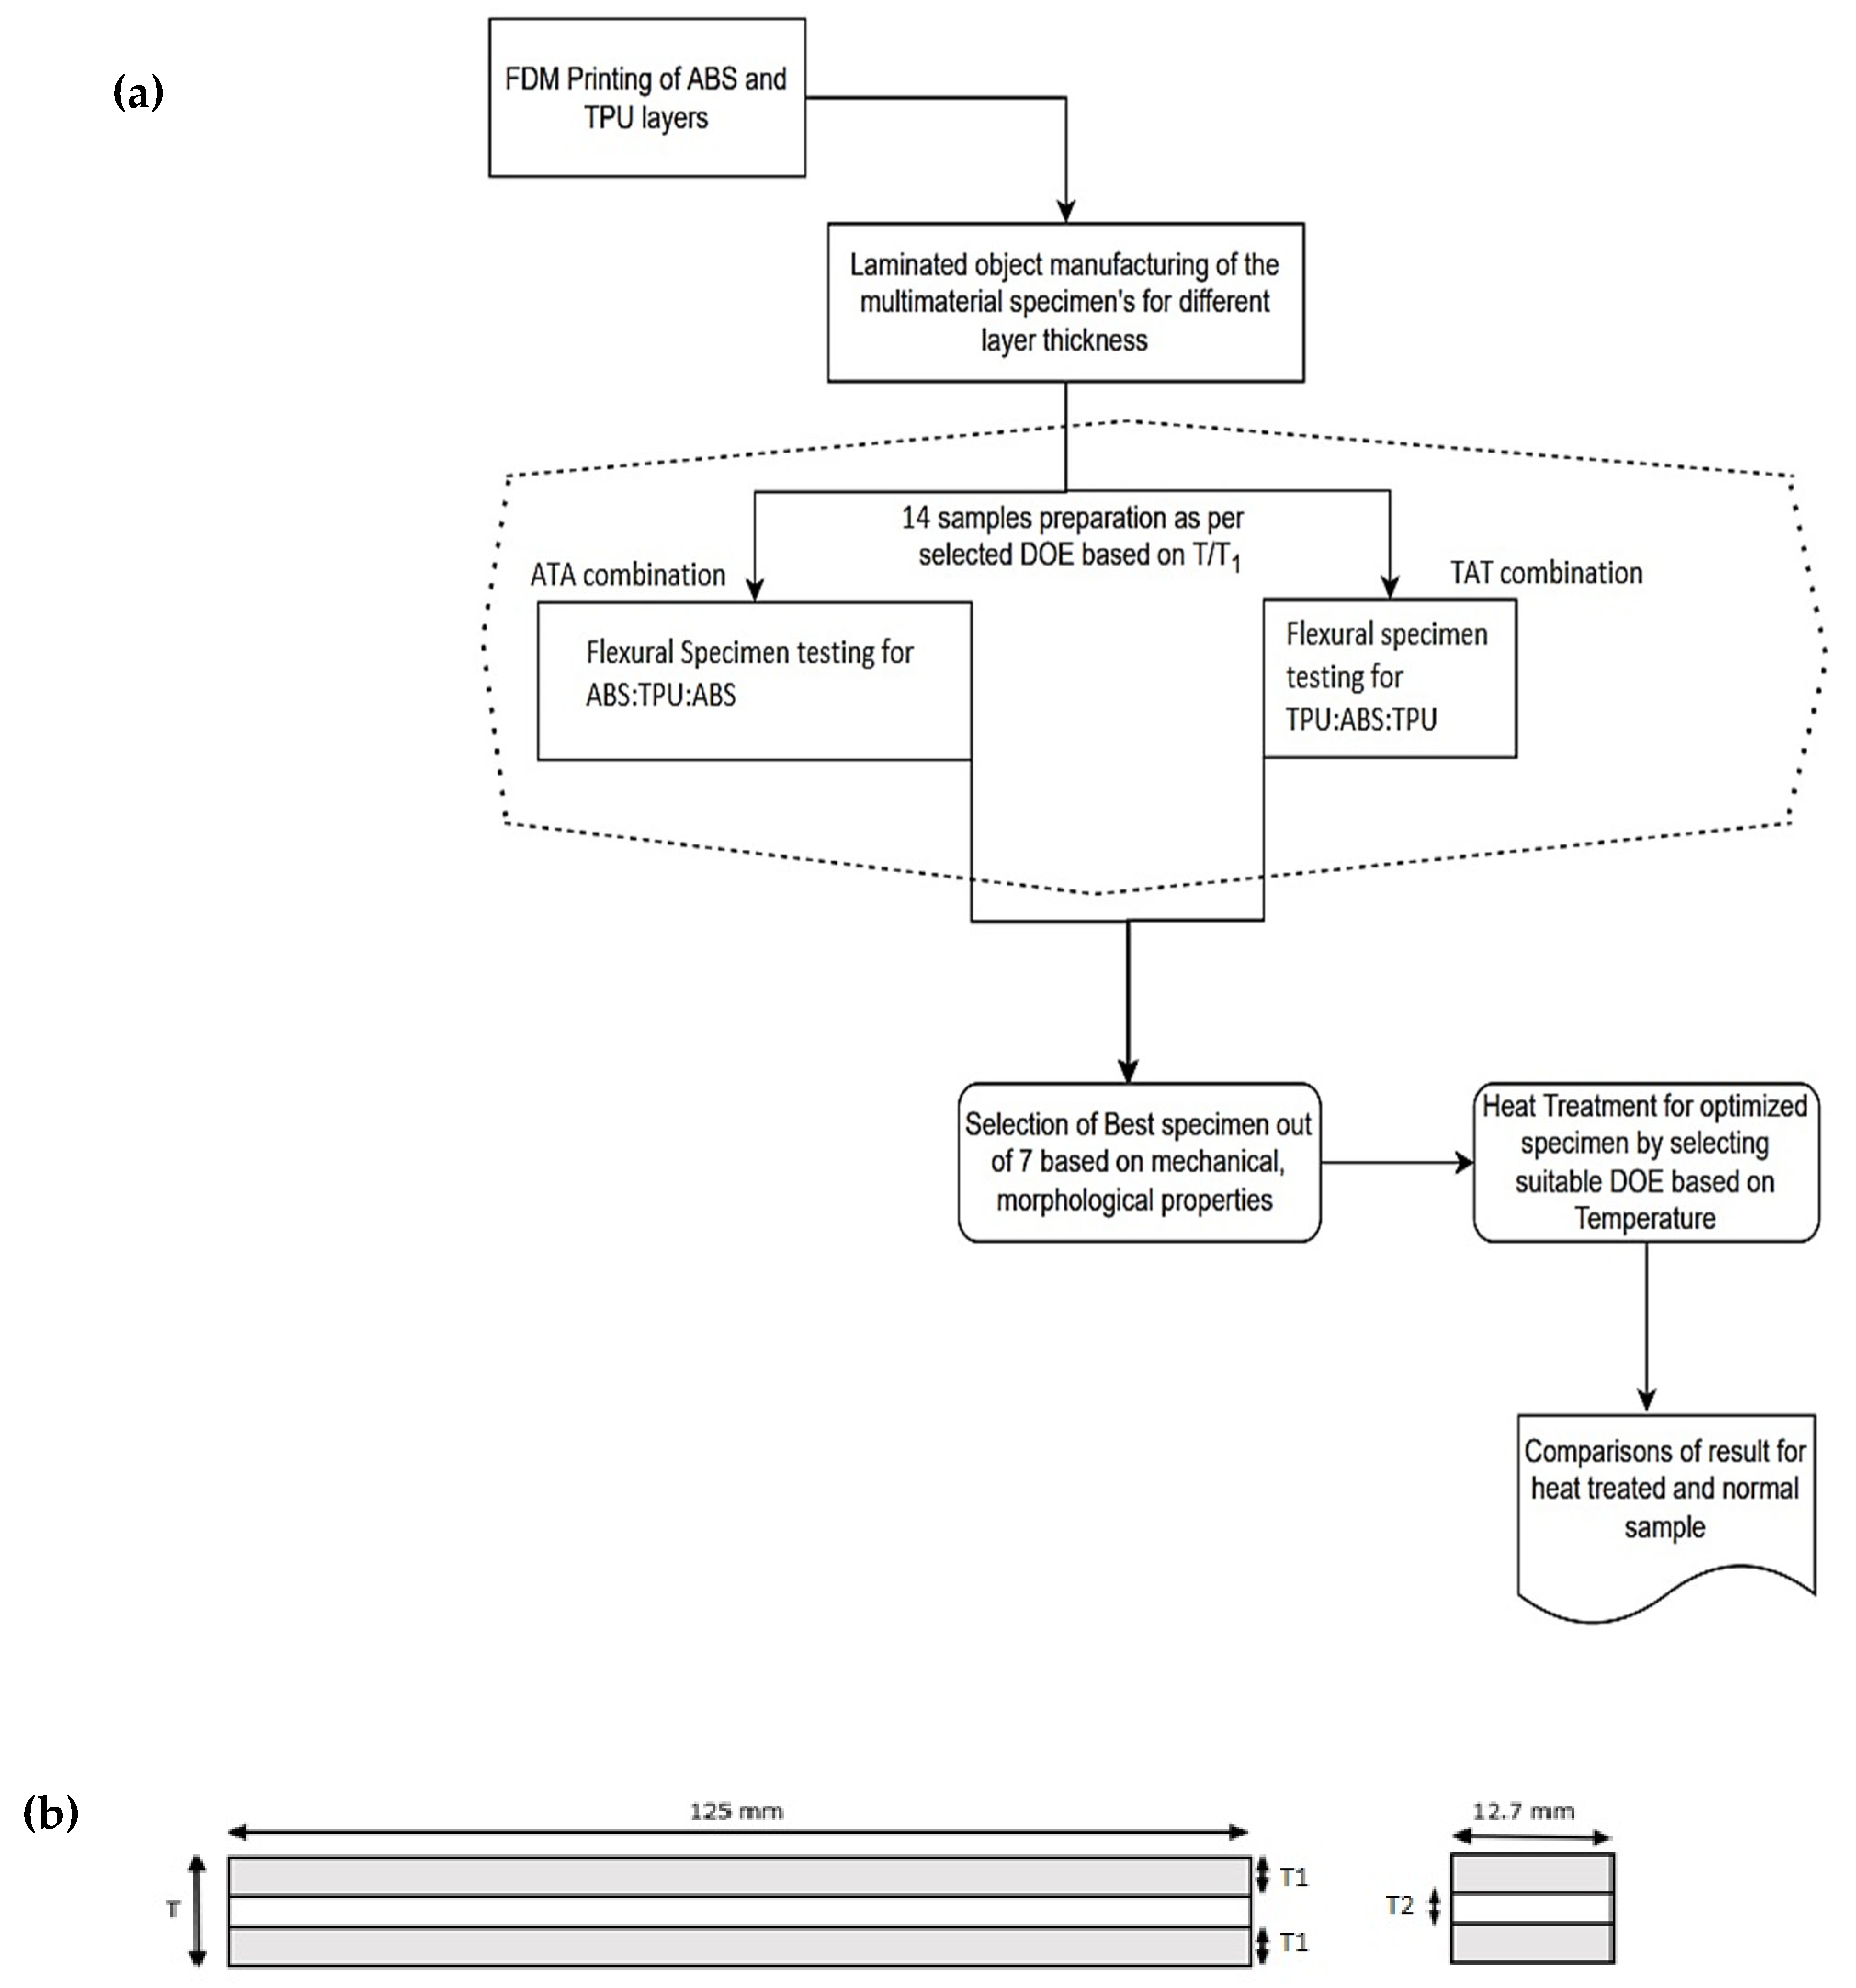
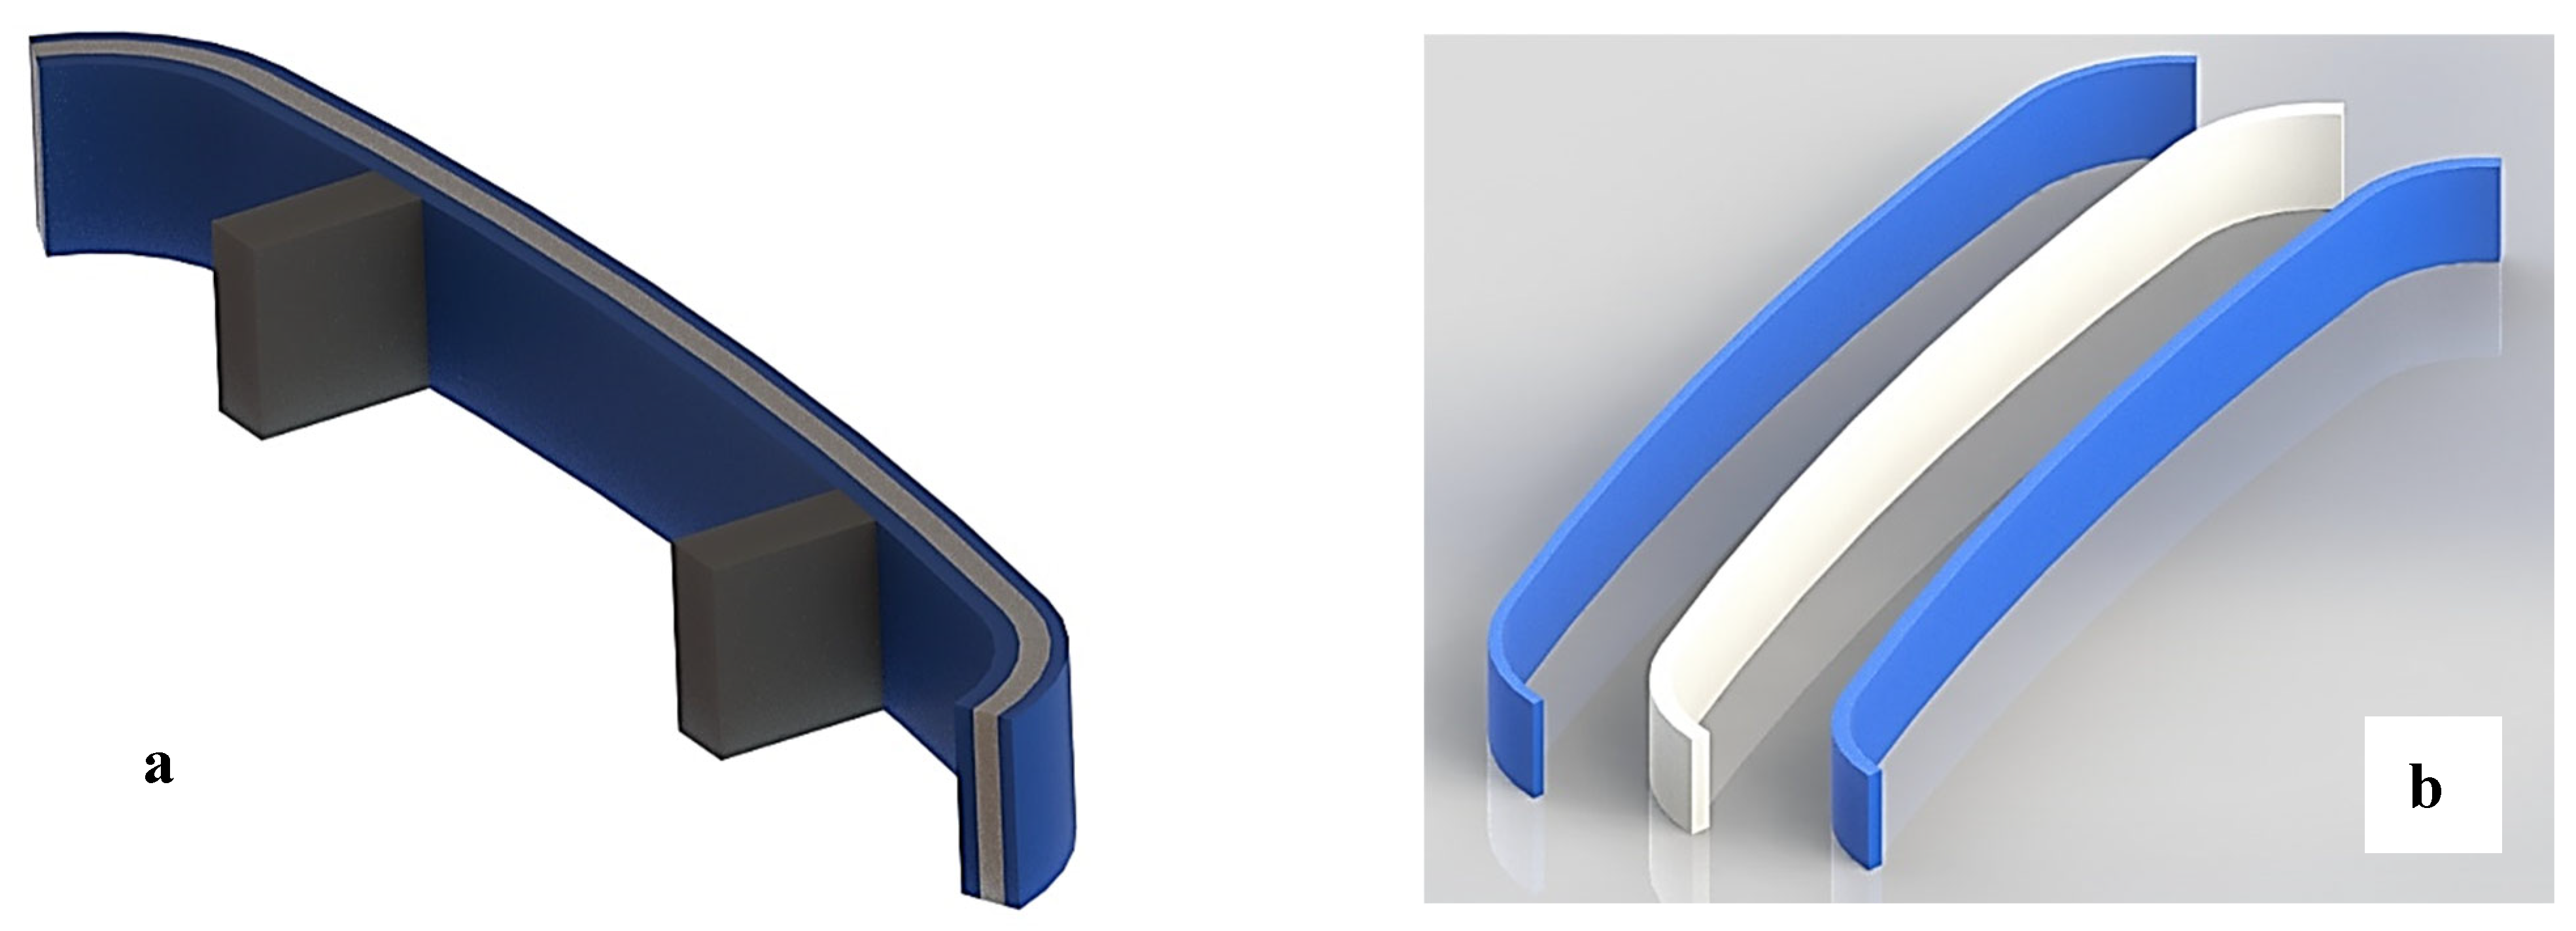
3.3. Selection for the Sample Design or Sandwiched Structure
3.4. Standard Testing and Details
4. Results and Discussion
4.1. Flexural Testing Results for ATA Specimens
4.2. Flexural Testing Results for TAT Samples
4.3. Starin Energy Absorbed per Unit Volume/Modulus of Toughness for ATA Samples
5. Morphological Properties
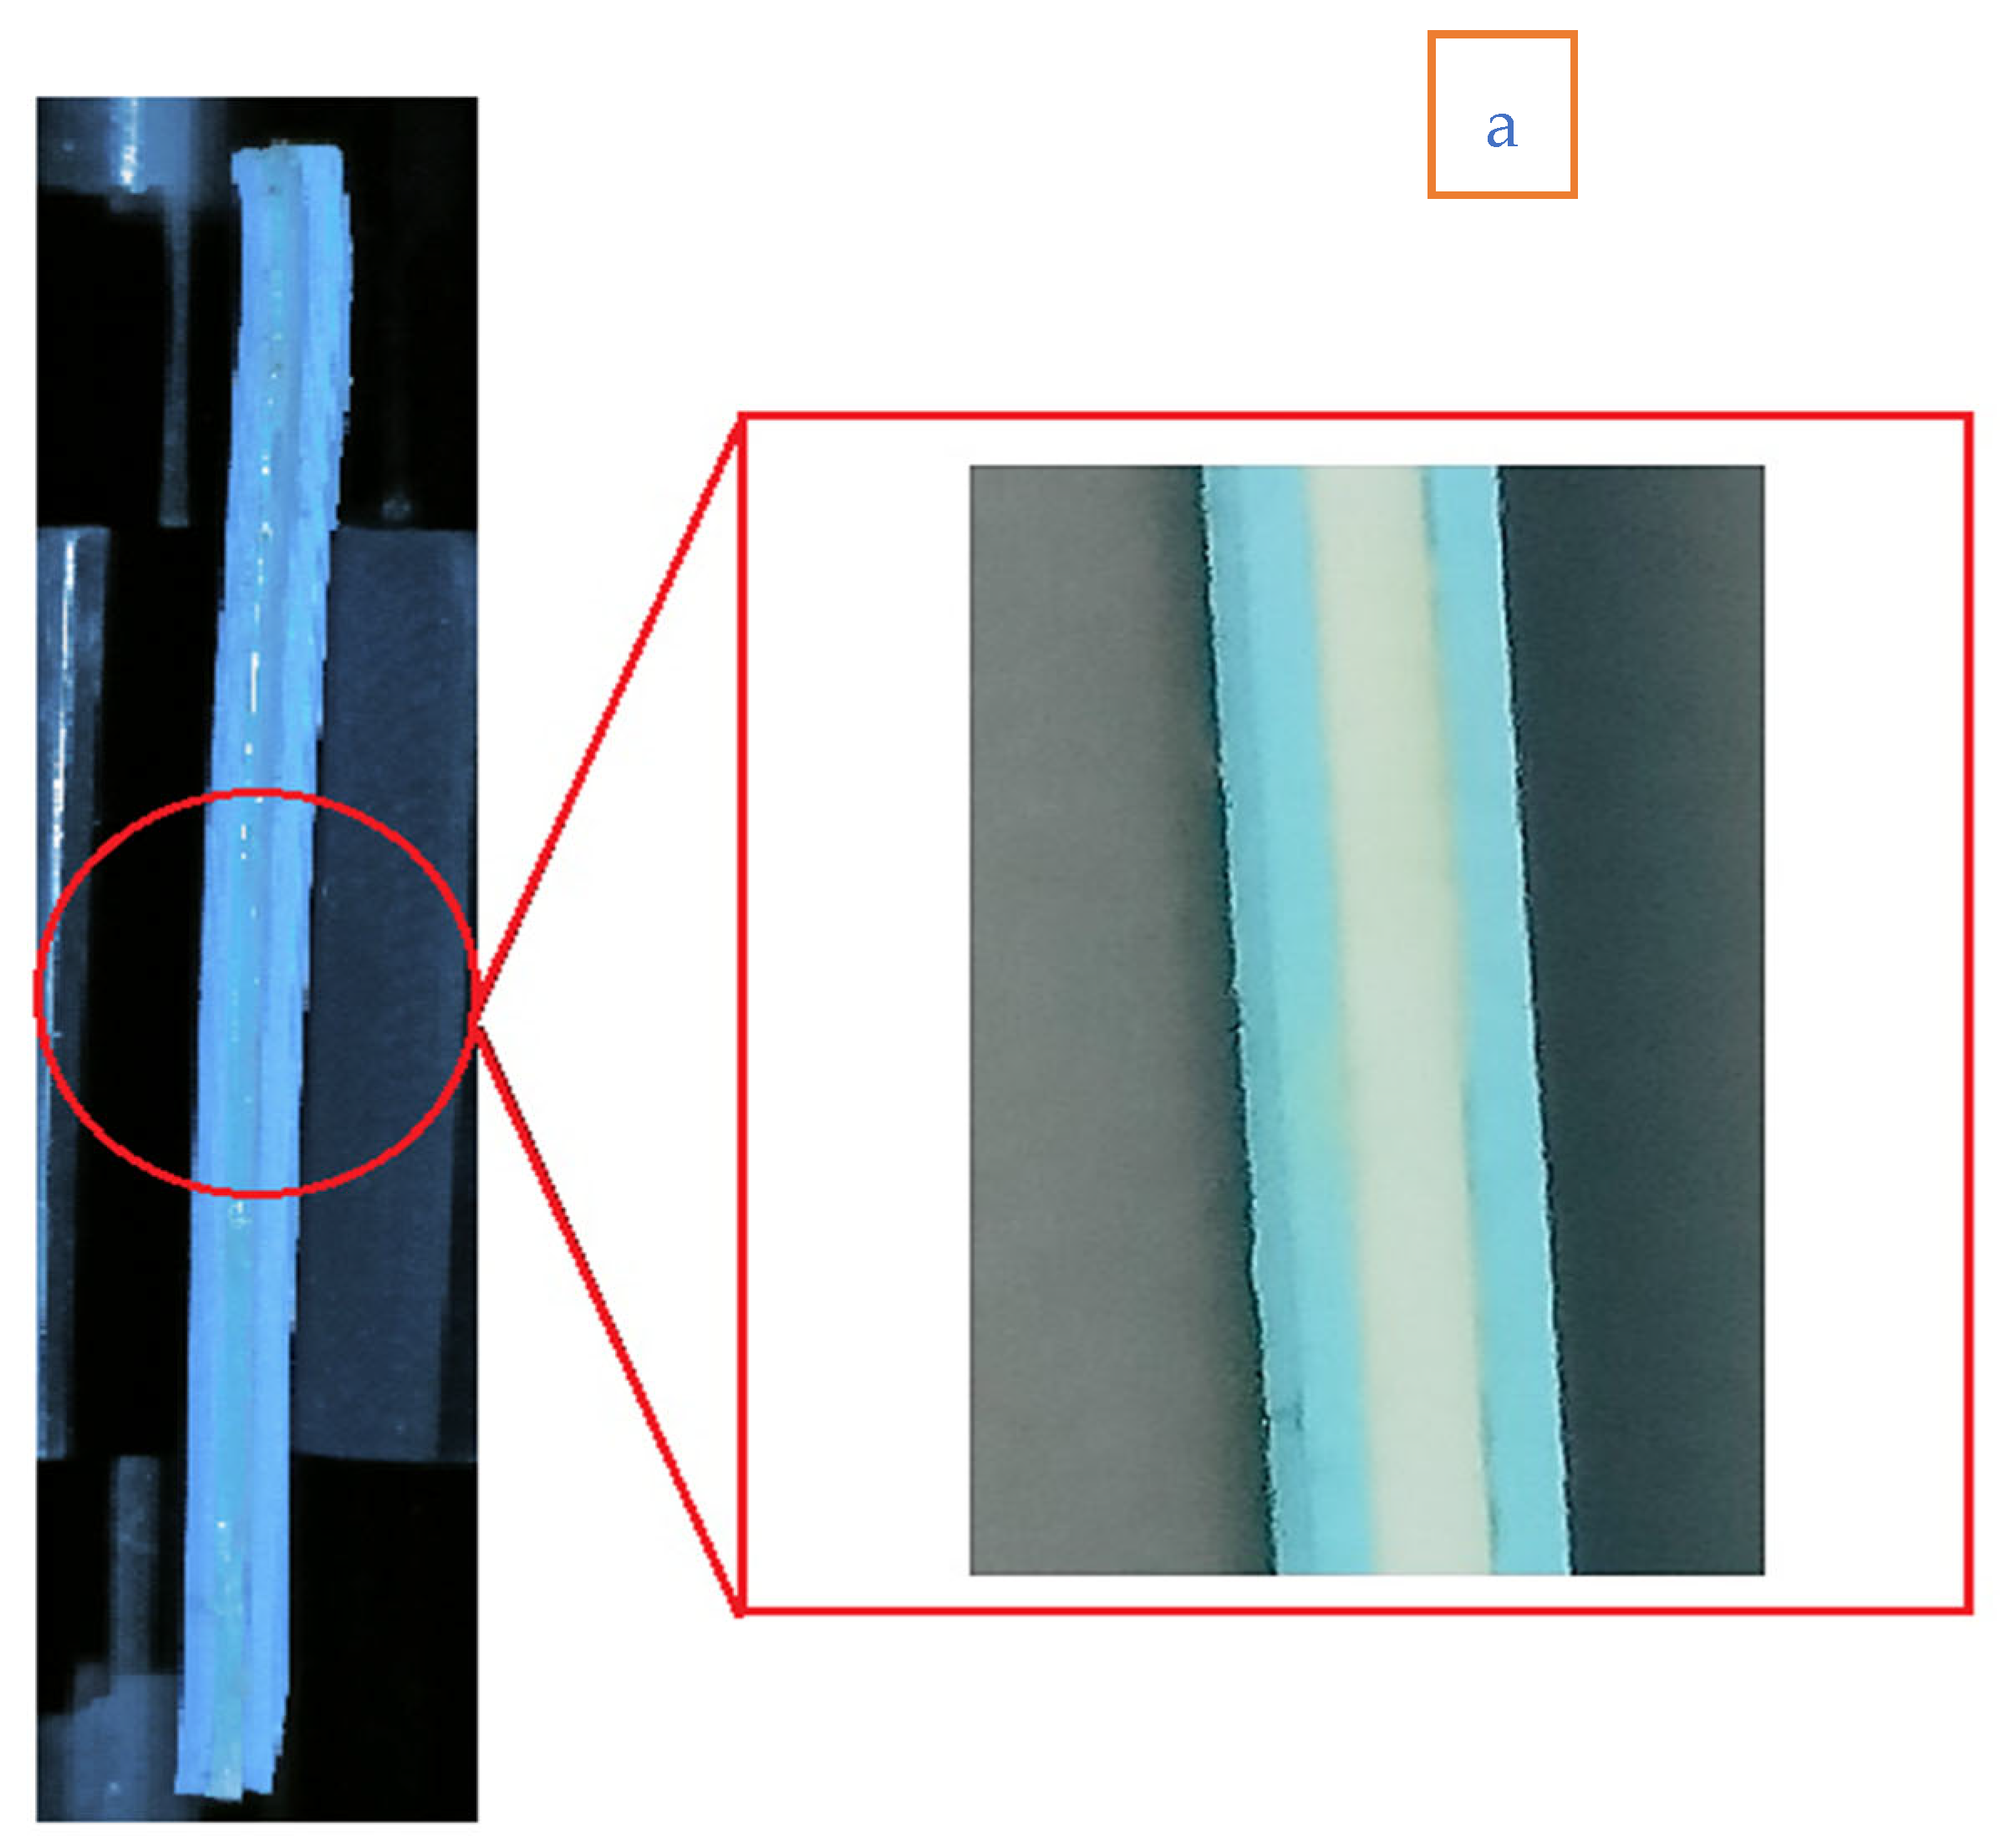
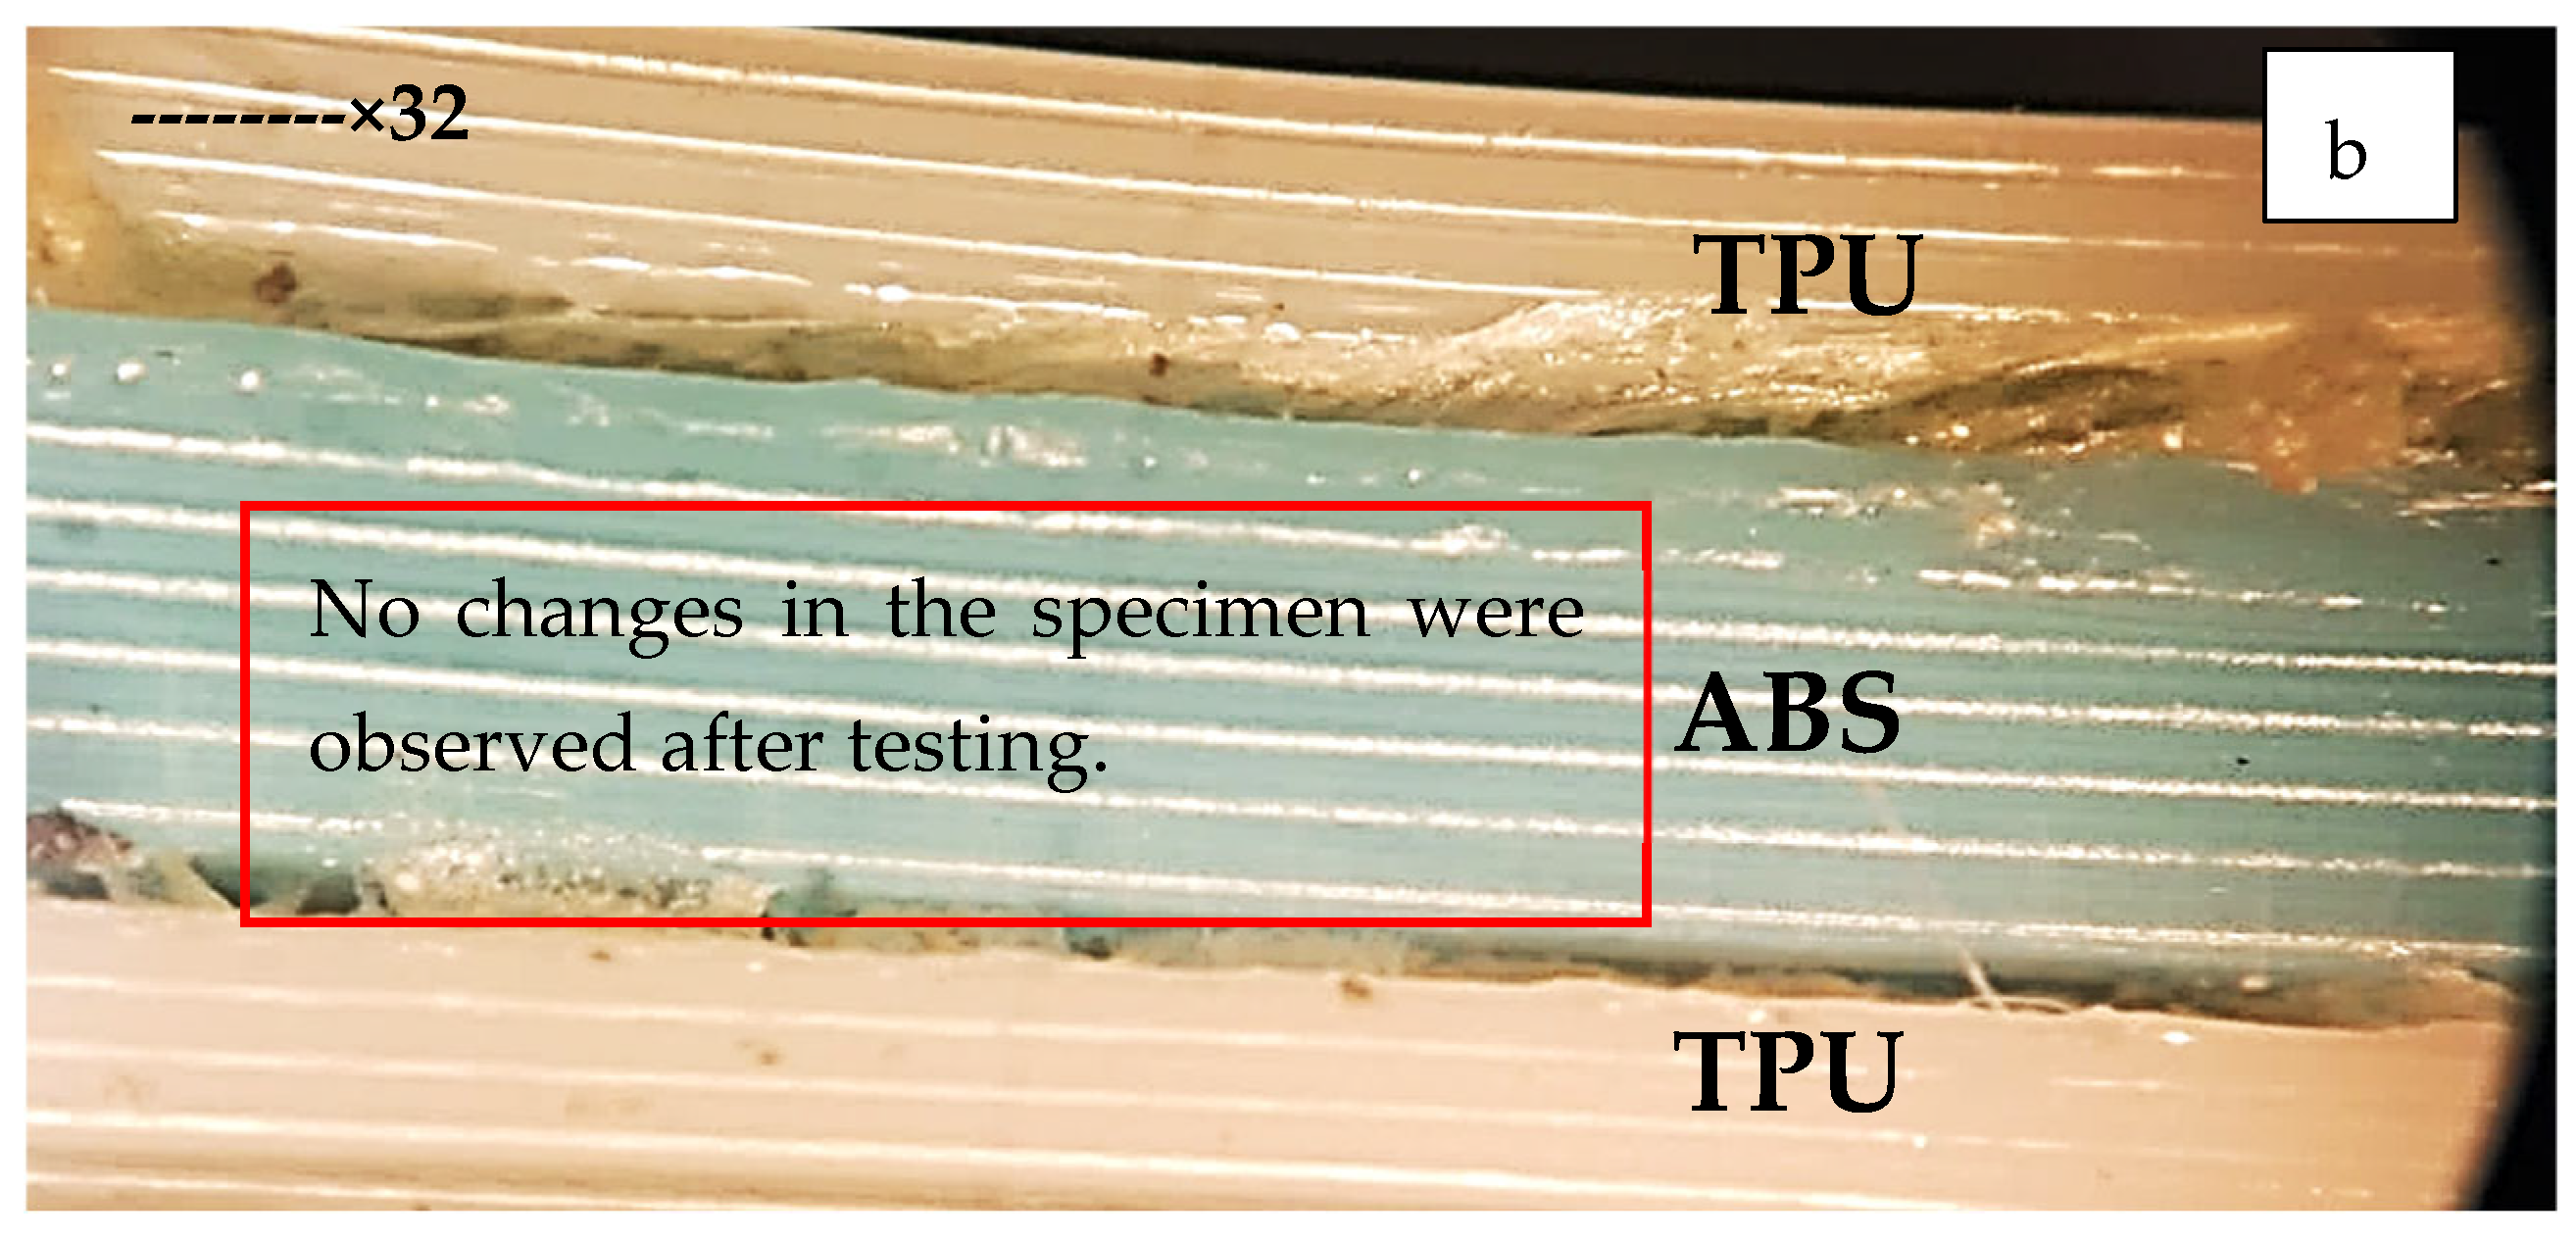
5.1. Tool Maker Microscopic Analysis
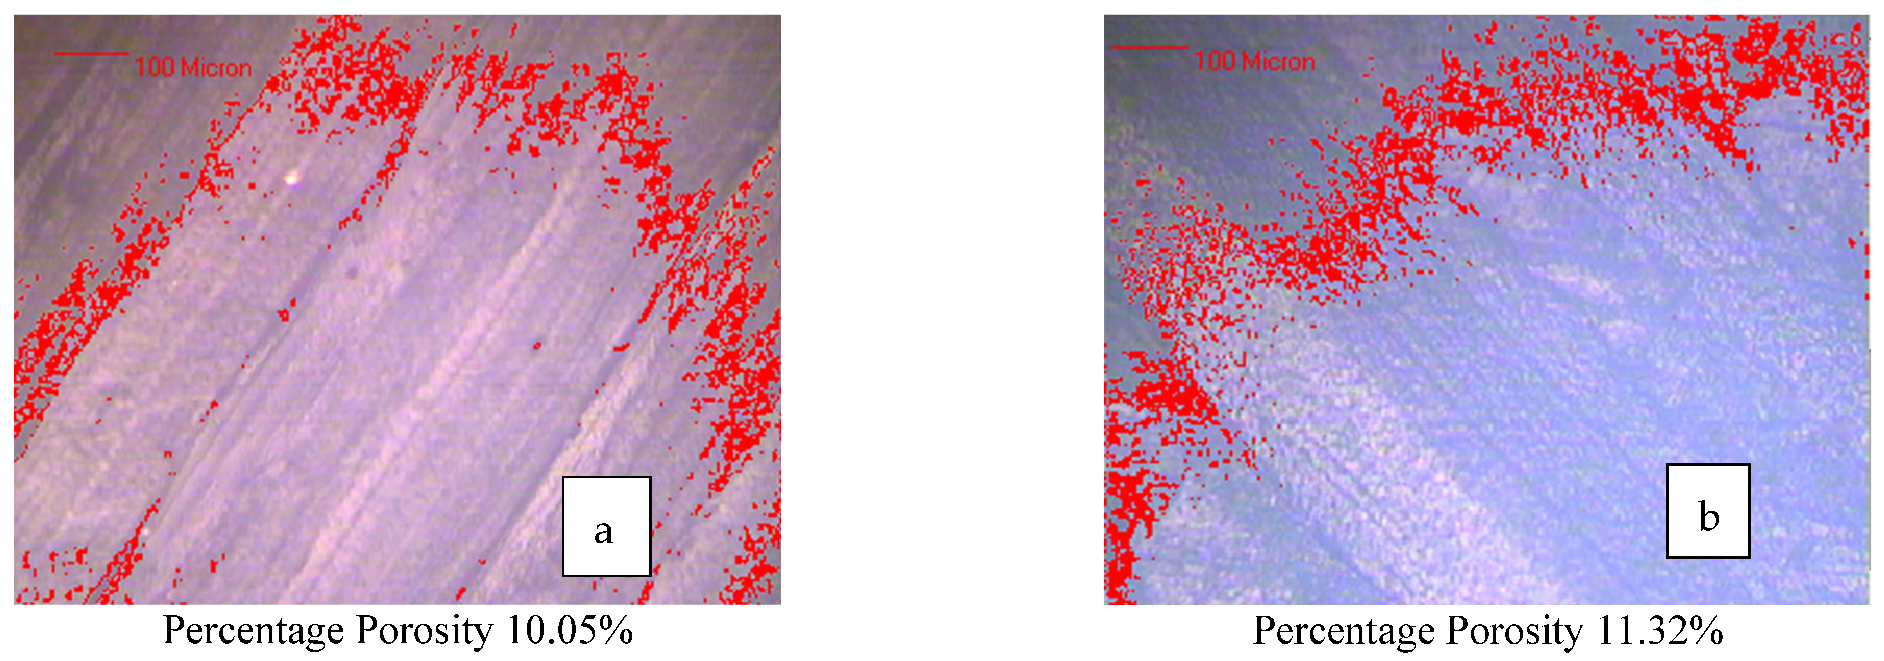
5.2. Porosity Analysis
6. Conclusions
- 1.
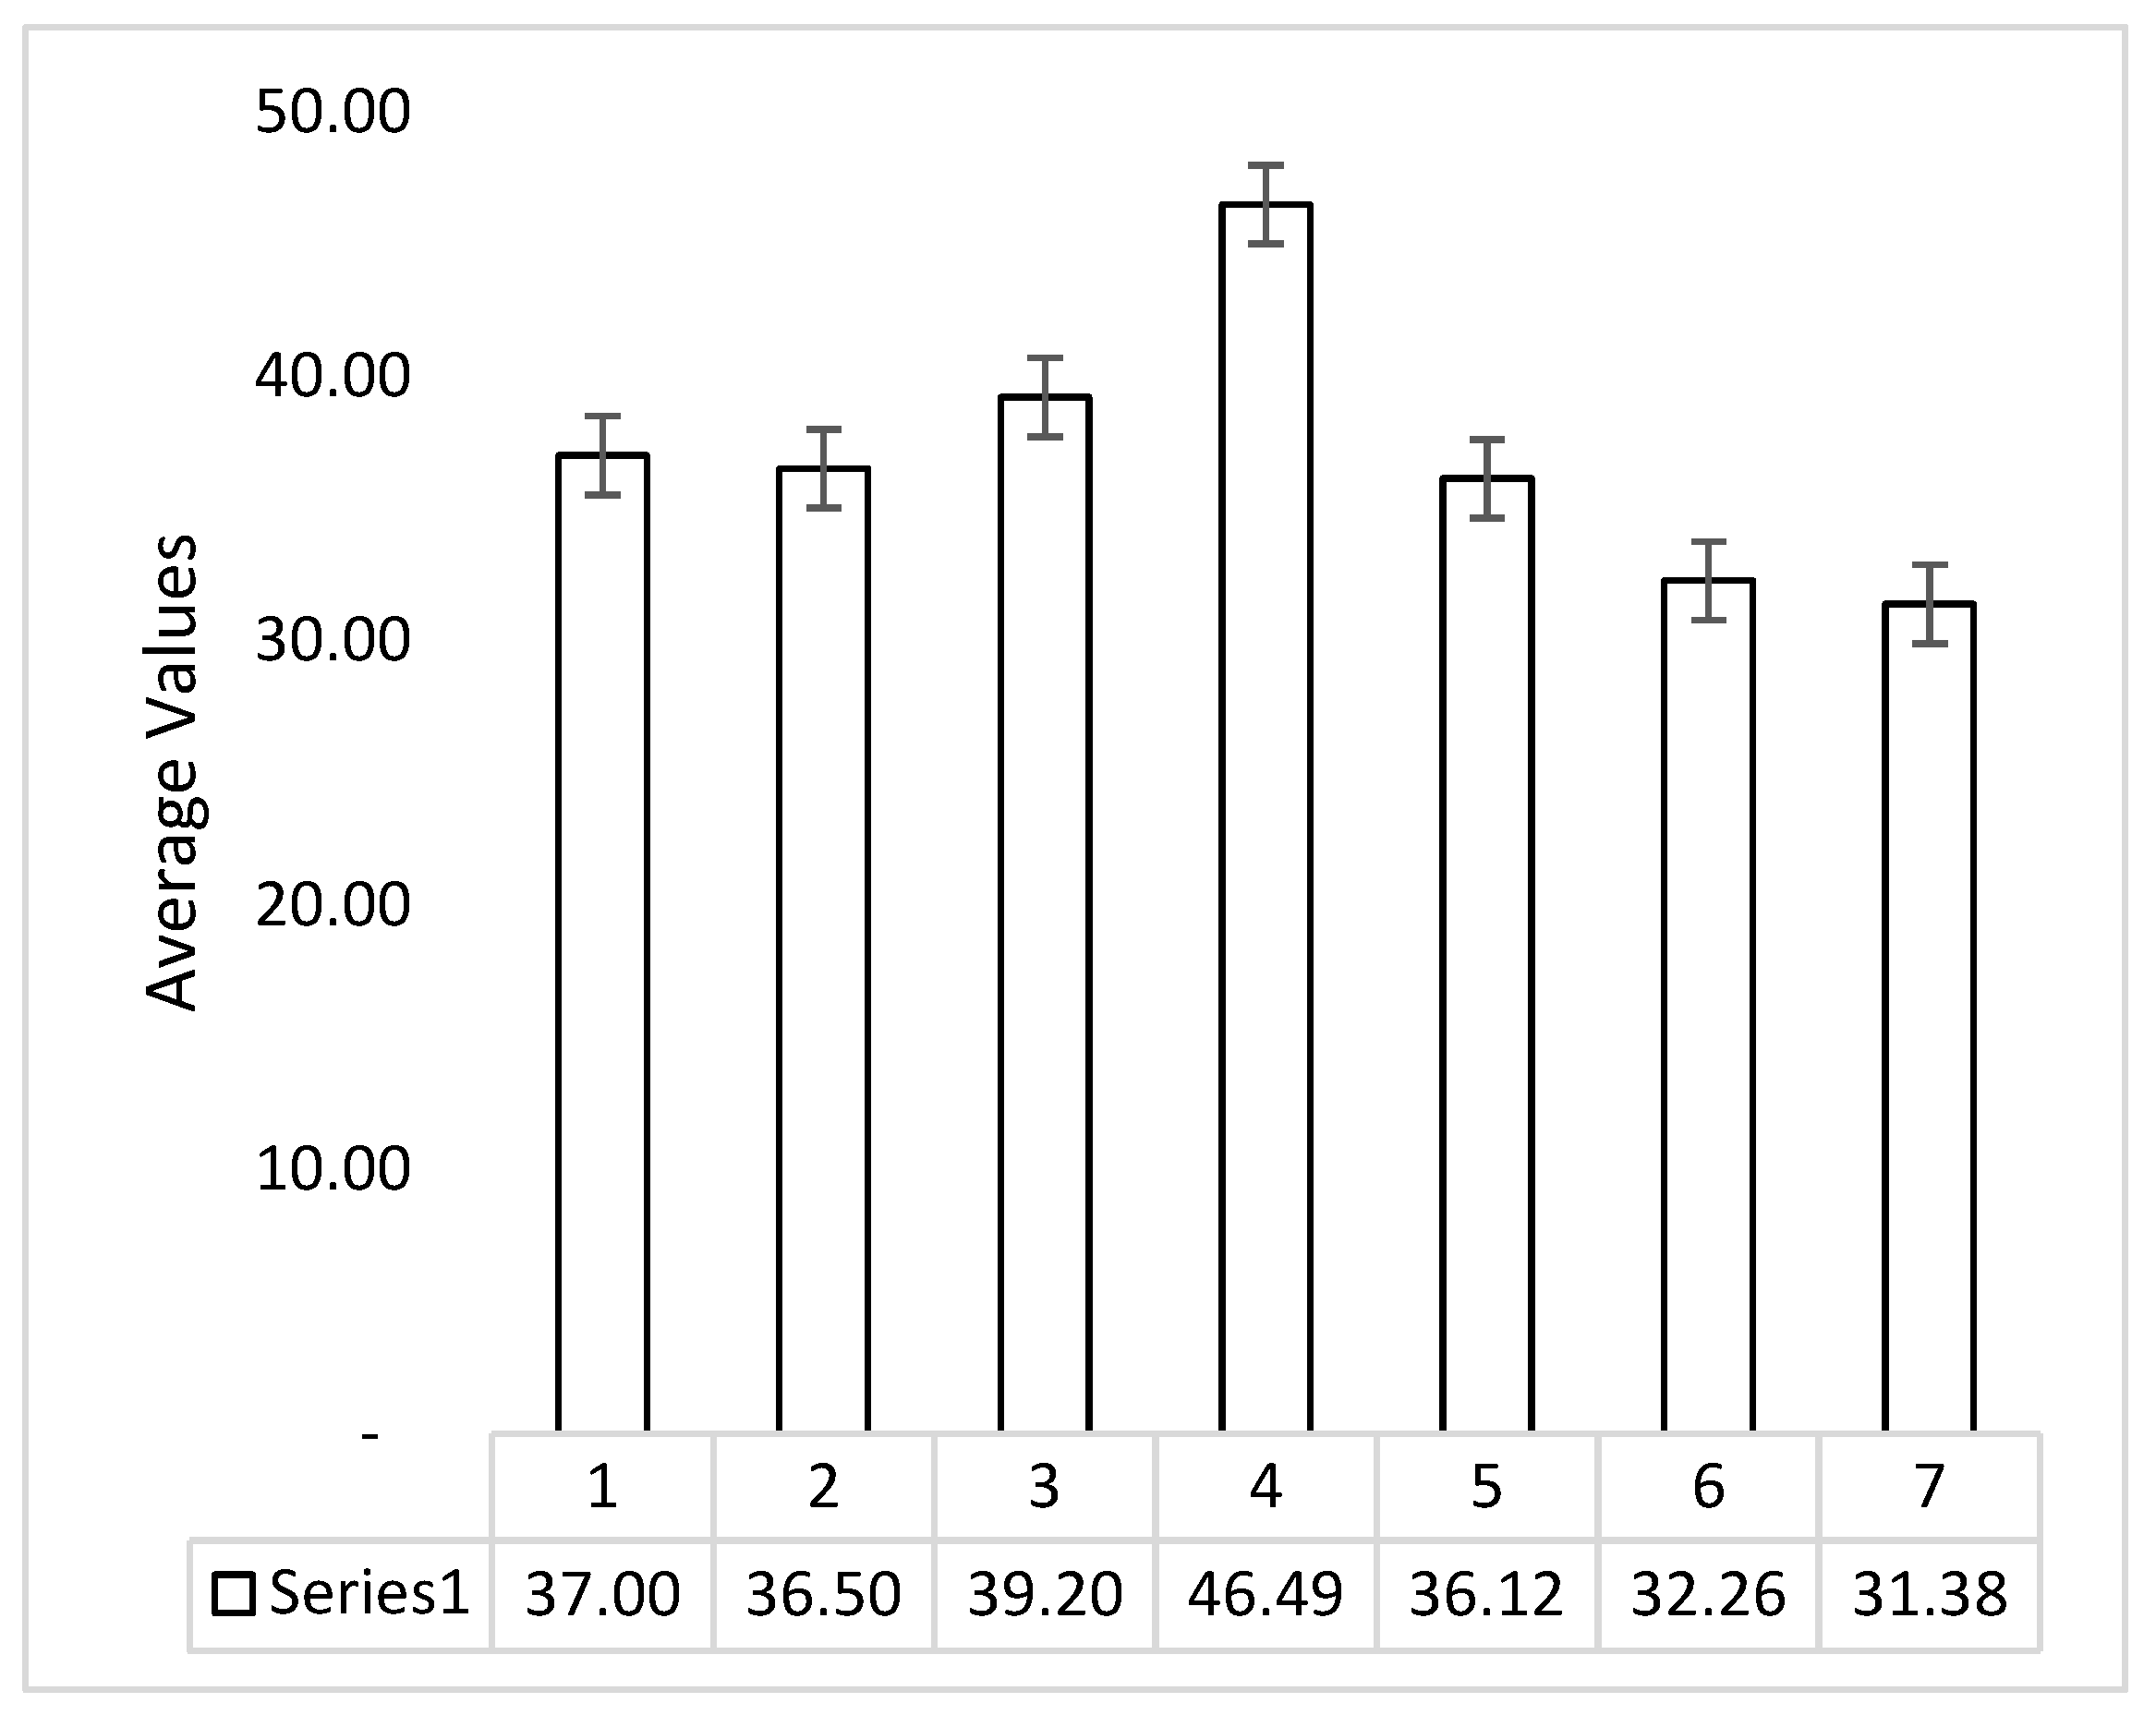
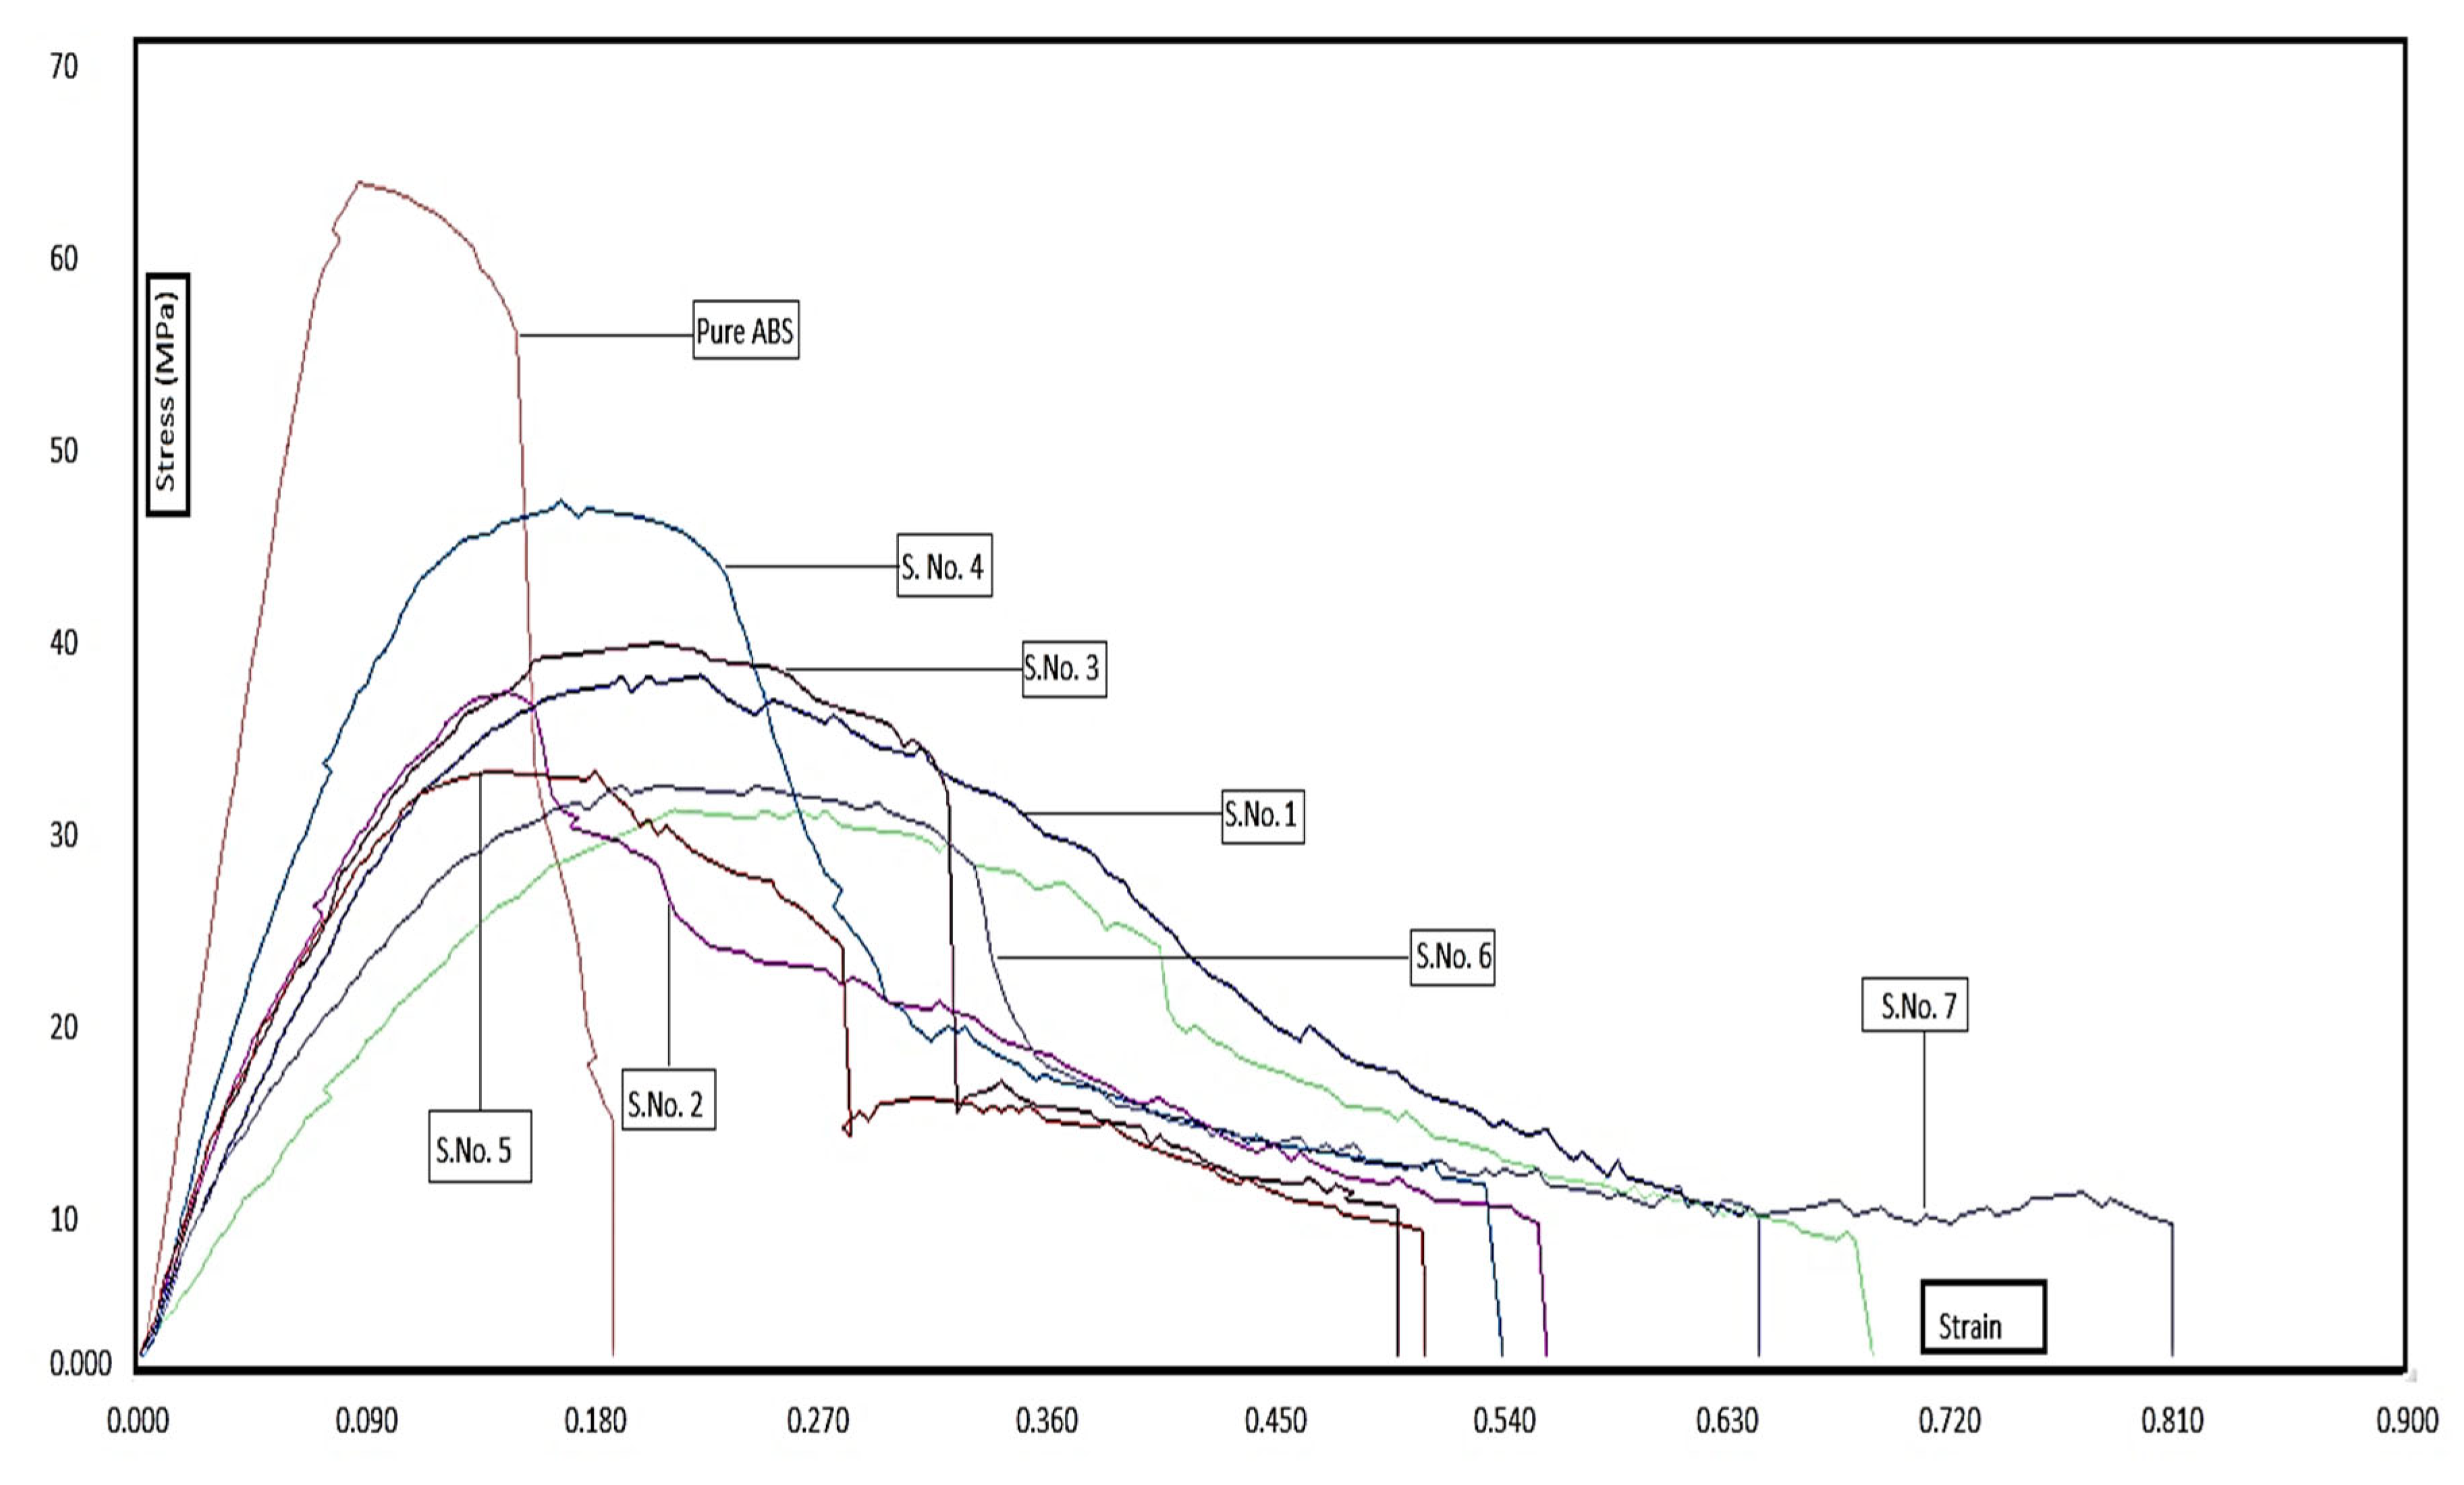
- ATA-based samples held greater flexural strength than TAT laminated manufactured samples. This may be due to the presence of ABS material in the outer layers of the specimen, which plays a role in compression and expansion under flexural loading, whereas the TPU was present largely at the neutral axis of the specimen for ATA-based specimens.
- 2.
- Reduction in flexural strength was significant along with the increment in the peak elongation and break elongation of the samples. For sample 4 (best among ATA samples), the percentage increase in the break elongation was observed to be 187%. In sample 7 (S.No. 7, Table 5), there was a 327% significant increment in the break elongation in comparison to pure ABS specimen but it demonstrated poor flexural strength.
- 3.
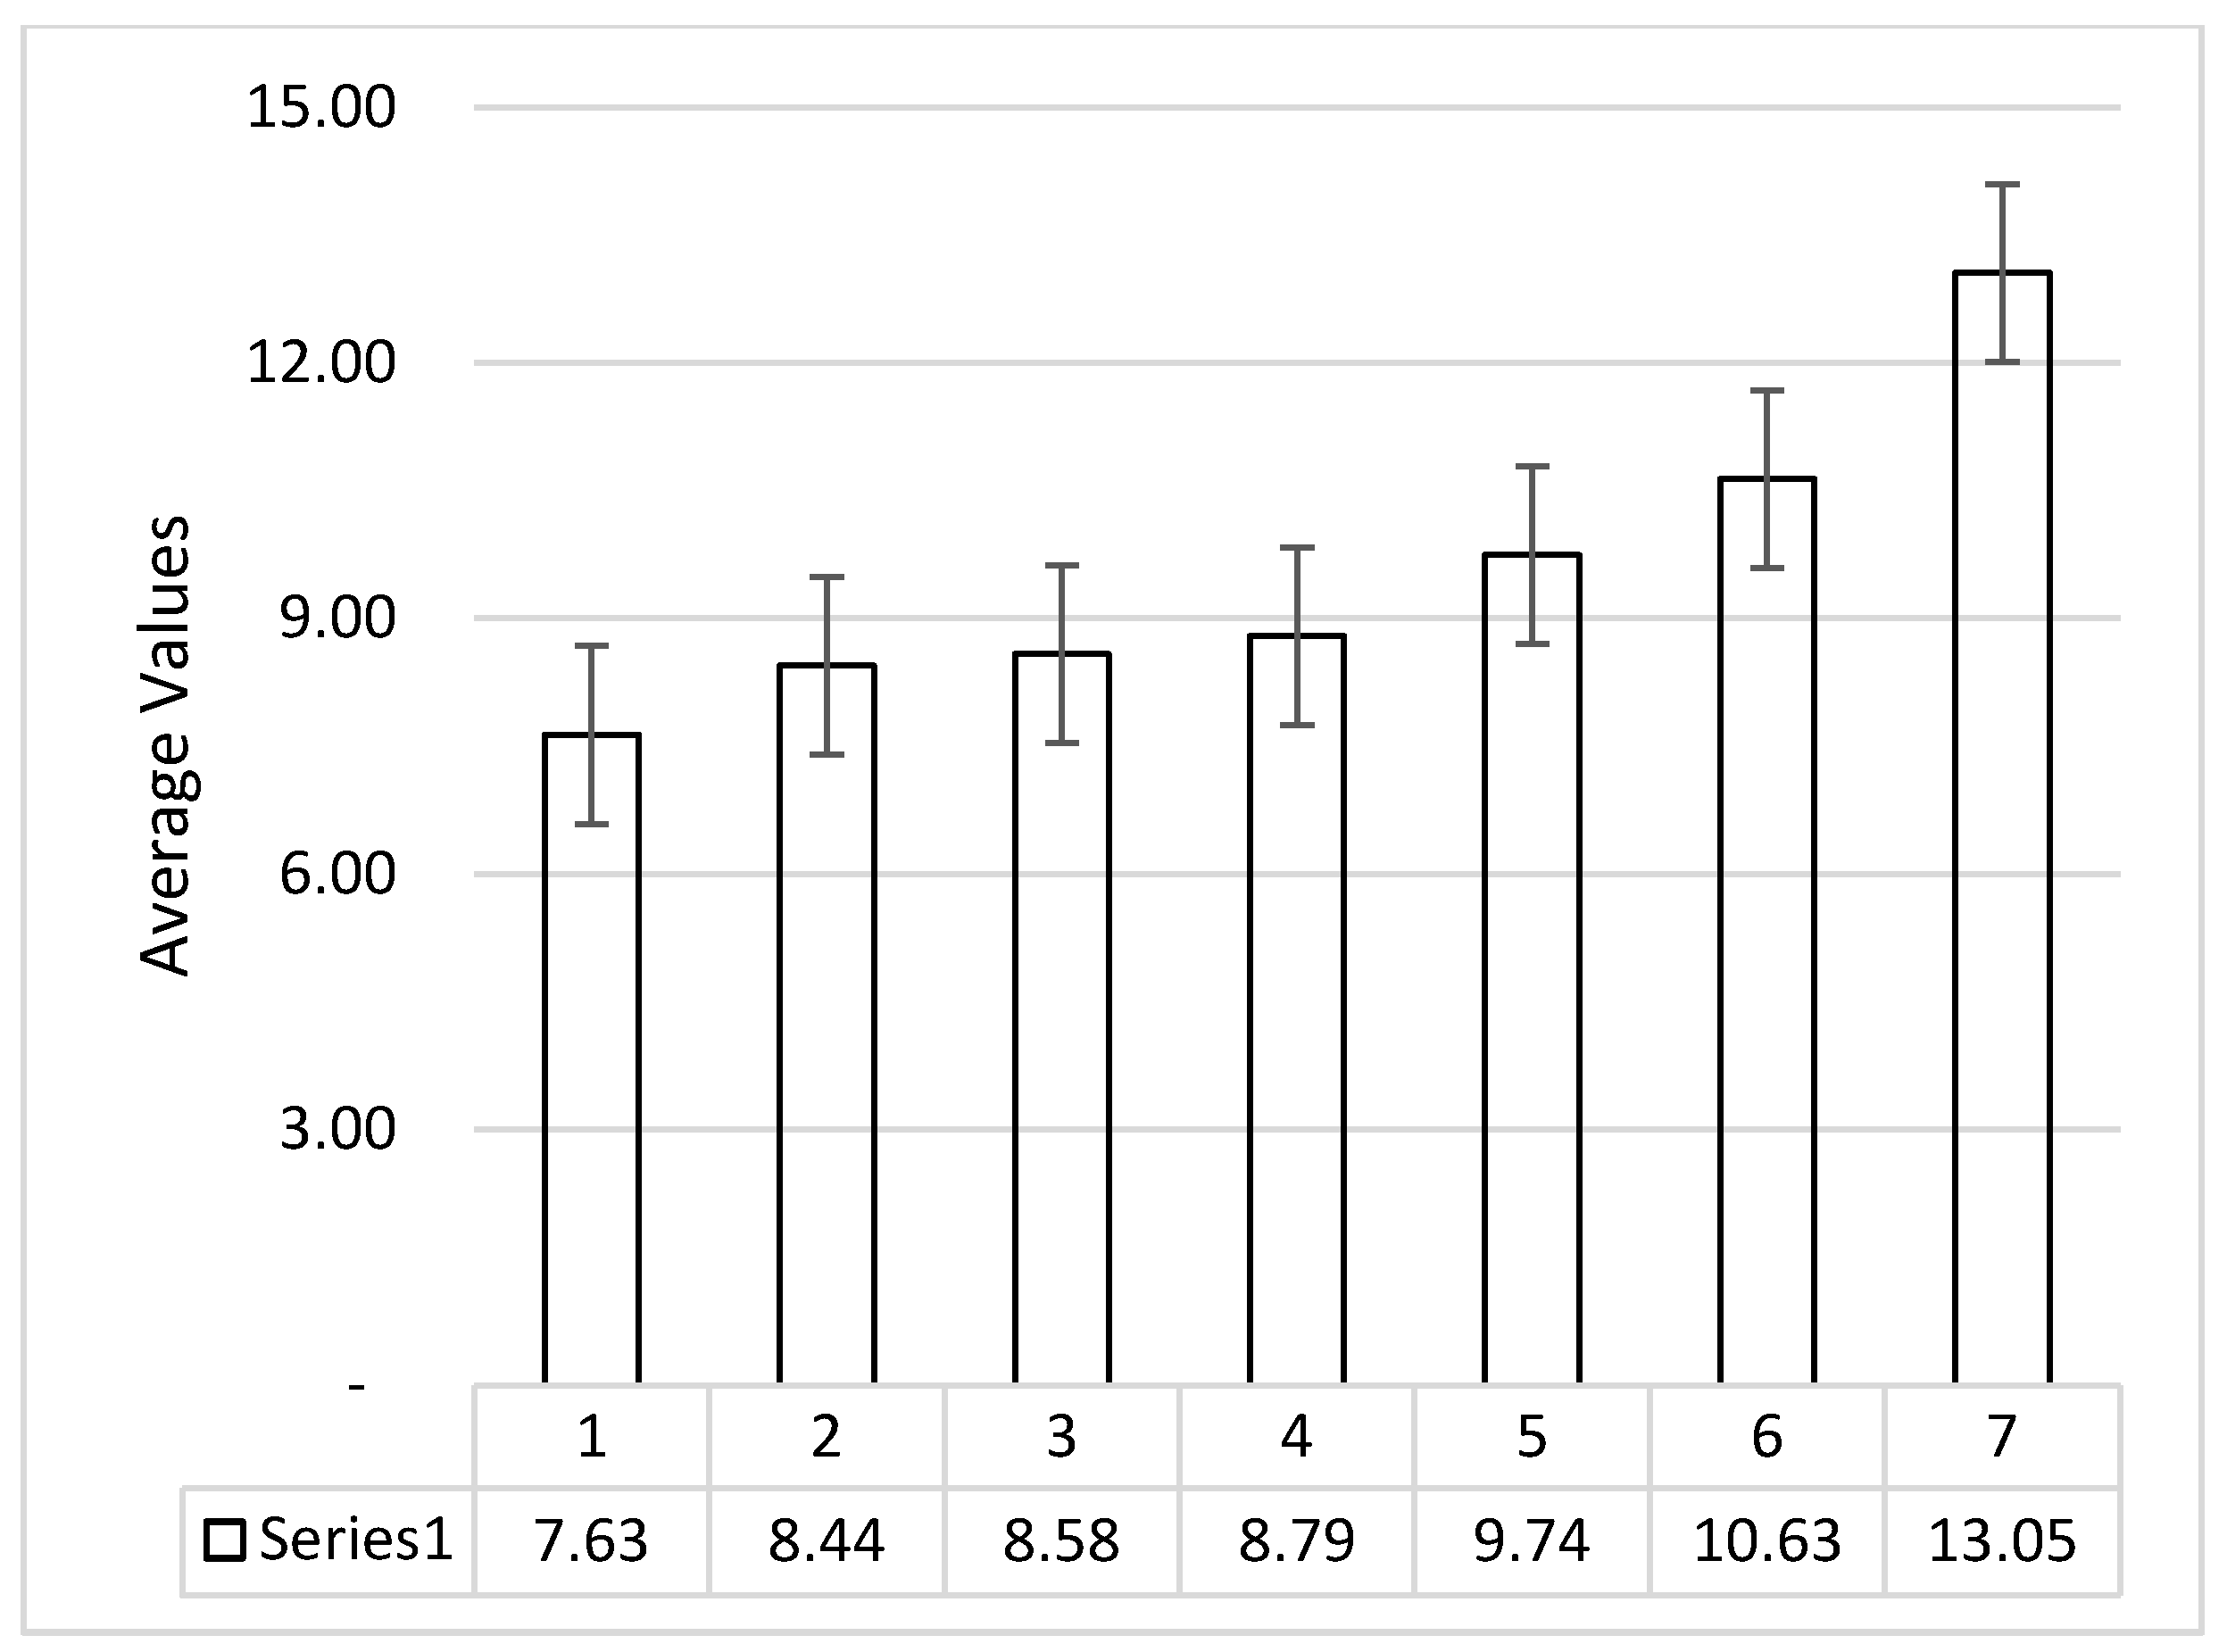
- Similarly, for the TAT-based specimen, flexural strength improved significantly from approximately 6.8 MPa to 13 MPa, which has shown a nearly 92% increase in the flexural strength in comparison to pure TPU specimen.
- 4.
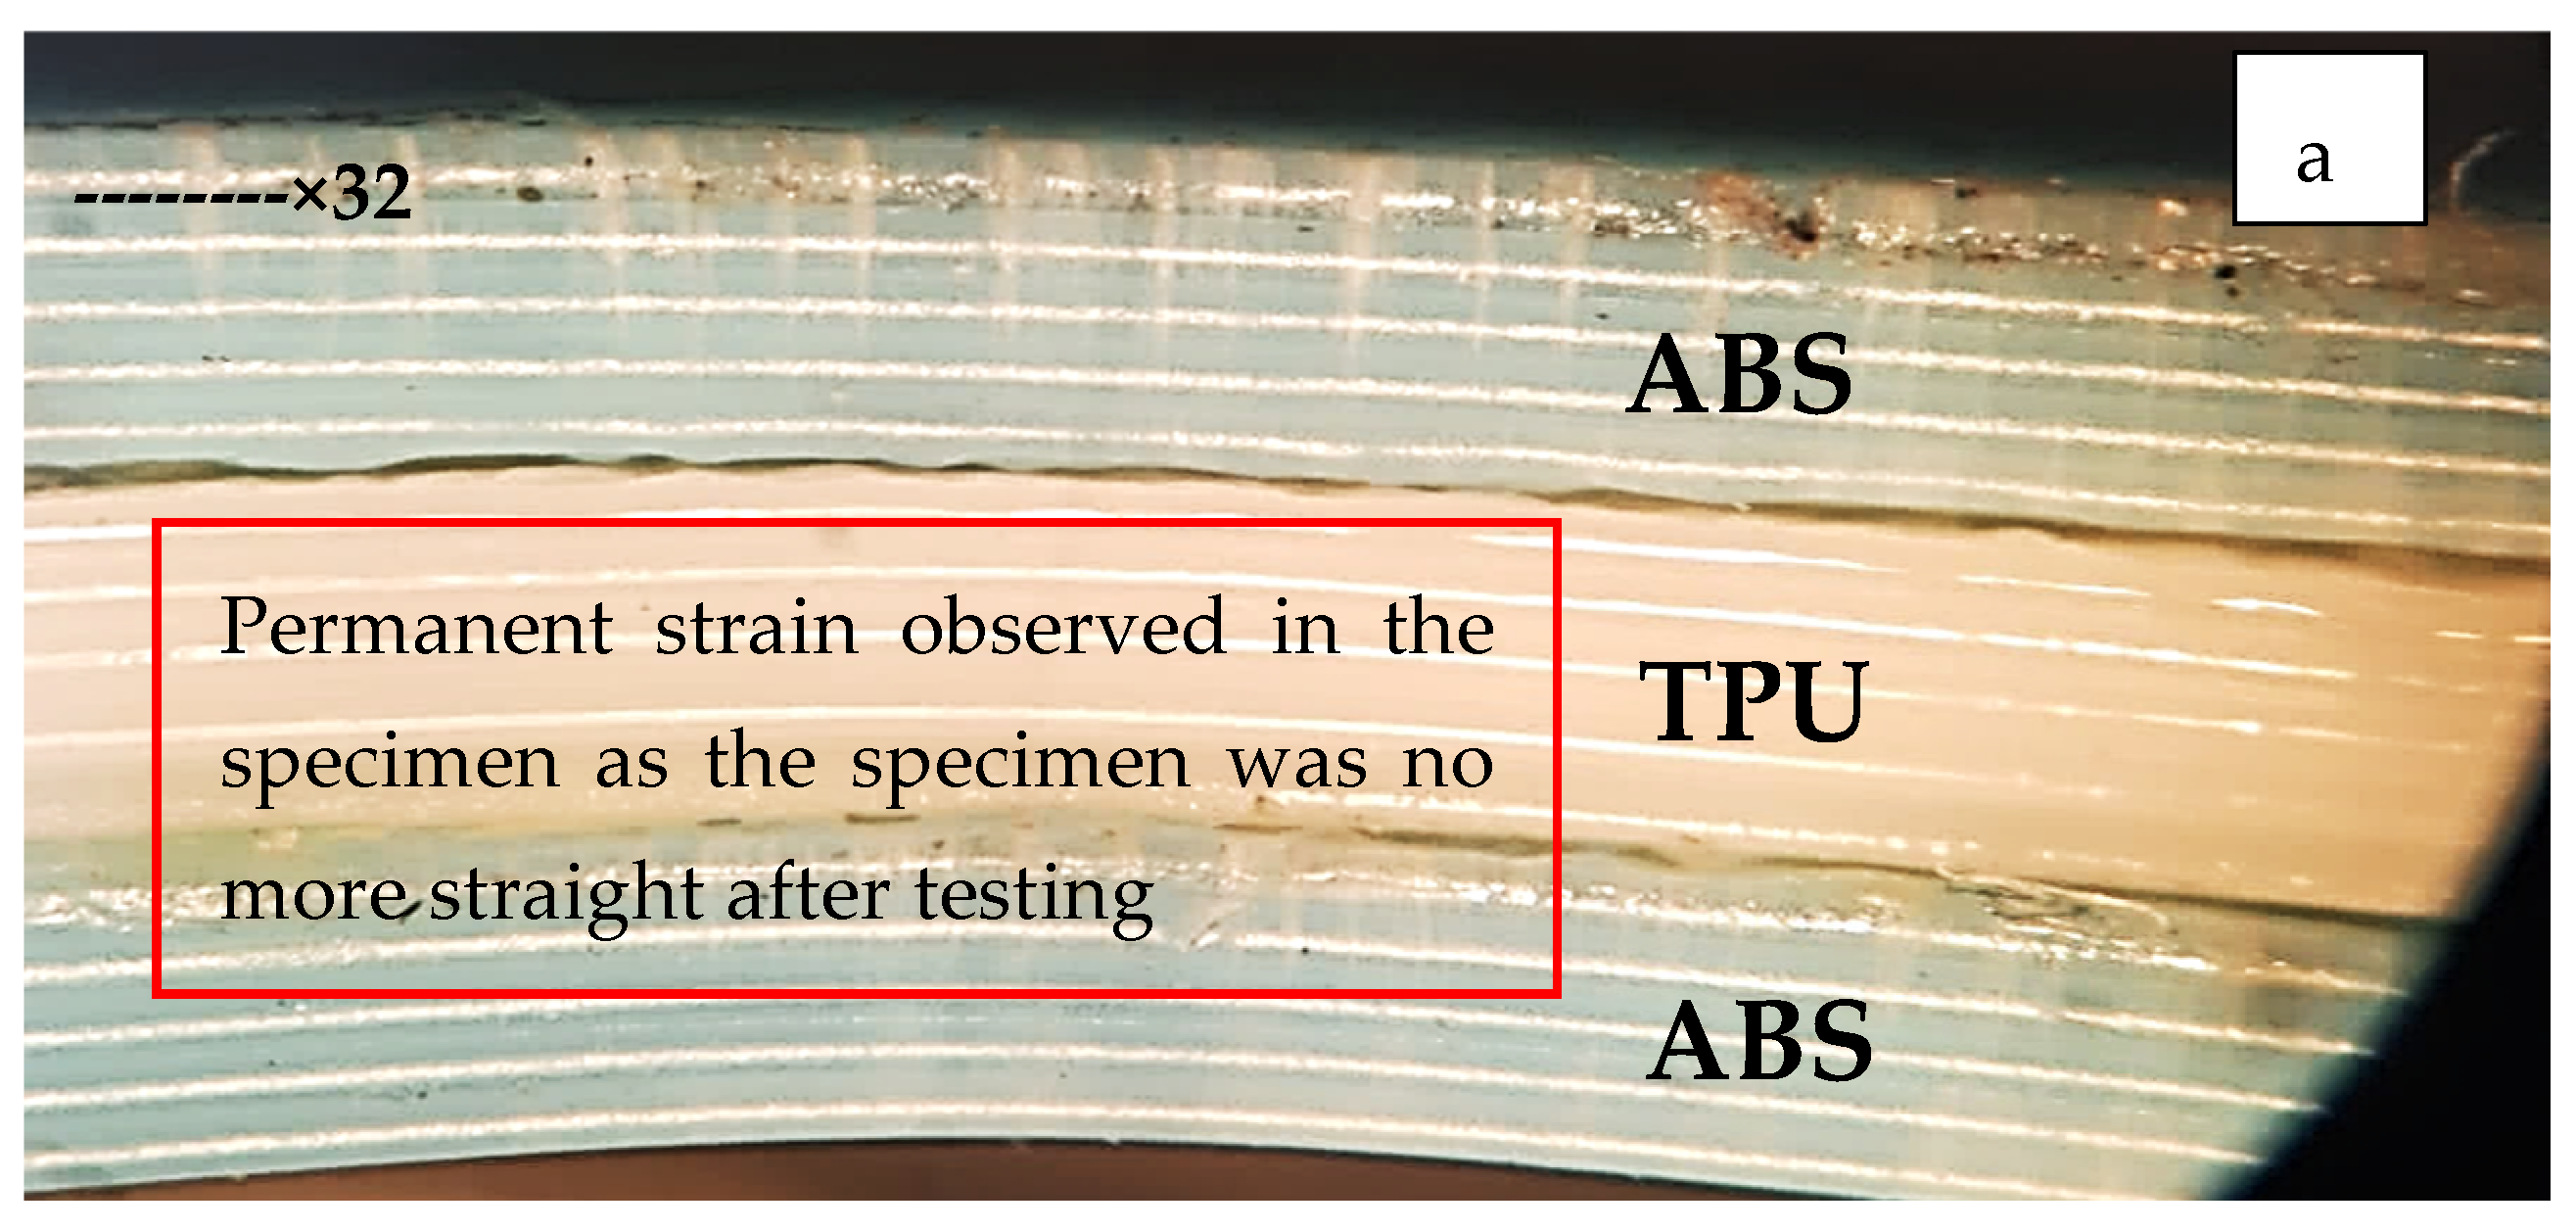
- The morphological testing Tool Maker’s microscopic analysis has supported the observed trends of mechanical behavior of ATA and TAT samples, whereas from porosity analysis, it may be concluded that the porosity between the laminated layers has no significant role to play in flexural properties.
Author Contributions
Funding
Institutional Review Board Statement
Informed Consent Statement
Data Availability Statement
Acknowledgments
Conflicts of Interest
References
- Brenken, B.; Barocio, E.; Favaloro, A.; Kunc, V.; Pipes, R.B. Fused filament fabrication of fiber-reinforced polymers: A review. Addit. Manuf. 2018, 21, 1–16. [Google Scholar] [CrossRef]
- Wickramasinghe, S.; Do, T.; Tran, P. FDM-based 3D printing of polymer and associated composite: A review on mechanical properties, defects and treatments. Polymers 2020, 12, 1529. [Google Scholar] [CrossRef] [PubMed]
- Mazzanti, V.; Malagutti, L.; Mollica, F. FDM 3D printing of polymers containing natural fillers: A review of their mechanical properties. Polymers 2019, 11, 1094. [Google Scholar] [CrossRef] [PubMed]
- Samykano, M.; Selvamani, S.; Kadirgama, K.; Ngui, W.; Kanagaraj, G.; Sudhakar, K. Mechanical property of FDM printed ABS: Influence of printing parameters. Int. J. Adv. Manuf. Technol. 2019, 102, 2779–2796. [Google Scholar] [CrossRef]
- Kristiawan, R.B.; Imaduddin, F.; Ariawan, D.; Arifin, Z. A review on the fused deposition modeling (FDM) 3D printing: Filament processing, materials, and printing parameters. Open Eng. 2021, 11, 639–649. [Google Scholar] [CrossRef]
- Farokhi Nejad, A.; Alipour, R.; Shokri Rad, M.; Yazid Yahya, M.; Rahimian Koloor, S.S.; Petrů, M. Using finite element approach for crashworthiness assessment of a polymeric auxetic structure subjected to the axial loading. Polymers 2020, 12, 1312. [Google Scholar] [CrossRef]
- Kashyzadeh, K.R.; Rahimian Koloor, S.S.; Omidi Bidgoli, M.; Petrů, M.; Amiri Asfarjani, A. An optimum fatigue design of polymer composite compressed natural gas tank using hybrid finite element-response surface methods. Polymers 2021, 13, 483. [Google Scholar] [CrossRef]
- Cuiffo, M.A.; Snyder, J.; Elliott, A.M.; Romero, N.; Kannan, S.; Halada, G.P. Impact of the fused deposition (FDM) printing process on polylactic acid (PLA) chemistry and structure. Appl. Sci. 2017, 7, 579. [Google Scholar] [CrossRef]
- Ramesh, M.; Panneerselvam, K. Mechanical investigation and optimization of parameter selection for Nylon material processed by FDM. Mater. Today Proc. 2021, 46, 9303–9307. [Google Scholar] [CrossRef]
- Wang, L.; Sanders, J.E.; Gardner, D.J.; Han, Y. Effect of fused deposition modeling process parameters on the mechanical properties of a filled polypropylene. Prog. Addit. Manuf. 2018, 3, 205–214. [Google Scholar] [CrossRef]
- Kumar, S.; Singh, R.; Singh, T.; Batish, A. Fused filament fabrication: A comprehensive review. J. Thermoplast. Compos. Mater. 2020, 0892705720970629. [Google Scholar] [CrossRef]
- Singh, S.; Singh, G.; Prakash, C.; Ramakrishna, S. Current status and future directions of fused filament fabrication. J. Manuf. Process. 2020, 55, 288–306. [Google Scholar] [CrossRef]
- Kumar, S.; Singh, R.; Batish, A.; Singh, T. Additive manufacturing of smart materials exhibiting 4-D properties: A state of art review. J. Thermoplast. Compos. Mater. 2019, 35, 1358–1381. [Google Scholar] [CrossRef]
- Shokravi, H.; Mohammadyan-Yasouj, S.E.; Koloor, S.S.R.; Petrů, M.; Heidarrezaei, M. Effect of alumina additives on mechanical and fresh properties of self-compacting concrete: A review. Processes 2021, 9, 554. [Google Scholar] [CrossRef]
- Saba, A.M.; Khan, A.H.; Akhtar, M.N.; Khan, N.A.; Rahimian Koloor, S.S.; Petrů, M.; Radwan, N. Strength and flexural behavior of steel fiber and silica fume incorporated self-compacting concrete. J. Mater. Res. Technol. 2021, 12, 1380–1390. [Google Scholar] [CrossRef]
- Elmrabet, N.; Siegkas, P. Dimensional considerations on the mechanical properties of 3D printed polymer parts. Polym. Test. 2020, 90, 106656. [Google Scholar] [CrossRef]
- Galindo, B.; Alcolea, S.G.; Gómez, J.; Navas, A.; Murguialday, A.O.; Fernandez, M.P.; Puelles, R. Effect of the number of layers of graphene on the electrical properties of TPU polymers. IOP Conf. Ser. Mater. Sci. Eng. 2014, 64, 012008. [Google Scholar] [CrossRef]
- Ferretti, P.; Leon, C.; Sali, M.; Frizziero, L.; Donnici, G.; Liverani, A. Application of TPU—Sourced 3D printed FDM organs for improving the realism in surgical planning and training. In Proceedings of the 11th Annual International Conference on Industrial Engineering and Operations Management, Singapore, 7–11 March 2021; pp. 6658–6669. [Google Scholar]
- De León, A.S.; Domínguez-Calvo, A.; Molina, S.I. Materials with enhanced adhesive properties based on acrylonitrile-butadiene-styrene (ABS)/thermoplastic polyurethane (TPU) blends for fused filament fabrication (FFF). Mater. Des. 2019, 182, 108044. [Google Scholar] [CrossRef]
- Brancewicz-Steinmetz, E.; Sawicki, J.; Byczkowska, P. The influence of 3D printing parameters on adhesion between polylactic acid (PLA) and thermoplastic polyurethane (TPU). Materials 2021, 14, 6464. [Google Scholar] [CrossRef]
- Rudawska, A. Mechanical properties of selected epoxy adhesive and adhesive joints of steel sheets. Appl. Mech. 2021, 2, 108–126. [Google Scholar] [CrossRef]
- Chen, Q.; Mangadlao, J.D.; Wallat, J.; De Leon, A.; Pokorski, J.K.; Advincula, R.C. 3D printing biocompatible polyurethane/poly (lactic acid)/graphene oxide nanocomposites: Anisotropic properties. ACS Appl. Mater. Interfaces 2017, 9, 4015–4023. [Google Scholar] [CrossRef]
- Reulier, M.; Avérous, L. Elaboration, morphology and properties of renewable thermoplastics blends, based on polyamide and polyurethane synthesized from dimer fatty acids. Eur. Polym. J. 2015, 67, 418–427. [Google Scholar] [CrossRef]
- Wang, Y.; Zhang, J.; Li, M.; Lei, M.; Wang, Y.; Wei, Q. 3D printing thermo-responsive shape memory polymer composite based on PCL/TPU blends. J. Polym. Res. 2022, 29, 243. [Google Scholar] [CrossRef]
- Haryńska, A.; Gubanska, I.; Kucinska-Lipka, J.; Janik, H. Fabrication and characterization of flexible medical-grade TPU filament for Fused Deposition Modeling 3DP technology. Polymers 2018, 10, 1304. [Google Scholar] [CrossRef] [PubMed]
- Ritzen, L.; Montano, V.; Garcia, S.J. 3D Printing of a Self-Healing Thermo-plastic Polyurethane Through FDM: From Polymer Slab to Mechanical Assessment. Polymers 2021, 13, 305. [Google Scholar] [CrossRef]
- Abeykoon, C.; Sri-Amphorn, P.; Fernando, A. Optimization of fused deposition modeling parameters for improved PLA and ABS 3D printed structures. Int. J. Lightweight Mater. Manuf. 2020, 3, 284–297. [Google Scholar] [CrossRef]
- Markiz, N.; Horváth, E.; Ficzere, P. Influence of printing direction on 3D printed ABS specimens. Prod. Eng. Arch. 2020, 26, 127–130. [Google Scholar] [CrossRef]
- Joshani, M.; Koloor, S.; Abdullah, R. Damage Mechanics Model for Fracture Process of Steel-concrete Composite Slabs. Appl. Mech. Mater. 2012, 165, 339–345. [Google Scholar]
- Cantrell, J.T.; Rohde, S.; Damiani, D.; Gurnani, R.; DiSandro, L.; Anton, J.; Young, A.; Jerez, A.; Steinbach, D.; Kroese, C.; et al. Experimental characterization of the mechanical properties of 3D-printed ABS and polycarbonate parts. Rapid Prototyp. J. 2017, 23, 811–824. [Google Scholar] [CrossRef]
- Baich, L.; Manogharan, G. Study of infill print parameters on mechanical strength and production cost-time of 3D printed ABS parts. In Proceedings of the 2014 International Solid Freeform Fabrication Symposium, Austin, TX, USA, 4–6 August 2014; pp. 209–218. Available online: https://hdl.handle.net/2152/89321 (accessed on 30 May 2022).
- Torrado Perez, A.R.; Roberson, D.A.; Wicker, R.B. Fracture surface analysis of 3D-printed tensile specimens of novel ABS-based materials. J. Fail. Anal. Prev. 2014, 14, 343–353. [Google Scholar] [CrossRef]
- Li, F.; Macdonald, N.P.; Guijt, R.M.; Breadmore, M.C. Increasing the functionalities of 3D printed microchemical devices by single material, multimaterial, and print-pause-print 3D printing. Lab Chip 2019, 19, 35–49. [Google Scholar] [CrossRef]
- Kumar, R.; Singh, R.; Farina, I. On the 3D printing of recycled ABS, PLA and HIPS thermoplastics for structural applications. PSU Res. Rev. 2018, 2, 115–137. [Google Scholar] [CrossRef]
- Yadav, D.; Chhabra, D.; Garg, R.K.; Ahlawat, A.; Phogat, A. Optimization of FDM 3D printing process parameters for multi-material using artificial neural network. Mater. Today Proc. 2020, 21, 1583–1591. [Google Scholar] [CrossRef]
- Pilipovic, A.; Raos, P.; Sercer, M. Experimental Testing of Quality of Polymer Parts Produced by Laminated Object Manufacturing—LOM. Teh. Vjesn. 2011, 18, 253–260. [Google Scholar]
- Dermeik, B.; Travitzky, N. Laminated object manufacturing of ceramic-based materials. Adv. Eng. Mater. 2020, 22, 2000256. [Google Scholar] [CrossRef]
- Klosterman, D.; Chartoff, R.; Graves, G.; Osborne, N.; Priore, B. Interfacial characteristics of composites fabricated by laminated object manufacturing. Compos. Part A Appl. Sci. Manuf. 1998, 29, 1165–1174. [Google Scholar] [CrossRef]
- Wu, C.; Li, F.; Guo, T.; Kim, T.W. Controlling memory effects of three-layer structured hybrid bistable devices based on graphene sheets sandwiched between two laminated polymer layers. Org. Electron. 2012, 13, 178–183. [Google Scholar] [CrossRef]
- Reulier, M.; Matadi Boumbimba, R.; Walsh Korb, Z.; Vaudemont, R.; Avérous, L. Thermomechanical and cyclic behavior of biocomposites based on renewable thermoplastics from dimer fatty acids. J. Appl. Polym. Sci. 2017, 134, 44610. [Google Scholar] [CrossRef]
- Kim, N.P. 3D-printed conductive carbon-infused thermoplastic polyurethane. Polymers 2020, 12, 1224. [Google Scholar] [CrossRef]
- Tao, Y.; Shao, J.; Li, P.; Shi, S.Q. Application of a thermoplastic polyurethane/polylactic acid composite filament for 3D-printed personalized orthosis. Mater. Tehnol. 2019, 53, 71–76. [Google Scholar] [CrossRef]
- Gasparotti, E.; Vignali, E.; Losi, P.; Scatto, M.; Fanni, B.M.; Soldani, G.; Landini, L.; Positano, V.; Celi, S. A 3D printed melt-compounded antibiotic loaded thermoplastic polyurethane heart valve ring design: An integrated framework of experimental material tests and numerical simulations. Int. J. Polym. Mater. Polym. Biomater. 2019, 68, 1–10. [Google Scholar] [CrossRef]
- Abdul Samat, A.; Abdul Hamid, Z.A.; Jaafar, M.; Yahaya, B.H. Mechanical Properties and In Vitro Evaluation of Thermoplastic Polyurethane and Polylactic Acid Blend for Fabrication of 3D Filaments for Tracheal Tissue Engineering. Polymers 2021, 13, 3087. [Google Scholar] [CrossRef] [PubMed]
- Sharma, N.K.; Kumar, V. Studies on properties of banana fiber reinforced green composite. J. Reinf. Plast. Compos. 2013, 32, 525–532. [Google Scholar] [CrossRef]


| S.No. | Previous Work | Work Performed | Current Work Focused Area |
|---|---|---|---|
| 1 | Pilipovic et al. [36] | LOM manufacturing of paper, polymer, and metal sheet by varying the joining or working axis such as Pxy, Pyz, Pzx PVC material single polymeric matrix | (a) Sandwiched structure (b) Epoxy resins used to join the polymer (c) ABS and TPU polymeric matrix |
| 2 | Dermeik et al. [37] | A detailed evaluation of the applicability of LOM in the near net shaping ceramic-based materials. Adjustments for the LOM process and extensions of the LOM machine configuration can improve the economic feasibility its operation | Sandwiched structure of polymeric material of ABS and TPU to evaluate the effect of stiffness and flexible matrix of polymeric materials combined into one functional prototype |
| 3. | Klosterman et al. [38] | Examines interfacial issues that arise when fabricating ceramic (SiC/SiC) and polymer matrix (glass/epoxy) composites using a novel, fully automated rapid prototyping method called laminated object manufacturing (LOM) | Deals with mechanical and morphological properties of multimaterial component of ABS and TPU; interfacial characteristics are not investigated for the present study |
| 4 | Wu et al. [39] | Three-layer sandwiched structure of polystyrene (PS) and poly(vinyl-carbazole) (PVK) as matrix layer for graphene sheets Shape memory effect study | Sandwiched structure of polymeric material of ABS and TPU No foreign infillers to alter the basic properties Deals with laminate characterization for mechanical and morphological properties only |
| S.No. | Printing Parameters | Values |
|---|---|---|
| 1 | Bed temperature | (a) For TPU: 50 °C (b) For ABS: 80 °C |
| 2 | Part Cooling Fan Intensity | For ABS: 0% For TPU: 50% |
| 3 | Nozzle temperature | (a) For TPU: 230 °C (b) For ABS: 240 °C |
| 4 | Infill percentage | 100% |
| 5 | Surface fill | Line at 45° |
| 6 | Printing speed | 40 mm/s |
| 7 | Number of perimeters | 3 |
| 8 | Layer height | 0.12 mm |
| 9 | Layer width | 0.4 mm |
| S.No. | T/T1 | T1 | T2 | Material Combination |
|---|---|---|---|---|
| 1 | 2.25 | 1.47 | 0.36 | ATA (ABS: TPU: ABS) |
| 2 | 2.5 | 1.32 | 0.66 | |
| 3 | 2.75 | 1.20 | 0.90 | |
| 4 | 3 | 1.10 | 1.10 | |
| 5 | 3.25 | 1.02 | 1.27 | |
| 6 | 3.5 | 0.94 | 1.41 | |
| 7 | 3.75 | 0.88 | 1.54 | |
| 8 | 2.25 | 1.47 | 0.36 | TAT (TPU: ABS: TPU) |
| 9 | 2.5 | 1.32 | 0.66 | |
| 10 | 2.75 | 1.20 | 0.90 | |
| 11 | 3 | 1.10 | 1.10 | |
| 12 | 3.25 | 1.02 | 1.27 | |
| 13 | 3.5 | 0.94 | 1.41 | |
| 14 | 3.75 | 0.88 | 1.54 |
| Sample | PL (N) | PE (mm) | BL (N) | BE (mm) | FS (MPa) | FBS (MPa) |
|---|---|---|---|---|---|---|
| ABS | 73 | 5.46 | 65.7 | 11.34 | 64.16 | 57.74 |
| TPU | 12.57 | 55.02 | 11.31 | 55.02 | 6.8 | 5.7 |
| S. No. | Sample | PL (N) | PE (mm) | BL (N) | BE (mm) | FS (MPa) | FBS (MPa) |
|---|---|---|---|---|---|---|---|
| 1 | ATA | 42.1 | 11.34 | 37.89 | 38.64 | 37 | 33.3 |
| 2 | ATA | 39.3 | 15.12 | 35.87 | 35.37 | 36.5 | 34.5 |
| 3 | ATA | 44.6 | 12.6 | 40.14 | 30.03 | 39.2 | 35.28 |
| 4 | ATA | 52.9 | 10.08 | 47.61 | 32.55 | 46.49 | 41.84 |
| 5 | ATA | 41.1 | 8.4 | 36.99 | 33.6 | 36.12 | 32.51 |
| 6 | ATA | 36.7 | 9.45 | 33.03 | 30.66 | 32.26 | 29.03 |
| 7 | ATA | 35.7 | 13.44 | 32.13 | 48.51 | 31.38 | 28.24 |
| S. No. | Sample | PL (N) | PE (mm) | BL (N) | BE (mm) | FS (MPa) | FBS (MPa) |
|---|---|---|---|---|---|---|---|
| 8 | TAT | 8.9 | 40.5 | 7.8 | 53.13 | 7.5 | 6.9 |
| 9 | TAT | 9.9 | 36.91 | 4.41 | 48.85 | 8.31 | 7.1 |
| 10 | TAT | 5.8 | 35.23 | 5.22 | 46.69 | 8.45 | 7.59 |
| 11 | TAT | 7.8 | 34.6 | 7.02 | 44.26 | 8.66 | 8.01 |
| 12 | TAT | 9.8 | 33.65 | 8.82 | 41.79 | 9.61 | 8.75 |
| 13 | TAT | 9.3 | 32.76 | 8.37 | 40.15 | 10.50 | 9.36 |
| 14 | TAT | 14.7 | 30.6 | 13.23 | 39.05 | 12.92 | 11.63 |
| S.No. | Flexural Strength (MPa) | Strain | Modulus of Toughness/Strain Energy Absorbance per Unit Volume (MPa) |
|---|---|---|---|
| 1 | 7.5 | 0.65 | 2.437 |
| 2 | 8.31 | 0.57 | 2.368 |
| 3 | 8.45 | 0.49 | 2.070 |
| 4 | 8.66 | 0.54 | 2.338 |
| 5 | 9.61 | 0.47 | 2.258 |
| 6 | 10.5 | 0.64 | 3.360 |
| 7 | 12.92 | 0.81 | 5.232 |
Publisher’s Note: MDPI stays neutral with regard to jurisdictional claims in published maps and institutional affiliations. |
© 2022 by the authors. Licensee MDPI, Basel, Switzerland. This article is an open access article distributed under the terms and conditions of the Creative Commons Attribution (CC BY) license (https://creativecommons.org/licenses/by/4.0/).
Share and Cite
Kumar, S.; Singh, I.; R. Koloor, S.S.; Kumar, D.; Yahya, M.Y. On Laminated Object Manufactured FDM-Printed ABS/TPU Multimaterial Specimens: An Insight into Mechanical and Morphological Characteristics. Polymers 2022, 14, 4066. https://doi.org/10.3390/polym14194066
Kumar S, Singh I, R. Koloor SS, Kumar D, Yahya MY. On Laminated Object Manufactured FDM-Printed ABS/TPU Multimaterial Specimens: An Insight into Mechanical and Morphological Characteristics. Polymers. 2022; 14(19):4066. https://doi.org/10.3390/polym14194066
Chicago/Turabian StyleKumar, S., I. Singh, S. S. R. Koloor, D. Kumar, and M. Y. Yahya. 2022. "On Laminated Object Manufactured FDM-Printed ABS/TPU Multimaterial Specimens: An Insight into Mechanical and Morphological Characteristics" Polymers 14, no. 19: 4066. https://doi.org/10.3390/polym14194066
APA StyleKumar, S., Singh, I., R. Koloor, S. S., Kumar, D., & Yahya, M. Y. (2022). On Laminated Object Manufactured FDM-Printed ABS/TPU Multimaterial Specimens: An Insight into Mechanical and Morphological Characteristics. Polymers, 14(19), 4066. https://doi.org/10.3390/polym14194066