
Biocompatibility of 3D-Printed PLA, PEEK and PETG: Adhesion of Bone Marrow and Peritoneal Lavage Cells
 , , and
Abstract
:
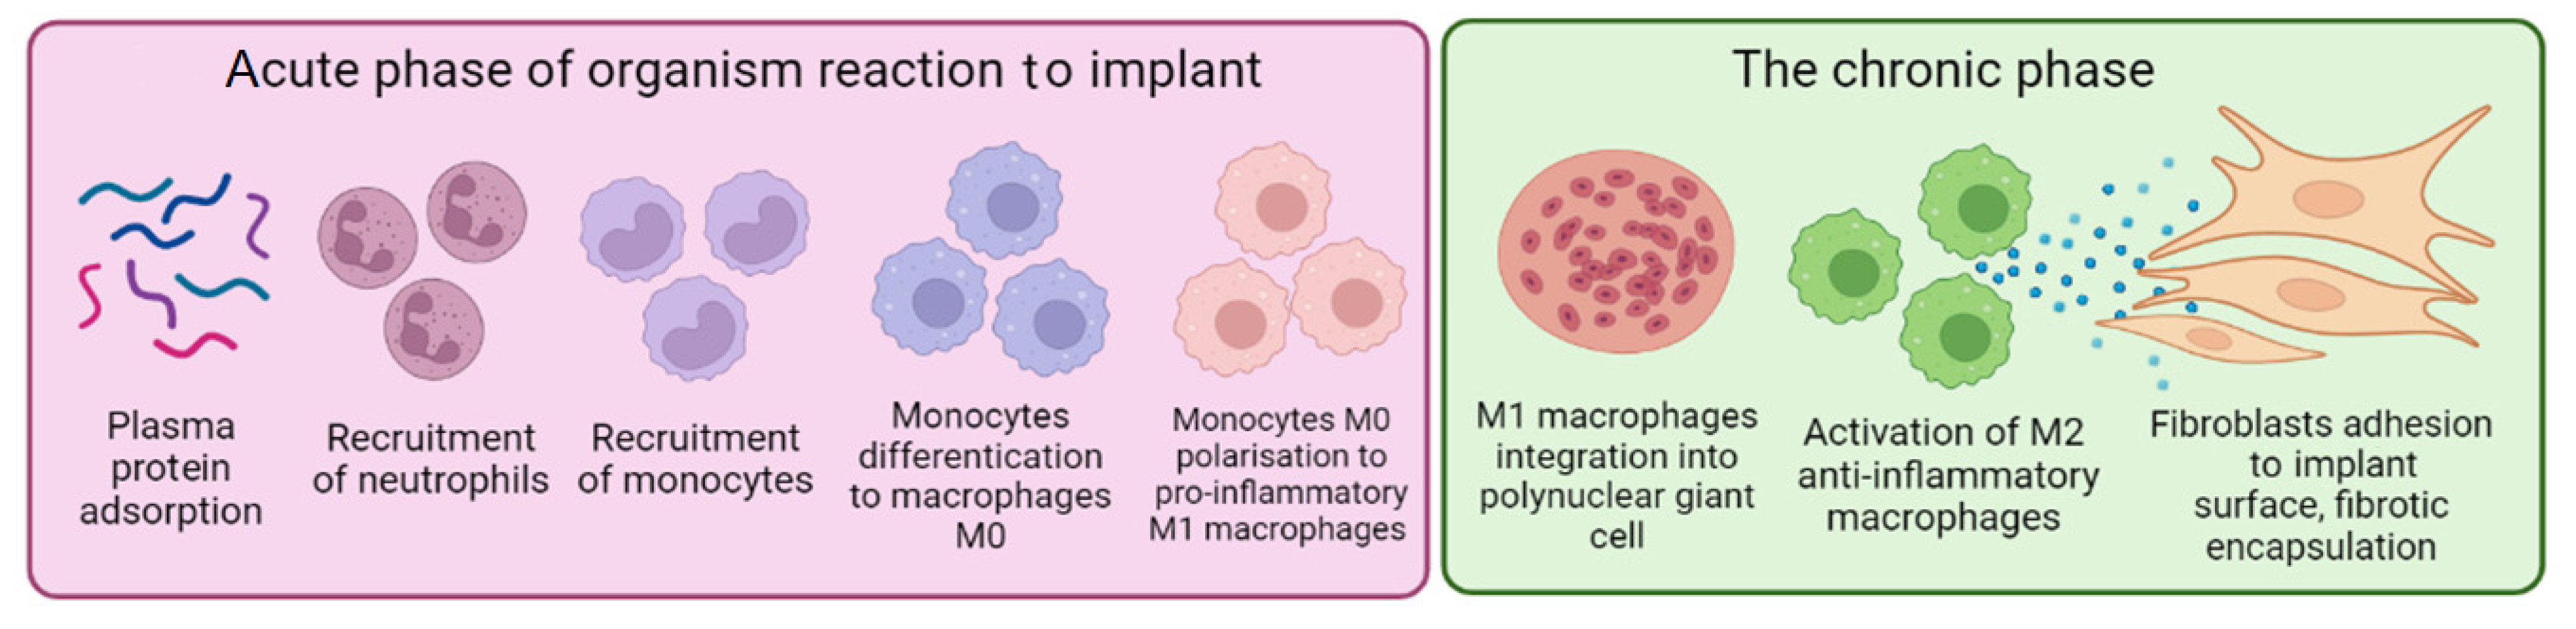
1. Introduction
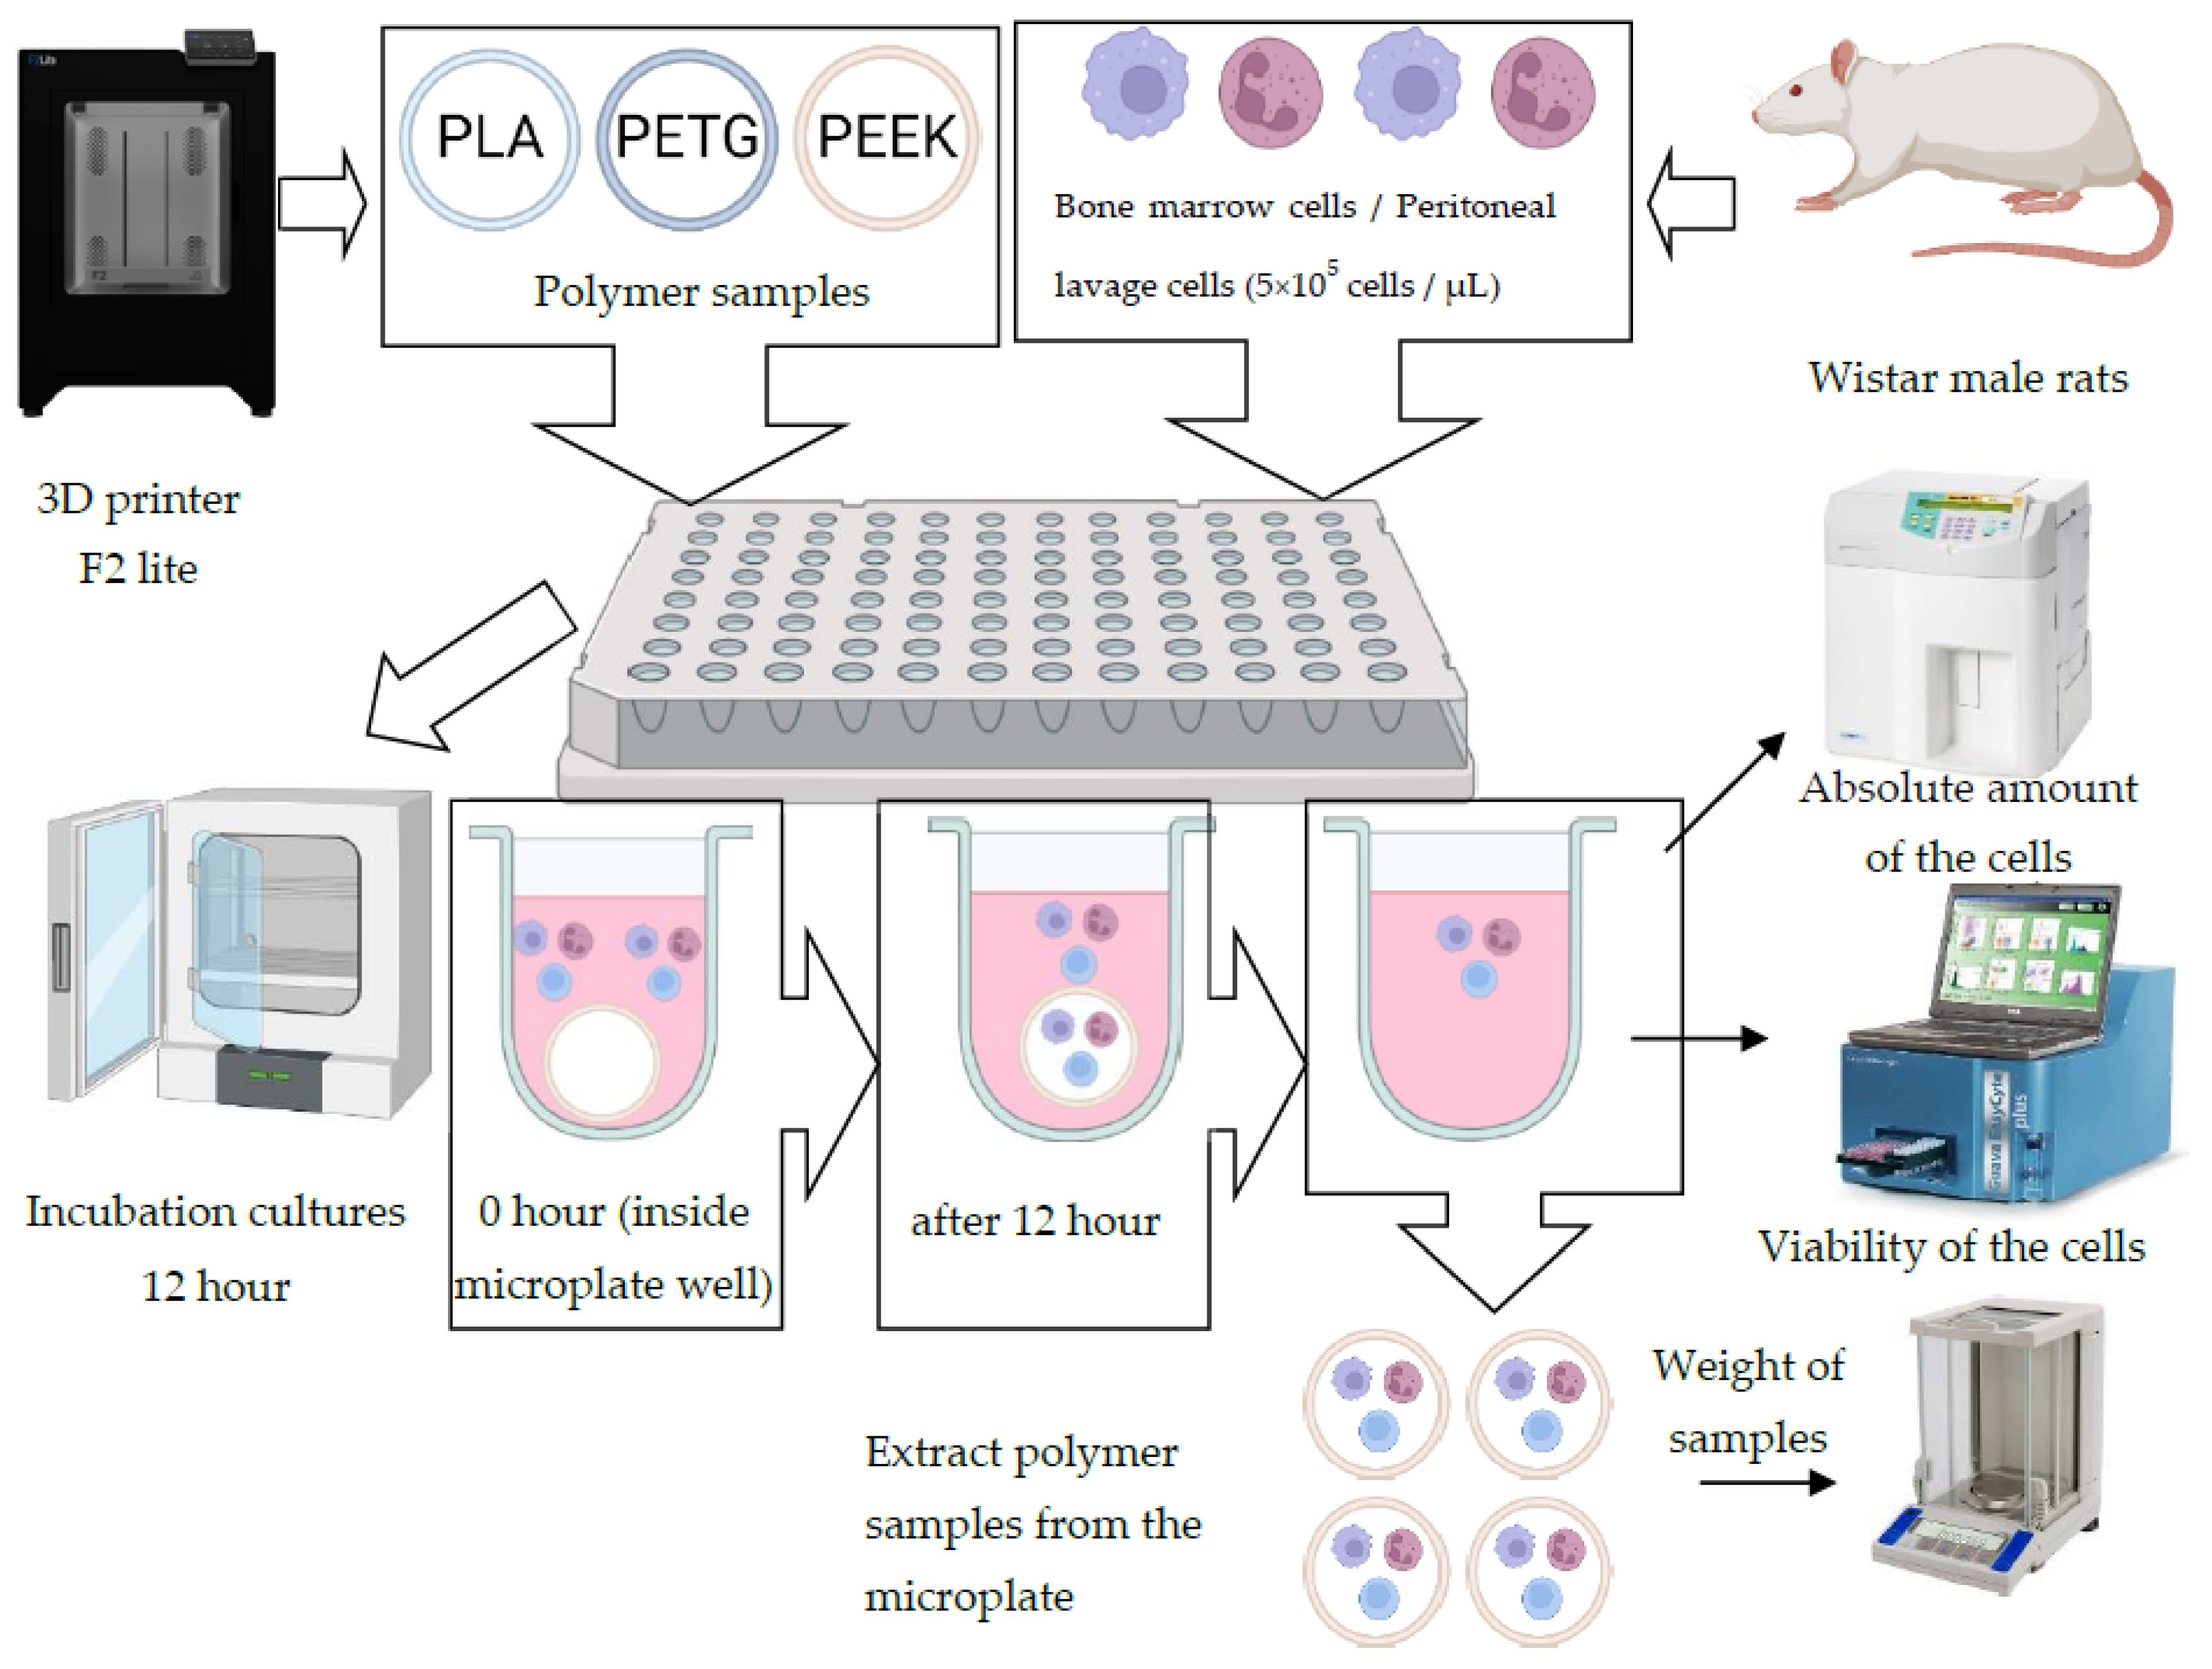
2. Materials and Methods
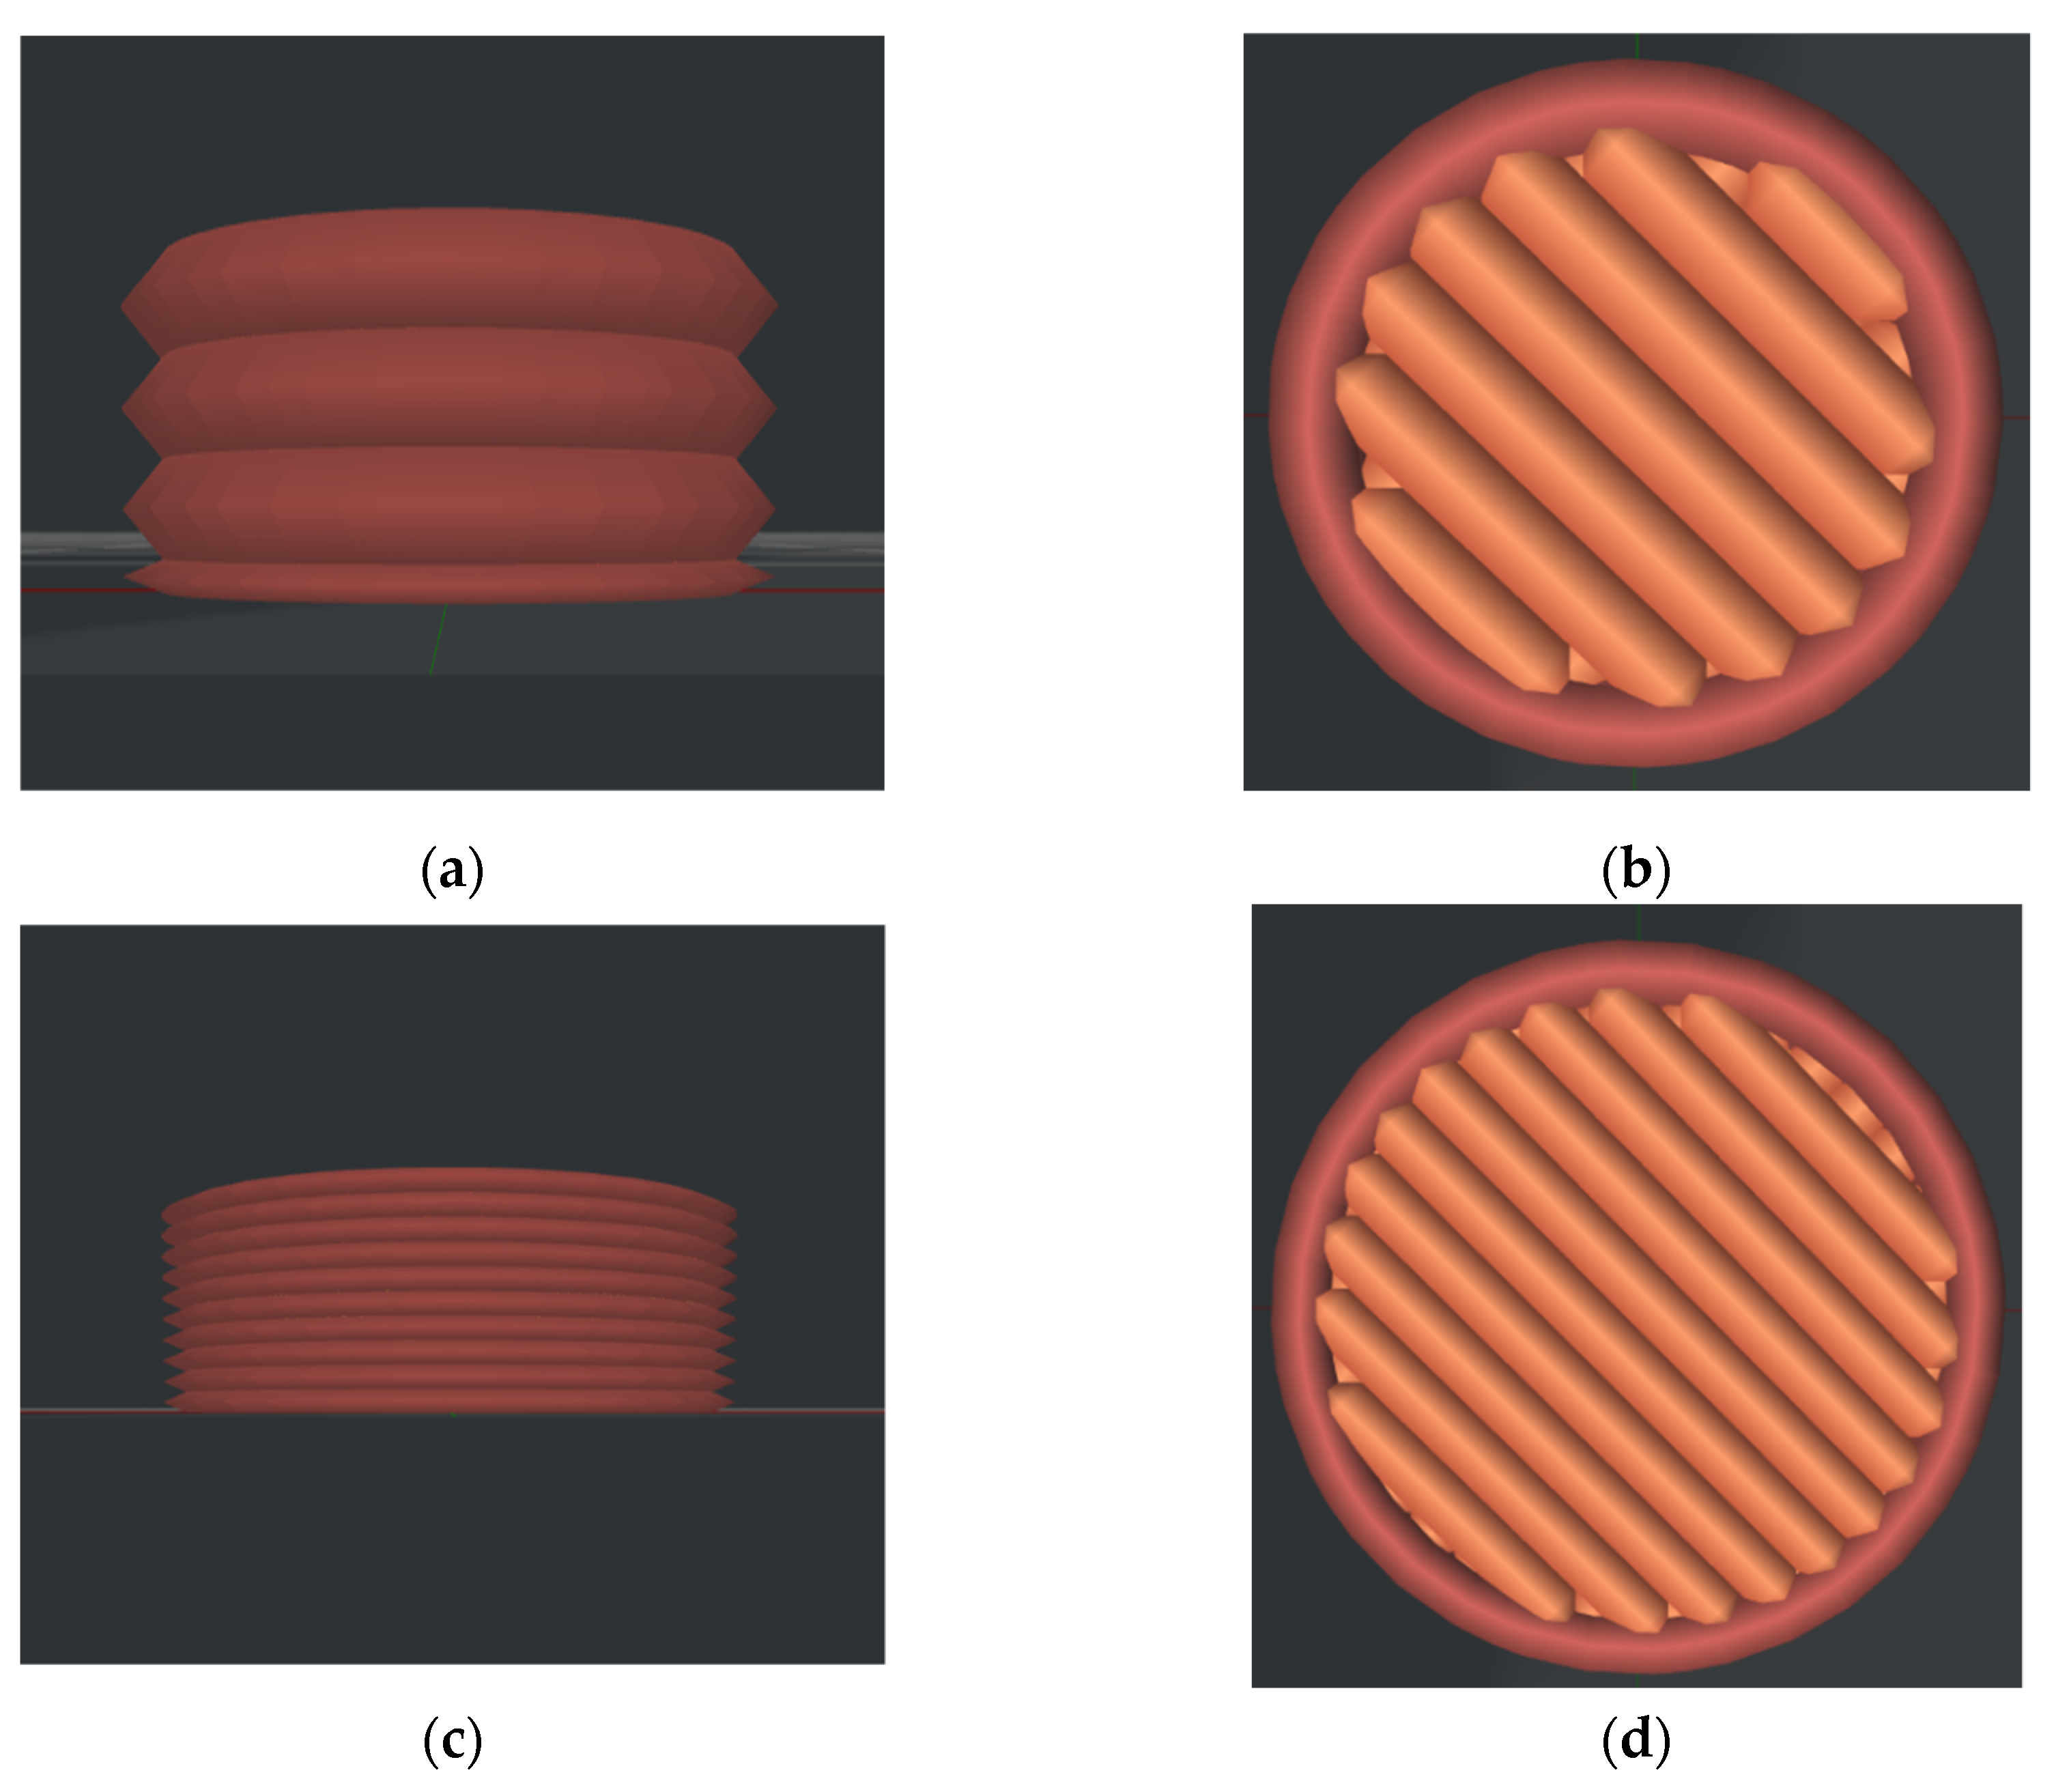
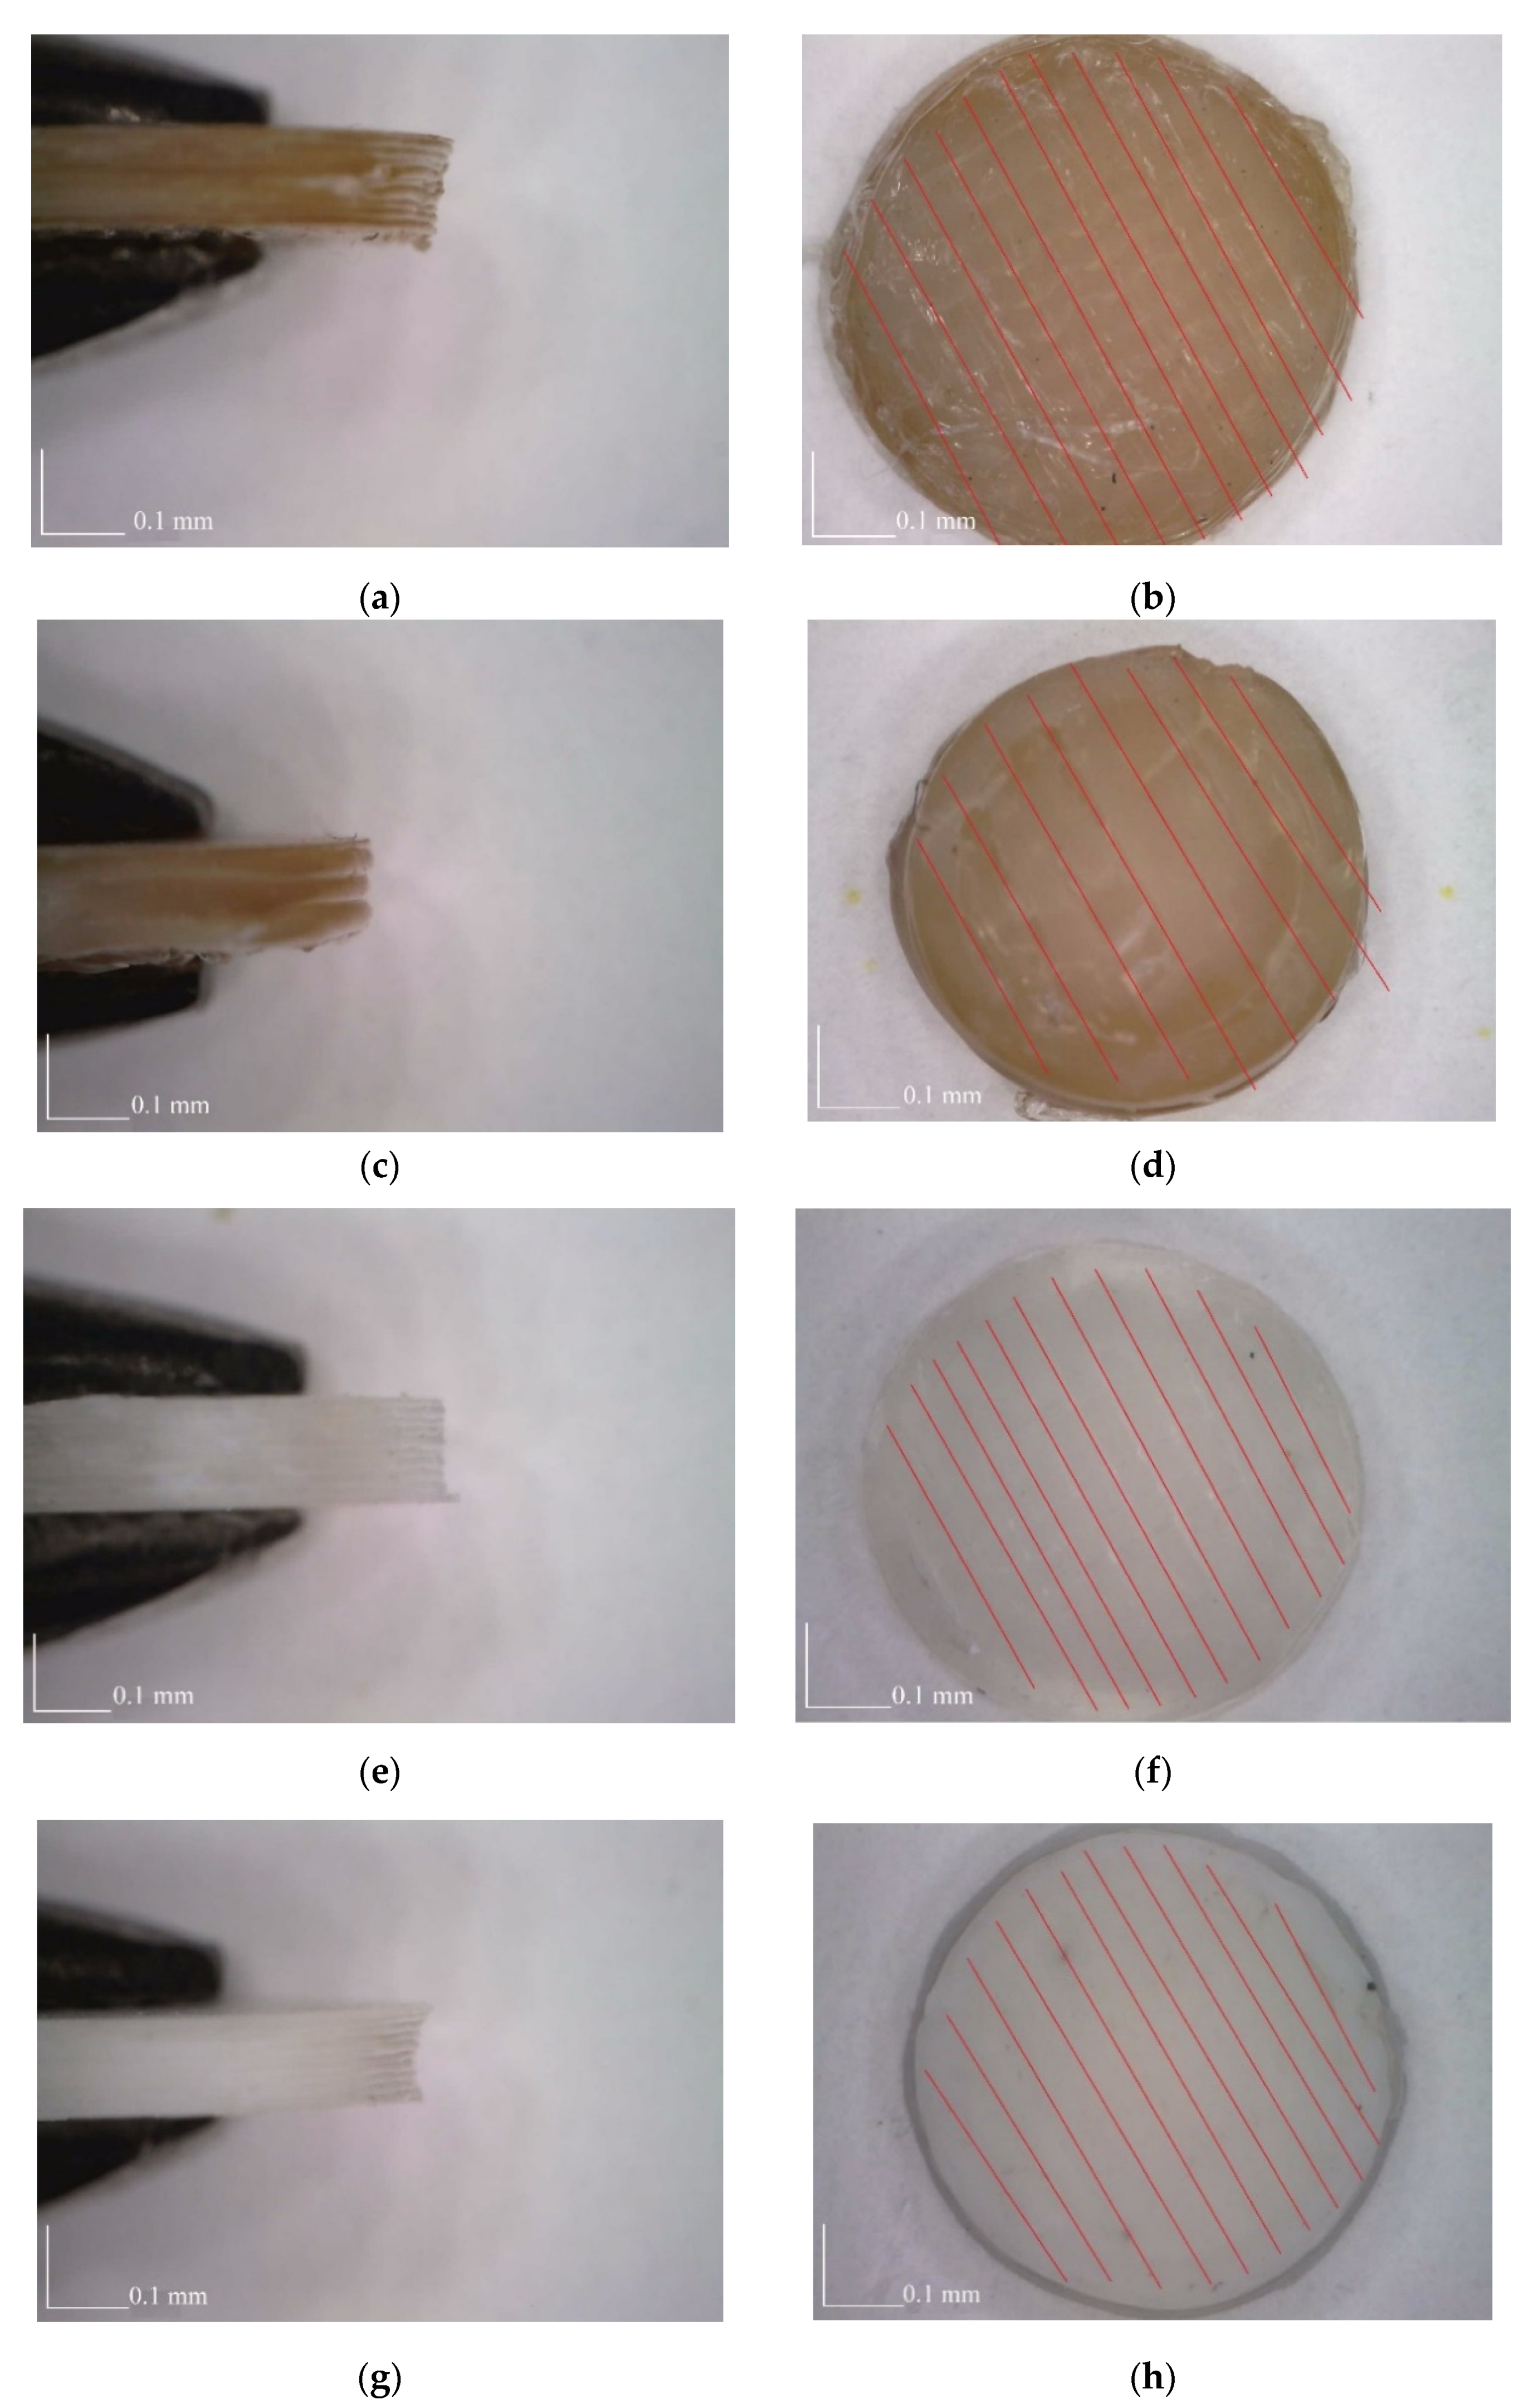
2.1. Materials and Manufacturing of Samples
2.2. Biological Analysis
2.2.1. Materials
2.2.2. Methodology
2.3. Statistical Analysis
3. Results
3.1. Analysis of Cytocompatability
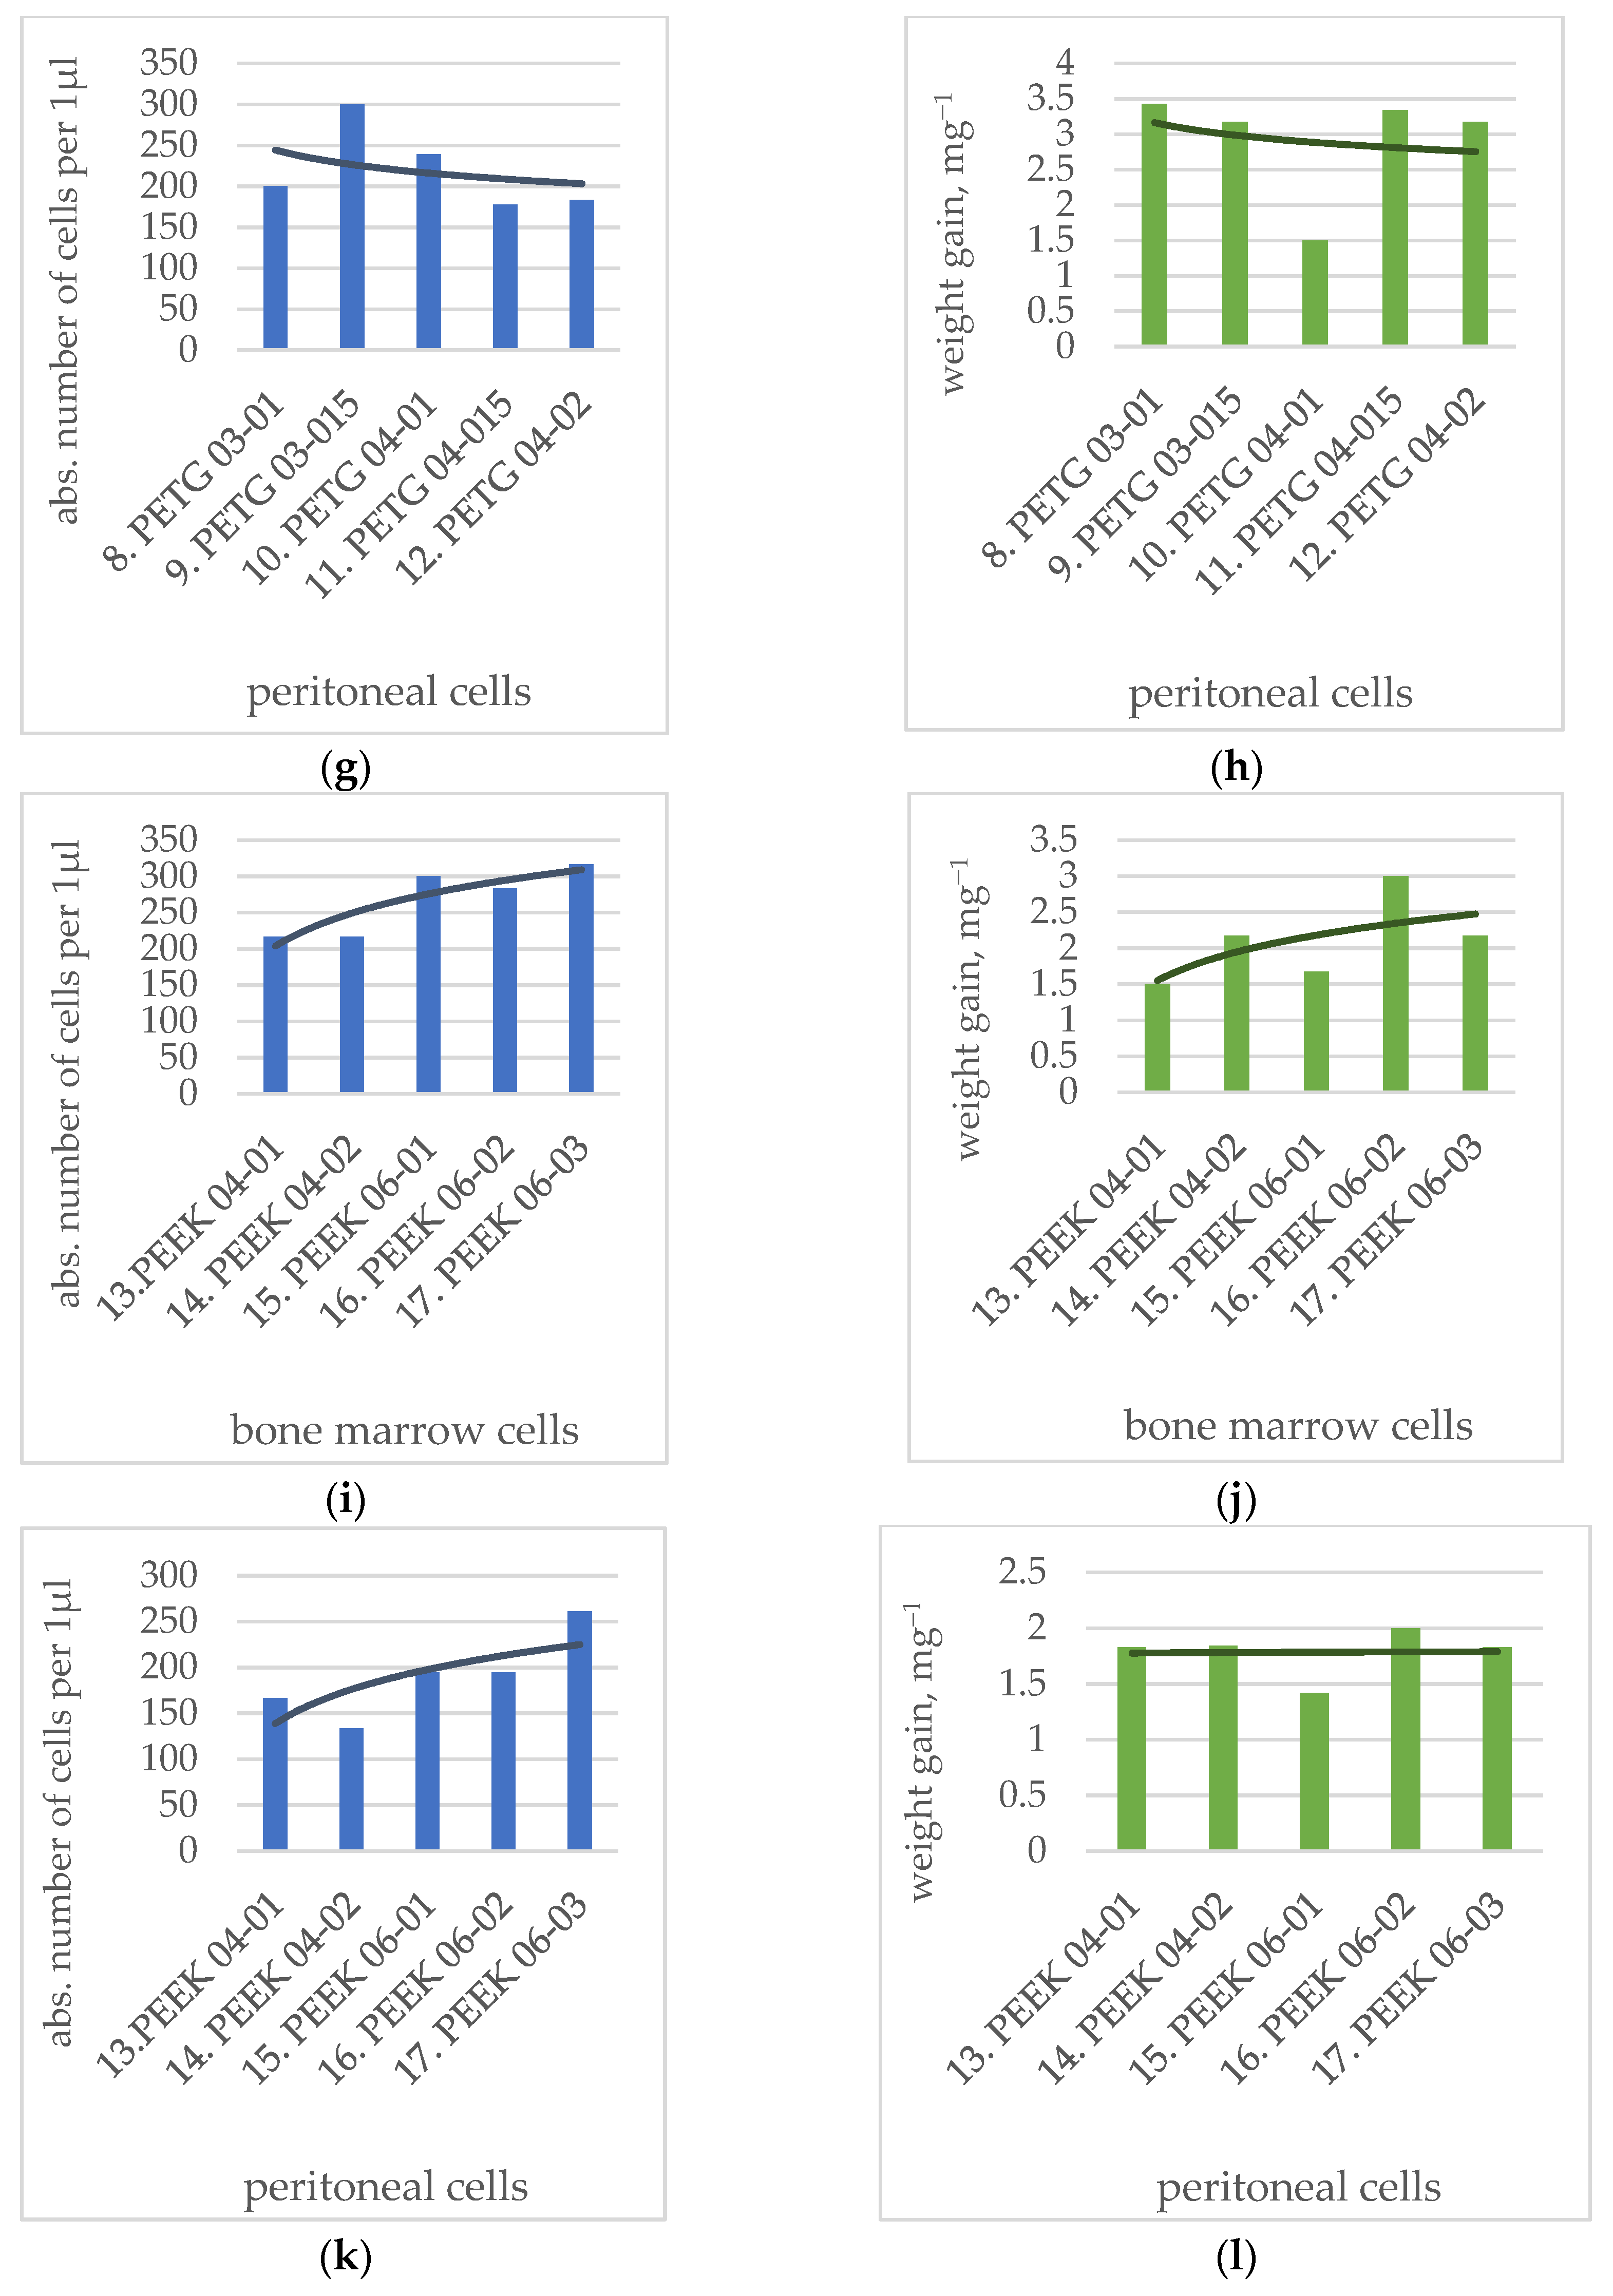
3.2. Analysis of Weight Change
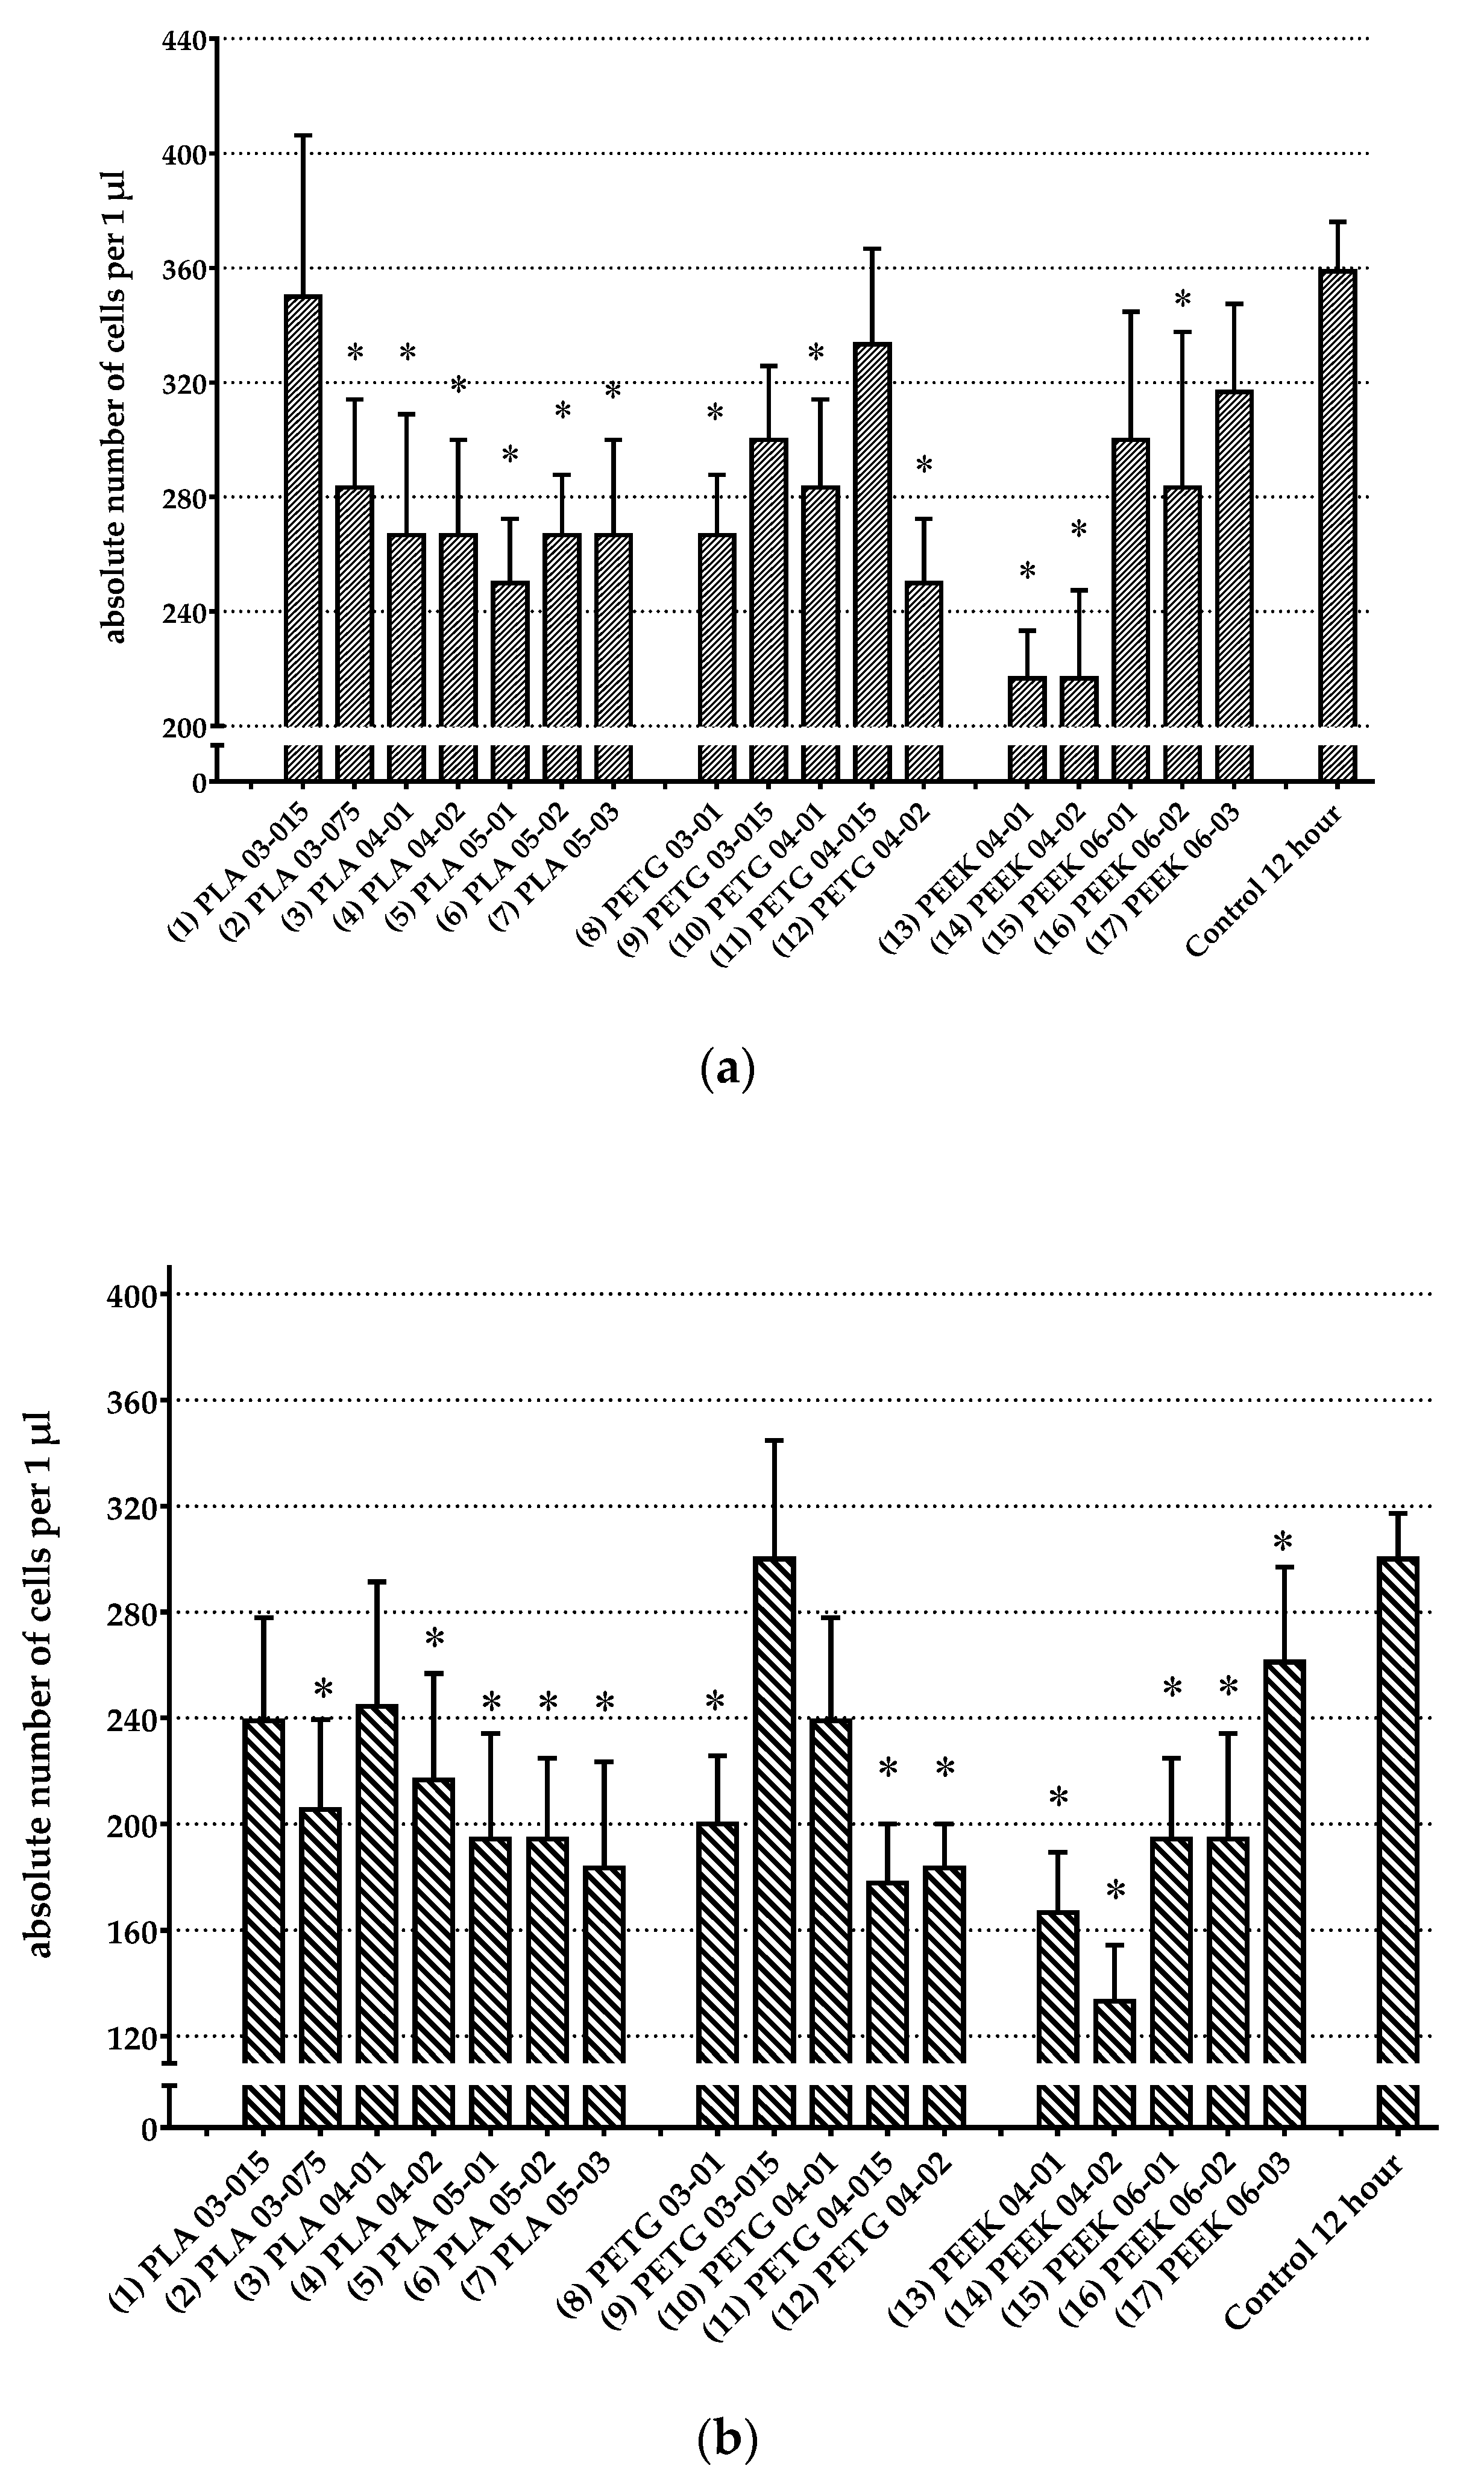
3.3. Analysis of Change in Number of Cells
3.4. SEM Analysis
4. Conclusions
Author Contributions
Funding
Informed Consent Statement
Conflicts of Interest
References
- Đuranović, M.; Madžarević, M.; Ivković, B.; Ibrić, S.; Cvijić, S. The evaluation of the effect of different superdisintegrants on the drug release from fdm 3d printed tablets through different applied strategies: In vitro-in silico assessment. Int. J. Pharm. 2021, 610, 121194. [Google Scholar] [CrossRef] [PubMed]
- Zeng, G.; Schmaranzer, F.; Degonda, C.; Gerber, N.; Gerber, K.; Tannast, M.; Burger, J.; Siebenrock, K.A.; Zheng, G.; Lerch, T.D. Mri-based 3d models of the hip joint enables radiation-free computer-assisted planning of periacetabular osteotomy for treatment of hip dysplasia using deep learning for automatic segmentation. Eur. J. Radiol. Open 2021, 8, 100303. [Google Scholar] [CrossRef] [PubMed]
- Sun, H.; Jia, Y.; Dong, H.; Dong, D.; Zheng, J. Combining additive manufacturing with microfluidics: An emerging method for developing novel organs-on-chips. Curr. Opin. Chem. Eng. 2020, 28, 1–9. [Google Scholar] [CrossRef]
- Zhu, D.; Fu, J.; Wang, L.; Guo, Z.; Wang, Z.; Fan, H. Reconstruction with customized, 3d-printed prosthesis after resection of periacetabular ewing’s sarcoma in children using “triradiate cartilage-based” surgical strategy:A technical note. J. Orthop. Transl. 2021, 28, 108–117. [Google Scholar] [CrossRef] [PubMed]
- He, Y.; Wang, W.; Lin, S.; Yang, Y.; Song, L.; Jing, Y.; Chen, L.; He, Z.; Li, W.; Xiong, A.; et al. Fabrication of a bio-instructive scaffold conferred with a favorable microenvironment allowing for superior implant osseointegration and accelerated in situ vascularized bone regeneration via type h vessel formation. Bioact. Mater. 2022, 9, 491–507. [Google Scholar] [CrossRef] [PubMed]
- Acosta, S.; Canclini, L.; Galarraga, C.; Justet, C.; Alem, D. Lab-made 3d printed stoppers as high-throughput cell migration screening tool. SLAS Technol. 2022, 27, 39–43. [Google Scholar] [CrossRef]
- Seoane-Viaño, I.; Trenfield, S.J.; Basit, A.W.; Goyanes, A. Translating 3d printed pharmaceuticals: From hype to real-world clinical applications. Adv. Drug Deliv. Rev. 2021, 174, 553–575. [Google Scholar] [CrossRef]
- Murr, L.E. Frontiers of 3d printing/additive manufacturing: From human organs to aircraft fabrication. J. Mater. Sci. Technol. 2016, 32, 987–995. [Google Scholar] [CrossRef]
- Ngo, T.D.; Kashani, A.; Imbalzano, G.; Nguyen, K.T.Q.; Hui, D. Additive manufacturing (3d printing): A review of materials, methods, applications and challenges. Compos. Part B Eng. 2018, 143, 172–196. [Google Scholar] [CrossRef]
- Amirtharaj Mosas, K.K.; Chandrasekar, A.R.; Dasan, A.; Pakseresht, A.; Galusek, D. Recent advancements in materials and coatings for biomedical implants. Gels 2022, 8, 323. [Google Scholar] [CrossRef]
- Dang, T.T.; Nikkhah, M.; Memic, A.; Khademhosseini, A. Chapter 19—Polymeric biomaterials for implantable prostheses. In Natural and Synthetic Biomedical Polymers; Kumbar, S.G., Laurencin, C.T., Deng, M., Eds.; Elsevier: Oxford, UK, 2014; pp. 309–331. [Google Scholar]
- Nagarajan, S.; Reddy, B.S.R. Bio-absorbable polymers in implantation-An overview. J. Sci. Ind. Res. 2009, 68, 993–1009. [Google Scholar]
- Jamari, J.; Ammarullah, M.I.; Santoso, G.; Sugiharto, S.; Supriyono, T.; Prakoso, A.T.; Basri, H.; van der Heide, E. Computational Contact Pressure Prediction of CoCrMo, SS 316L and Ti6Al4V Femoral Head against UHMWPE Acetabular Cup under Gait Cycle. J. Funct. Biomater. 2022, 13, 64. [Google Scholar] [CrossRef] [PubMed]
- Anderson, J.M. Inflammatory response to implants. ASAIO Trans. 1988, 34, 101–107. [Google Scholar] [CrossRef] [PubMed]
- Yanez, M.; Blanchette, J.; Jabbarzadeh, E. Modulation of inflammatory response to implanted biomaterials using natural compounds. Curr. Pharm. Des. 2017, 23, 6347–6357. [Google Scholar] [CrossRef] [PubMed]
- Carnicer-Lombarte, A.; Chen, S.-T.; Malliaras, G.G.; Barone, D.G. Foreign body reaction to implanted biomaterials and its impact in nerve neuroprosthetics. Front. Bioeng. Biotechnol. 2021, 9, 622524. [Google Scholar] [CrossRef]
- Franz, S.; Rammelt, S.; Scharnweber, D.; Simon, J.C. Immune responses to implants—A review of the implications for the design of immunomodulatory biomaterials. Biomaterials 2011, 32, 6692–6709. [Google Scholar] [CrossRef]
- Zaveri, T.D.; Lewis, J.S.; Dolgova, N.V.; Clare-Salzler, M.J.; Keselowsky, B.G. Integrin-directed modulation of macrophage responses to biomaterials. Biomaterials 2014, 35, 3504–3515. [Google Scholar] [CrossRef]
- Rausch, M.A.; Shokoohi-Tabrizi, H.; Wehner, C.; Pippenger, B.E.; Wagner, R.S.; Ulm, C.; Moritz, A.; Chen, J.; Andrukhov, O. Impact of implant surface material and microscale roughness on the initial attachment and proliferation of primary human gingival fibroblasts. Biology 2021, 10, 356. [Google Scholar] [CrossRef]
- Scarritt, M.E.; Londono, R.; Badylak, S.F. Host response to implanted materials and devices: An overview. In The Immune Response to Implanted Materials and Devices: The Impact of the Immune System on the Success of an Implant; Corradetti, B., Ed.; Springer International Publishing: Cham, Switzerland, 2017; pp. 1–14. [Google Scholar]
- Chauvel-Lebret, D.J.; Auroy, P.; Bonnaure-Mallet, M. Biocompatibility of elastomers. In Polymeric Biomaterials, Revised and Expanded; CRC Press: Boca Raton, FL, USA, 2001; pp. 325–374. [Google Scholar]
- Wilson, C.J.; Clegg, R.E.; Leavesley, D.I.; Pearcy, M.J. Mediation of biomaterial–cell interactions by adsorbed proteins: A review. Tissue Eng. 2005, 11, 1–18. [Google Scholar] [CrossRef]
- Schoen, F.J. Chapter ii.2.1—Introduction: “Biological responses to biomaterials”. In Biomaterials Science, 3rd ed.; Ratner, B.D., Hoffman, A.S., Schoen, F.J., Lemons, J.E., Eds.; Academic Press: Cambridge, MA, USA, 2013; pp. 499–503. [Google Scholar]
- Abu-Amer, Y.; Darwech, I.; Clohisy, J.C. Aseptic loosening of total joint replacements: Mechanisms underlying osteolysis and potential therapies. Arthritis Res. Ther. 2007, 9, S6. [Google Scholar] [CrossRef]
- Williams, D.F. On the mechanisms of biocompatibility. Biomaterials 2008, 29, 2941–2953. [Google Scholar] [CrossRef] [PubMed]
- Teo, A.J.T.; Mishra, A.; Park, I.; Kim, Y.-J.; Park, W.-T.; Yoon, Y.-J. Polymeric biomaterials for medical implants and devices. ACS Biomater. Sci. Eng. 2016, 2, 454–472. [Google Scholar] [CrossRef] [PubMed]
- Bridges, A.W.; García, A.J. Anti-inflammatory polymeric coatings for implantable biomaterials and devices. J. Diabetes Sci. Technol. 2008, 2, 984–994. [Google Scholar] [CrossRef] [PubMed]
- Gorbet, M.B.; Sefton, M.V. Biomaterial-associated thrombosis: Roles of coagulation factors, complement, platelets and leukocytes. Biomaterials 2004, 25, 5681–5703. [Google Scholar] [CrossRef] [PubMed]
- Dang, T.T.; Bratlie, K.M.; Bogatyrev, S.R.; Chen, X.Y.; Langer, R.; Anderson, D.G. Spatiotemporal effects of a controlled-release anti-inflammatory drug on the cellular dynamics of host response. Biomaterials 2011, 32, 4464–4470. [Google Scholar] [CrossRef]
- Bratlie, K.M.; Dang, T.T.; Lyle, S.; Nahrendorf, M.; Weissleder, R.; Langer, R.; Anderson, D.G. Rapid biocompatibility analysis of materials via in vivo fluorescence imaging of mouse models. PLoS ONE 2010, 5, e10032. [Google Scholar] [CrossRef]
- Coury, A.J. 2.4.2—Chemical and biochemical degradation of polymers intended to be biostable. In Biomaterials Science, 4th ed.; Wagner, W.R., Sakiyama-Elbert, S.E., Zhang, G., Yaszemski, M.J., Eds.; Academic Press: Cambridge, MA, USA, 2020; pp. 919–940. [Google Scholar]
- Zaikov, G.E. Quantitative aspects of polymer degradation in the living body. J. Macromol. Sci. Part C 1985, 25, 551–597. [Google Scholar] [CrossRef]
- Hensten-Pettersen, A.; Jacobsen, N. Systemic toxicity and hypersensitivity. In Biomaterials Science, 3rd ed.; Academic Press: Cambridge, MA, USA, 2013; pp. 545–551. [Google Scholar] [CrossRef]
- Lyu, S.; Untereker, D. Degradability of polymers for implantable biomedical devices. Int. J. Mol. Sci. 2009, 10, 4033–4065. [Google Scholar] [CrossRef] [PubMed]
- Tiwari, A.; Sharma, P.; Vishwamitra, B.; Singh, G. Review on surface treatment for implant infection via gentamicin and antibiotic releasing coatings. Coatings 2021, 11, 1006. [Google Scholar] [CrossRef]
- Bellotto, O.; Semeraro, S.; Bandiera, A.; Tramer, F.; Pavan, N.; Marchesan, S. Polymer conjugates of antimicrobial peptides (amps) with d-amino acids (d-aa): State of the art and future opportunities. Pharmaceutics 2022, 14, 446. [Google Scholar] [CrossRef]
- Hintze, V.; Bierbaum, S.; Scharnweber, D. Chapter 4—Implant surface modifications and new development in surface coatings. In Dental Implants and Bone Grafts; Alghamdi, H., Jansen, J., Eds.; Woodhead Publishing: Thorston, UK, 2020; pp. 89–124. [Google Scholar]
- Alla, R.K.; Ginjupalli, K.; Upadhya, N.; Shammas, M.; Ravi, R.K.; Sekhar, R. Surface roughness of implants: A review. Trends Biomater. Artif. Organs 2011, 25, 112–118. [Google Scholar]
- Wennerberg, A.; Albrektsson, T. On implant surfaces: A review of current knowledge and opinions. Int. J. Oral Maxillofac. Implant. 2010, 25, 63–74. [Google Scholar]
- Arefin, A.M.E.; Khatri, N.R.; Kulkarni, N.; Egan, P.F. Polymer 3d printing review: Materials, process, and design strategies for medical applications. Polymers 2021, 13, 1499. [Google Scholar] [CrossRef] [PubMed]
- Khalaj Amnieh, S.; Mashayekhi, M.; Shahnooshi, E.; Tavafoghi, M.; Mosaddegh, P. Biodegradable performance of pla stents affected by geometrical parameters: The risk of fracture and fragment separation. J. Biomech. 2021, 122, 110489. [Google Scholar] [CrossRef]
- Wang, W.; Zhang, B.; Li, M.; Li, J.; Zhang, C.; Han, Y.; Wang, L.; Wang, K.; Zhou, C.; Liu, L.; et al. 3d printing of pla/n-ha composite scaffolds with customized mechanical properties and biological functions for bone tissue engineering. Compos. Part B Eng. 2021, 224, 109192. [Google Scholar] [CrossRef]
- Gendviliene, I.; Simoliunas, E.; Rekstyte, S.; Malinauskas, M.; Zaleckas, L.; Jegelevicius, D.; Bukelskiene, V.; Rutkunas, V. Assessment of the morphology and dimensional accuracy of 3d printed pla and pla/hap scaffolds. J. Mech. Behav. Biomed. Mater. 2020, 104, 103616. [Google Scholar] [CrossRef]
- Mbogori, M.; Vaish, A.; Vaishya, R.; Haleem, A.; Javaid, M. Poly-ether-ether-ketone (peek) in orthopaedic practice—A current concept review. J. Orthop. Rep. 2022, 1, 3–7. [Google Scholar] [CrossRef]
- Su, Y.; He, J.; Jiang, N.; Zhang, H.; Wang, L.; Liu, X.; Li, D.; Yin, Z. Additively-manufactured poly-ether-ether-ketone (peek) lattice scaffolds with uniform microporous architectures for enhanced cellular response and soft tissue adhesion. Mater. Des. 2020, 191, 108671. [Google Scholar] [CrossRef]
- Oladapo, B.I.; Zahedi, S.A.; Ismail, S.O.; Omigbodun, F.T. 3d printing of peek and its composite to increase biointerfaces as a biomedical material—A review. Colloids Surf. B Biointerfaces 2021, 203, 111726. [Google Scholar] [CrossRef]
- Chubrik, A.; Senatov, F.; Kolesnikov, E.; Orlova, P.; Poponova, M.; Grunina, T.; Bartov, M.; Nikitin, K.; Krivozubov, M.; Generalova, M.; et al. Highly porous peek and peek/ha scaffolds with escherichia coli-derived recombinant bmp-2 and erythropoietin for enhanced osteogenesis and angiogenesis. Polym. Test. 2020, 87, 106518. [Google Scholar] [CrossRef]
- Wang, Y.; Müller, W.-D.; Rumjahn, A.; Schmidt, F.; Schwitalla, A.D. Mechanical properties of fused filament fabricated peek for biomedical applications depending on additive manufacturing parameters. J. Mech. Behav. Biomed. Mater. 2021, 115, 104250. [Google Scholar] [CrossRef] [PubMed]
- Aberoumand, M.; Soltanmohammadi, K.; Soleyman, E.; Rahmatabadi, D.; Ghasemi, I.; Baniassadi, M.; Abrinia, K.; Baghani, M. A comprehensive experimental investigation on 4d printing of pet-g under bending. J. Mater. Res. Technol. 2022, 18, 2552–2569. [Google Scholar] [CrossRef]


| Nozzle Diameter, mm | Layer Height, mm | PLA | PETG | PEEK |
|---|---|---|---|---|
| 0.3 | 0.1 | (8) PETG03-01 | ||
| 0.3 | 0.15 | (1) PLA03-015 | (9) PETG03-015 | |
| 0.3 | 0.75 | (2) PLA03-075 | ||
| 0.4 | 0.1 | (3) PLA04-01 | (10) PETG04-01 | (13) PEEK04-01 |
| 0.4 | 0.15 | (11) PETG04-015 | ||
| 0.4 | 0.2 | (4) PLA04-02 | (12) PETG04-02 | (14) PEEK04-02 |
| 0.5 | 0.1 | (5) PLA05-01 | ||
| 0.5 | 0.2 | (6) PLA05-02 | ||
| 0.5 | 0.3 | (7) PLA05-03 | ||
| 0.6 | 0.1 | (15) PEEK06-01 | ||
| 0.6 | 0.2 | (16) PEEK06-02 | ||
| 0.6 | 0.3 | (17) PEEK06-03 |
| № | Sample | Viability of Bone Marrow Cells, % | Viability of Peritoneal Cells, % |
|---|---|---|---|
| 1 | Control | 87.40 ± 2.19 | 85.67 ± 3.33 |
| 2 | PLA 03-015 | 82.93 ± 3.60 | 77.83 ± 7.67 |
| 3 | PLA 03-075 | 84.28 ± 3.94 | 78.38 ± 7.19 |
| 4 | PLA 04-01 | 83.40 ± 3.73 | 77.48 ± 7.95 |
| 5 | PLA 04-02 | 77.63 ± 5.24 | 76.78 ± 7.95 |
| 6 | PLA 05-01 | 84.07 ± 3.44 | 76.92 ± 7.36 |
| 7 | PLA 05-02 | 86.40 ± 2.20 | 77.08 ± 8.56 |
| 8 | PLA 05-03 | 86.70 ± 2.19 | 75.87 ± 7.58 |
| 9 | PETG 03-01 | 81.43 ± 2.97 | 73.52 ± 8.60 |
| 10 | PETG 03-015 | 84.98 ± 0.21 | 74.67 ± 8.06 |
| 11 | PETG 04-01 | 84.08 ± 2.43 | 75.98 ± 8.23 |
| 12 | PETG 04-015 | 85.68 ± 2.48 | 76.22 ± 8.65 |
| 13 | PETG 04-02 | 84.58 ± 2.87 | 73.35 ± 9.35 |
| 14 | PEEK 04-01 | 82.57 ± 3.16 | 71.72 ± 10.11 |
| 15 | PEEK 04-02 | 82.52 ± 3.04 | 73.65 ± 9.34 |
| 16 | PEEK 06-01 | 77.90 ± 7.06 | 74.85 ± 8.28 |
| 17 | PEEK 06-02 | 80.67 ± 3.88 | 69.58 ± 7.76 |
| 18 | PEEK 06-03 | 85.62 ± 2.60 | 75.22 ± 8.48 |
| № | Sample | Cultivation with Bone Marrow Cells | Cultivation with Peritoneal Cells | ||||
|---|---|---|---|---|---|---|---|
| Initial Weight, mg−1 | Weight after 12 h, mg−1 | p | Initial Weight, mg−1 | Weight after 12 h, mg−1 | p | ||
| 1 | PLA 03-015 | 215.33 ± 0.21 | 219.33 ± 0.71 | * p = 0.00206 | 216.00 ± 0.00 | 219.17 ± 0.48 | * p = 0.00052 |
| 2 | PLA 03-075 | 221.17 ± 0.40 | 225.17 ± 0.95 | * p = 0.01172 | 220.83 ± 0.31 | 225.50 ± 1.34 | * p = 0.02105 |
| 3 | PLA 04-01 | 238.33 ± 1.41 | 242.67 ± 0.99 | * p = 0.01159 | 220.50 ± 8.55 | 225.00 ± 9.30 | * p = 0.00382 |
| 4 | PLA 04-02 | 236.00 ± 0.86 | 240.17 ± 1.58 | * p = 0.00926 | 236.25 ± 1.89 | 240.88 ± 1.97 | * p = 0.00093 |
| 5 | PLA 05-01 | 232.33 ± 0.56 | 236.83 ± 0.79 | * p = 0.00200 | 234.33 ± 0.76 | 237.33 ± 1.09 | * p = 0.00111 |
| 6 | PLA 05-02 | 248.50 ± 0.43 | 252.67 ± 0.49 | * p = 0.00033 | 247.67 ± 0.56 | 251.33 ± 0.76 | * p = 0.00033 |
| 7 | PLA 05-03 | 247.33 ± 1.36 | 252.83 ± 1.64 | * p = 0.01135 | 247.86 ± 0.88 | 252.71 ± 1.63 | * p = 0.00233 |
| 8 | PETG 03-01 | 210.50 ± 0.92 | 213.67 ± 0.88 | * p = 0.00117 | 210.57 ± 0.90 | 214.00 ± 0.85 | * p = 0.00187 |
| 9 | PETG 03-015 | 210.33 ± 0.21 | 213.67 ± 0.84 | * p = 0.00889 | 211.33 ± 0.33 | 214.50 ± 0.22 | * p = 0.00209 |
| 10 | PETG 04-01 | 224.33 ± 0.21 | 227.67 ± 0.76 | * p = 0.01082 | 224.33 ± 0.49 | 225.83 ± 0.87 | * p = 0.01722 |
| 11 | PETG 04-015 | 222.00 ± 0.37 | 225.50 ± 0.76 | * p = 0.00342 | 222.33 ± 0.21 | 225.67 ± 0.61 | * p = 0.00289 |
| 12 | PETG 04-02 | 229.67 ± 0.21 | 234.00 ± 1.06 | * p = 0.00817 | 229.83 ± 0.17 | 233.00 ± 0.97 | * p = 0.01506 |
| 13 | PEEK 04-01 | 245.50 ± 1.34 | 247.00 ± 1.93 | p > 0.05 | 244.67 ± 1.54 | 246.50 ± 2.01 | p > 0.05 |
| 14 | PEEK 04-02 | 271.50 ± 2.25 | 273.67 ± 2.58 | p > 0.05 | 271.83 ± 3.20 | 273.67 ± 3.28 | * p = 0.01211 |
| 15 | PEEK 06-01 | 229.83 ± 0.40 | 231.50 ± 0.56 | p > 0.05 | 227.29 ± 1.49 | 228.71 ± 1.43 | * p = 0.00824 |
| 16 | PEEK 06-02 | 195.33 ± 0.42 | 198.33 ± 1.02 | * p = 0.02340 | 195.00 ± 0.26 | 197.00 ± 0.77 | * p = 0.01796 |
| 17 | PEEK 06-03 | 144.50 ± 0.56 | 146.67 ± 0.84 | * p = 0.02118 | 145.17 ± 0.60 | 147.00 ± 0.45 | * p = 0.03786 |
| № | Polymer Type | Cultivation with Bone Marrow Cells | Cultivation with Peritoneal Cells | ||
|---|---|---|---|---|---|
| Absolute Number of Cells per 1 µL | p | Absolute Number of Cells per 1 µL | p | ||
| 1 | PLA 03-015 | 350.00 ± 56.27 | p > 0.05 | 238.89 ± 38.89 | p > 0.05 |
| 2 | PLA 03-075 | 283.33 ± 30.73 | * p = 0.02647 | 205.56 ± 33.79 | * p = 0.01129 |
| 3 | PLA 04-01 | 266.67 ± 42.16 | * p = 0.01081 | 244.44 ± 46.88 | p > 0.05 |
| 4 | PLA 04-02 | 266.67 ± 33.33 | * p = 0.01026 | 216.67 ± 40.14 | * p = 0.02187 |
| 5 | PLA 05-01 | 250.00 ± 22.36 | * p = 0.00414 | 194.44 ± 39.83 | * p = 0.00585 |
| 6 | PLA 05-02 | 266.67 ± 21.08 | * p = 0.01225 | 194.44 ± 30.33 | * p = 0.00653 |
| 7 | PLA 05-03 | 266.67 ± 33.33 | * p = 0.01180 | 183.33 ± 40.14 | * p = 0.00326 |
| 8 | PETG 03-01 | 266.67 ± 21.08 | * p = 0.01133 | 200.00 ± 25.82 | * p = 0.00820 |
| 9 | PETG 03-015 | 300.00 ± 25.82 | p > 0.05 | 300.00 ± 44.82 | p > 0.05 |
| 10 | PETG 04-01 | 283.33 ± 30.73 | * p = 0.02798 | 238.89 ± 38.89 | p > 0.05 |
| 11 | PETG 04-015 | 333.33 ± 33.33 | p > 0.05 | 177.78 ± 22.22 | * p = 0.00219 |
| 12 | PETG 04-015 | 250.00 ± 22.36 | * p = 0.00398 | 183.33 ± 16.67 | * p = 0.00312 |
| 13 | PEEK 04-01 | 216.67 ± 16.67 | * p = 0.00029 | 166.67 ± 22.77 | * p = 0.00091 |
| 14 | PEEK 04-02 | 216.67 ± 30.73 | * p = 0.00028 | 133.33 ± 21.08 | * p = 0.00005 |
| 15 | PEEK 06-01 | 300.00 ± 44.72 | p > 0.05 | 194.44 ± 30.33 | * p = 0.00620 |
| 16 | PEEK 06-02 | 283.33 ± 54.26 | * p = 0.02477 | 194.44 ± 39.83 | * p = 0.00684 |
| 17 | PEEK 06-03 | 316.67 ± 30.73 | p > 0.05 | 261.11 ± 35.95 | p > 0.05 |
| 18 | Control 12 h | 358.82 ± 17.28 | 300.00 ± 17.15 | ||
Publisher’s Note: MDPI stays neutral with regard to jurisdictional claims in published maps and institutional affiliations. |
© 2022 by the authors. Licensee MDPI, Basel, Switzerland. This article is an open access article distributed under the terms and conditions of the Creative Commons Attribution (CC BY) license (https://creativecommons.org/licenses/by/4.0/).
Share and Cite
Shilov, S.Y.; Rozhkova, Y.A.; Markova, L.N.; Tashkinov, M.A.; Vindokurov, I.V.; Silberschmidt, V.V. Biocompatibility of 3D-Printed PLA, PEEK and PETG: Adhesion of Bone Marrow and Peritoneal Lavage Cells. Polymers 2022, 14, 3958. https://doi.org/10.3390/polym14193958
Shilov SY, Rozhkova YA, Markova LN, Tashkinov MA, Vindokurov IV, Silberschmidt VV. Biocompatibility of 3D-Printed PLA, PEEK and PETG: Adhesion of Bone Marrow and Peritoneal Lavage Cells. Polymers. 2022; 14(19):3958. https://doi.org/10.3390/polym14193958
Chicago/Turabian StyleShilov, Stanislav Y., Yulia A. Rozhkova, Lubov N. Markova, Mikhail A. Tashkinov, Ilya V. Vindokurov, and Vadim V. Silberschmidt. 2022. "Biocompatibility of 3D-Printed PLA, PEEK and PETG: Adhesion of Bone Marrow and Peritoneal Lavage Cells" Polymers 14, no. 19: 3958. https://doi.org/10.3390/polym14193958
APA StyleShilov, S. Y., Rozhkova, Y. A., Markova, L. N., Tashkinov, M. A., Vindokurov, I. V., & Silberschmidt, V. V. (2022). Biocompatibility of 3D-Printed PLA, PEEK and PETG: Adhesion of Bone Marrow and Peritoneal Lavage Cells. Polymers, 14(19), 3958. https://doi.org/10.3390/polym14193958