1. Introduction
The evaluation of the degradation and failure of materials and structures has been an important research topic in the past century, due to the ever-growing need of precise dimensioning of load-bearing structures. The first studies regarding structural integrity laid the foundations of fracture mechanics and were focused on the nucleation and propagation of cracks, as well as the conditions in which these types of defects can lead to a premature failure of a component [
1,
2,
3,
4]. Though very successful in the lifetime prediction of components subjected to fatigue loadings or the case of structural defects that cause high degrees of stress concentration (i.e., crack propagation), the principles of fracture mechanics cannot be implemented in static or dynamic applications where the failure was caused by loads that exceed the strength of the material.
In contrast to the microscopic approach used in fracture mechanics, Nobel laureate in Physics Percy Williams Bridgman proposed a phenomenological failure model for ductile materials based on the equivalent plastic strain
and the stress triaxiality
in the critical region [
5]. The concept behind this approach is that, at the onset of damage, the local strain increases drastically when compared to the global strain of the body (an example of this phenomenon is the necking observed in tensile tests on ductile materials).
The equivalent plastic strain
is a scalar that can be determined based on the plastic strain rate tensor components
and the equivalent stress
defined by a given yield criterion, using the principle of energetic conjugates [
6].
For the von Mises equivalent stress, the equivalent plastic strain
is based on the second invariant of the plastic strain tensor and has the relation
The stress triaxiality
is a scalar value based on the first invariant
of the stress tensor
and the second invariant
of the deviatoric stress tensor
In engineering terms, the stress triaxiality can be expressed as the hydrostatic stress
divided by the von Mises equivalent stress
.
According to Bridgman’s hypothesis, the critical equivalent plastic strain (that determines the localized failure of the material) varies with the stress triaxiality for a given material. This principle was based on the experimental observation that, during loading, ductile metals exhibit nucleation of voids in their structure, that increase with straining, ultimately leading to the failure of the specimen.
Based on experimental data gathered from several materials, Gordon R. Johnson and William H. Cook proposed an analytical function that describes the variation of the critical equivalent plastic strain
with the stress triaxiality
, the equivalent plastic strain rate
and the homogenous temperature
[
7].
where
and
are material constants.
Further developments of the ductile damage criterion considered a more complete description of the stress state by taking into account the influenced by the third invariant of the deviatoric stress tensor
, through the Lode angle
, which represents the angular coordinate of the cylindrical frame of reference of the Haigh–Westergaard stress space [
8].
The current approach in dealing with the influence of the third invariant of the deviatoric stress tensor
considers the Lode angle parameter
, defined as [
9,
10]
The successful failure prediction of metals using the ductile failure models implemented in finite element analysis software is well documented in literature [
10,
11,
12] and, in recent years, it has been applied to polymeric materials with good results [
13,
14], considering the limited model calibration data.
Once the damage initiation criterion is achieved, the progressive damage and failure of the material can be modelled using a damage evolution function, that gradually diminishes the effective stress tensor components by considering various parameters (usually, equivalent plastic strain or strain energy) [
14,
15].
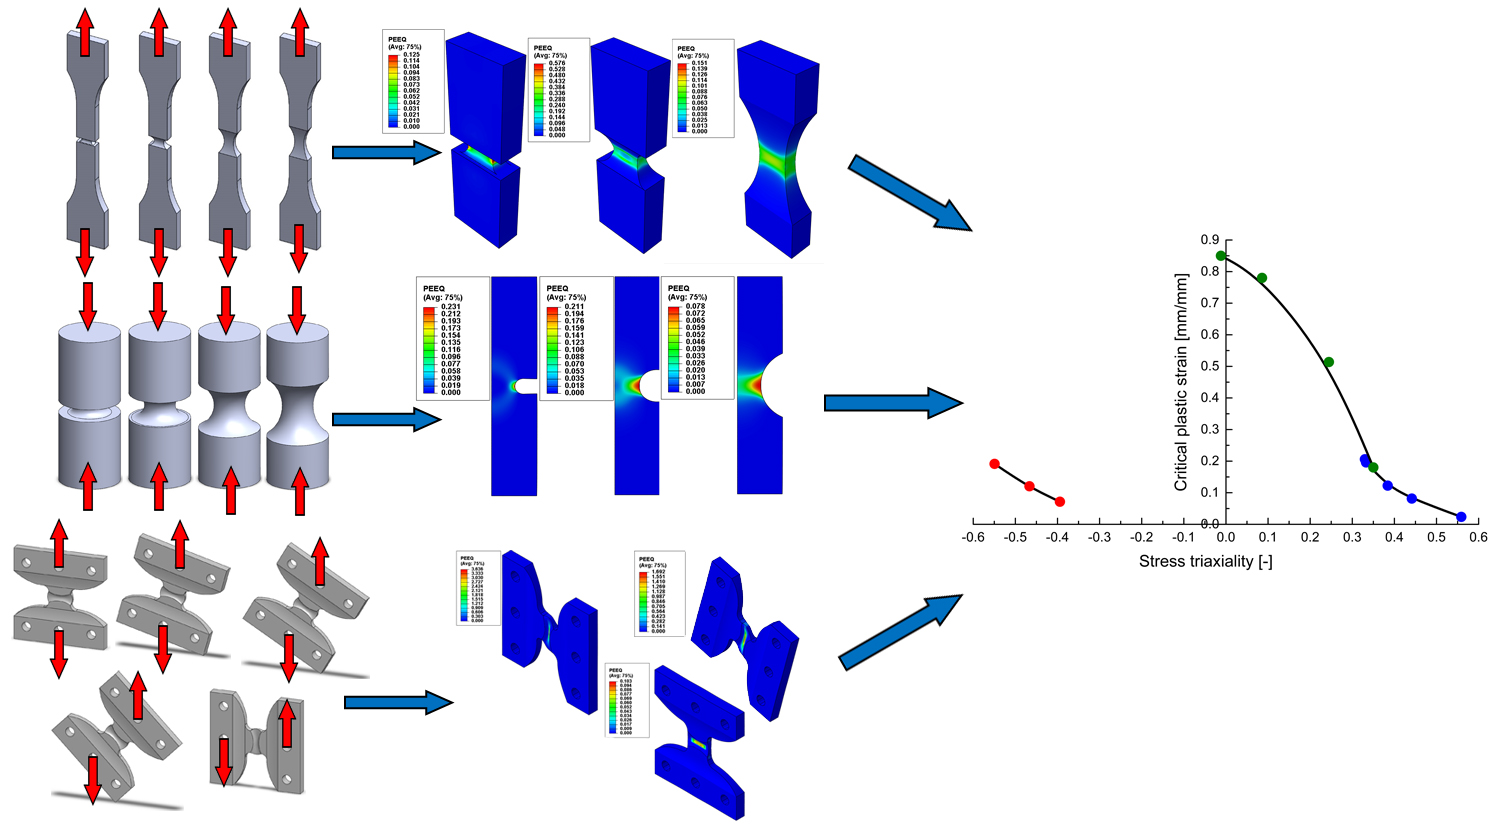
The aim of this study is to perform a series of experimental procedures for various loading conditions (tension, compression, shear) on specimens with special geometries, that can determine a wide range of variation for the stress triaxiality and the Lode angle parameter and eventually determine the variation of the critical plastic strain with the aforementioned parameters. Considering the fact that the machining of polymers can alter their mechanical behaviour in a significant manner [
16] and that the development cost of specialized injection moulds for each geometry is costly, the evaluation of testing protocols designed for metals will be performed on rapid prototyped parts. All the specimens presented in this study were manufactured through photopolymerization, using the PolyJet technology [
17,
18,
19]. The material used has the commercial name VeroWhitePlus™ RGD835, and represents an ABS based proprietary blend manufactured by Stratasys [
20].
The experimental procedures consisted of tensile tests on flat notched specimens, upsetting tests on cylindrical and round notched specimens and Arcan tests, with five specimens being tested for each geometry/loading condition. A low dispersion of results was observed for each set of identical tests, the largest recorded standard deviations being 7% for the stiffness (Arcan tests at 15° orientation) and 9% for the recorded strength (upsetting tests for the specimens with a notch radius of 6.67 mm). Finite element analyses were used to replicate the experimental procedures and determine the variation of the investigated parameters in the critical region. Considering the low dispersion of results for all the tests performed, the most representative stress–strain curves for each specimen type/loading condition (ones exhibiting the stiffness and strength closest to the average values) were used as a benchmark for the comparison with the numerical data (hence, only one simulation was performed for each specimen type/loading condition).
2. Tensile Tests on Flat Specimens
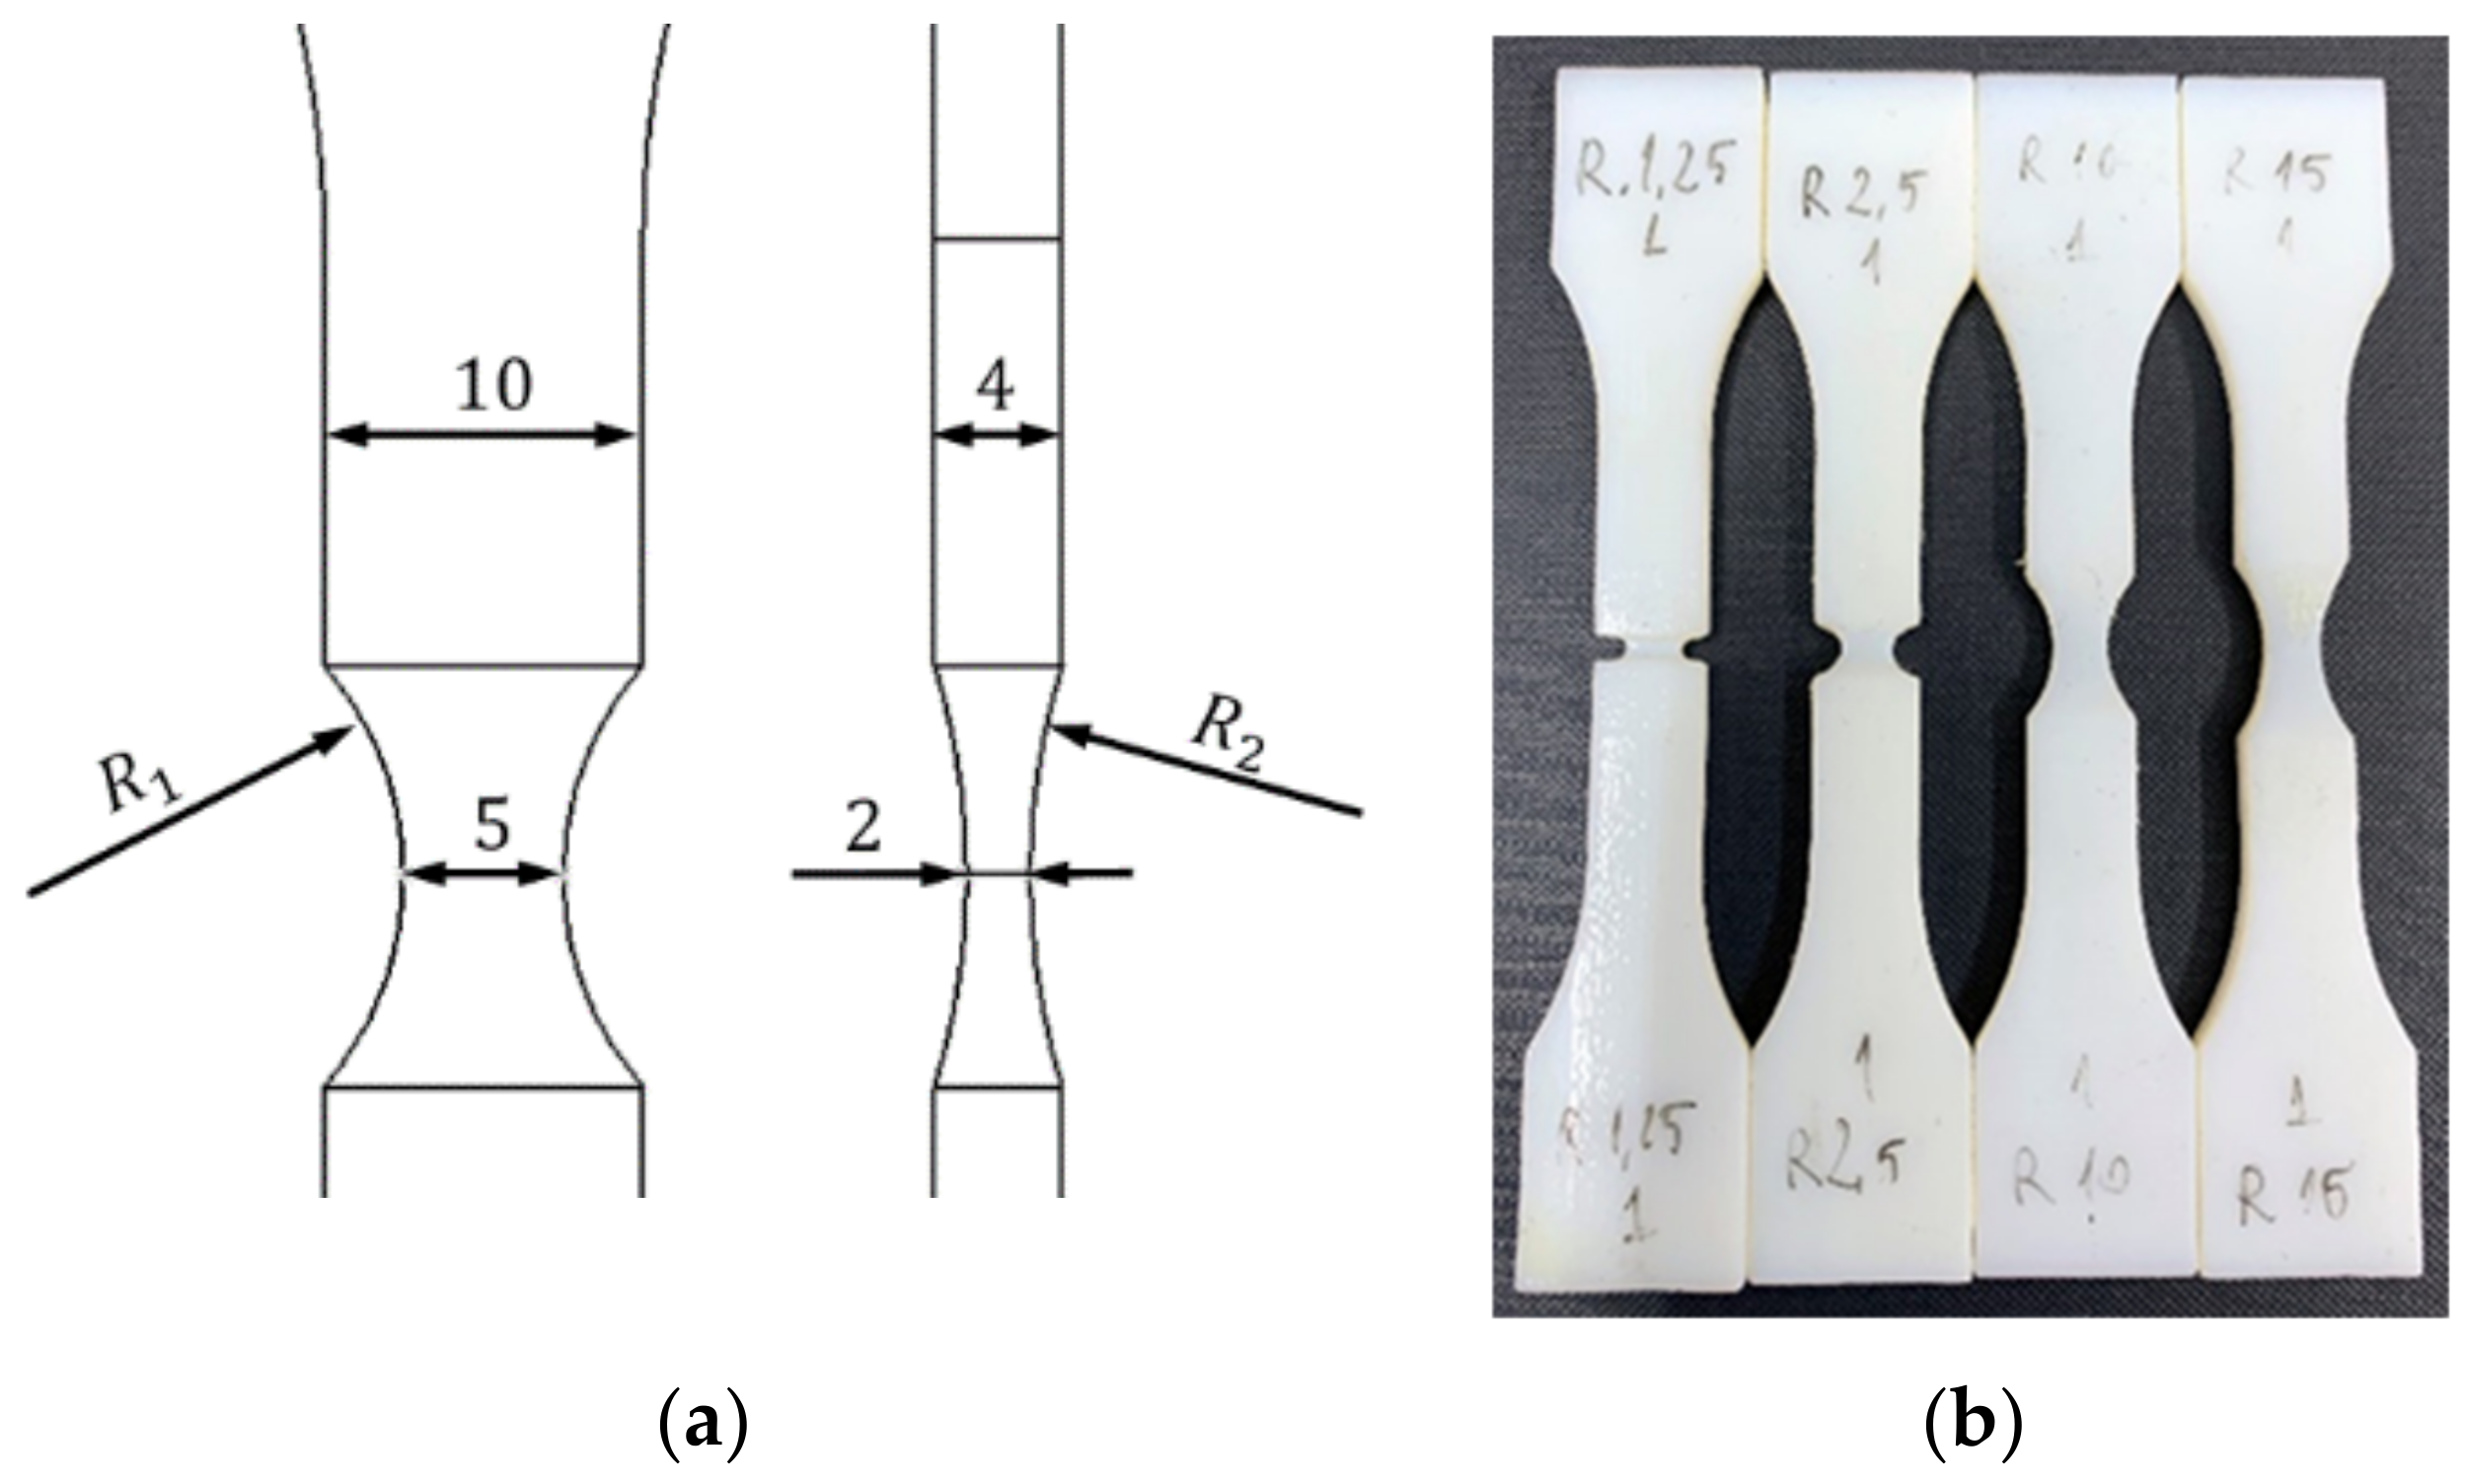
The tensile tests were performed on flat specimens that presented a transition area from the critical region to the body of the samples through double fillets of varying radii (
Figure 1a). The geometry of the specimens was based on ISO 527 specifications [
21], having a 4 mm × 10 mm cross-section area in the calibrated region. The critical region was kept identical for all specimen geometries (2 mm × 5 mm).
The values for the fillet radius
was chosen based on the relation proposed by Bao for estimating the stress triaxiality
of notched specimens as a function of the minimum cross section width
(equalling 5 mm for this case) and the circumferential notch radius
[
11].
Considering the analytical estimation of the variation of the stress triaxiality with circumferential notch radius, four values were chosen for : 1.25 mm, 2.5 mm, 10 mm and 15 mm.
The values for the second fillet radii were chosen based on geometrical constraints for each specimens: three-point arcs were generated, intersecting the middle of the specimen (the critical region, with a distance of
from the mid plane of the specimen) and the surface of the calibrated region that resulted from the
notch (
Figure 1a).
The specimens were manufactured through photopolymerization, using the PolyJet technology, the procedure and parameters being detailed in [
19], the resulting specimens being presented in
Figure 1b.
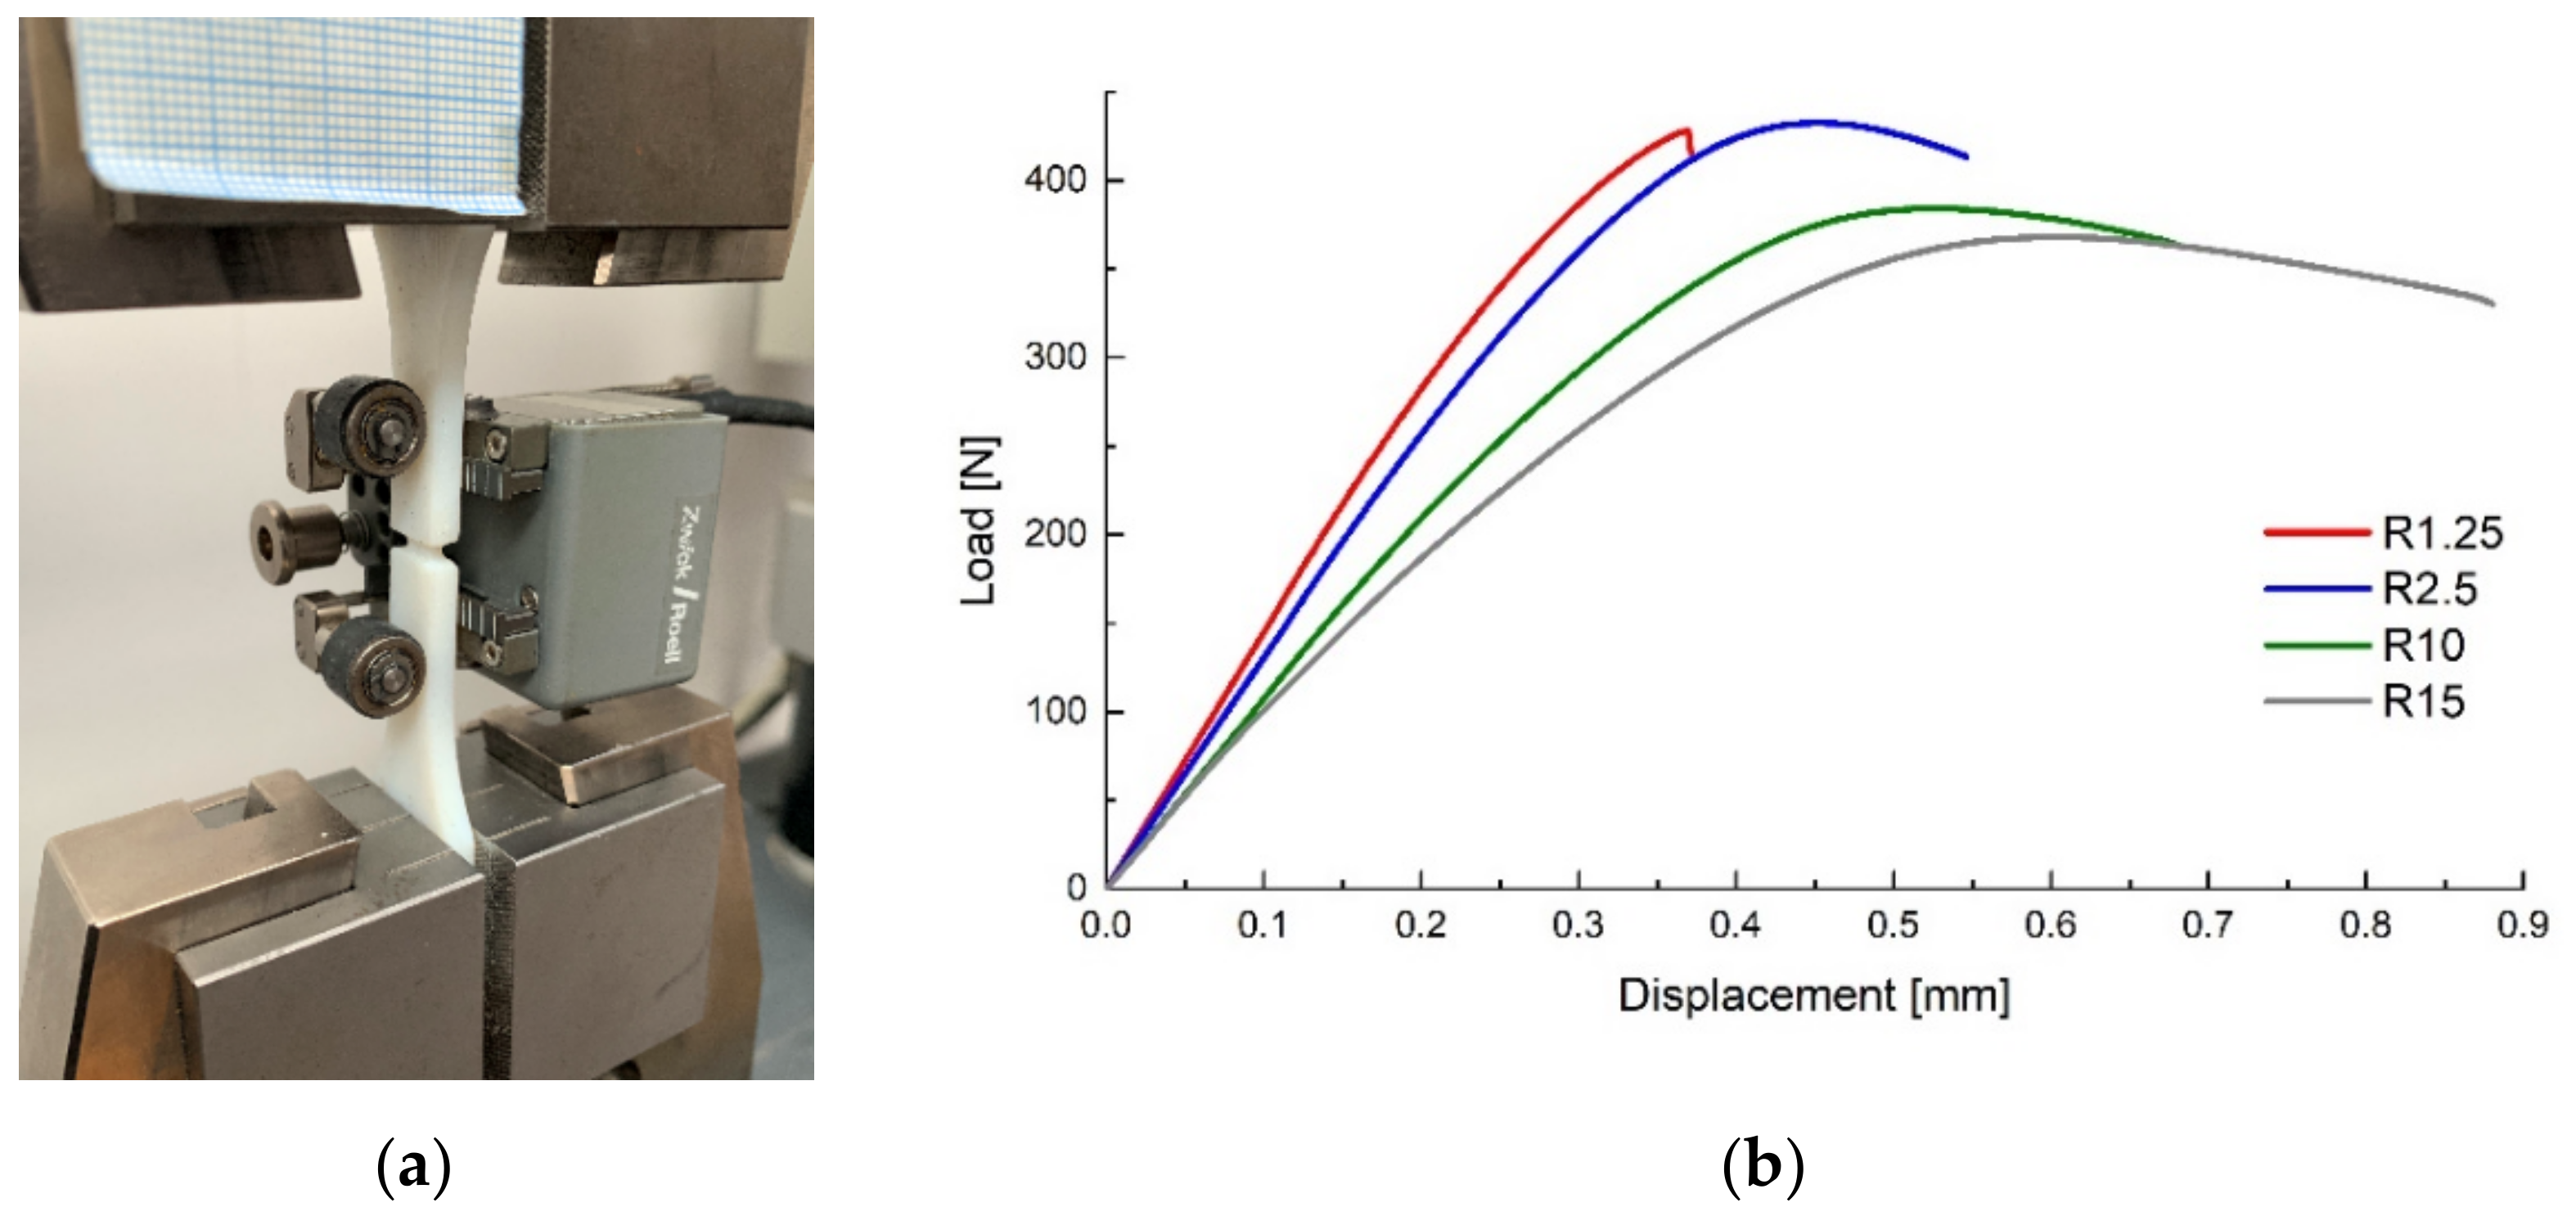
The experimental procedures were carried out on a 5 kN Z005 universal testing machine manufactured by Zwick Roell (Ulm, Germany) at ambient temperature using a 1 mm min
−1 crosshead travel speed. In order to develop accurate simulations, a strain-gauge extensometer was used to record the relative displacement of the surfaces neighbouring the critical region, as depicted in
Figure 2a. Representative force–displacement curves for each specimen type are presented in
Figure 2b, the higher stress concentration caused by the smaller notch radii determining stiffer responses and lower fracture strains. As was expected, all specimens failed in the critical region.
Finite element analyses were performed in the commercial software Abaqus/CAE 2019 (Dassault Systèmes, Vélizy-Villacoublay, France), using the implicit solver (Abaqus Standard) on models based on the geometries used for rapid prototyping, reduced to the region contained between the extensometer grips. The material formulation used consisted of an elastic-plastic formulation with multi-linear isotropic hardening (detailed in [
19,
22]). The bottom of the model was fixed while a different displacement was applied to the top of the model for each geometry, corresponding to the travel recorded by the extensometer at specimen failure. The models were meshed using second order tetrahedral elements (C3D10).
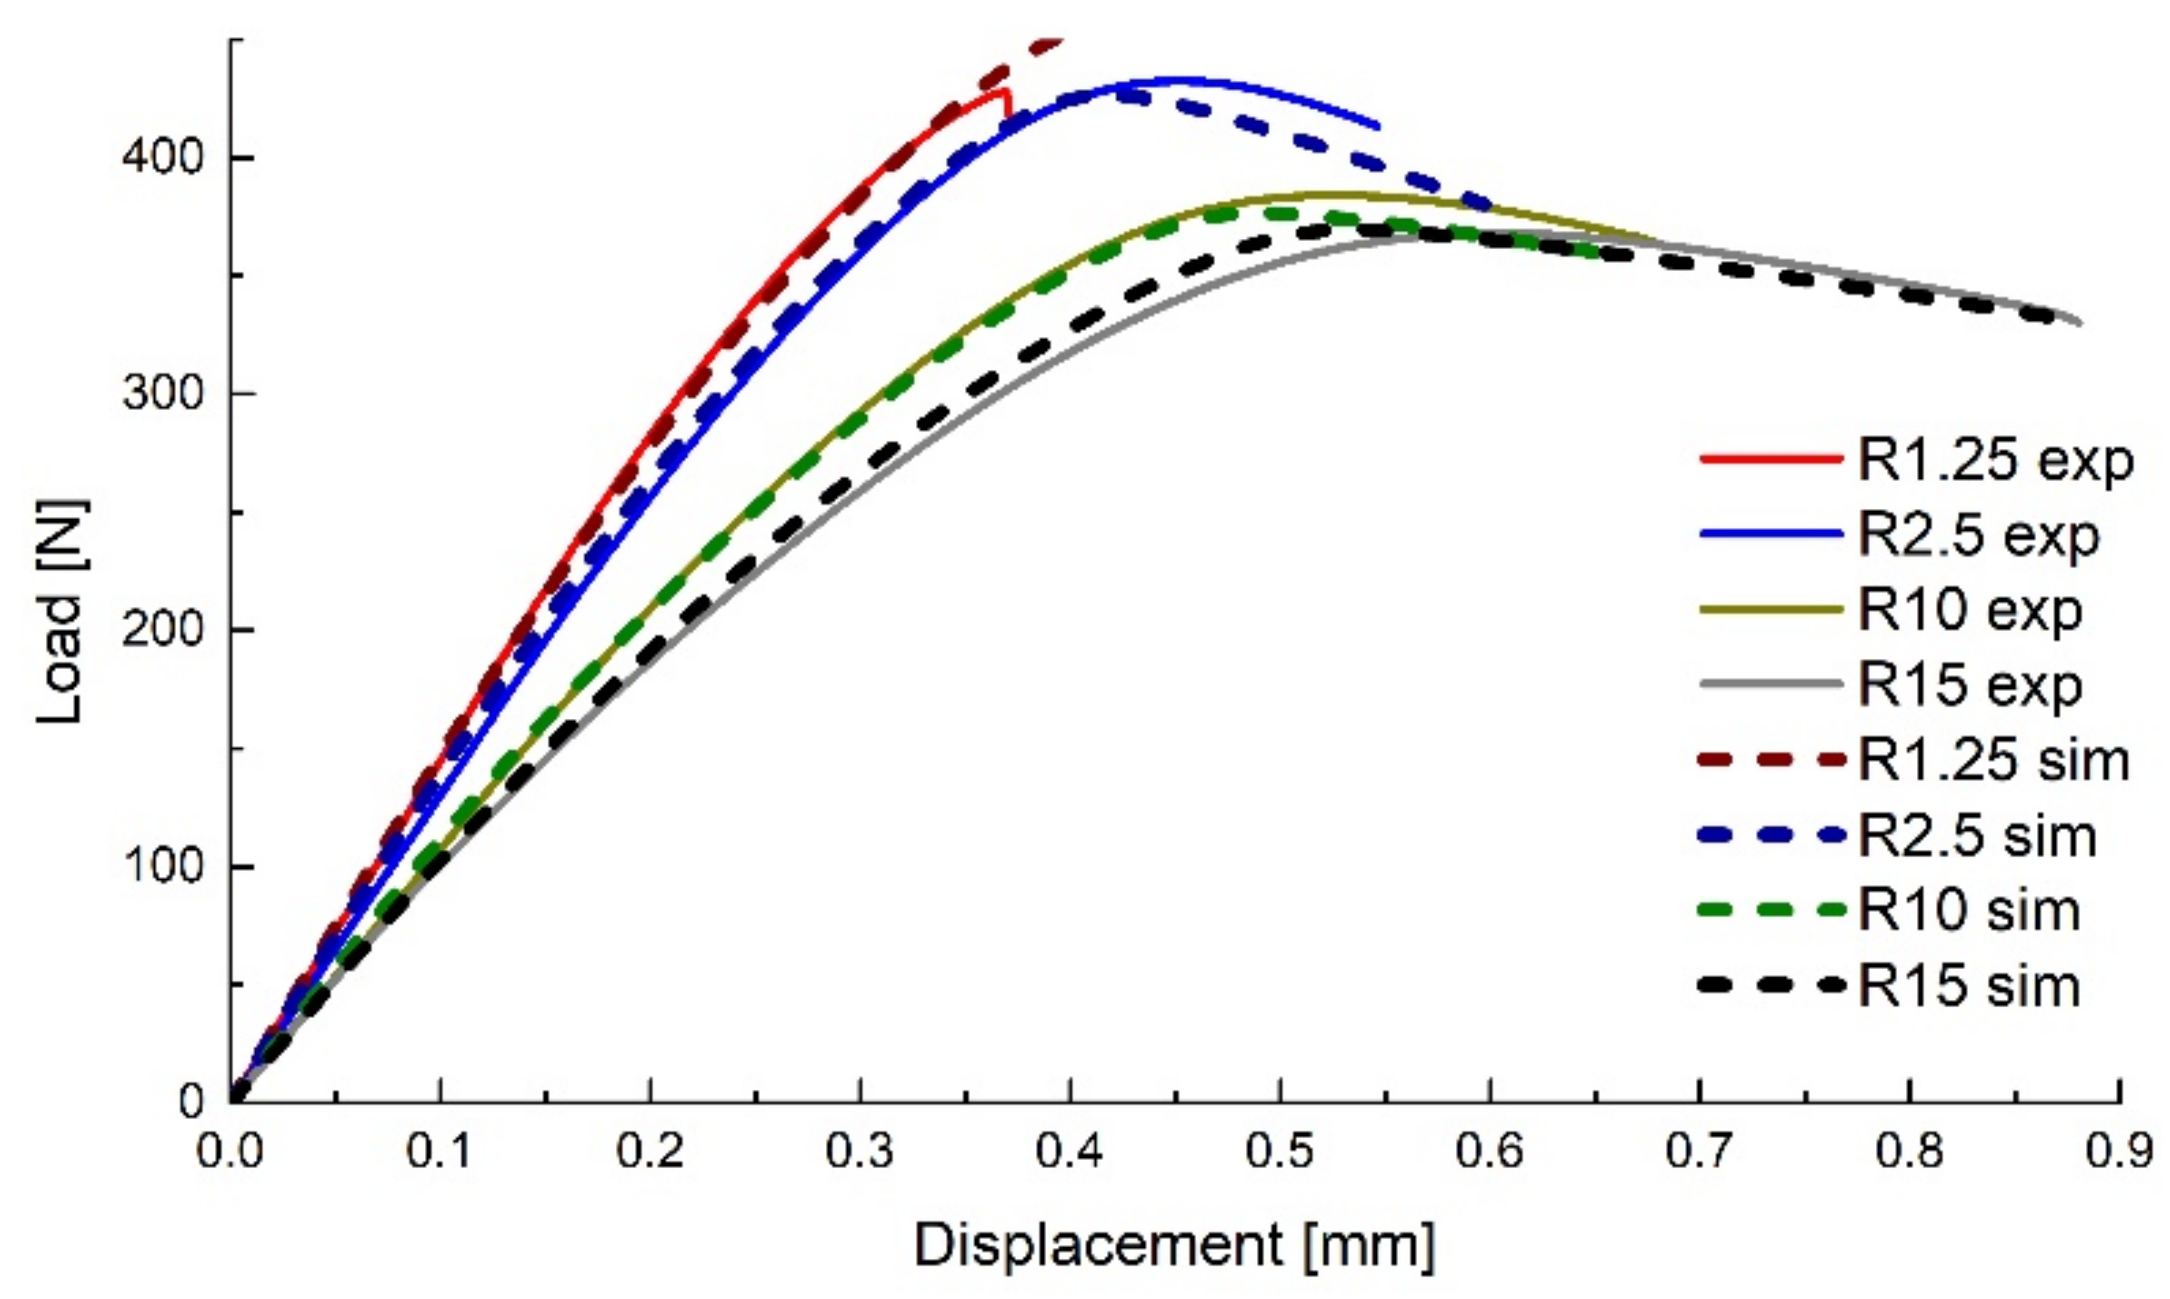
The force–displacement curves resulted from the analyses are presented in
Figure 3, showing a good correlation between the experimental and numerical data.
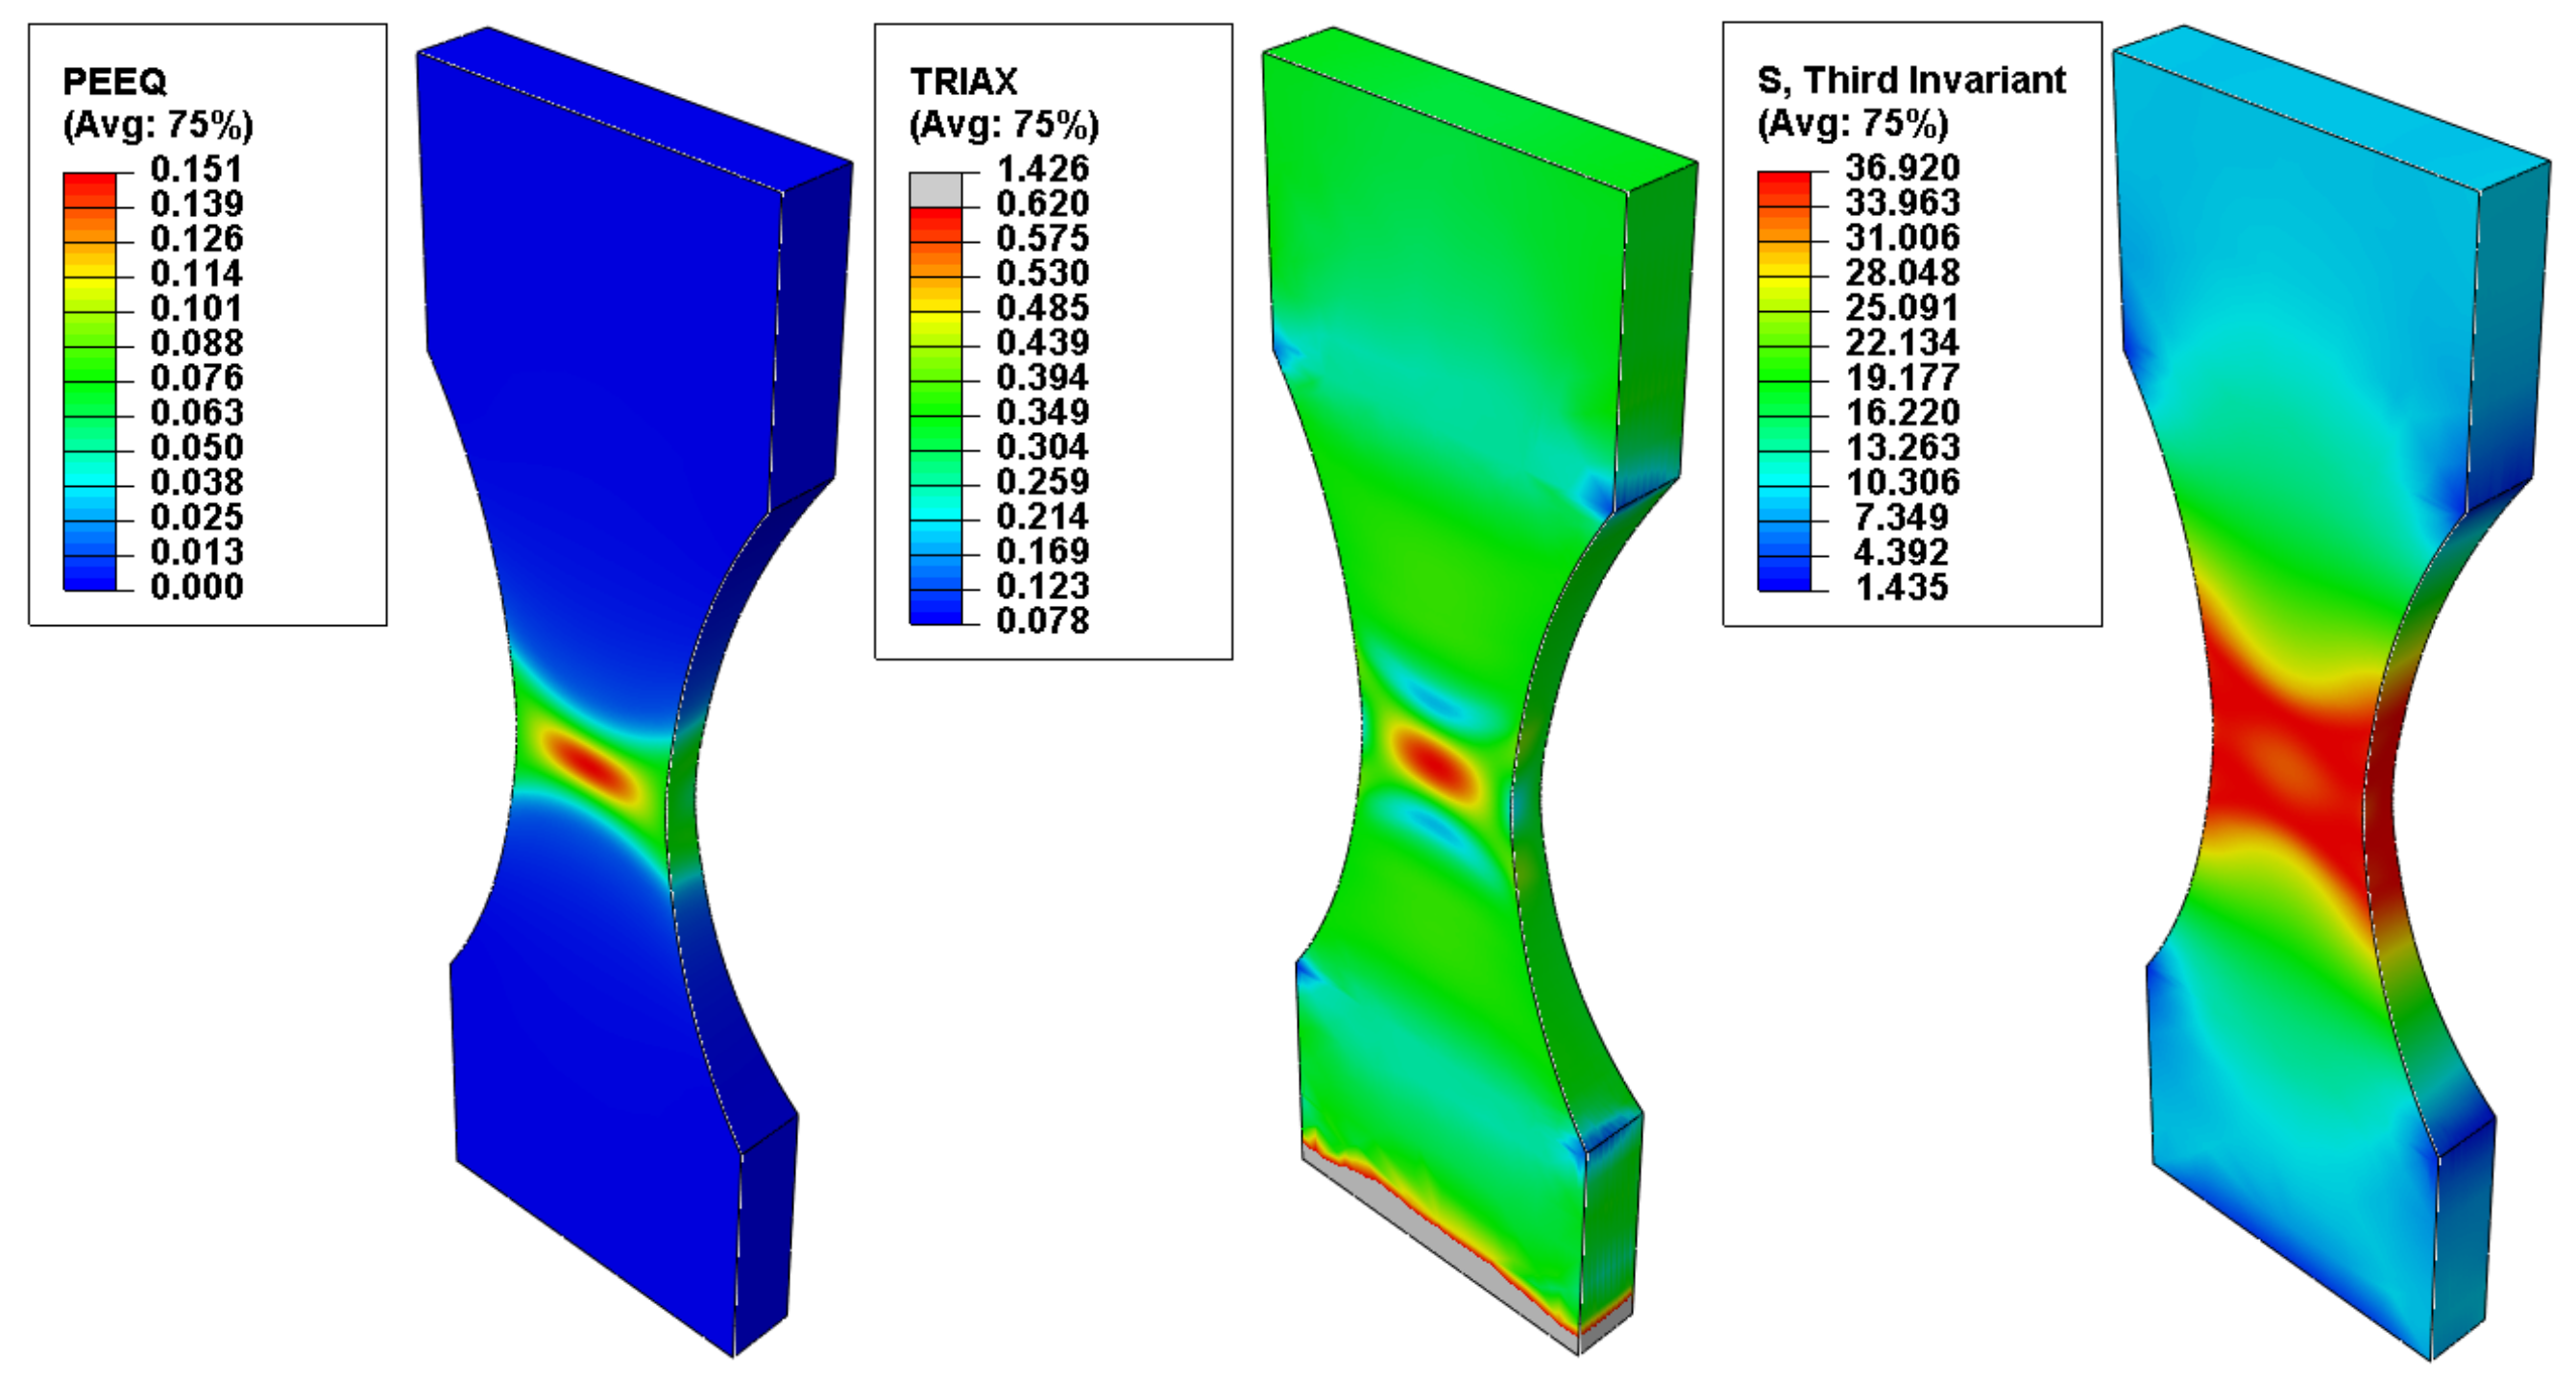
The recalled field output variables of interest were the Von Mises equivalent stress
, the stress triaxiality
, the normalized third invariant of the deviatoric stress tensor
and the equivalent plastic strain
[
23]. The Lode angle parameter was calculated using Equation (12). A path of integration points was defined in the mid plane of the specimens, ranging from their center to the extremity (
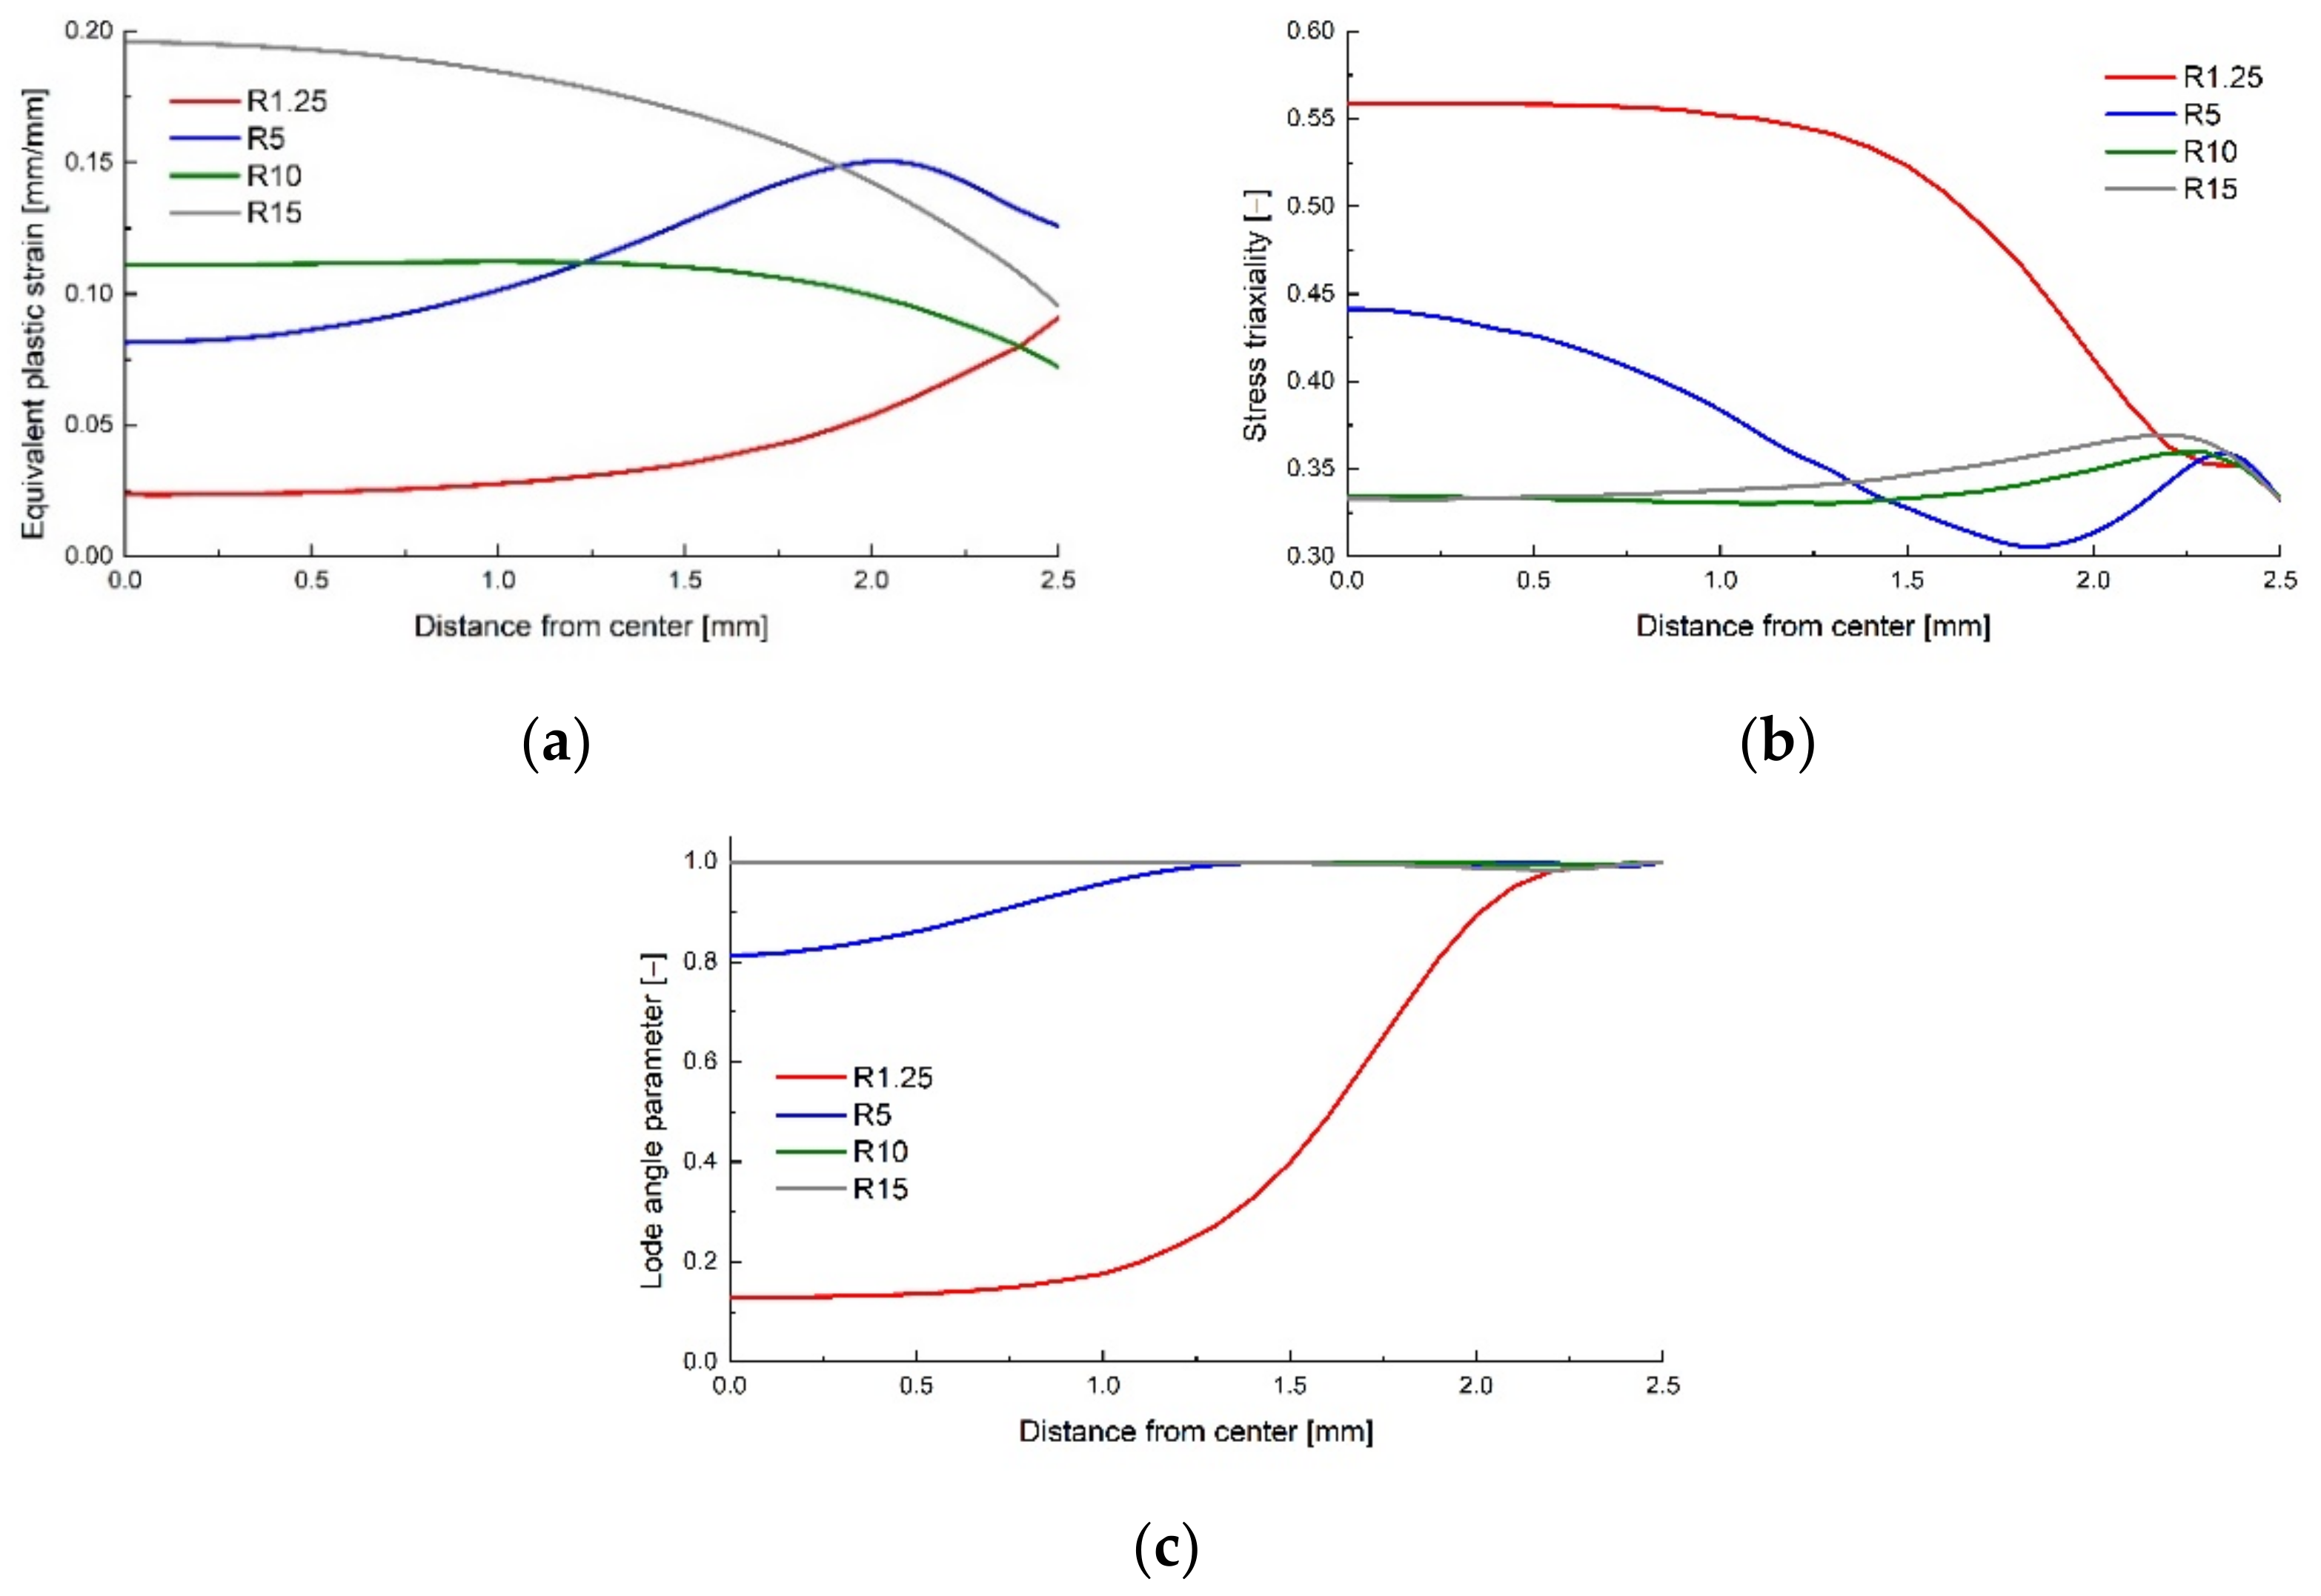
Figure 4) in order to plot the variation of the equivalent plastic strain, stress triaxiality and Lode angle parameter with the distance from the center (
Figure 5).
Considering the hypothesis that the nucleation of voids occurs in the middle of the specimen, the corresponding values for the equivalent critical plastic strain (recorded at the end of each simulation), stress triaxiality and Lode angle parameter are presented in
Table 1. The values for the tensile test at 0.333 stress triaxiality were determined for the tensile tests performed on un-notched specimens, detailed in a previous study [
19].
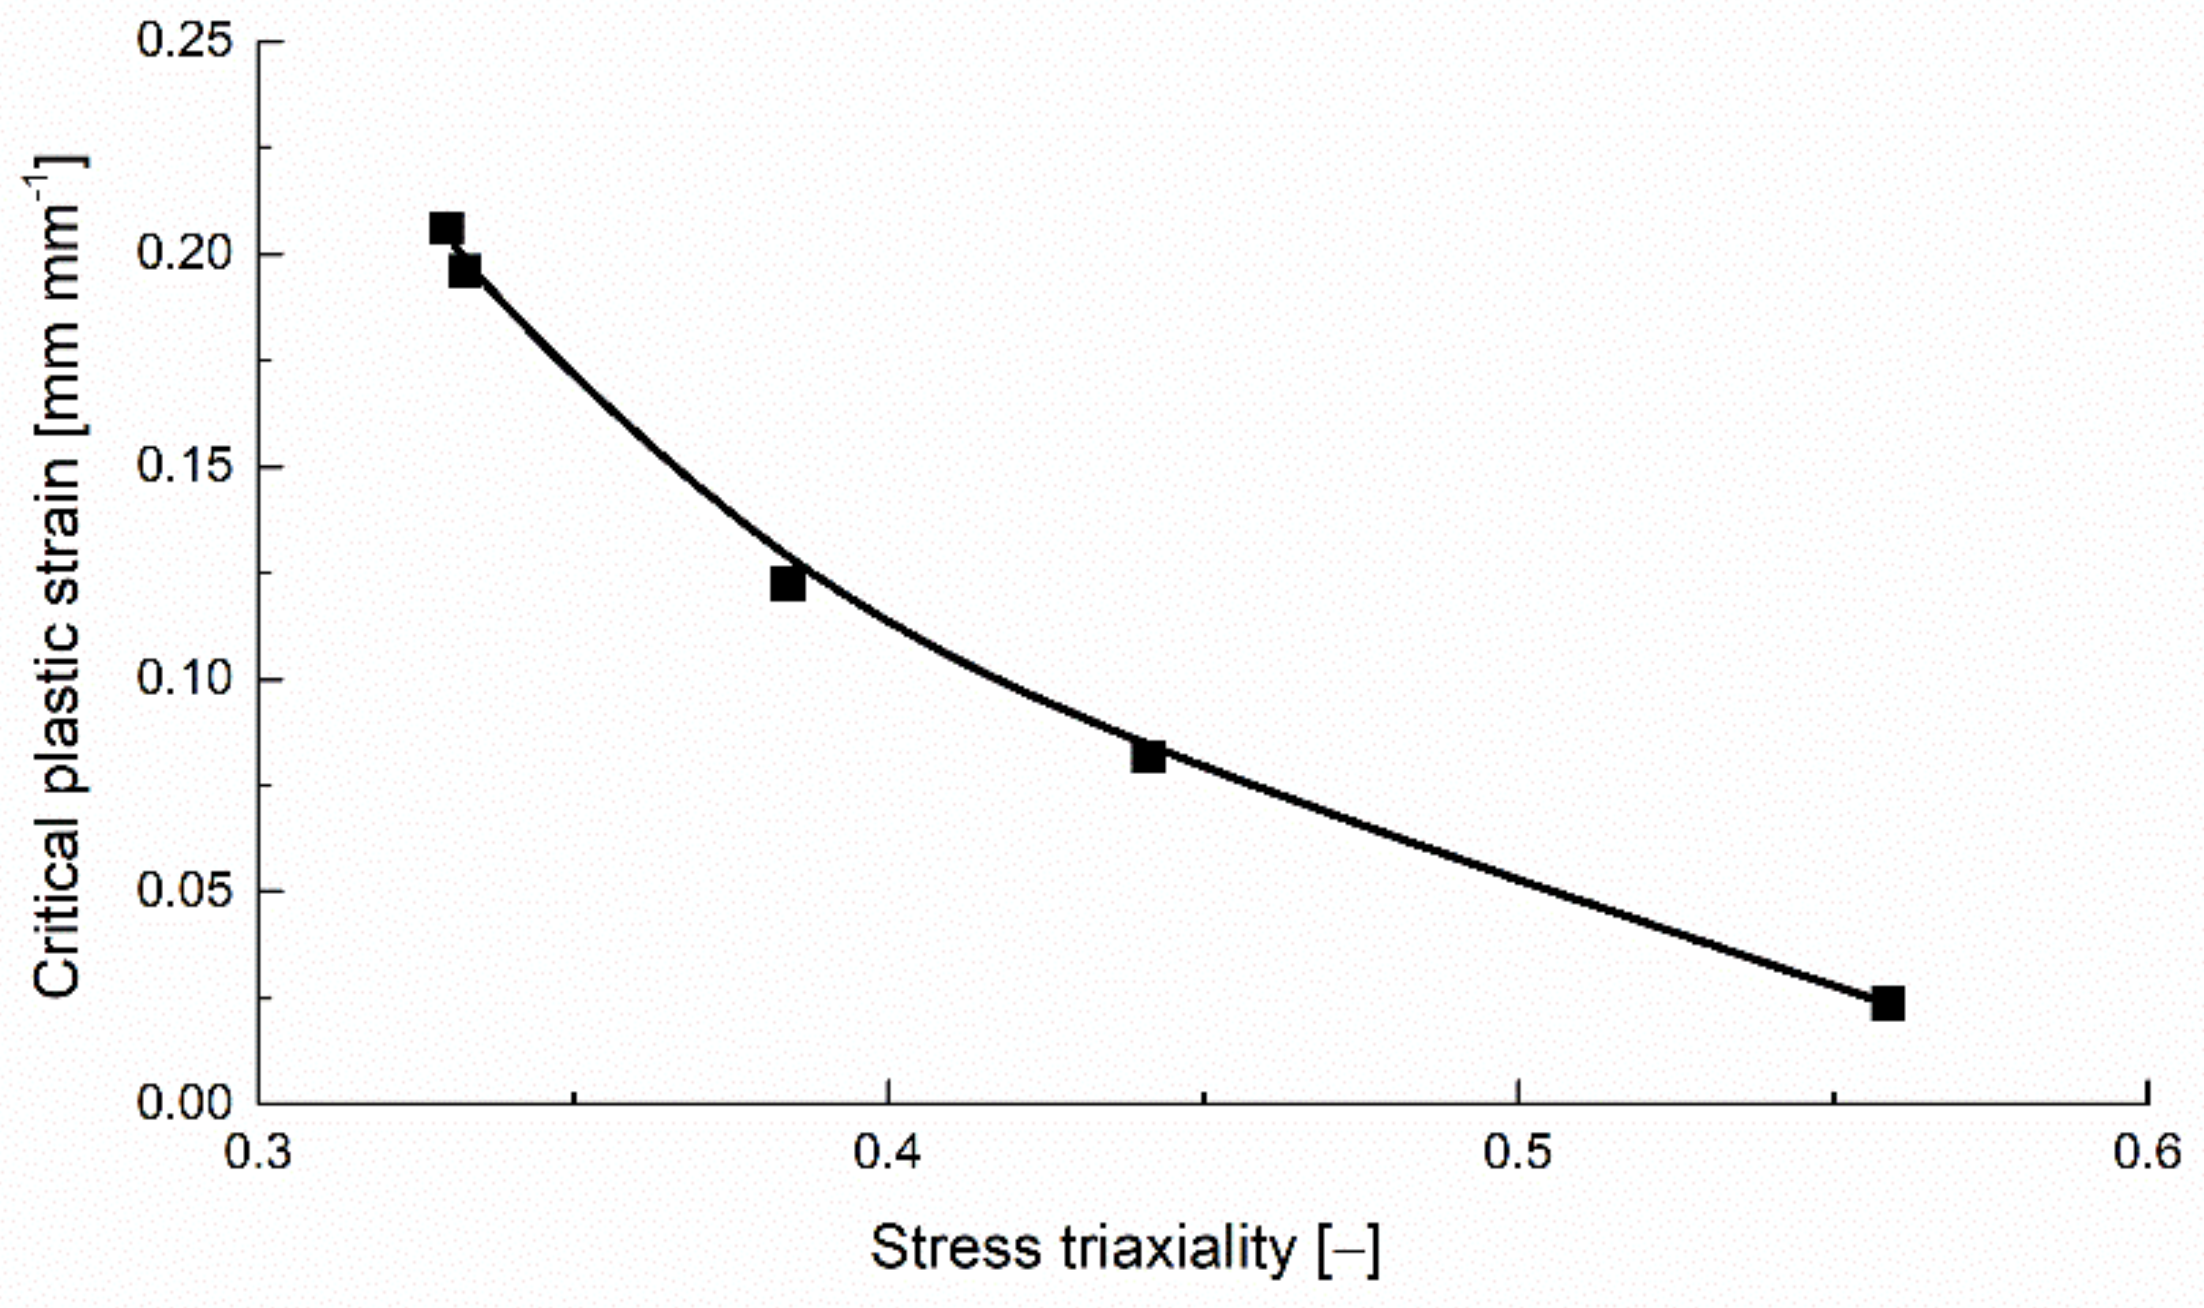
The variation of the critical equivalent plastic strain with the stress triaxiality is presented for the flat specimens in
Figure 6.
3. Upsetting Tests
The values of the critical equivalent plastic strain for negative stress triaxialities were determined using upsetting tests on cylindrical specimens and round notched specimens with various notch radii
. The values of
were chosen with the help of Bridgman’s relation, that predicts the variation of the stress triaxiality with the notch radius and the minimal radius of the cylindrical specimens
a = 4 mm [
5].
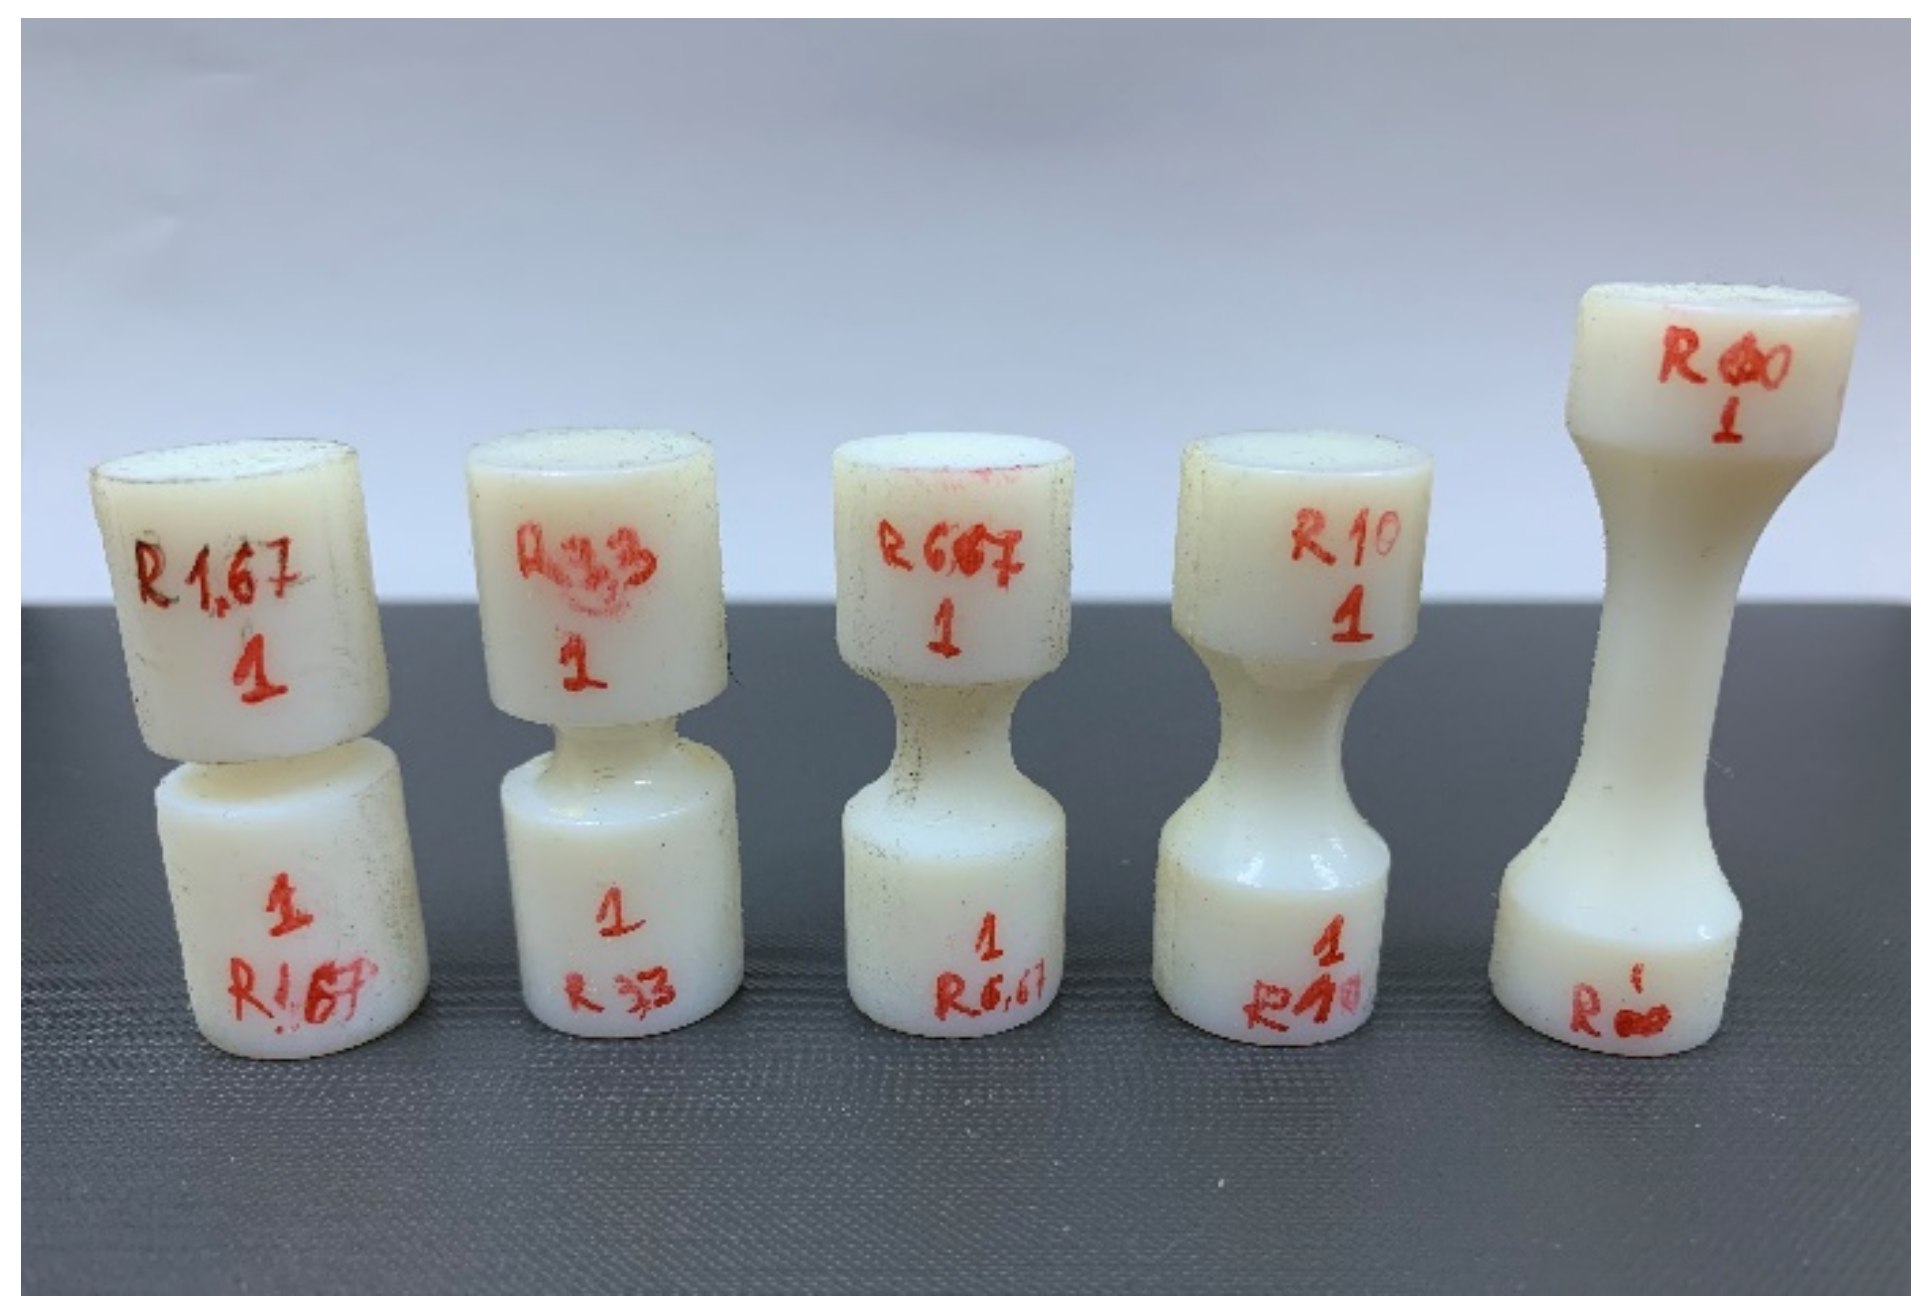
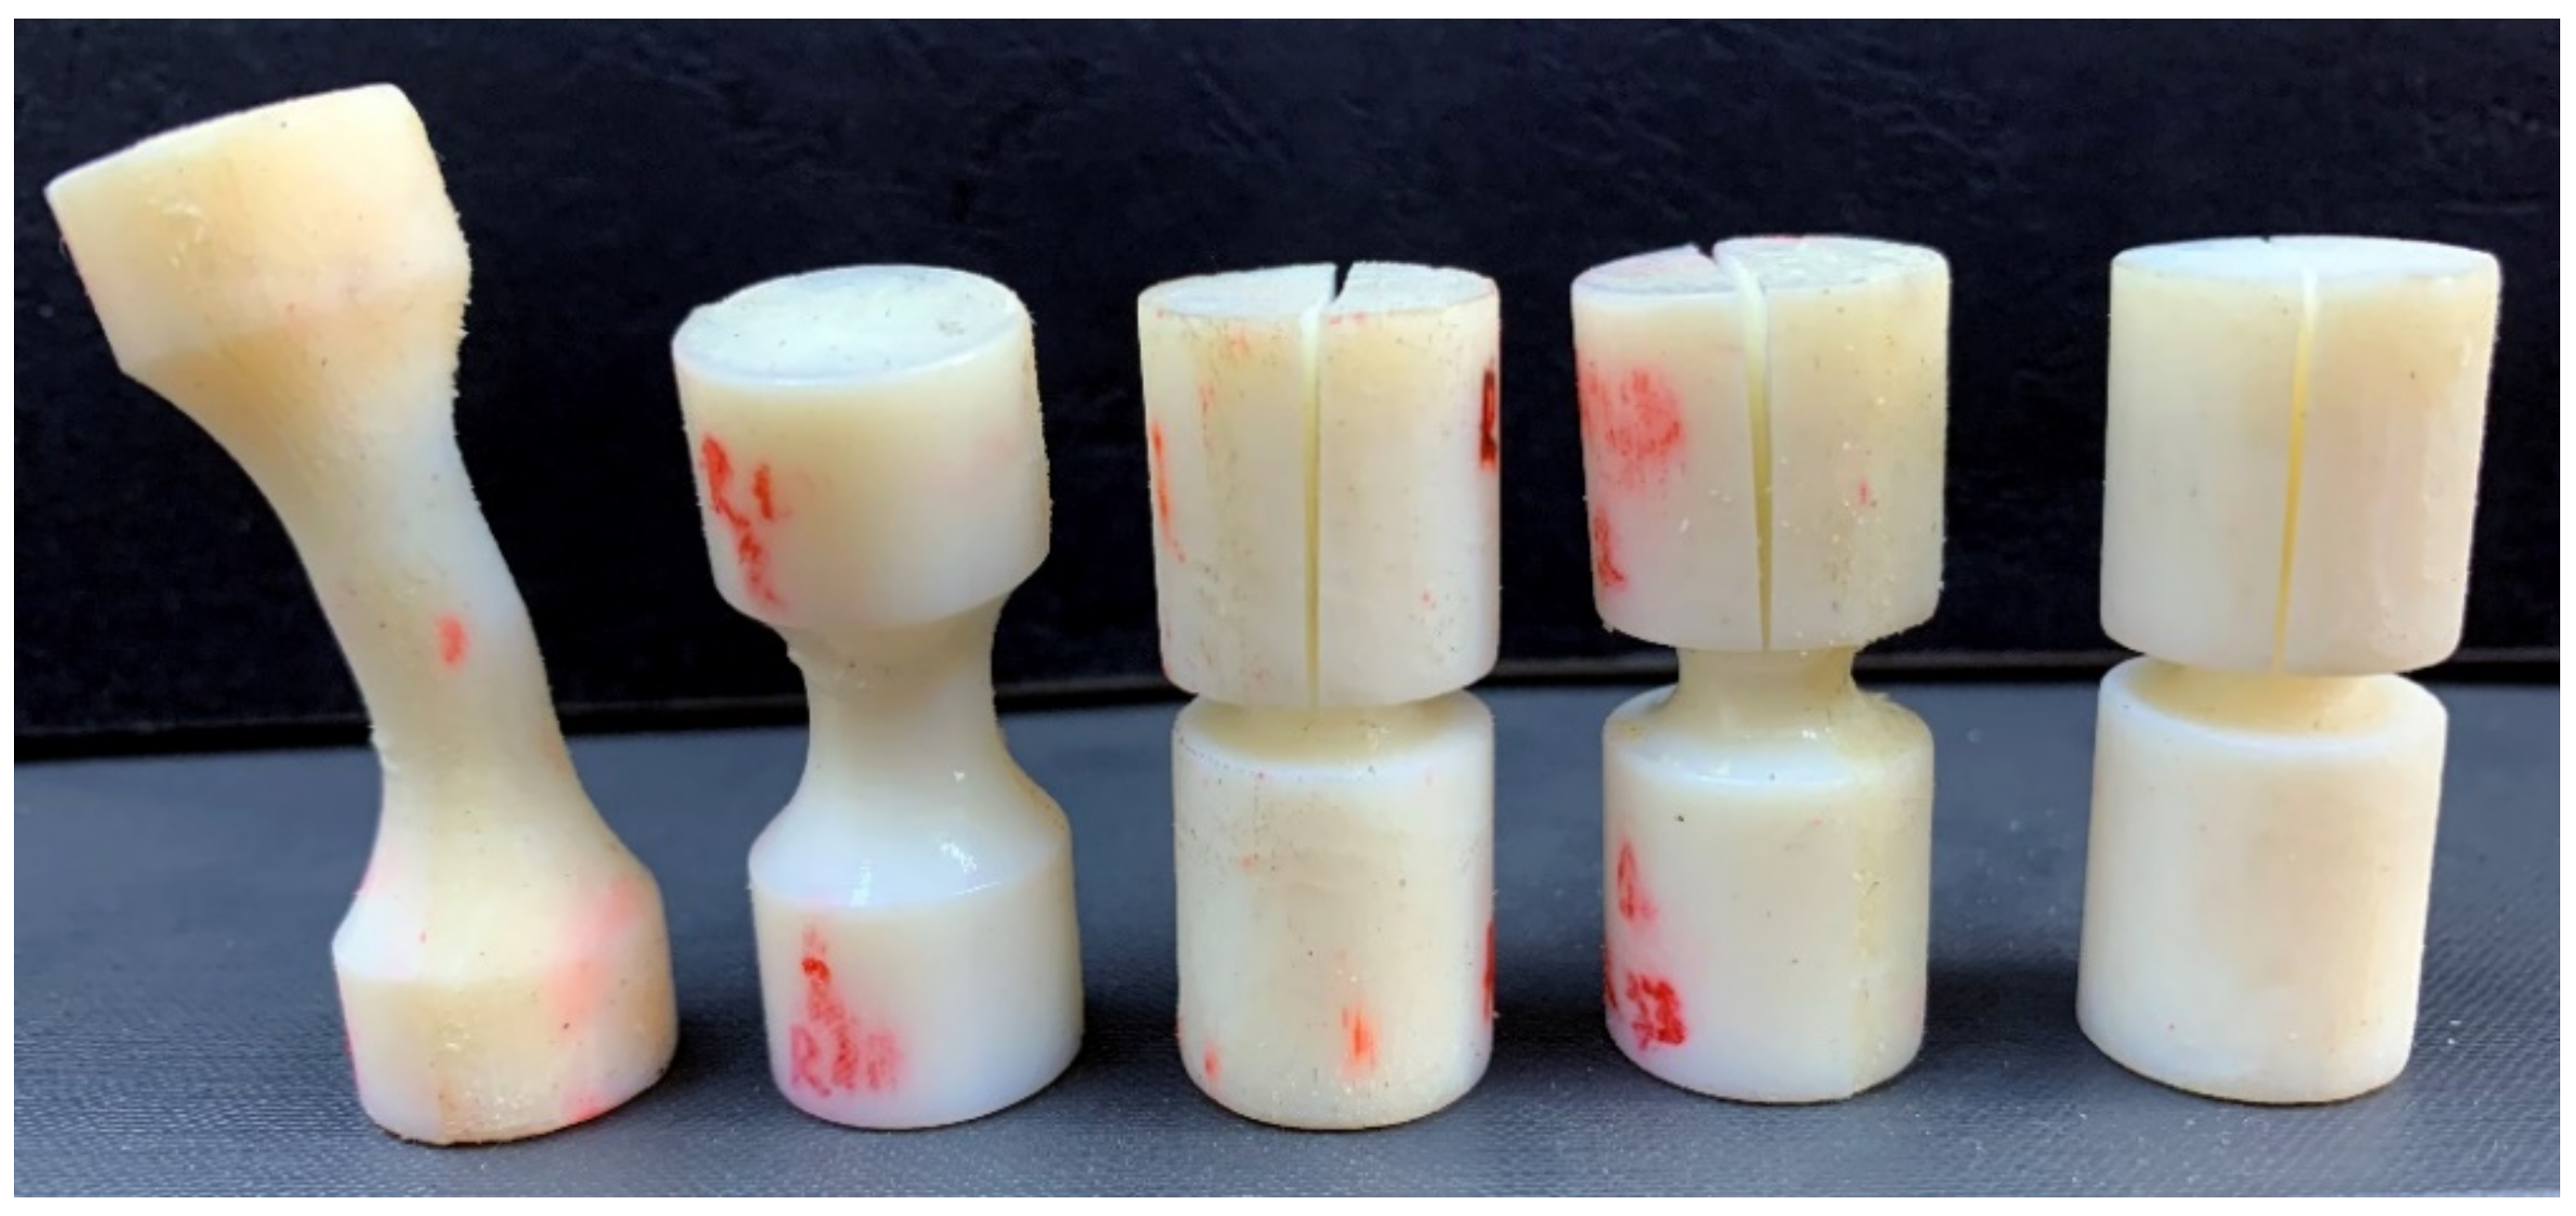
Four values for the notch radii were chosen (1.67 mm, 3.33 mm, 6.67 mm and 10 mm), corresponding to theoretical values of the stress triaxiality that vary between −0.333 (un-notched specimens) and −1.12. The specimens were manufactured through photopolymerization, using the PolyJet technology and the same manufacturing parameters as the flat specimens (
Figure 7).
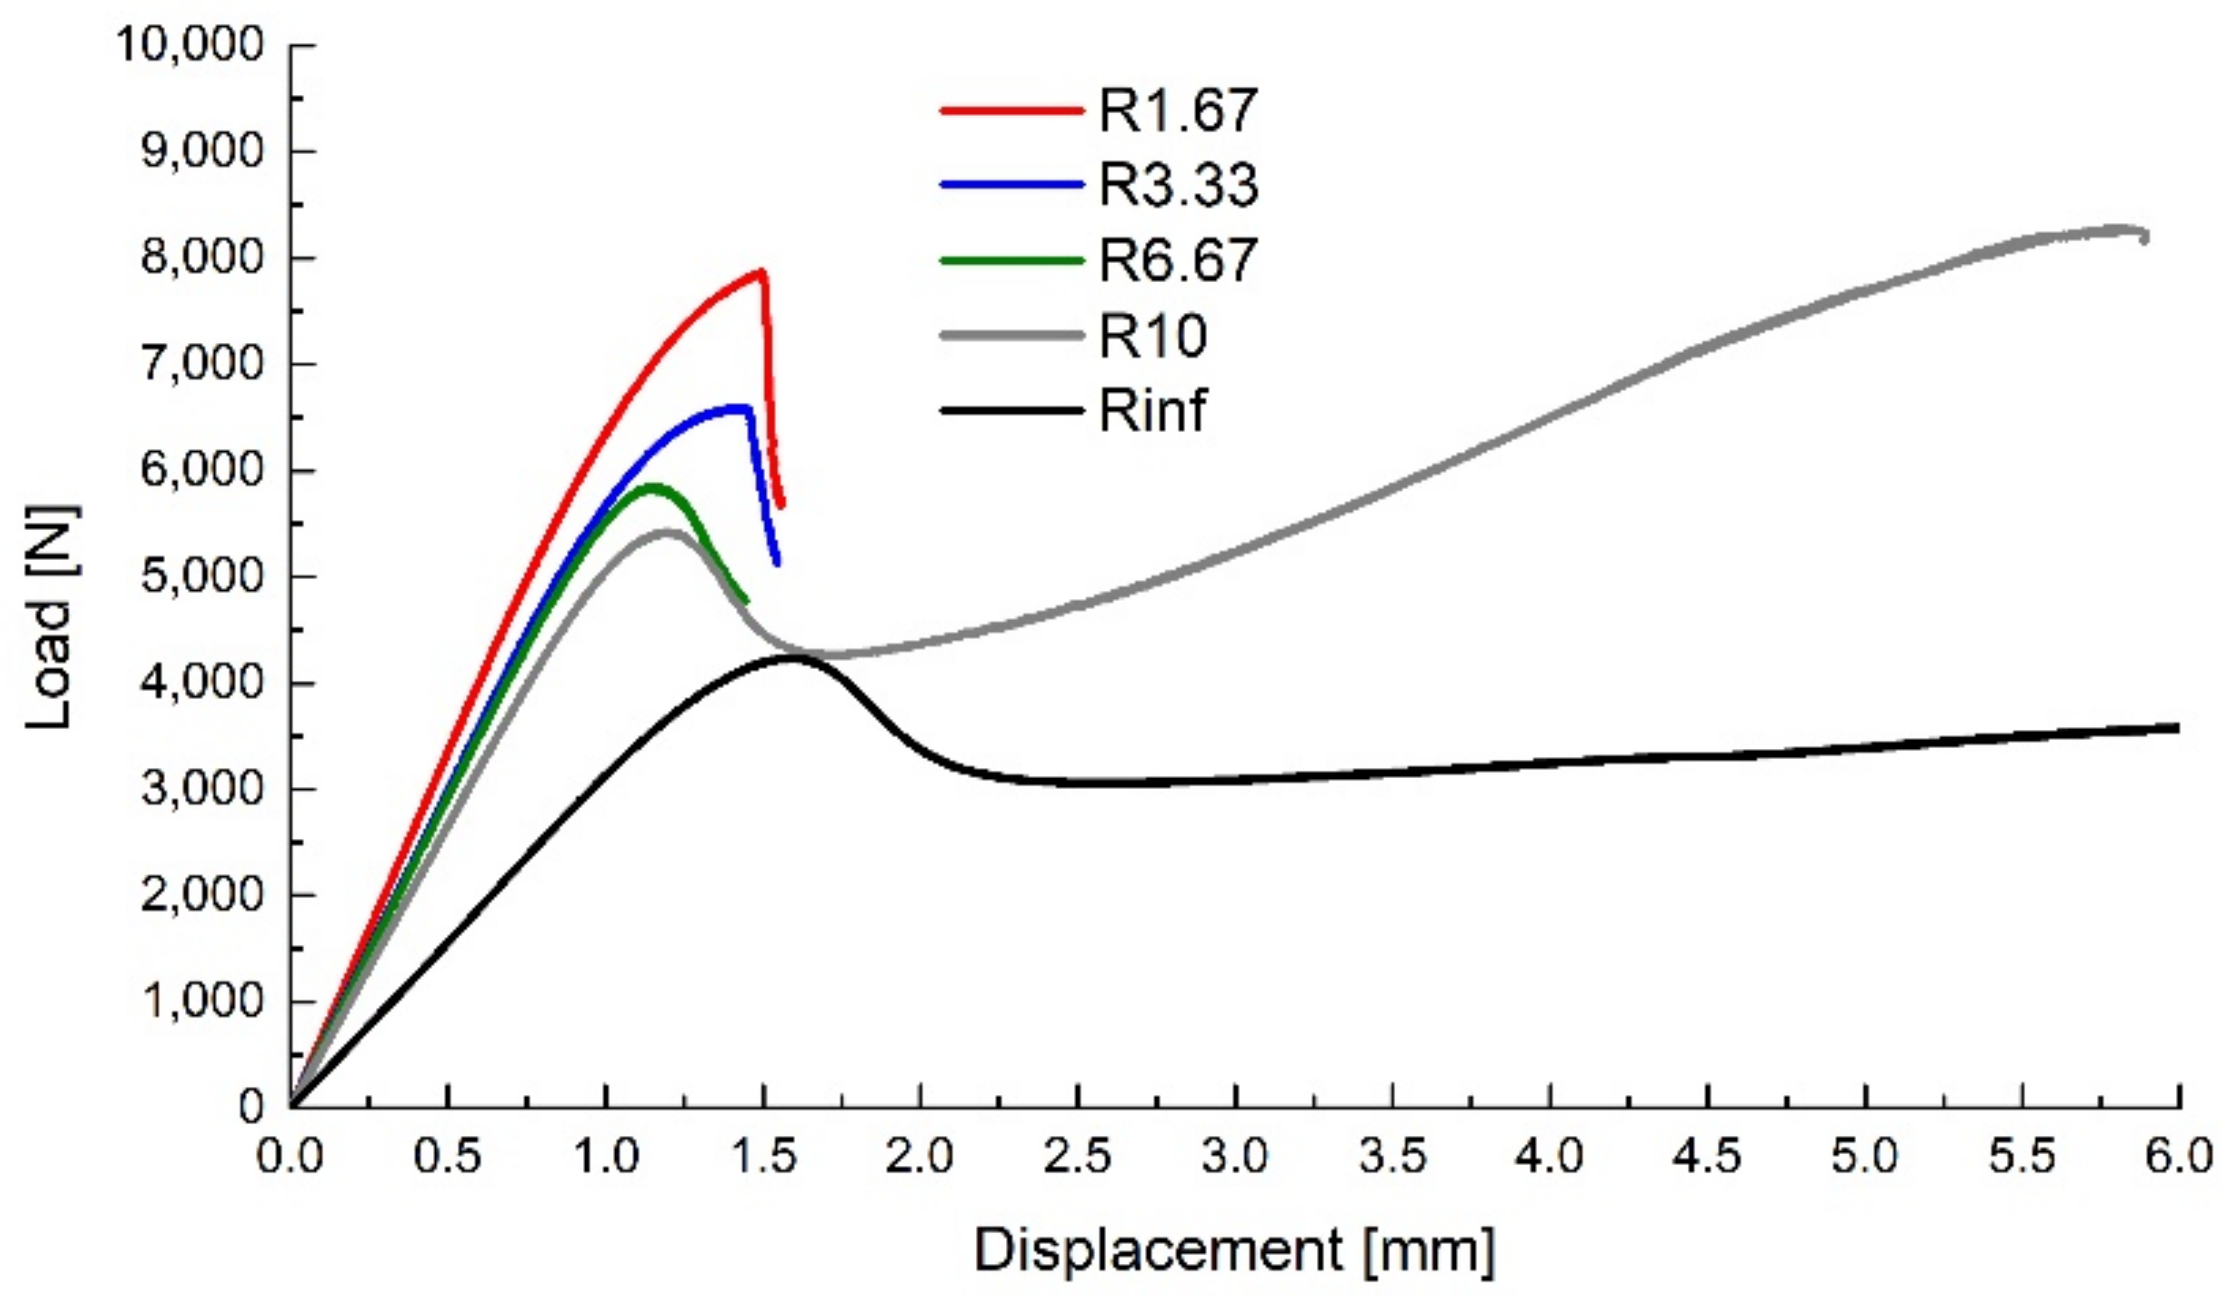
The upsetting tests were performed on a 15 kN LFV-L Multipurpose Dynamic & Fatigue System manufactured by walter + bai (Löhningen, Switzerland) at ambient temperature using a 1 mm min
−1 crosshead travel speed. The resulting force–displacement curves are presented in
Figure 8, depicting representative curves for each specimen type.
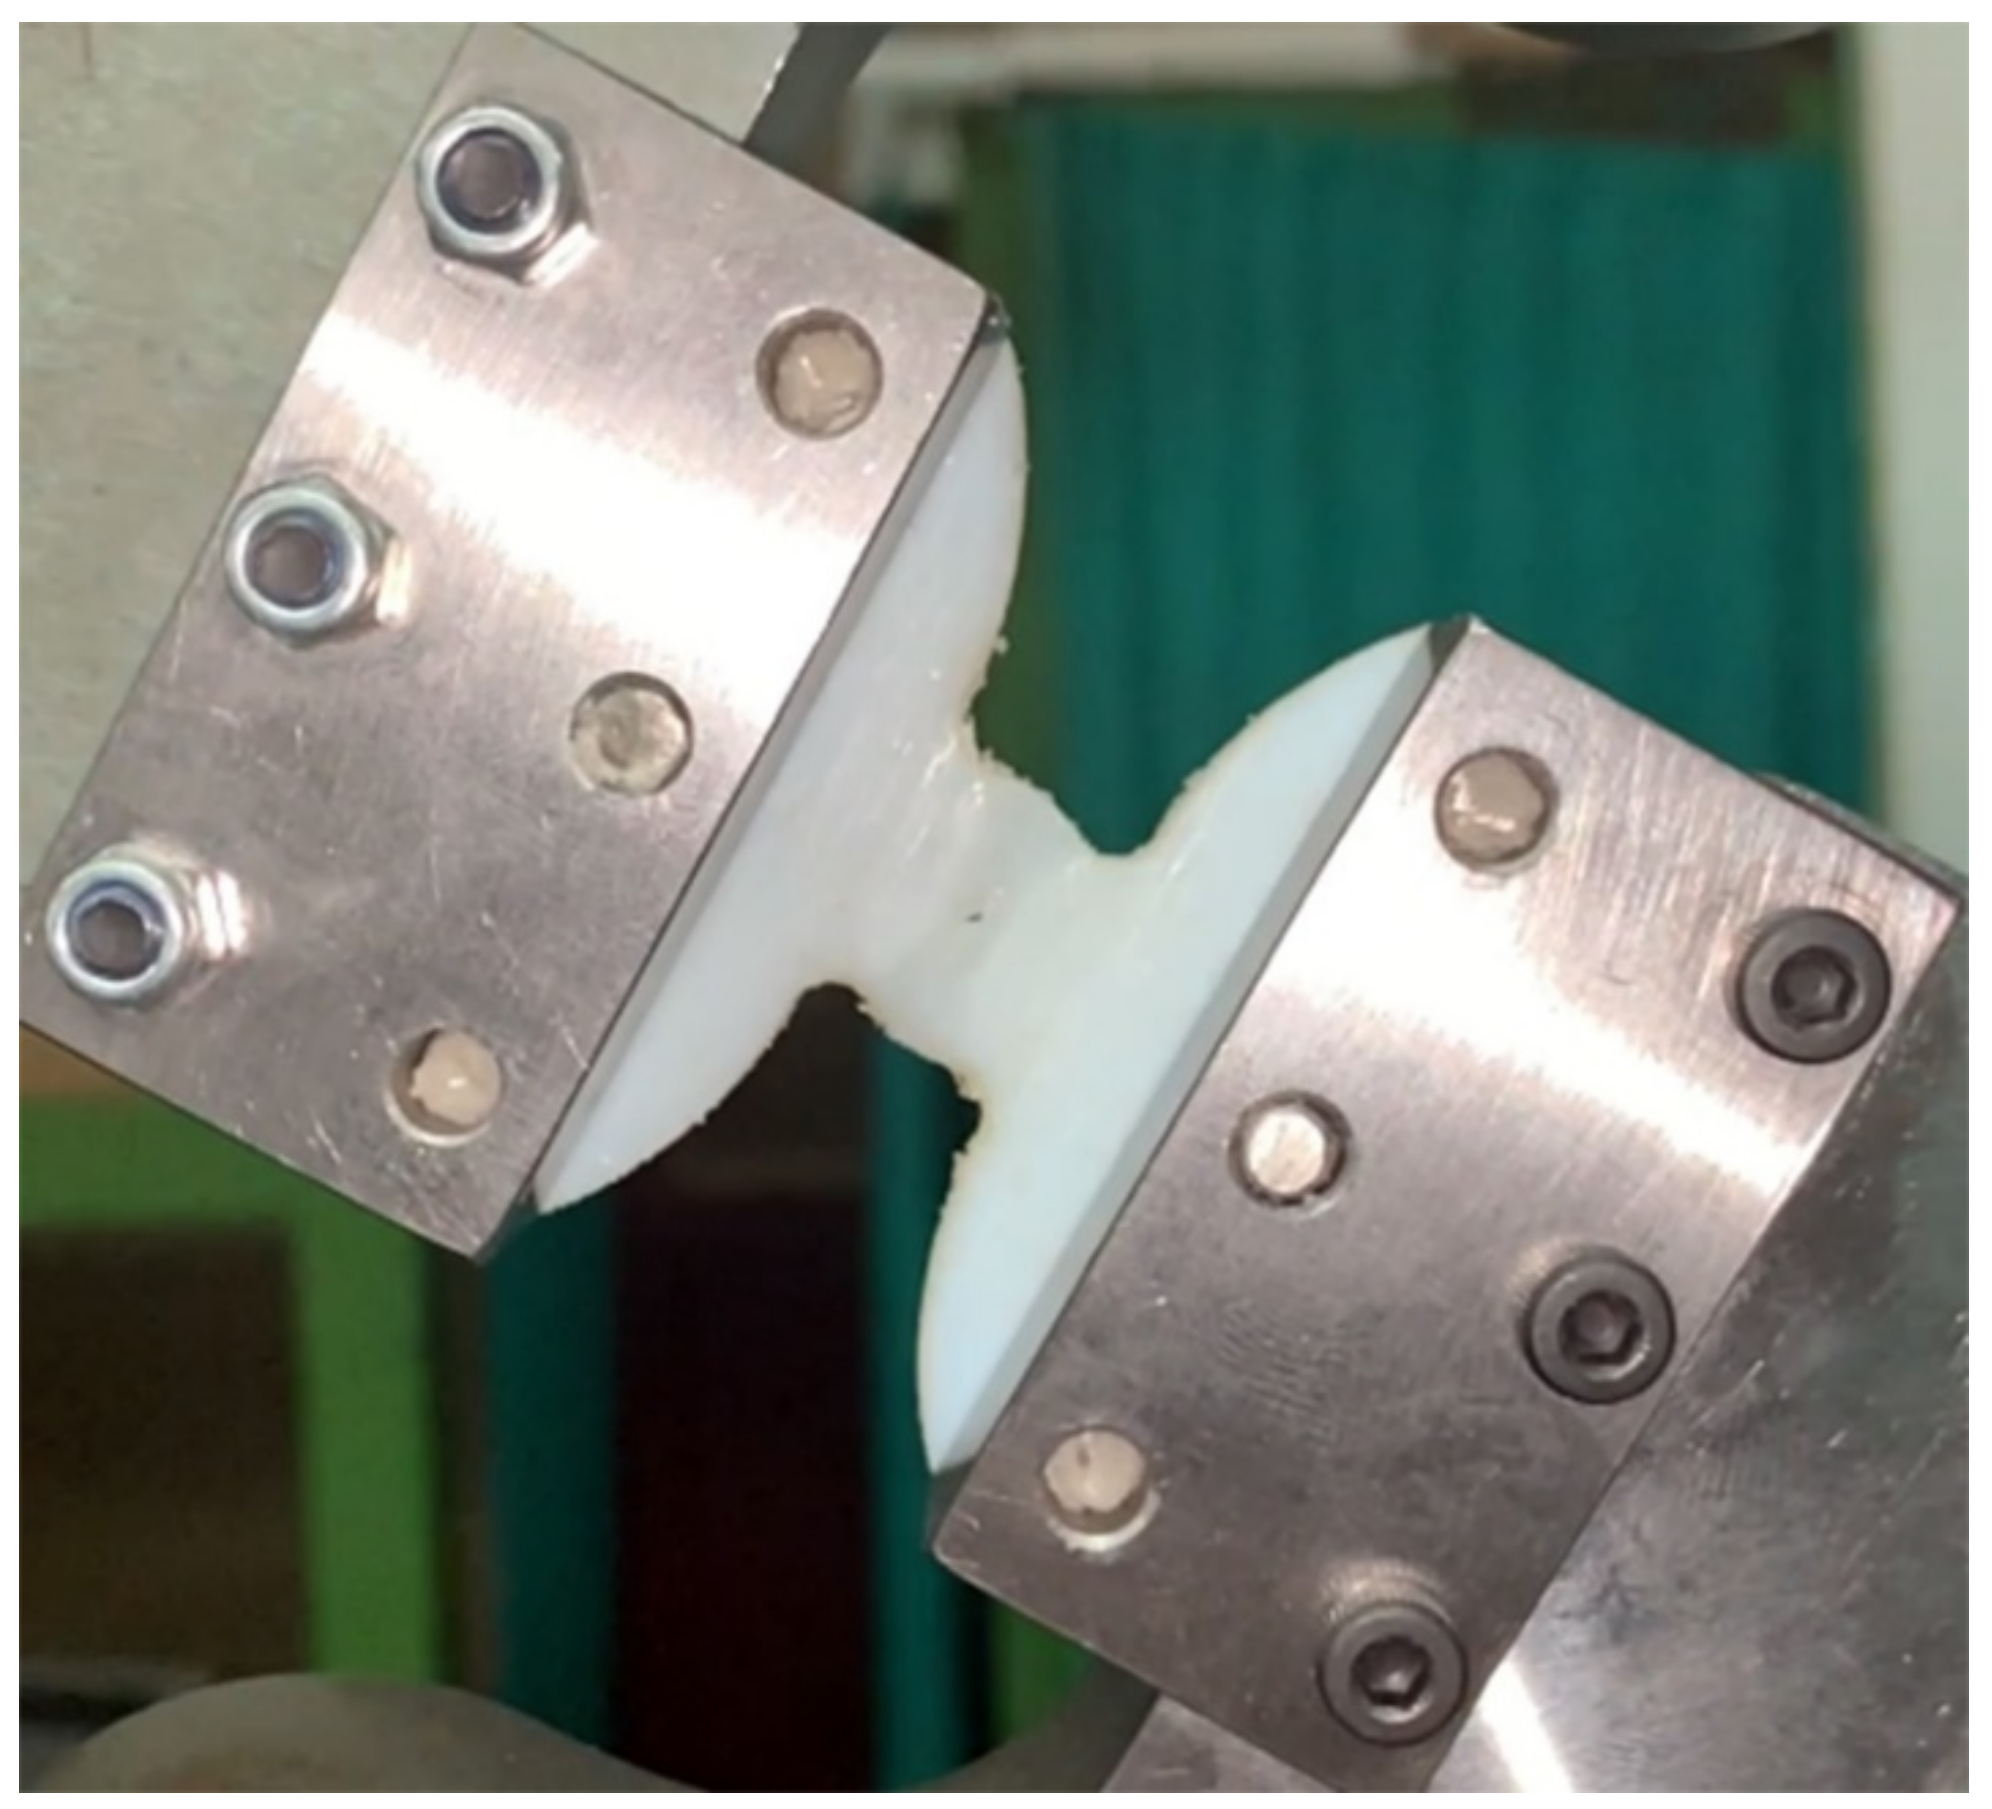
During the tests, it was observed that the un-notched specimens and the specimens with a 10 mm fillet radius failed through buckling, while the rest of the specimens failed through a crack propagation that was initiated in the critical region (the outer surface of the specimen in the minimal radius region), as shown in
Figure 9.
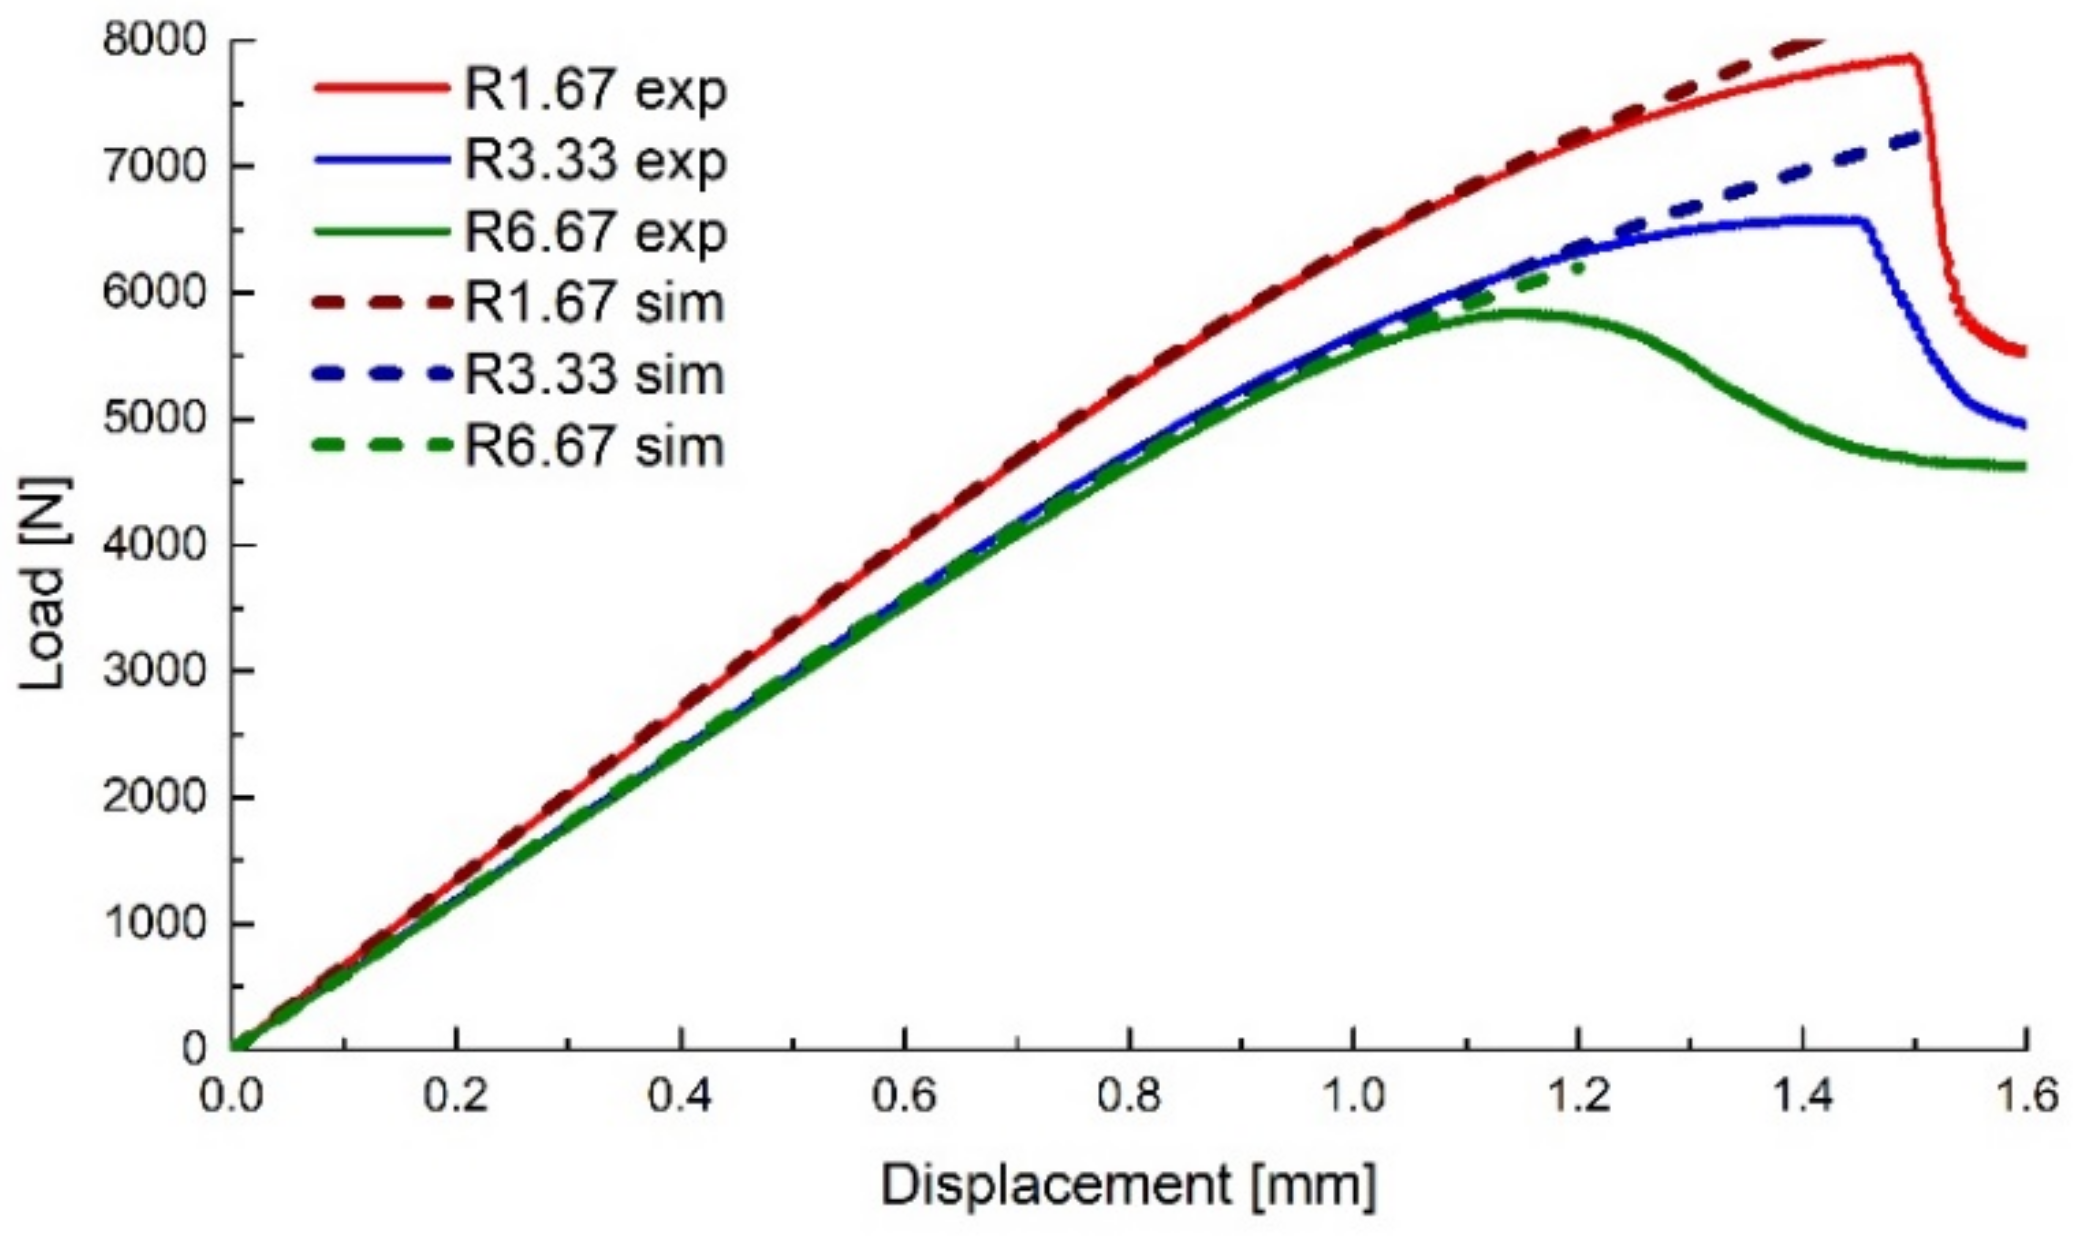
Numerical analyses were performed on axial-symmetric specimens that had the geometry identical to the revolved surface of the models used for the 3D printed specimens (the un-notched and the 10 mm notch radius specimens were omitted from the analyses, as no relevant data could be gathered). The analyses used the same material model and similar boundary conditions (fixed bottom surface and a displacement on the top surface, corresponding to the experimental values recorded at specimen damage initiation) to those used in the flat specimen simulations.
The displacement of the top surface and the y-axis reaction of the bottom surface were recorded as history outputs, the comparison between the experimental and numerical force–displacement curves being presented in
Figure 10. A good correlation between the experimental and numerical sets of data can be observed until a given displacement for each specimen type, where the experimental values show an apparent softening, followed by a relatively rapid drop (more evident for the specimens with lower notch radii). As the sudden drop in the force values is caused by the crack propagation, the apparent softening of the material was considered to be caused by the damage evolution (void growth) in the critical region, and the separation point between the experimental and numerical data values (offset of 1% load) was considered the damage initiation point (void nucleation) for each type of specimen.
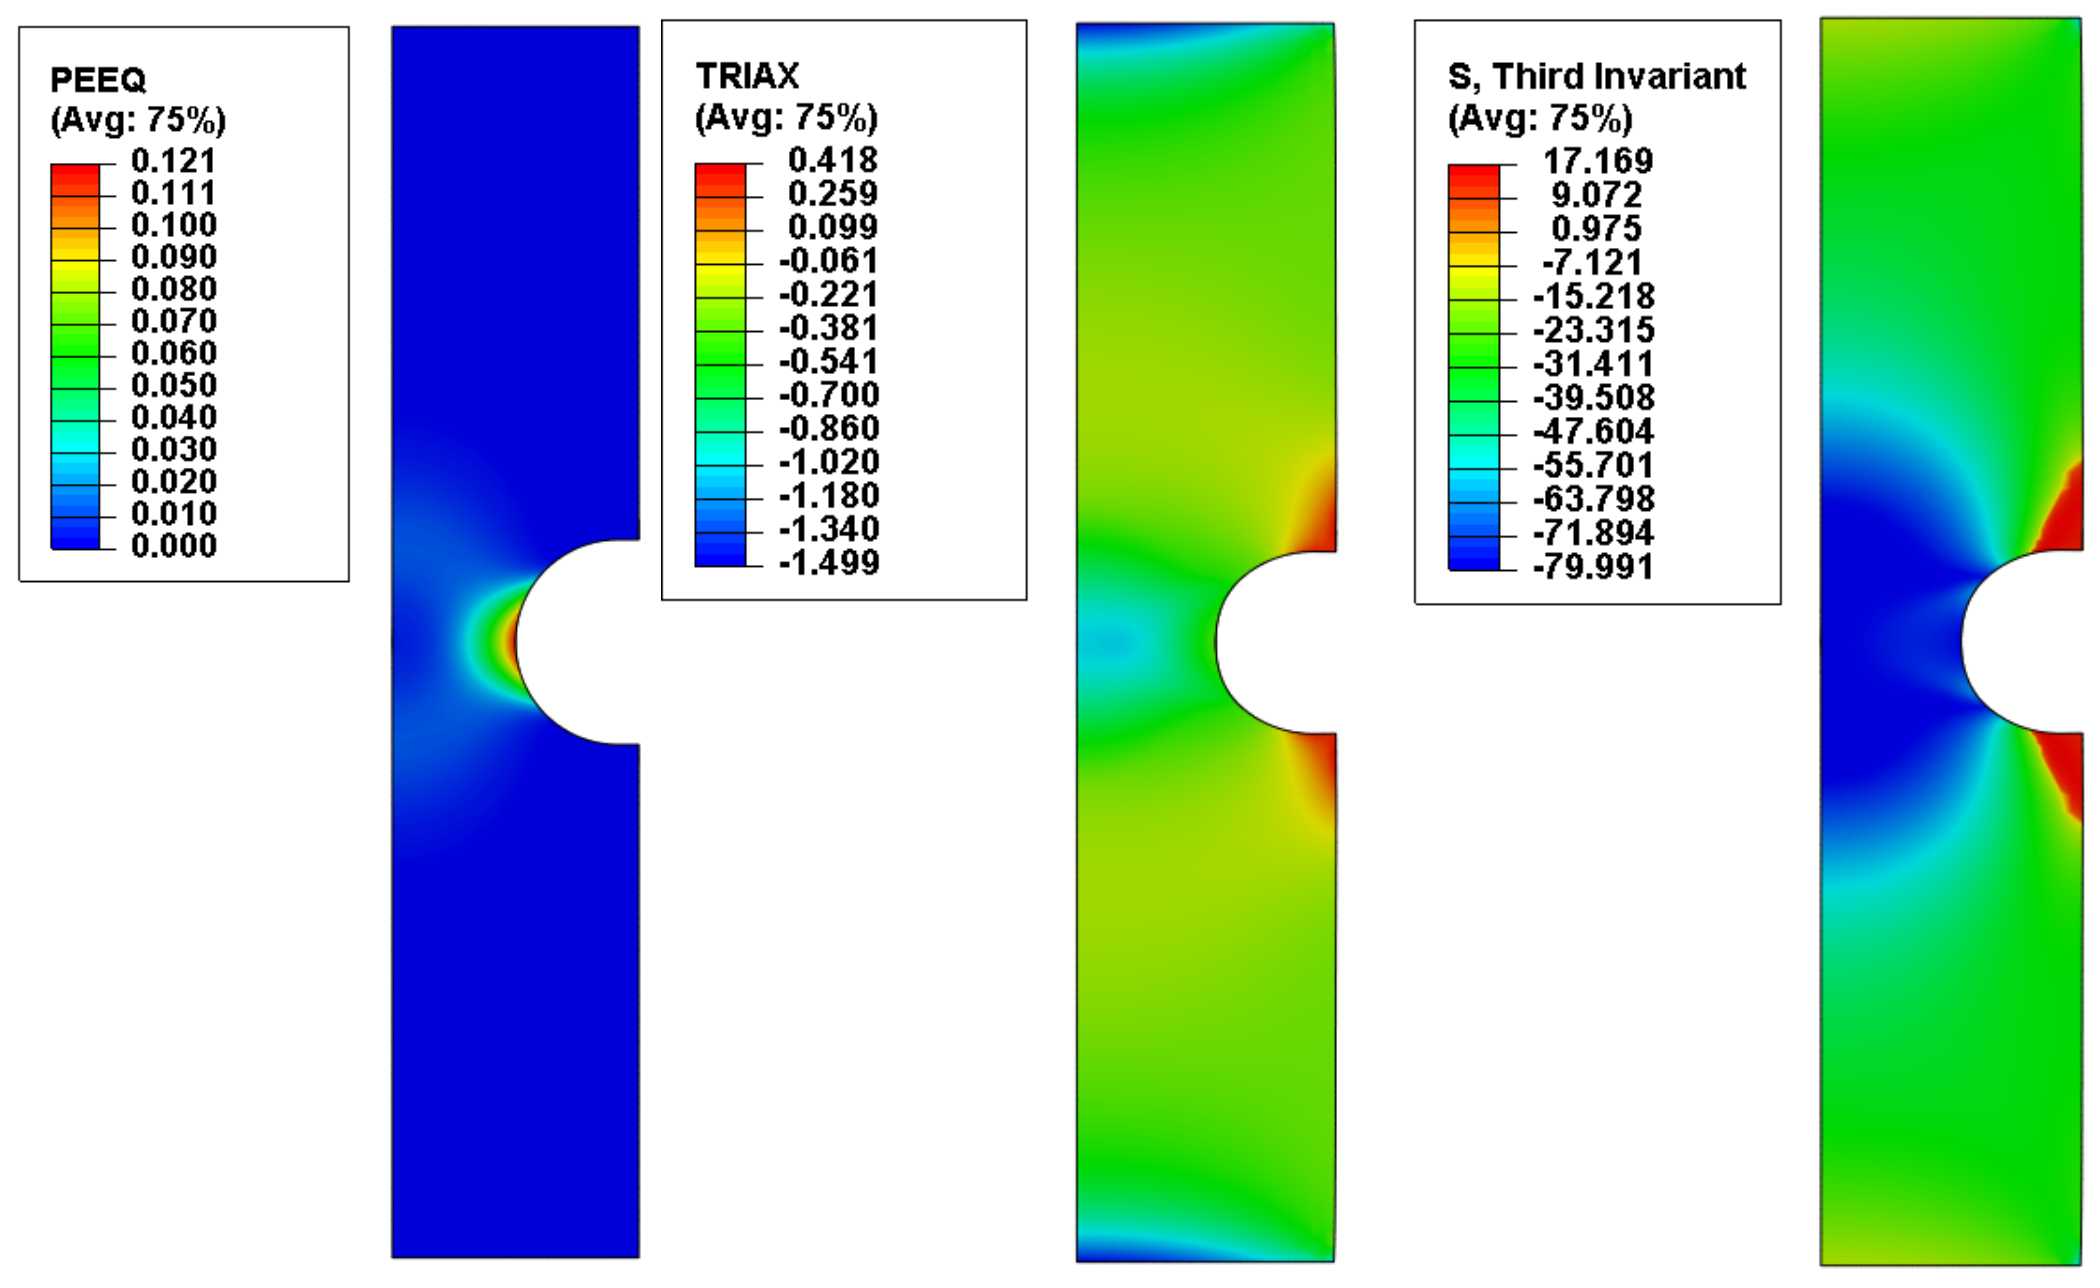
The von Mises equivalent stress
, the stress triaxiality
, the normalized third invariant of the deviatoric stress tensor
and the equivalent plastic strain
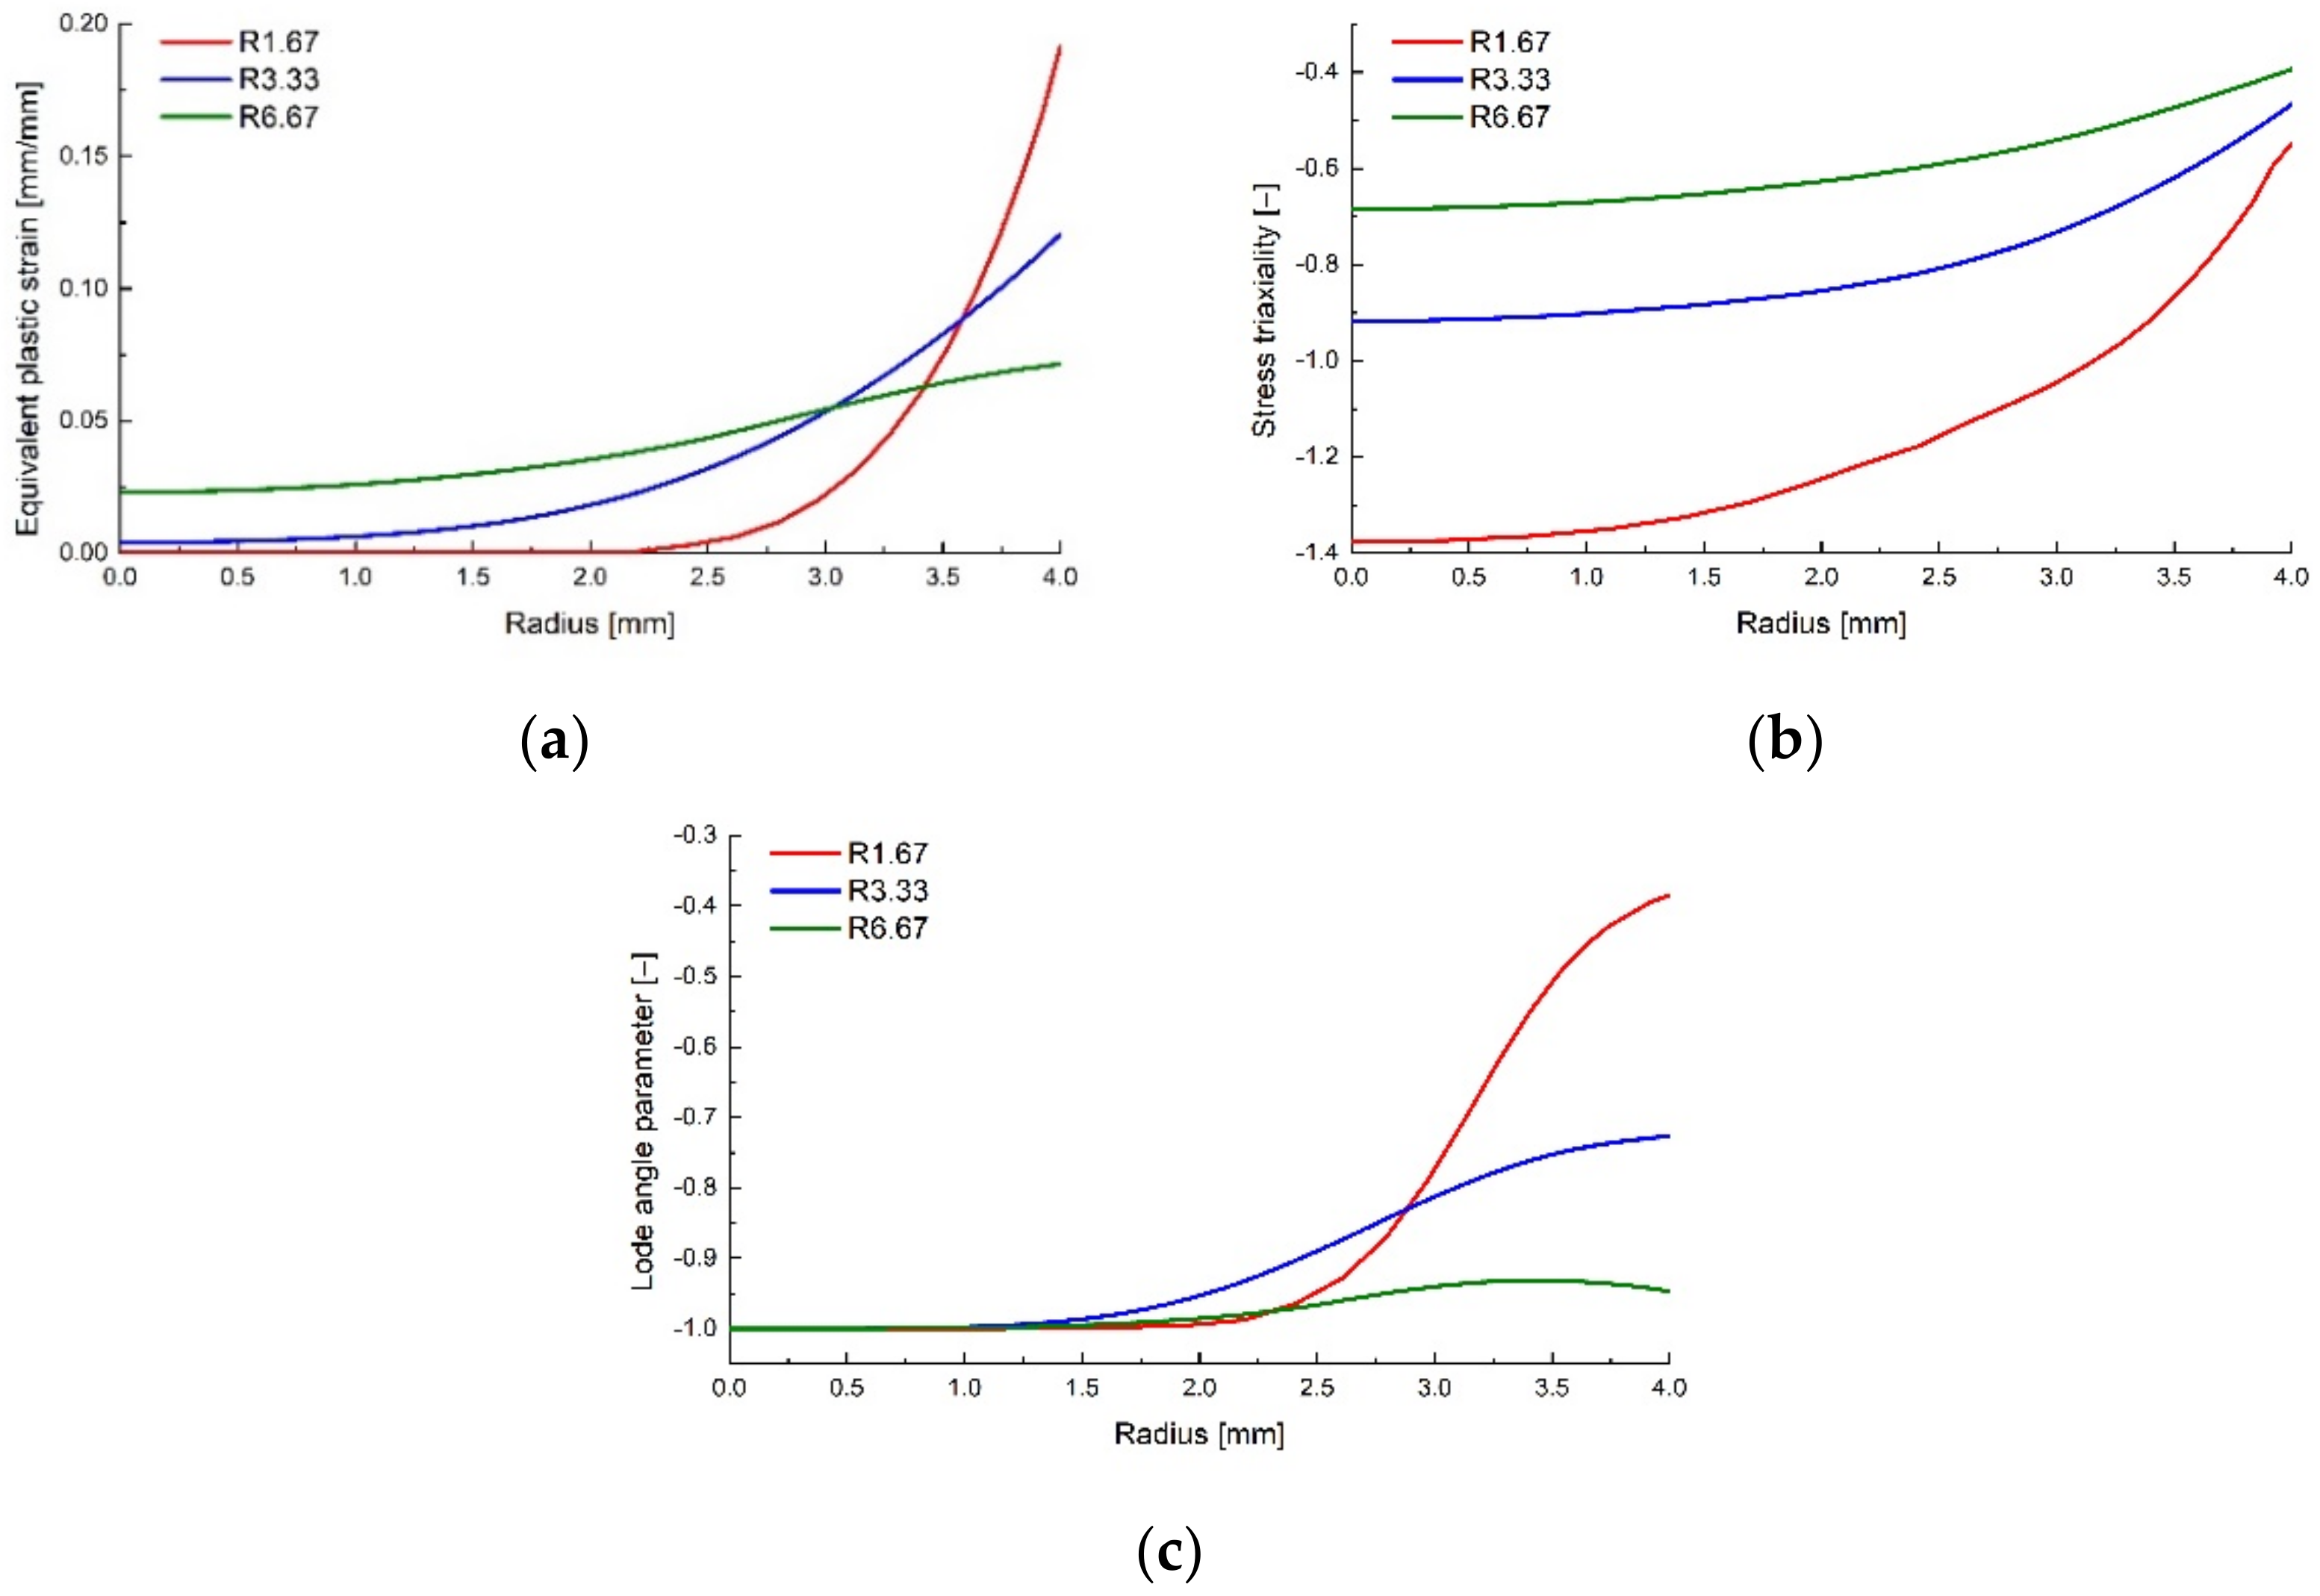
were recorded as field output variables. Their variation from the middle of the specimen to the notch tip were recorded (
Figure 11) and plotted (
Figure 12) at the corresponding displacement where the damage initiation occurred.
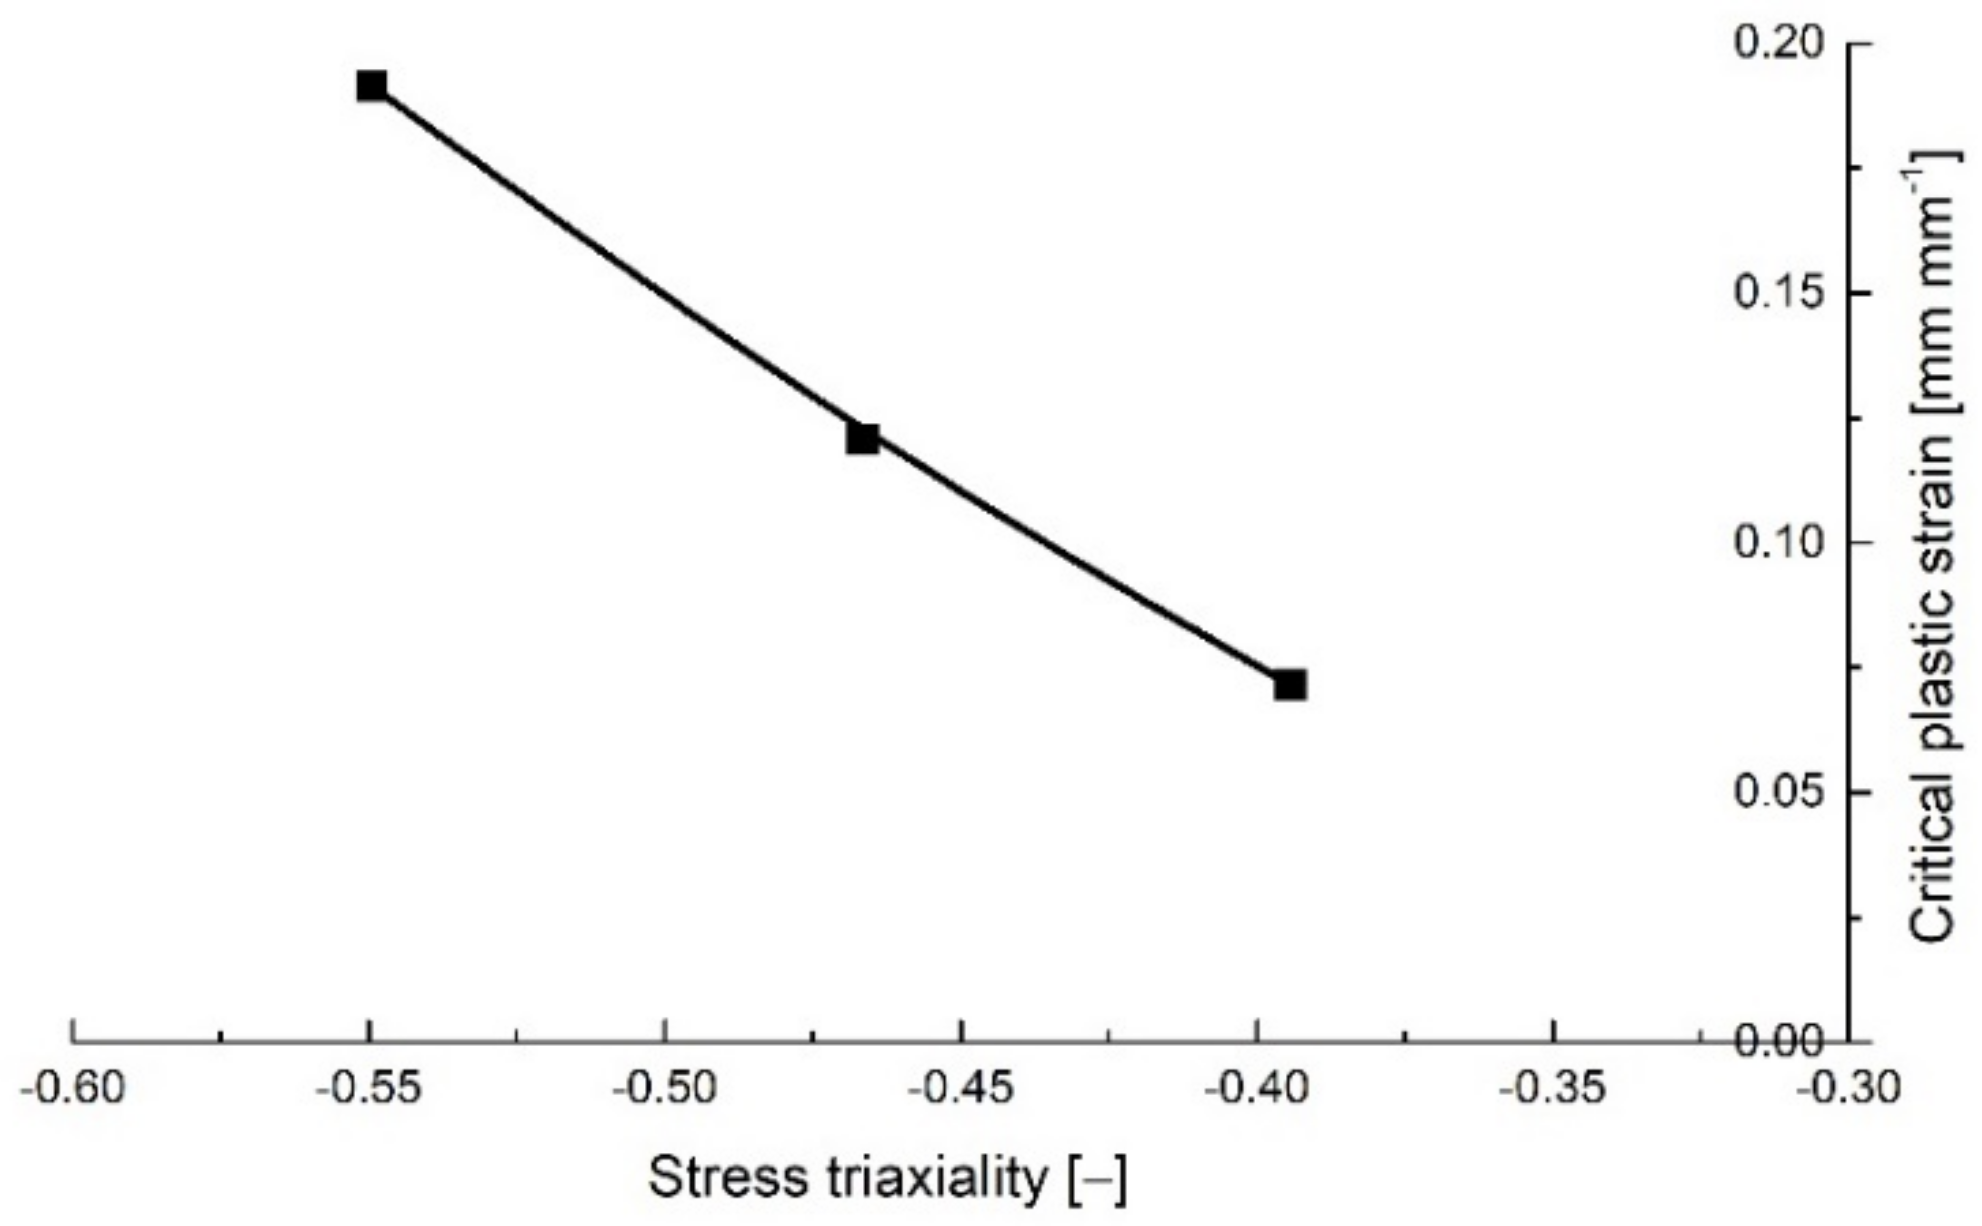
The corresponding values of the equivalent critical plastic strain, stress triaxiality and Lode angle parameter are presented in
Table 2.
The variation of the critical equivalent plastic strain with the stress triaxiality for the round specimens is presented in
Figure 13.
4. Arcan Tests
The Arcan tests were described in detail in [
22]. The experimental procedures were performed on rapid prototyped butterfly-shaped specimens, the design being based on the geometry proposed by Bai and Wierzbicki [
10], so that the critical region was located in the middle of the specimen, as shown in
Figure 14 [
22].
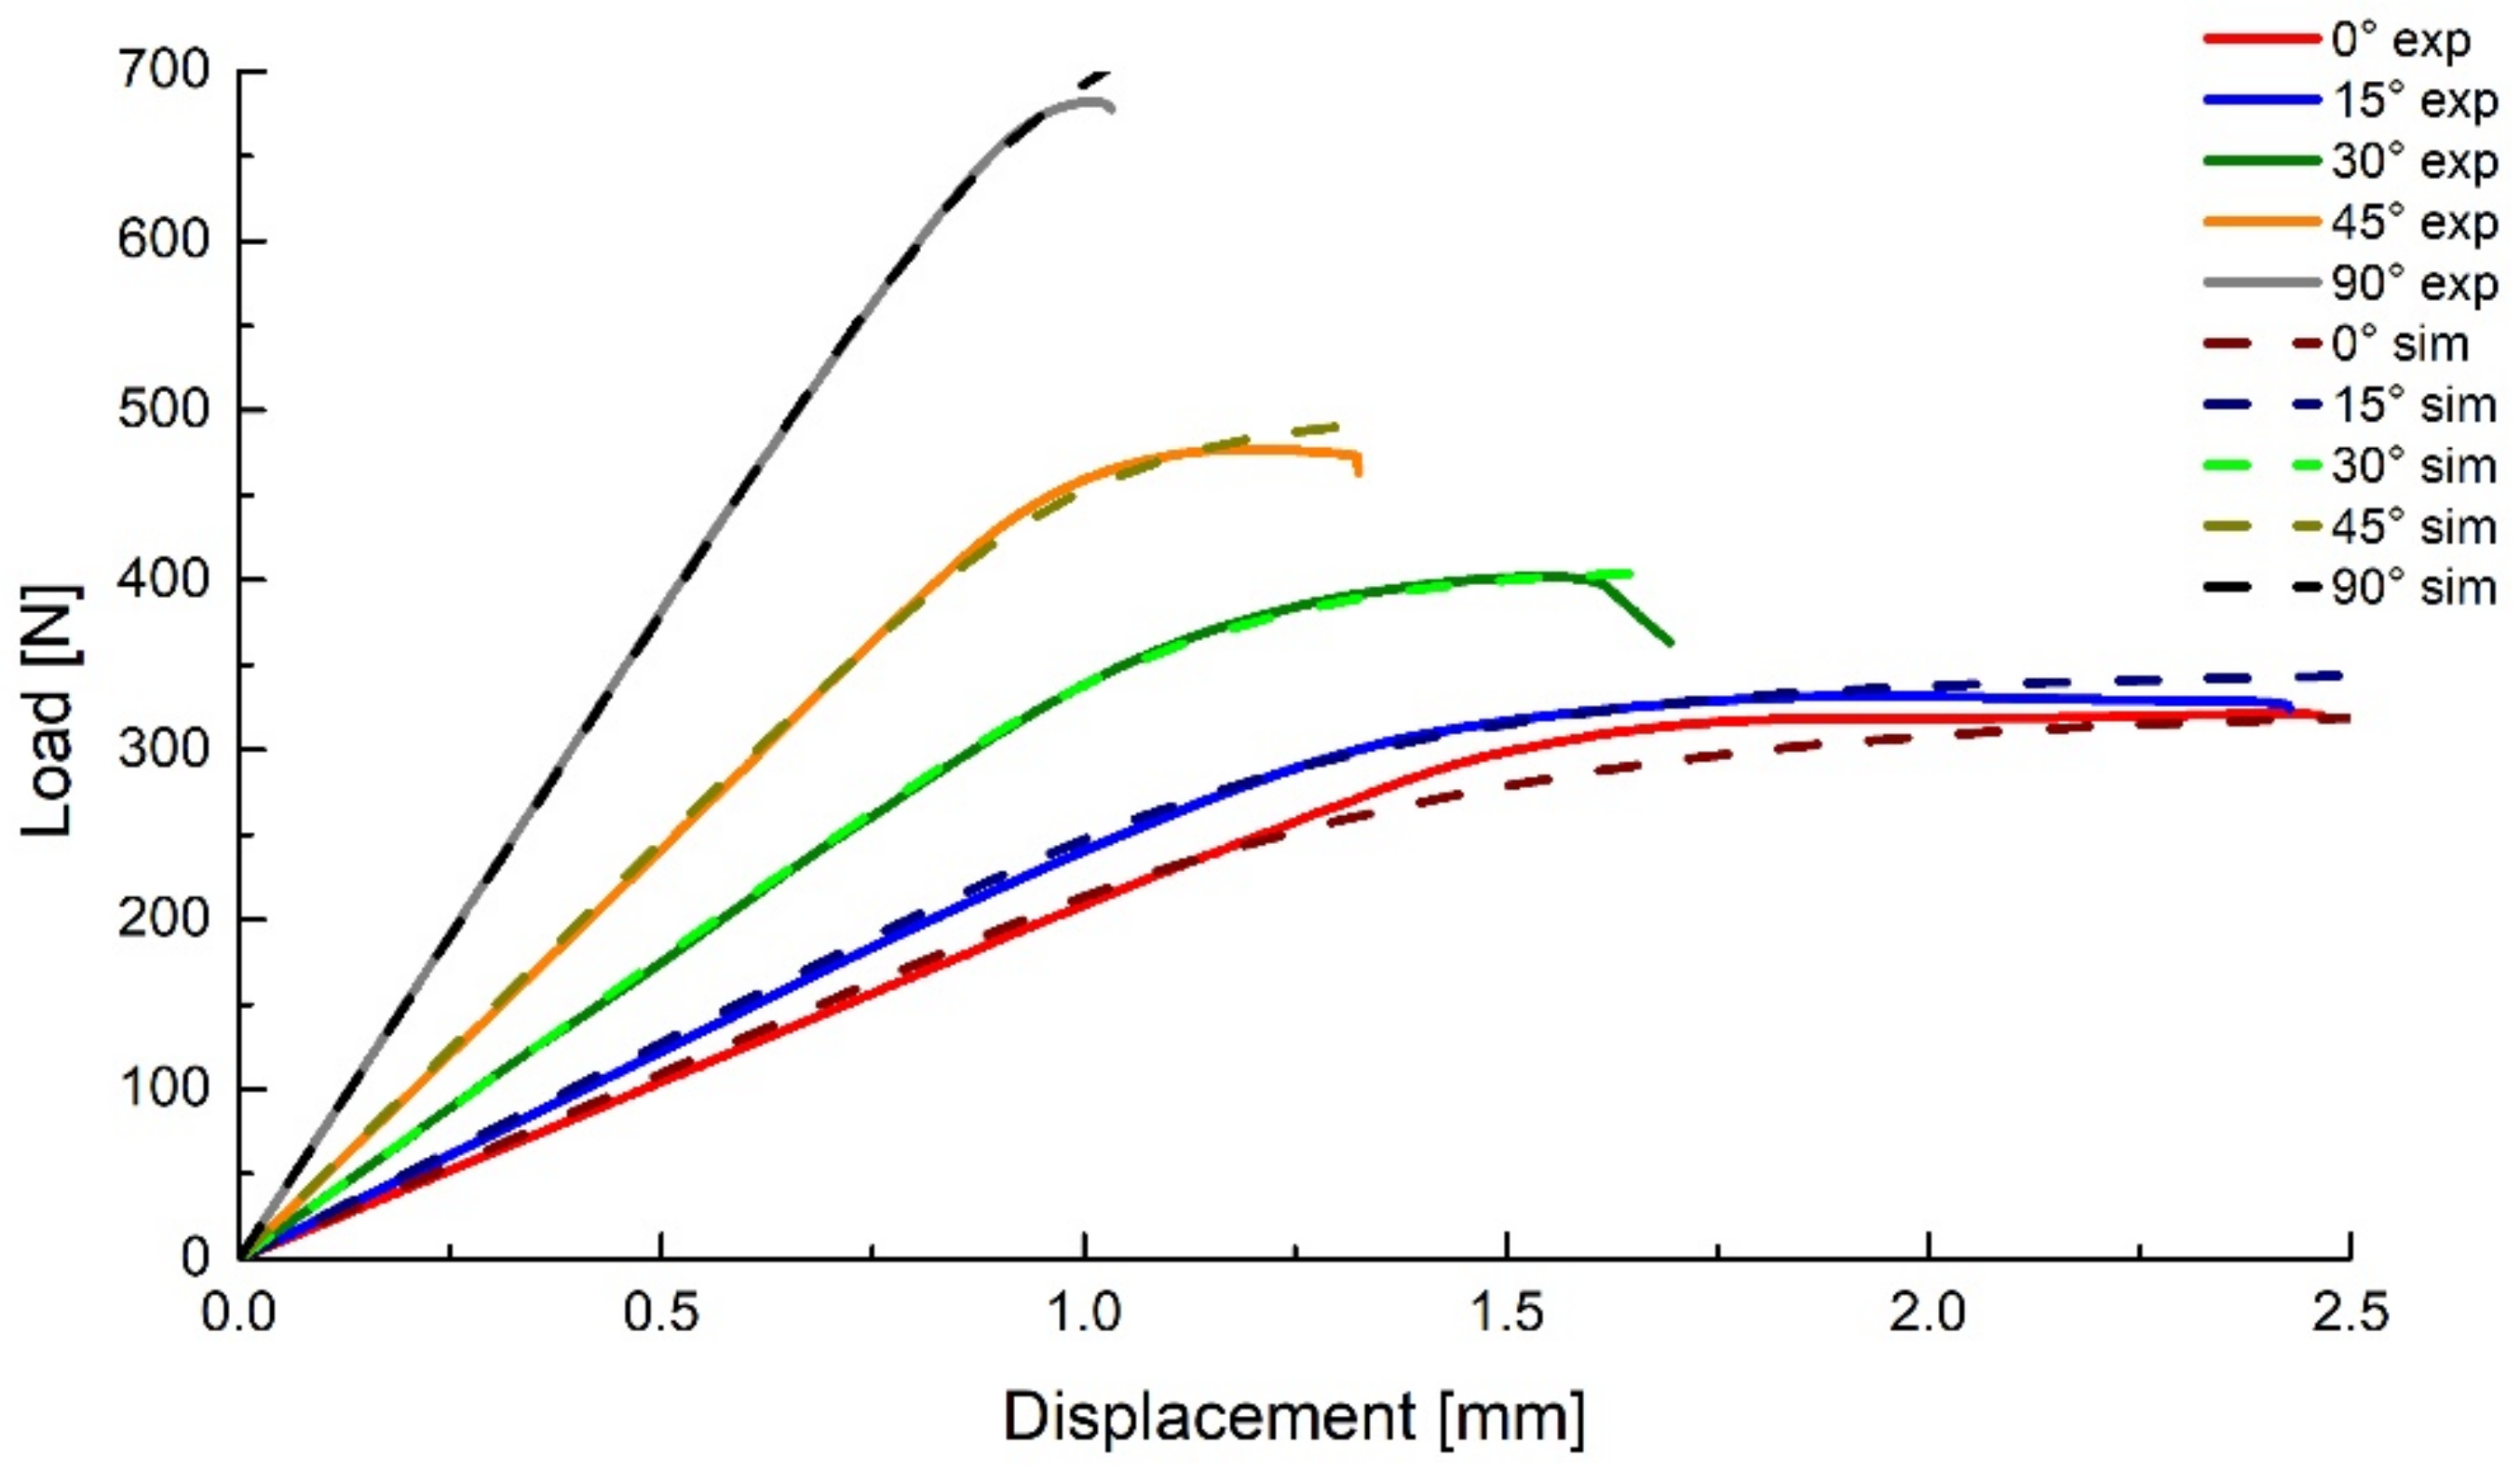
Five orientations of the Arcan device were used: 0°, 15°, 30°, 45° and 90°providing different states of stress triaxiality, from pure shear () to uniaxial tension (). The tests were performed on a 5 kN Zwick universal testing machine at mm mm−1 crosshead travel speed at room temperature.
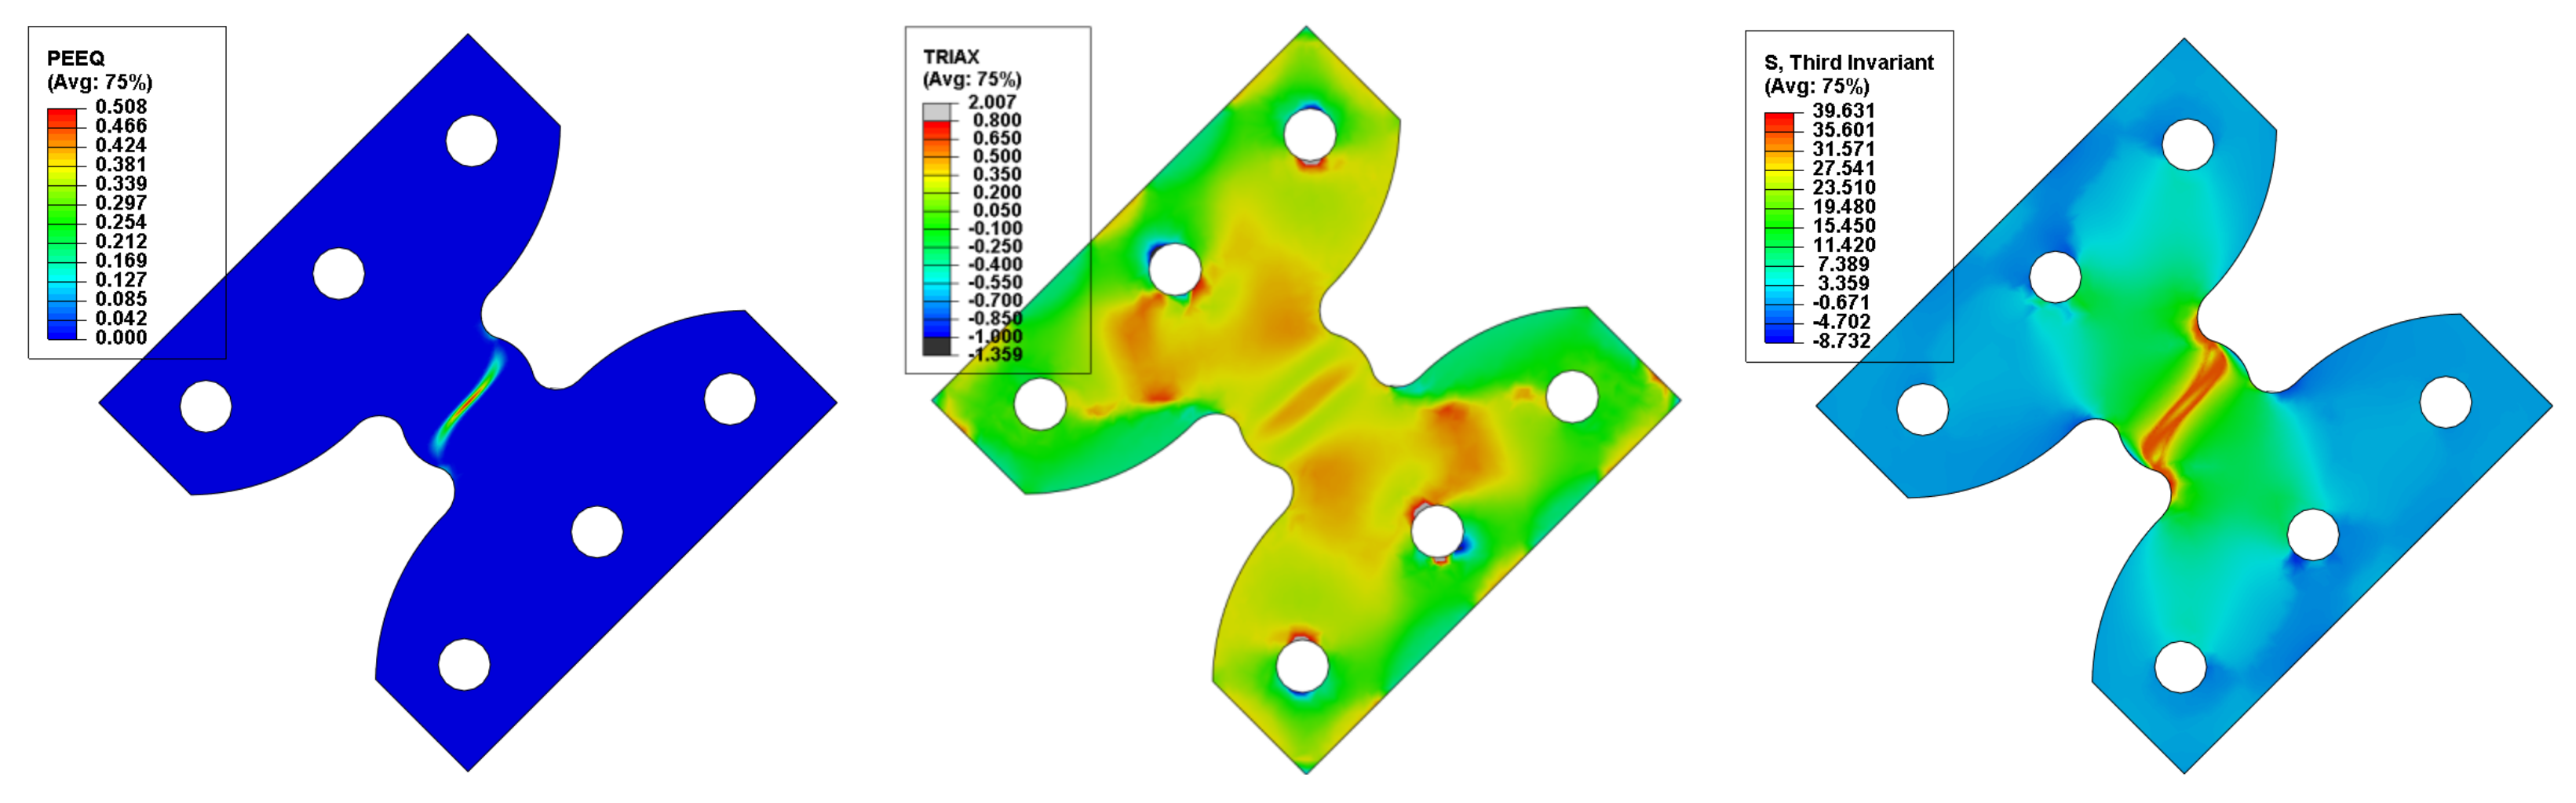
The numerical analyses (detailed in [
22]) were performed using the same material model as the previous loading scenarios. Multi-point constraints were used to link the pin holes from each side of the specimens to control points. As boundary conditions, one control point was fixed and the other was assigned with a displacement, identical to the travel at fail observed in the experimental procedures. As field output, the von Mises equivalent stress
, the stress triaxiality
, the normalized third invariant of the deviatoric stress tensor
and the equivalent plastic strain
were recorded (
Figure 15), the values being probed for the centre-most element of the model.
The resulting force–displacement curves are presented in
Figure 16, compared with representative curves form the experimental data.
As with the upsetting tests, the damage initiation was considered to occur at the displacement corresponding to the point where the numerical and experimental curves diverge. The equivalent critical plastic strain, stress triaxiality and Lode angle parameter for each loading scenario are presented in
Table 3.
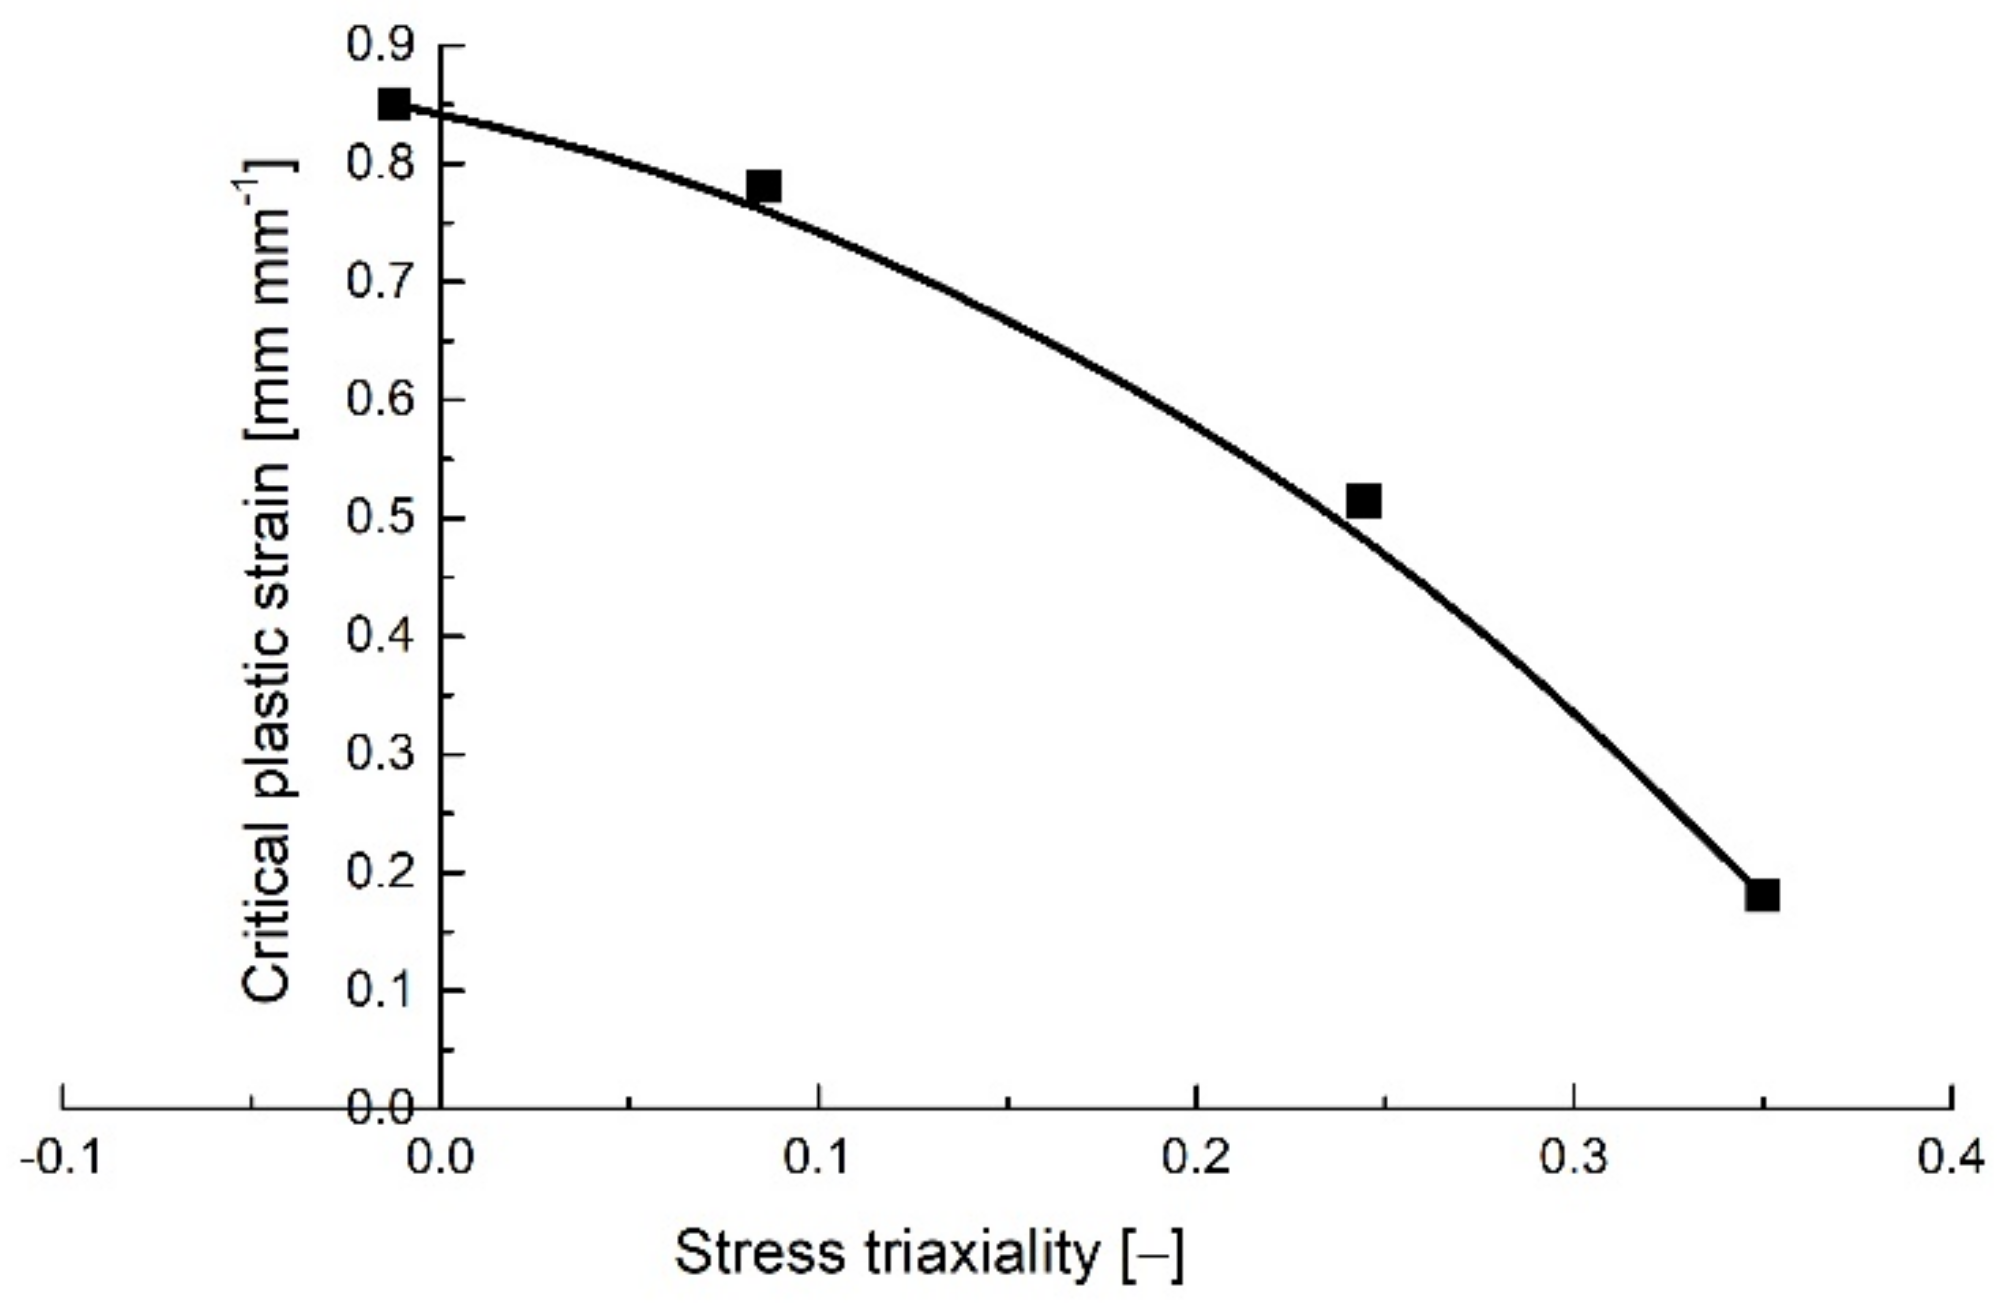
The variation of the critical equivalent plastic strain with stress triaxiality is presented in
Figure 17.
5. Discussions and Conclusions
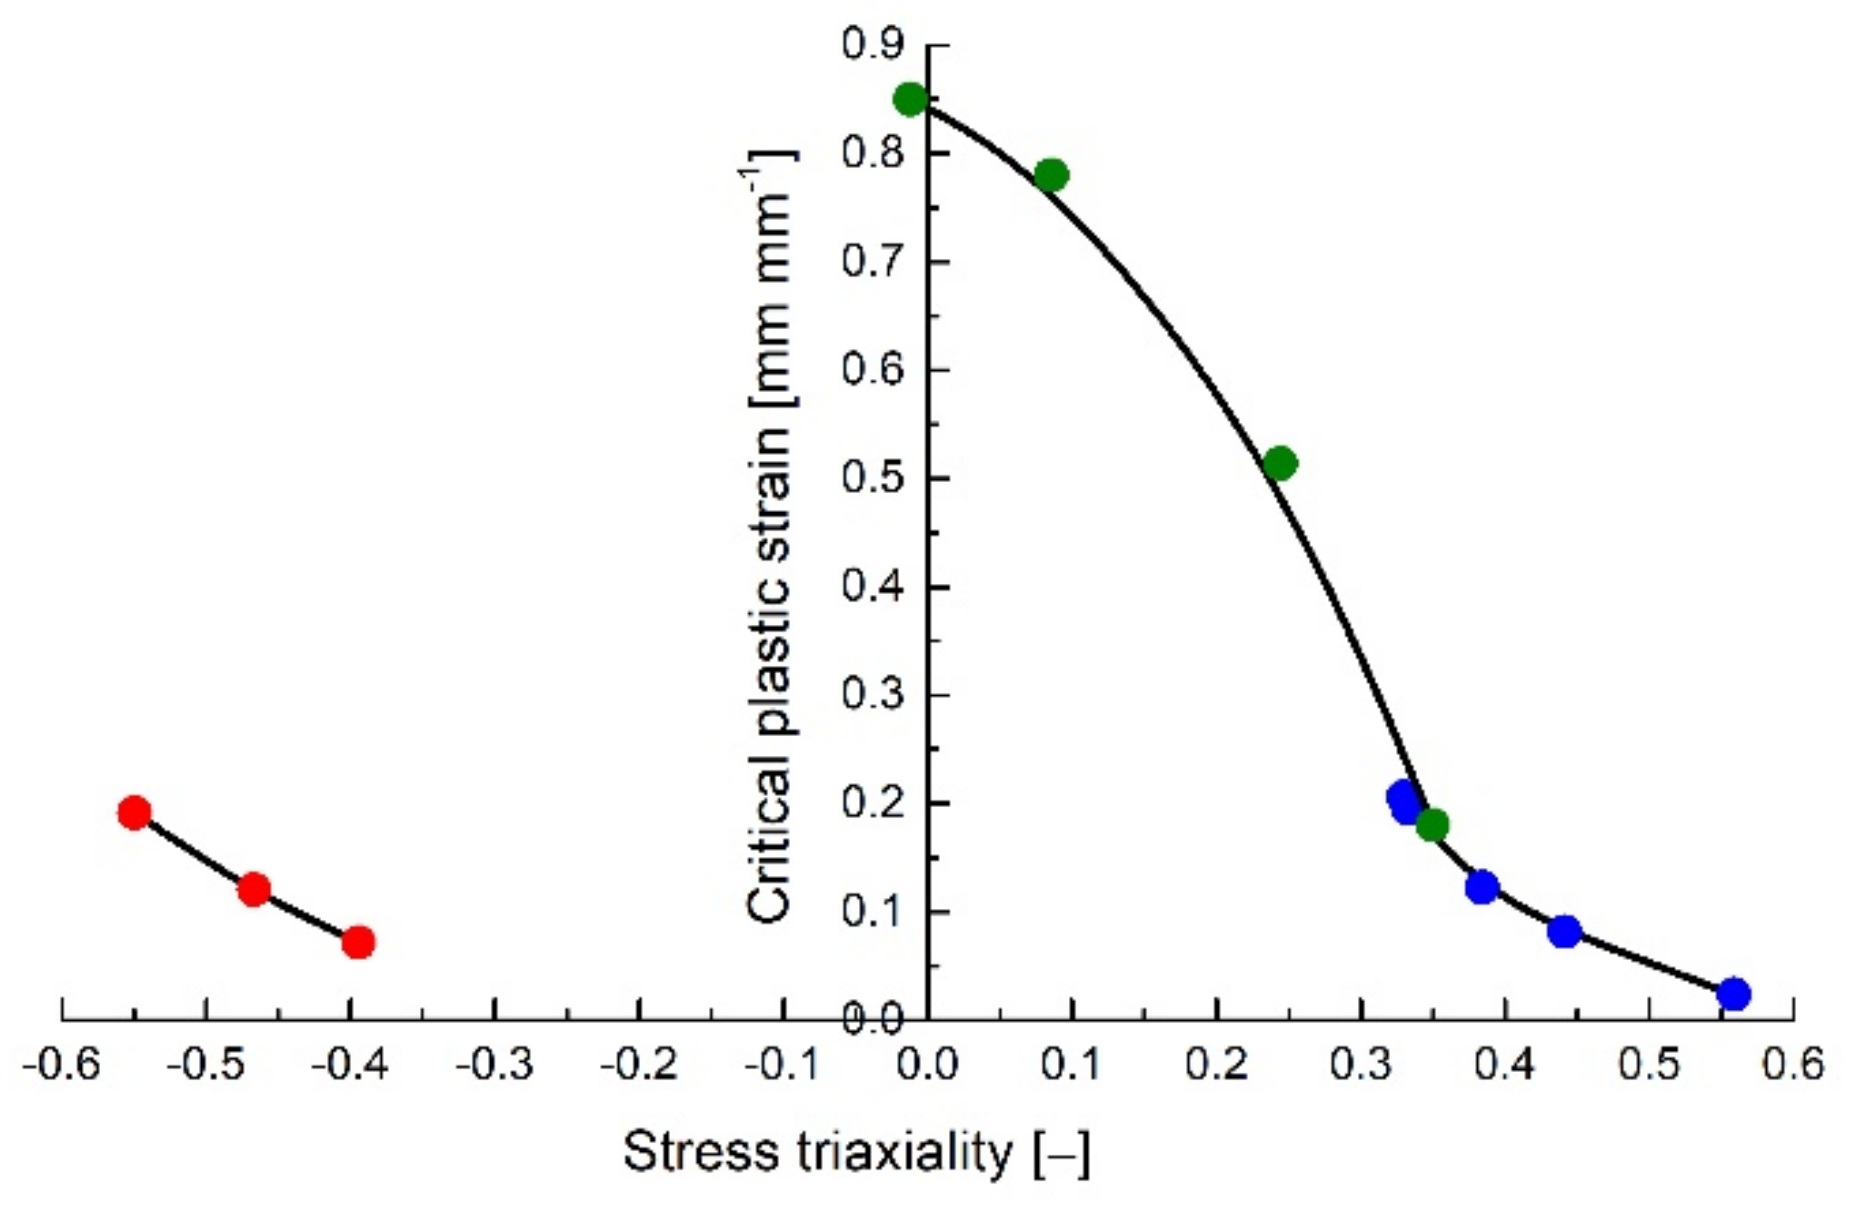
With the help of the proposed experimental plan, the plastic strain at failure was determined for various states of stress for the investigated ABS compound. The variation of the critical plastic strain was determined for both positive stress triaxiality values (tensile tests on notched specimens determined stress triaxialities that vary between 0.333 and 0.55 while the Arcan tests between 0 and 0.35) and negative stress triaxiality values (between −0.55 and −0.4 for the upsetting tests), as seen in
Figure 18.
The obtained results show that, for values of
> 0.333, the same exponential variation of the critical plastic strain with stress triaxiality observed in metals [
10,
12] and described by the Johnson–Cook damage model [
7] was witnessed for the investigated polymer.
However, the trendlines of the failure locus of the PolyJet ABS compound differ from those obtained for metallic materials for stress triaxiality values between
and
= 0.333 (predominantly shear loadings) [
10,
12,
24]. The highest values for the critical plastic strains in the case of metals were recorded for pure tensile loadings, while the case of pure shear determines a local minimum. In contrast, for the investigated material, the highest critical plastic strain values were obtained for pure shear.
The current experimental programme, coupled with the corresponding numerical analyses can be considered a foundation for a benchmark protocol used in determining the failure locus of polymeric materials. The damage model considered in this work (the critical plastic strain varies with the stress triaxiality and the Lode angle parameter) is implemented in commercial finite element analysis software (such as Abaqus, LS-Dyna or Pam-Crash). With adequate calibration, the model could be successfully used for predicting the failure of complex-shaped plastic components for various types of loading scenarios (that can determine a large variety of stress states), which can prove to be a very useful tool in product shape optimization and validation for companies that design and manufacture such products.
Future work will focus on the experimental determination of the failure locus for other polymeric compounds, in order to see if the shape of the failure locus is specific for this class of materials, or if it is a particularity of the investigated ABS compound. In addition, other types of geometries and tests will be investigated, in order to determine critical plastic strain values for stress triaxialities that were not covered with the current experimental plan (namely, values between = 0.4 and = 0.


