
Polymer Nanocomposite Containing Palladium Nanoparticles: Synthesis, Characterization, and Properties

 ,
, 
 , , ,
, , ,
Abstract
:1. Introduction
2. Materials and Methods
2.1. Materials
2.2. Preparation of Precursor and Composites
2.3. Equipment and Measurement
3. Results and Discussion
Properties of the Samples in the Microwave Range
4. Conclusions
Author Contributions
Funding
Institutional Review Board Statement
Informed Consent Statement
Data Availability Statement
Conflicts of Interest
Appendix A

References
- Nasrollahzadeh, M.; Sajadi, M.S.; Atarod, M.; Sajjadi, M.; Isaabadi, Z. An Introduction to Green Nanotechnology; Academic Press: Cambridge, MA, USA, 2019; ISBN 0-12-813587-5. [Google Scholar]
- Beznosyuk, S.A.; Maslova, O.A.; Zhukovsky, M.S.; Maksimov, D.Y. Computer Simulation of Hybrid Quantum Technologies of Energy Accumulation, Storage, Transformation and Transfer in Nanoenergy Materials. Int. J. Nanotechnol. 2019, 16, 322–333. [Google Scholar] [CrossRef]
- Engwerda, A.H.; Fletcher, S.P. A Molecular Assembler That Produces Polymers. Nat. Commun. 2020, 11, 1–7. [Google Scholar] [CrossRef] [PubMed]
- Baig, N.; Kammakakam, I.; Falath, W. Nanomaterials: A Review of Synthesis Methods, Properties, Recent Progress, and Challenges. Mater. Adv. 2021, 2, 1821–1871. [Google Scholar] [CrossRef]
- Chen, Y.; Fan, Z.; Zhang, Z.; Niu, W.; Li, C.; Yang, N.; Chen, B.; Zhang, H. Two-Dimensional Metal Nanomaterials: Synthesis, Properties, and Applications. Chem. Rev. 2018, 118, 6409–6455. [Google Scholar] [CrossRef] [PubMed]
- Hussain, C.M. Handbook of Nanomaterials for Industrial Applications; Elsevier: Amsterdam, The Netherlands, 2018; ISBN 978-0-12-813352-1. [Google Scholar]
- Saleh, T.A. Nanomaterials: Classification, Properties, and Environmental Toxicities. Environ. Technol. Innov. 2020, 20, 101067. [Google Scholar] [CrossRef]
- Wang, X.; Zhong, X.; Li, J.; Liu, Z.; Cheng, L. Inorganic Nanomaterials with Rapid Clearance for Biomedical Applications. Chem. Soc. Rev. 2021, 50, 8669–8742. [Google Scholar] [CrossRef] [PubMed]
- Marathe, U.; Padhan, M.; Bijwe, J. Various Attributes Controlling the Performance of Nano-Composites and Adhesives of TiC-PAEK. Compos. Sci. Technol. 2021, 214, 108969. [Google Scholar] [CrossRef]
- Yu, J.; Ding, S.; Yu, S.; Lu, Y.-C.; Xu, P.; Chu, B.; Sun, R.; Xu, J.; Wong, C.-P. Nanoparticles with Rationally Designed Isoelectronic Traps as Fillers Significantly Enhance Breakdown Strength and Electrostatic Energy Density of Polymer Composites. Compos. Sci. Technol. 2020, 195, 108201. [Google Scholar] [CrossRef]
- Ning, N.; Liu, W.; Hu, Q.; Zhang, L.; Jiang, Q.; Qiu, Y.; Wei, Y. Impressive Epoxy Toughening by a Structure-Engineered Core/Shell Polymer Nanoparticle. Compos. Sci. Technol. 2020, 199, 108364. [Google Scholar] [CrossRef]
- Mani-Lata, C.; Hussakan, C.; Panomsuwan, G. Fast and Facile Synthesis of Pt Nanoparticles Supported on Ketjen Black by Solution Plasma Sputtering as Bifunctional HER/ORR Catalysts. J. Compos. Sci. 2020, 4, 121. [Google Scholar] [CrossRef]
- Zając, I.; Szulc, J.; Gutarowska, B. The Effect of Ethylene Oxide and Silver Nanoparticles on Photographic Models in the Context of Disinfection of Photo Albums. J. Cult. Herit. 2021, 51, 59–70. [Google Scholar] [CrossRef]
- Suzana, A.F.; Wu, L.; Assefa, T.A.; Williams, B.P.; Harder, R.; Cha, W.; Kuo, C.-H.; Tsung, C.-K.; Robinson, I.K. Structure of a Seeded Palladium Nanoparticle and Its Dynamics during the Hydride Phase Transformation. Commun. Chem. 2021, 4, 64. [Google Scholar] [CrossRef]
- Shi, Y.; Liu, L.; Zhang, F.; Niu, M.; Zhao, Y.; Fan, Y.; Liang, Y.; Liu, M.; Zhang, Z.; Wang, J. Catalyst System for Hydrogenation Catalysis Based on Multiarm Hyperbranched Polymer Templated Metal (Au, Pt, Pd, Cu) Nanoparticles. Polymers 2017, 9, 459. [Google Scholar] [CrossRef]
- Xu, M.; Zhao, J.; Shu, G.; Liu, Q.; Zeng, M. Heterogeneous Catalytic Composites from Palladium Nanoparticles in Montmorillonite Intercalated with Poly (Vinyl Pyrrolidone) Chains. Polymers 2018, 10, 669. [Google Scholar] [CrossRef] [PubMed]
- Kim, J.G.; Lee, B.; Pham, N.N.T.; Lee, S.G.; Pak, C. Relationship between Hydrogen Binding Energy and Activity for Hydrogen Evolution Reaction by Palladium Supported on Sulfur-Doped Ordered Mesoporous Carbon. J. Ind. Eng. Chem. 2020, 89, 361–367. [Google Scholar] [CrossRef]
- Shulga, R.N.; Petrov, A.Y.; Putilova, I.V. The Arctic: Ecology and Hydrogen Energy. Int. J. Hydrog. Energy 2020, 45, 7185–7198. [Google Scholar] [CrossRef]
- Jung, W.S. Enhanced Performance of Pt Nanoparticles on Ni-N Co-Doped Graphitized Carbon for Oxygen Reduction Reaction in Polymer Electrolyte Membrane Fuel Cells. Catalysts 2021, 11, 909. [Google Scholar] [CrossRef]
- Dorraj, M.; Sadjadi, S.; Amani, A. Pd on a Novel Nitrogen Doped Porous Carbon Derived from Task Specific Ionic Liquid and Biomass: An Efficient Catalyst for Reduction of Organic Dyes. Mater. Chem. Phys. 2021, 273, 124913. [Google Scholar] [CrossRef]
- Zhang, L.; Yu, H.; Gao, S.; Wang, H.; He, Z.; Huang, K. Synthesis of Yolk-Shell Magnetic Porous Organic Nanospheres Supported Pd Catalyst for Oxidation of Alcohols and Heck Reactions. Chem. Eng. J. 2021, 423, 130237. [Google Scholar] [CrossRef]
- Zeng, Y.; Gu, L.; Feng, Y.; Jiang, W.; Ji, W. Morphologically Uniform Pd/FexMn3−xO4-HP Interfaces as the High-Performance Model Catalysts for Catalytic Combustion of Volatile Organic Compound. Appl. Surf. Sci. 2020, 528, 147006. [Google Scholar] [CrossRef]
- Drings, H.; Viswanath, R.N.; Kramer, D.; Lemier, C.; Weissmüller, J.; Würschum, R. Tuneable Magnetic Susceptibility of Nanocrystalline Palladium. Appl. Phys. Lett. 2006, 88, 253103. [Google Scholar] [CrossRef]
- Chen, H.; Brener, N.E.; Callaway, J. Electronic Structure, Optical and Magnetic Properties of Fcc Palladium. Phys. Rev. B 1989, 40, 1443–1449. [Google Scholar] [CrossRef] [PubMed]
- Shukla, A.K. EMR/ESR/EPR Spectroscopy for Characterization of Nanomaterials; Springer: Berlin/Heidelberg, Germany, 2017; ISBN 81-322-3655-6. [Google Scholar]
- Teranishi, T.; Hori, H.; Miyake, M. ESR Study on Palladium Nanoparticles. J. Phys. Chem. B 1997, 101, 5774–5776. [Google Scholar] [CrossRef]
- Pinto de Carvalho, R.; Yong, P.; Mikheenko, I.P.; Paterson-Beedle, M.; Macaskie, L.E. Electron Paramagnetic Resonance Analysis of Active Bio-Pd-Based Electrodes for Fuel Cells. Adv. Mater. Res. 2009, 71–73, 737–740. [Google Scholar] [CrossRef]
- Sancier, K.M.; Inami, S.H. ESR Evidence of Hydrogen Migration on Supported Metal Catalysts. J. Catal. 1968, 11, 135–142. [Google Scholar] [CrossRef]
- Sako, S.; Ohshima, K. ESR Observations in Small Particles of Palladium and Their Origins. J. Phys. Soc. Jpn. 1996, 65, 4062–4066. [Google Scholar] [CrossRef]
- Halperin, W.P. Quantum Size Effects in Metal Particles. Rev. Mod. Phys. 1986, 58, 533–606. [Google Scholar] [CrossRef]
- Chlumsky, O.; Purkrtova, S.; Michova, H.; Sykorova, H.; Slepicka, P.; Fajstavr, D.; Ulbrich, P.; Viktorova, J.; Demnerova, K. Antimicrobial Properties of Palladium and Platinum Nanoparticles: A New Tool for Combating Food-Borne Pathogens. Int. J. Mol. Sci. 2021, 22, 7892. [Google Scholar] [CrossRef]
- Usoltsev, O.A.; Pnevskaya, A.Y.; Kamyshova, E.G.; Tereshchenko, A.A.; Skorynina, A.A.; Zhang, W.; Yao, T.; Bugaev, A.L.; Soldatov, A.V. Dehydrogenation of Ethylene on Supported Palladium Nanoparticles: A Double View from Metal and Hydrocarbon Sides. Nanomaterials 2020, 10, 1643. [Google Scholar] [CrossRef]
- Lin, Y.-C.; Chen, C.-H.; Chen, K.-S.; Peng, Y.-P.; Lin, Y.-C.; Huang, S.-W.; Huang, C.-E.; Lai, H.-W.; Li, H.-W. Green Synthesized Palladium Coated Titanium Nanotube Arrays for Simultaneous Azo-Dye Degradation and Hydrogen Production. Catalysts 2020, 10, 1330. [Google Scholar] [CrossRef]
- Chen, Y.; Li, J.; Yang, W.; Gao, S. Fabrication and Catalytic Properties of Films Based on Metal Ion-Ligand Interaction between K2PdCl4 and 3-Amino-3-(4-Pyridinyl)-Propionitrile. Struct. Chem. 2020, 39, 526–534. [Google Scholar]
- Gubin, S.; Yurkov, G.; Korobov, M.; Koksharov, Y.; Kozinkin, A.; Pirog, I.; Zubkov, S.; Kitaev, V.; Sarichev, D.; Bouznik, V. Immobilization of Metal-Containing Nanoparticles on the Surface of Polytetrafluoroethylene Nanogranules. Acta Mater. 2005, 53, 1407–1413. [Google Scholar] [CrossRef]
- Podsukhina, S.S.; Kozinkin, A.V.; Vlasenko, V.G.; Yurkov, G.Y.; Popkov, O.V. Composition and Electronic and Atomic Structure of Palladium Nanoparticles at Different Metal Concentrations in a Polyethylene Matrix. Tech. Phys. Lett. 2020, 46, 323–326. [Google Scholar] [CrossRef]
- Kozinkin, A.V.; Podsukhina, S.S.; Vlasenko, V.G.; Yurkov, G.Y.; Taratanov, N.A.; Biryukova, M.I.; Zubavichus, Y.V. Atomic Structure of Gold Nanoparticles Stabilized in Polyethylene. Inorg. Mater. Appl. Res. 2017, 8, 327–330. [Google Scholar] [CrossRef]
- Prorokova, N.P.; Vavilova, S.Y.; Biryukova, M.I.; Yurkov, G.Y.; Buznik, V.M. Polypropylene Threads Modified by Iron-Containing Nanoparticles Stabilized in Polyethylene. Fibre Chem. 2016, 47, 384–389. [Google Scholar] [CrossRef]
- Tomaszewski, P.E. The Uncertainty in the Grain Size Calculation from X-Ray Diffraction Data. Phase Transit. 2013, 86, 260–266. [Google Scholar] [CrossRef]
- Patterson, A.L. The Scherrer Formula for X-Ray Particle Size Determination. Phys. Rev. 1939, 56, 978–982. [Google Scholar] [CrossRef]
- Pauli, W. Über Den Zusammenhang Des Abschlusses Der Elektronengruppen Im Atom Mit Der Komplexstruktur Der Spektren. Einführ. Orig. 1925, 229, 765–783. [Google Scholar] [CrossRef]
- Gates-Rector, S.; Blanton, T. The Powder Diffraction File: A Quality Materials Characterization Database. Powder Diffr. 2019, 34, 352–360. [Google Scholar] [CrossRef]
- Glyzdova, D.V.; Afonasenko, T.N.; Khramov, E.V.; Leont’eva, N.N.; Trenikhin, M.V.; Kremneva, A.M.; Shlyapin, D.A. Effect of Pretreatment with Hydrogen on the Structure and Properties of Carbon-Supported Pd-Ag-Nanoalloys for Ethylene Production by Acetylene Hydrogenation. Mol. Catal. 2021, 511, 111717. [Google Scholar] [CrossRef]
- Panin, R.V.; Khasanova, N.R.; Bougerol, C.; Schnelle, W.; Van Tendeloo, G.; Antipov, E.V. Ordering of Pd2+ and Pd4+ in the Mixed-Valent Palladate KPd2O3. Inorg. Chem. 2010, 49, 1295–1297. [Google Scholar] [CrossRef] [PubMed]
- Brustolon, M.; Giamello, E. Electron Paramagnetic Resonance: A Practitioners Toolkit; John Wiley & Sons: Hoboken, NJ, USA, 2009; ISBN 978-0-470-43222-8. [Google Scholar]
- Eaton, S.S.; Eaton, G.R. Electron Paramagnetic Resonance. In Analytical Instrumentation Handbook; CRC Press: Boca Raton, FL, USA, 2004; pp. 375–424. ISBN 0-429-12143-1. [Google Scholar]
- Balberg, I.; Azulay, D.; Toker, D.; Millo, O. Percolation and Tunneling in Composite Materials. Int. J. Mod. Phys. B 2004, 18, 2091–2121. [Google Scholar] [CrossRef]
- Grimaldi, C.; Balberg, I. Tunneling and Nonuniversality in Continuum Percolation Systems. Phys. Rev. Lett. 2006, 96, 066602. [Google Scholar] [CrossRef] [PubMed]
- Fionov, A.S.; Yurkov, G.Y.; Kolesov, V.V.; Pankratov, D.A.; Ovchenkov, E.A.; Koksharov, Y.A. Composite Material Based on Iron-Containing Nanoparticles for Applications in the Problems of Electromagnetic Compatibility. J. Commun. Technol. Electron. 2012, 57, 543–552. [Google Scholar] [CrossRef]
- Elbayoumy, E.; El-Ghamaz, N.A.; Mohamed, F.S.; Diab, M.A.; Nakano, T. Dielectric Permittivity, AC Electrical Conductivity and Conduction Mechanism of High Crosslinked-Vinyl Polymers and Their Pd(OAc)2 Composites. Polymers 2021, 13, 3005. [Google Scholar] [CrossRef]
- Sundaresan, A.; Rao, C.N.R. Ferromagnetism as a Universal Feature of Inorganic Nanoparticles. Nano Today 2009, 4, 96–106. [Google Scholar] [CrossRef]


| Sample | Phase | N | R, Å | σ2, Å | The Type | Q |
|---|---|---|---|---|---|---|
| Pd-foil | Pdmet | 12 | 2.75 | 0.0065 | Pd-Pd | 2.0 1 |
| PE-Pd (10 wt%) | PdO Pdmet | 1.8 5.7 | 1.93 2.75 | 0.0040 0.0067 | Pd-O Pd-Pd | 12 2 |
| PE-Pd (20 wt%) | PdO Pdmet | 1.7 7 | 1.96 2.74 | 0.0040 0.0067 | Pd-O PdO-Pd | 7.5 2 |
| Sample | Composition | d, mm | h, mm | mass, g | ρ, g/cm3 |
|---|---|---|---|---|---|
| HPPE + 10% Pd | PE + 10% Pd | 25.8 | 1.82 | 0.960 | 1.008 |
| HPPE + 20% Pd | PE + 20% Pd | 25.8 | 1.47 | 0.850 | 1.104 |
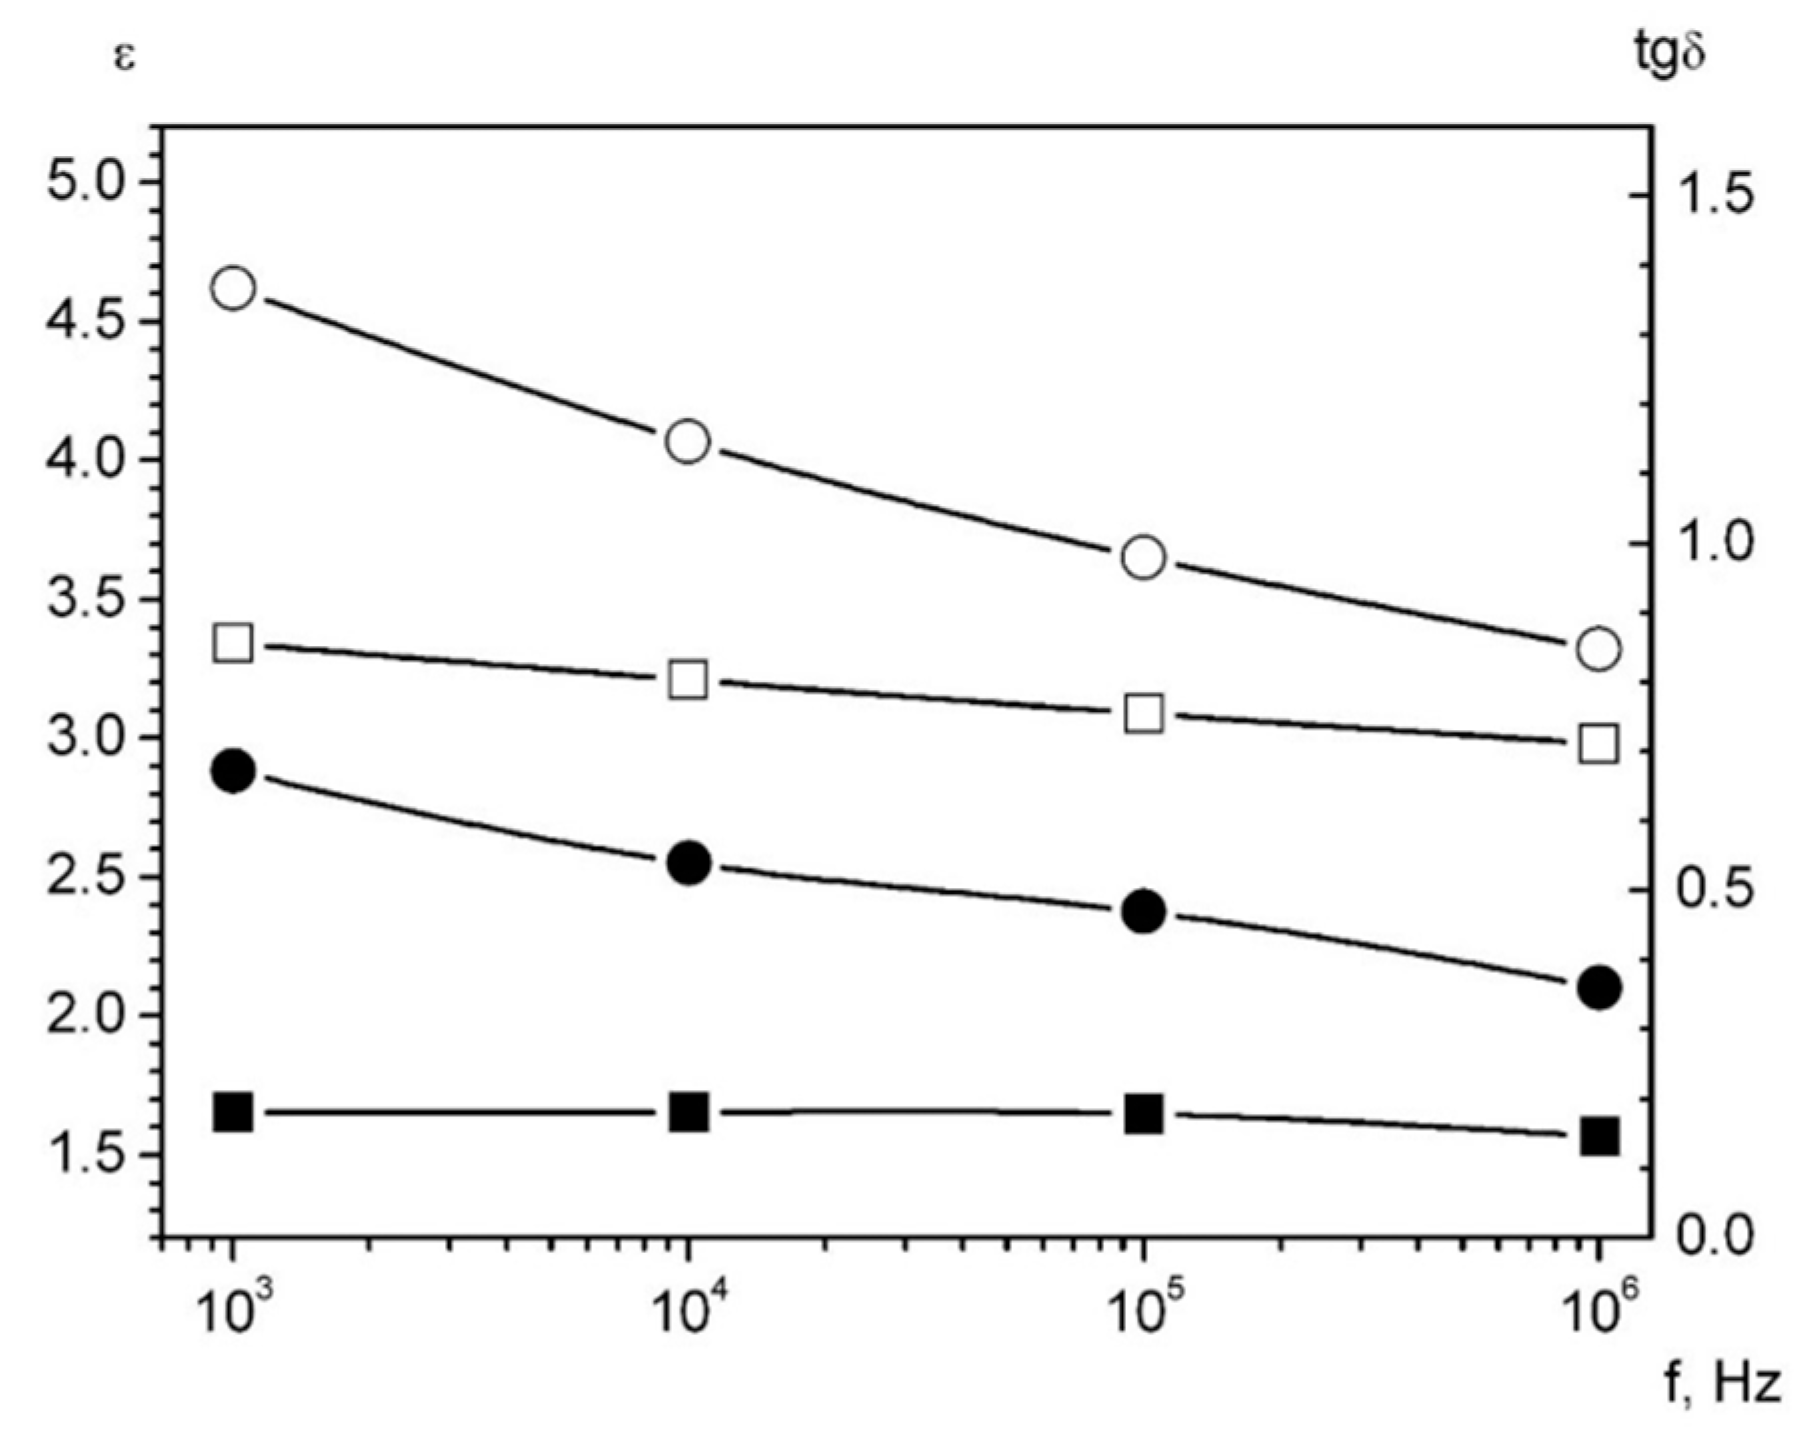
| Sample | ρV, Om × m | ε and tgδ (in Brackets) at fwork: | |||
|---|---|---|---|---|---|
| 1 kHz | 10 kHz | 100 kHz | 1 MHz | ||
| HPPE + 10% Pd | 2.0 × 10¹⁵ | 3.34 (0.180) | 3.21 (0.180) | 3.09 (0.178) | 2.98 (0.146) |
| HPPE + 20% Pd | 3.2 × 10¹² | 4.62 (0.672) | 4.07 (0.539) | 3.65 (0.469) | 3.32 (0.360) |
| PE | 1.7 × 10¹⁶ | 2.36 | 2.25 | ||
| Sample | Fwork = 30 GHz | ||
|---|---|---|---|
| A, dB | R | L | |
| HDPE | 0.3 | 0.12 | 0.0 |
| HDPE + 10% Pd | 1.05 | 0.12 | 0.09 |
| HDPE + 20% Pd | 1.10 | 0.19 | 0.03 |
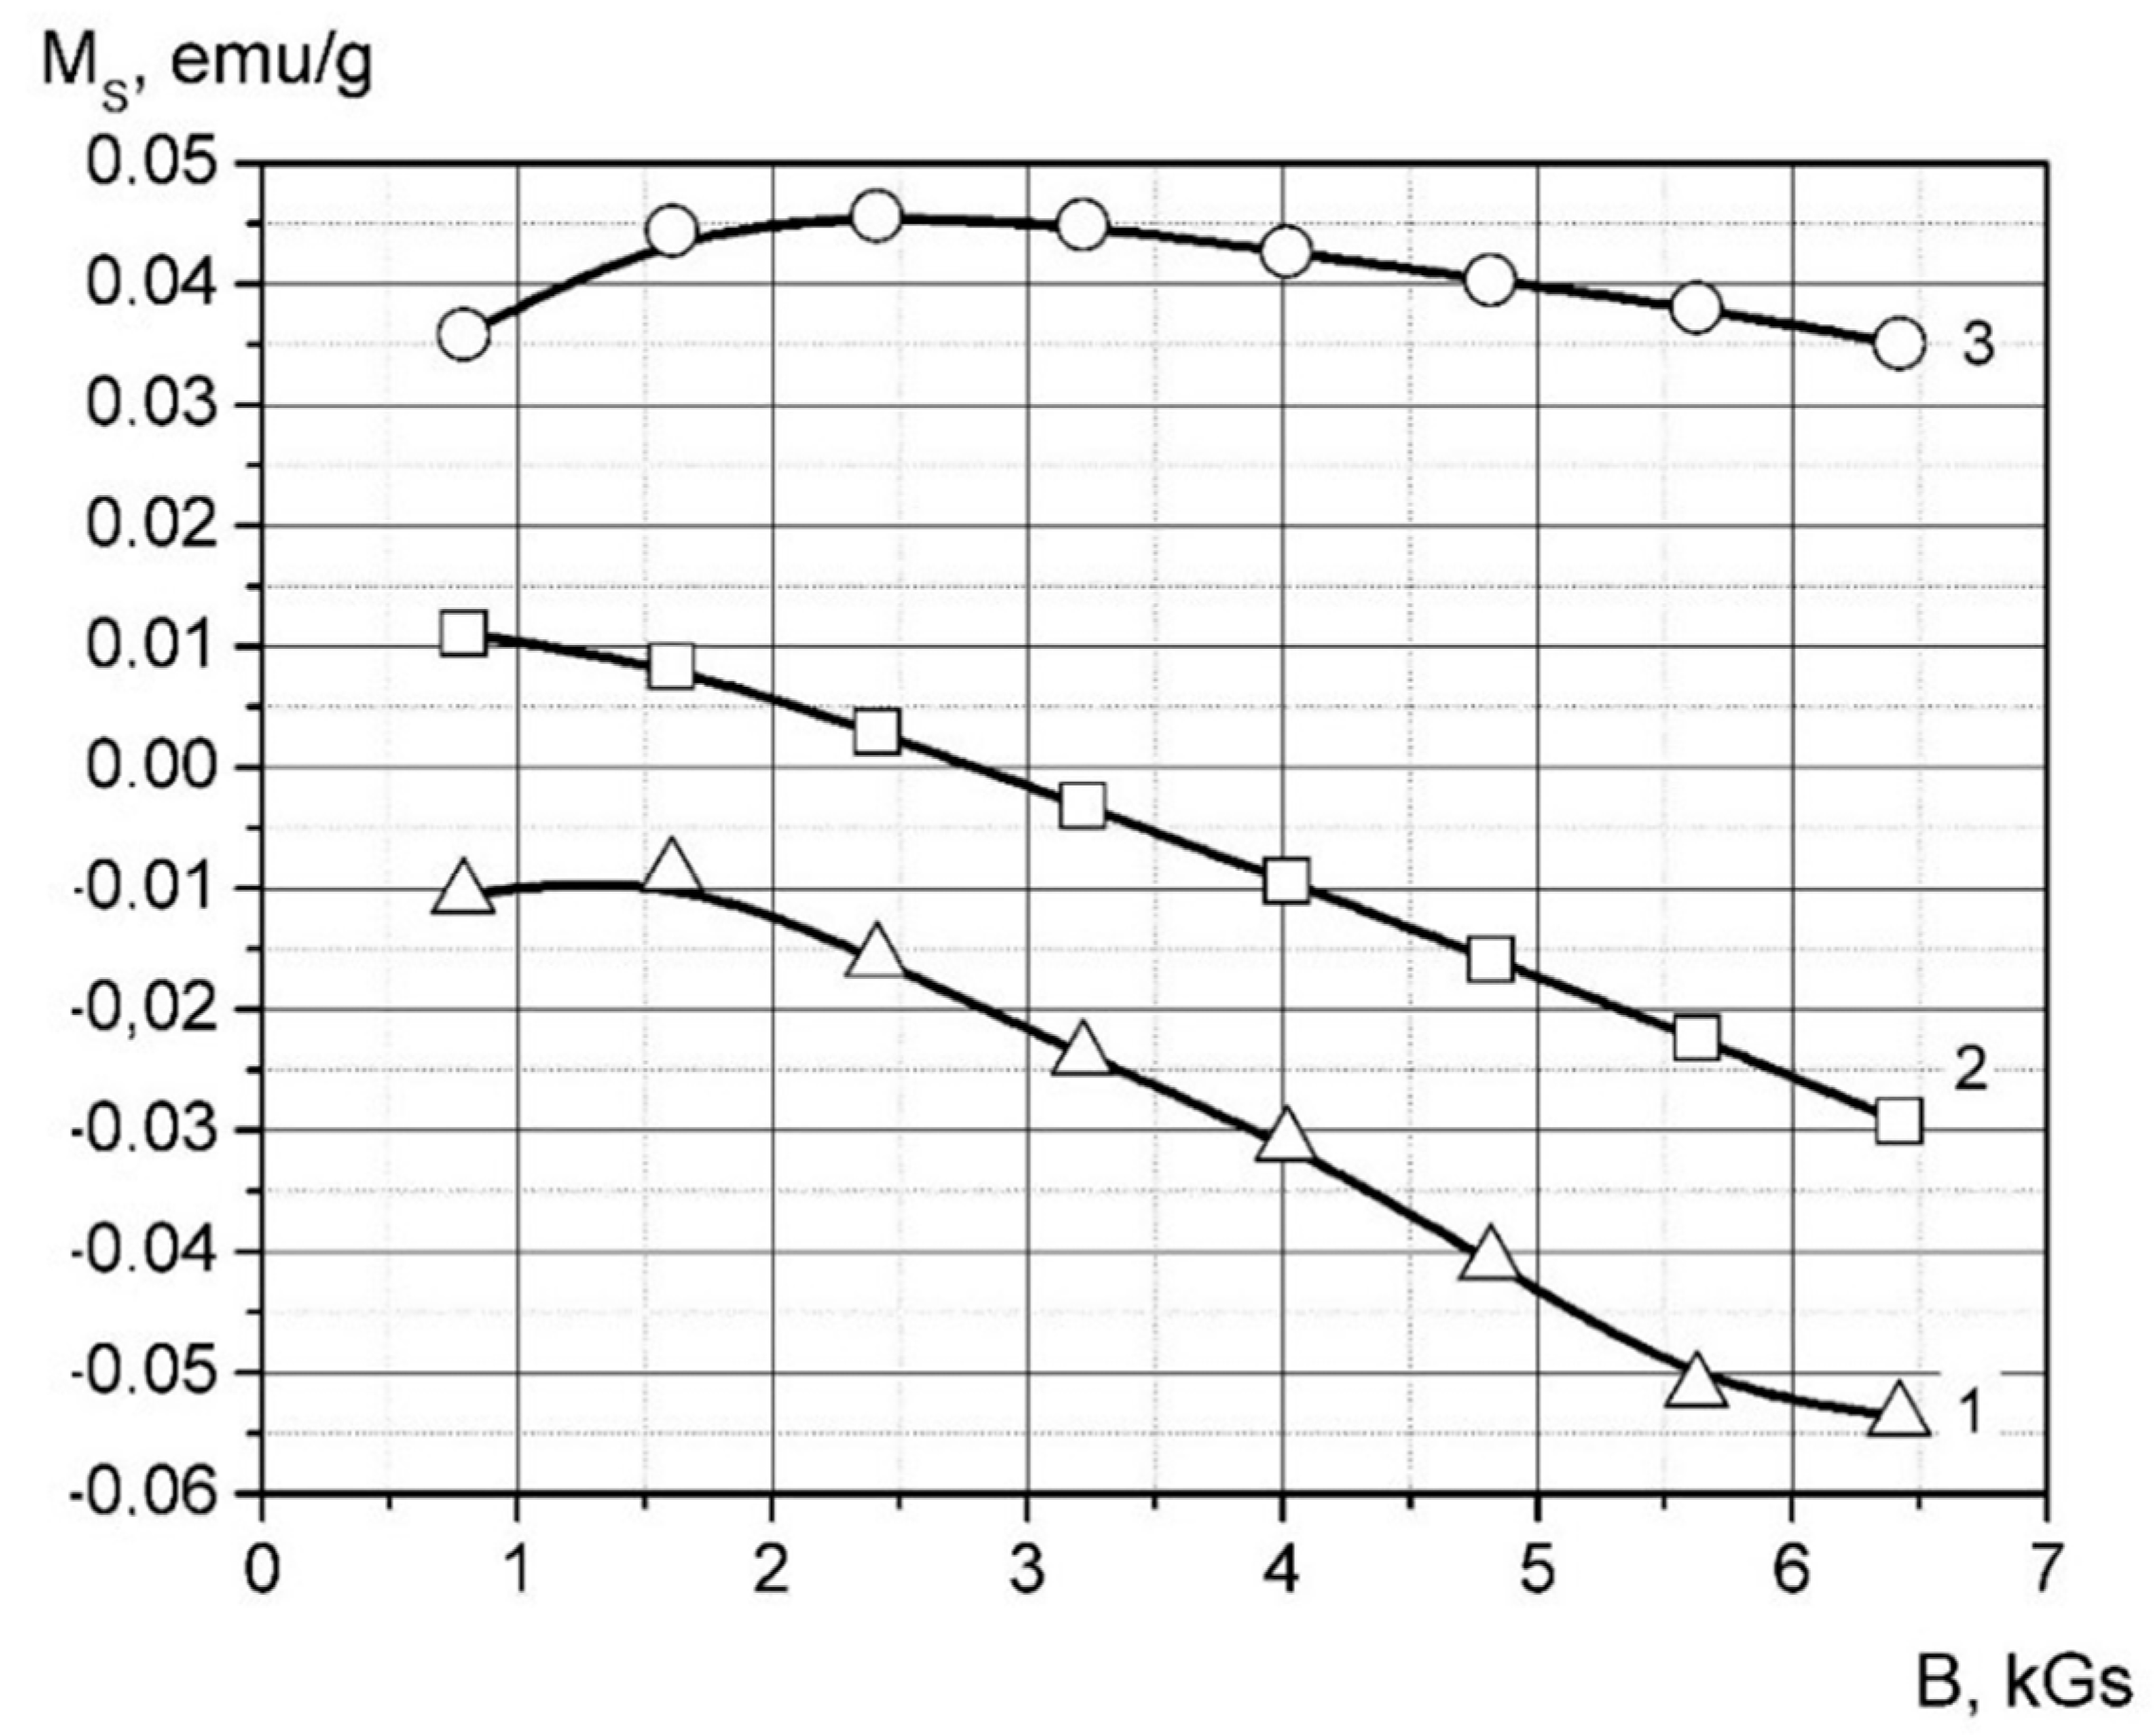
| Sample | C, cm3/g | χrel (Experiment), 10−9 m3/kg |
|---|---|---|
| HDPE | (−9.5 ± 1.1) × 10−3 | −0.75 ± 0.09 |
| HDPE + 10% Pd | (−7.9 ± 0.2) × 10−3 | −0.63 ± 0.02 |
| HDPE + 20% Pd | (−2.8 ± 0.4) × 10−3 | −0.23 ± 0.03 |
Publisher’s Note: MDPI stays neutral with regard to jurisdictional claims in published maps and institutional affiliations. |
© 2022 by the authors. Licensee MDPI, Basel, Switzerland. This article is an open access article distributed under the terms and conditions of the Creative Commons Attribution (CC BY) license (https://creativecommons.org/licenses/by/4.0/).
Share and Cite
Yurkov, G.; Koksharov, Y.; Fionov, A.; Taratanov, N.; Kolesov, V.; Kirillov, V.; Makeev, M.; Mikhalev, P.; Ryzhenko, D.; Solodilov, V. Polymer Nanocomposite Containing Palladium Nanoparticles: Synthesis, Characterization, and Properties. Polymers 2022, 14, 3795. https://doi.org/10.3390/polym14183795
Yurkov G, Koksharov Y, Fionov A, Taratanov N, Kolesov V, Kirillov V, Makeev M, Mikhalev P, Ryzhenko D, Solodilov V. Polymer Nanocomposite Containing Palladium Nanoparticles: Synthesis, Characterization, and Properties. Polymers. 2022; 14(18):3795. https://doi.org/10.3390/polym14183795
Chicago/Turabian StyleYurkov, Gleb, Yury Koksharov, Alexander Fionov, Nikolai Taratanov, Vladimir Kolesov, Vladislav Kirillov, Mstislav Makeev, Pavel Mikhalev, Dmitriy Ryzhenko, and Vitaliy Solodilov. 2022. "Polymer Nanocomposite Containing Palladium Nanoparticles: Synthesis, Characterization, and Properties" Polymers 14, no. 18: 3795. https://doi.org/10.3390/polym14183795
APA StyleYurkov, G., Koksharov, Y., Fionov, A., Taratanov, N., Kolesov, V., Kirillov, V., Makeev, M., Mikhalev, P., Ryzhenko, D., & Solodilov, V. (2022). Polymer Nanocomposite Containing Palladium Nanoparticles: Synthesis, Characterization, and Properties. Polymers, 14(18), 3795. https://doi.org/10.3390/polym14183795