
Evaluation of Natural and Modified Castor Oil Incorporation on the Melt Processing and Physico-Chemical Properties of Polylactic Acid

 ,
, 

 ,
,
Abstract
:1. Introduction
2. Materials and Methods
2.1. Materials
2.2. Sample Preparation
2.3. Investigation Methods
2.3.1. Melt Processability
2.3.2. Attenuated Total Reflection-Fourier Transform Infrared Spectroscopy (ATR-FTIR)
2.3.3. Water Contact Angle Measurements
2.3.4. Stress-Strain Measurements
2.3.5. Dynamic Rheology
2.3.6. Differential Scanning Calorimetry (DSC)
2.3.7. Thermogravimetric Analysis (TG/DTG)
3. Results and Discussions
3.1. Evaluation of the Melt Processing
3.2. ATR-FTIR Results
3.3. Water Contact Angle (WCA)
3.4. Stress-Strain Results
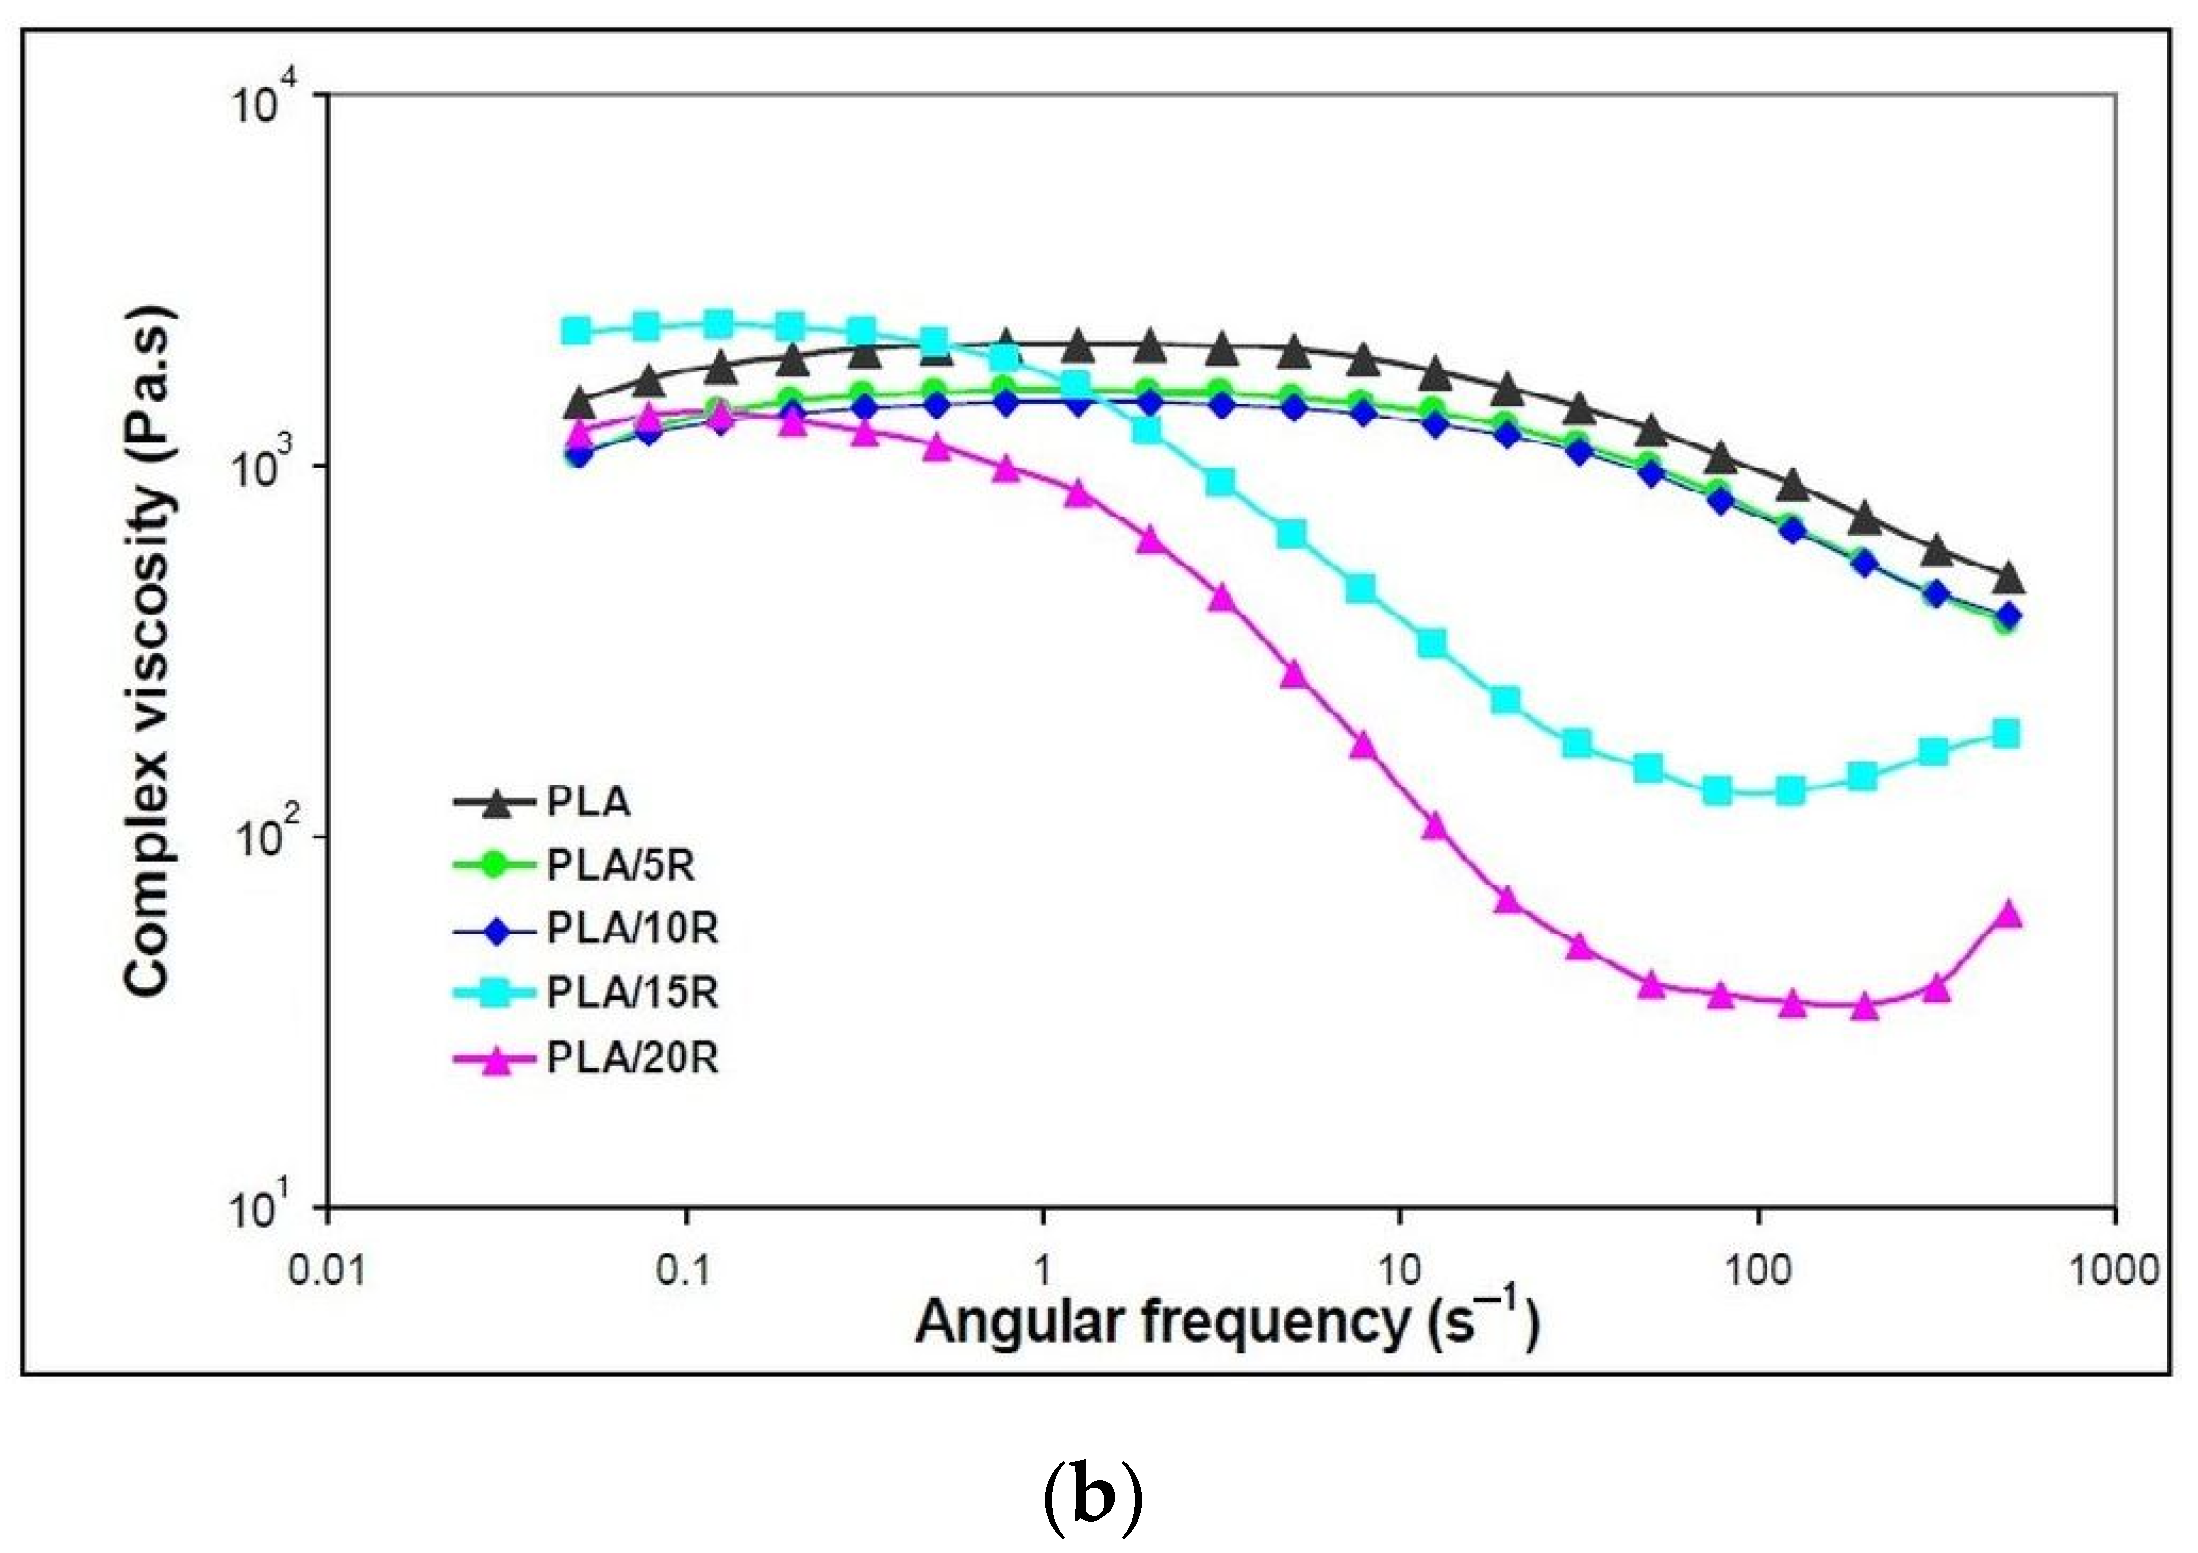
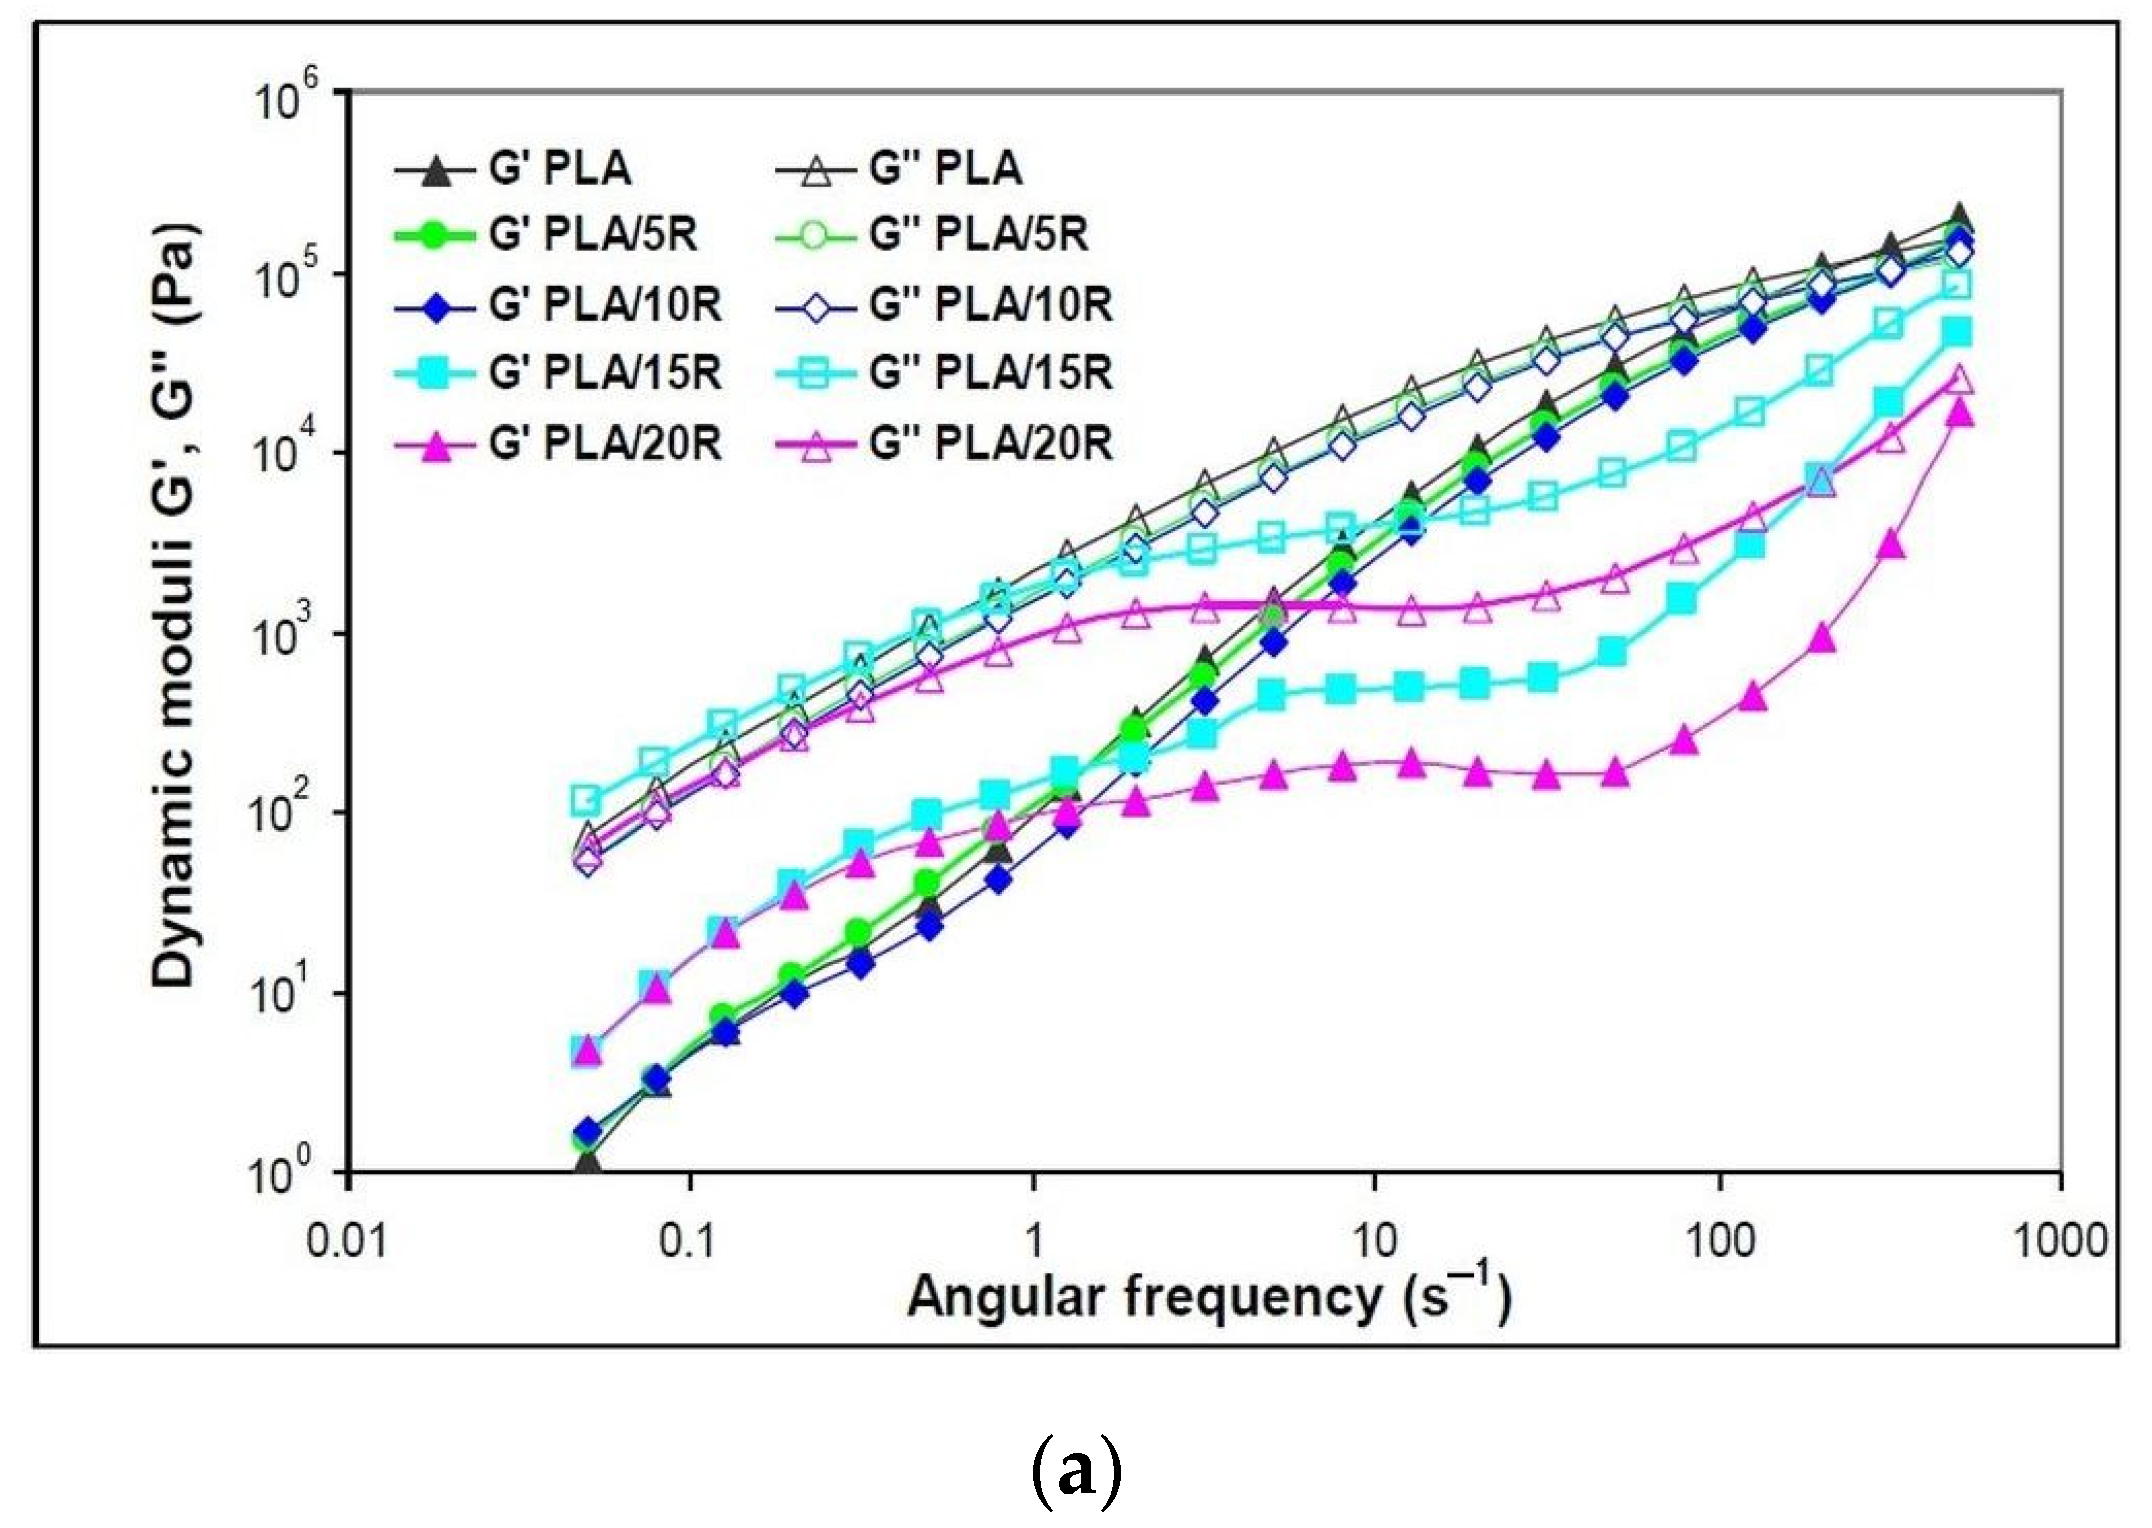
3.5. Dynamic Rheology
3.6. DSC Results
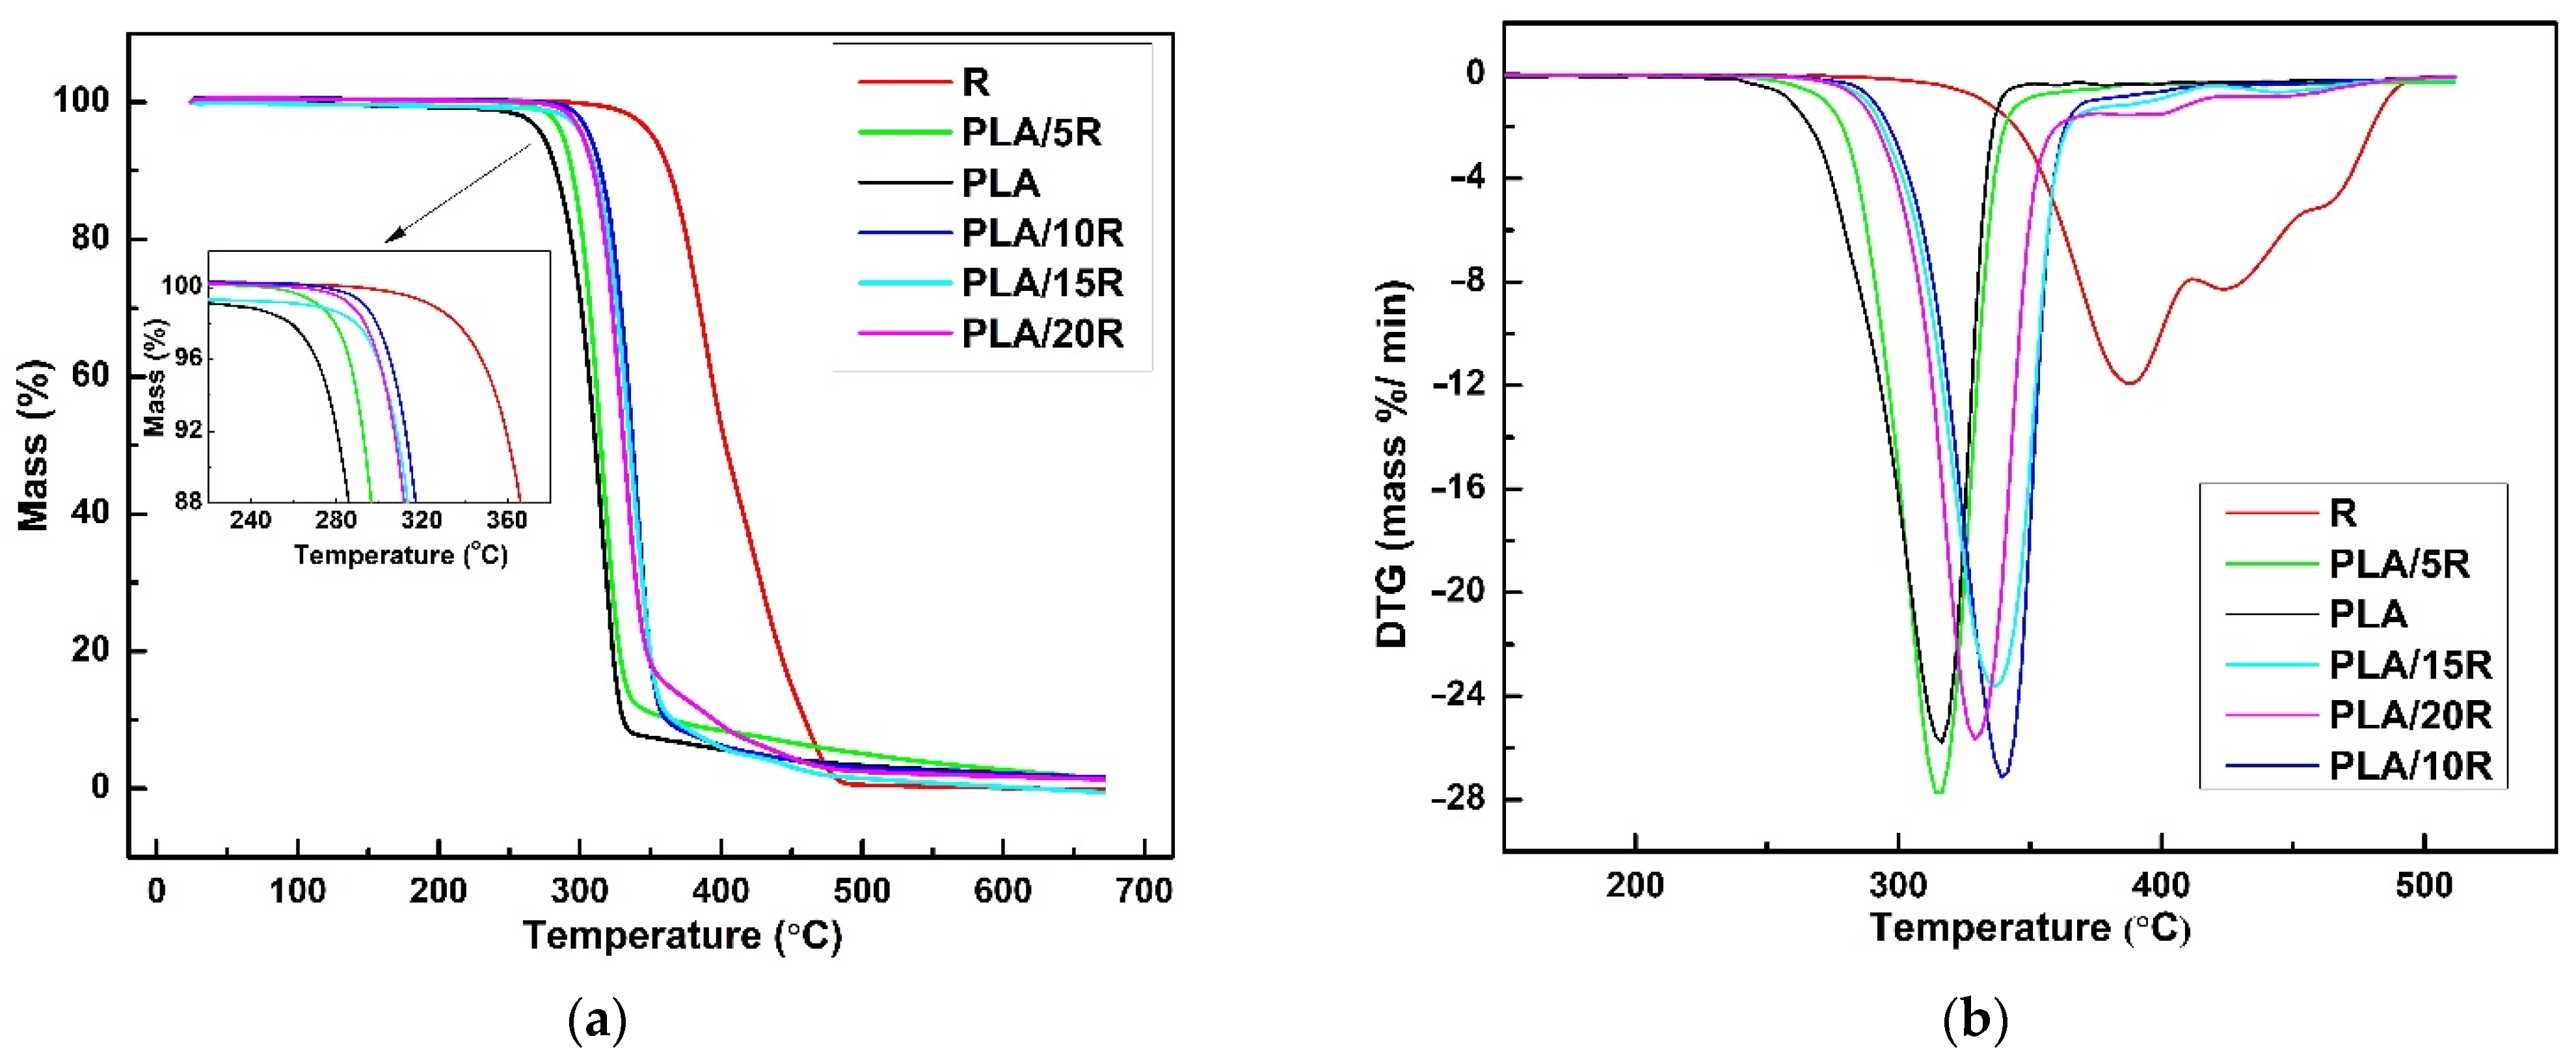
3.7. Thermal Stability and Degradation
4. Conclusions
Supplementary Materials
Author Contributions
Funding
Institutional Review Board Statement
Informed Consent Statement
Data Availability Statement
Acknowledgments
Conflicts of Interest
References
- Boey, J.Y.; Mohamad, L.; Khok, Y.S.; Tay, G.S.; Baidurah, S. A Review of the Applications and Biodegradation of Polyhydroxyalkanoates and Poly(lactic acid) and Its Composites. Polymers 2021, 13, 1544. [Google Scholar] [CrossRef] [PubMed]
- Roy, K.; Poompiew, N.; Pongwisuthiruchte, A.; Potiyaraj, P. Application of Different Vegetable Oils as Processing Aids in Industrial Rubber Composites: A Sustainable Approach. Acs Omega 2021, 6, 31384–31389. [Google Scholar] [CrossRef] [PubMed]
- Yeboah, A.; Ying, S.; Lu, J.N.; Xie, Y.; Amoanimaa-Dede, H.; Boateng, K.G.A.; Chen, M.; Yin, X.G. Castor oil (Ricinus communis): A review on the chemical composition and physicochemical properties. Food Sci. Technol. 2021, 41, 399–413. [Google Scholar] [CrossRef]
- Nitbani, F.O.; Tjitda, P.J.P.; Wogo, H.E.; Detha, A.I.R. Preparation of Ricinoleic Acid from Castor Oil: A Review. J. Oleo Sci. 2022, 71, 781–793. [Google Scholar] [CrossRef]
- Mutlu, H.; Meier, M.A.R. Castor oil as a renewable resource for the chemical industry. Eur. J. Lipid Sci. Technol. 2010, 112, 10–30. [Google Scholar] [CrossRef]
- Karak, N. Vegetable oils and their derivatives. In Vegetable Oil-Based Polymers; Karak, N., Ed.; Woodhead Publishing: Shaston, UK, 2012; pp. 54–95. [Google Scholar]
- Nayak, P.L. Natural oil-based polymers: Opportunities and challenges. J. Macromol. Sci. Rev. Macromol. Chem. Phys. 2000, 40, 1–21. [Google Scholar] [CrossRef]
- Petrovic, Z.S.; Cvetkovic, I.; Hong, D.; Wan, X.; Zhang, W.; Abraham, T.; Malsam, J. Polyester polyols and polyurethanes from ricinoleic acid. J. Appl. Polym. Sci. 2008, 108, 1184–1190. [Google Scholar] [CrossRef]
- Choi, K.K.; Park, S.H.; Oh, K.W.; Kim, S.H. Effect of castor oil/polycaprolactone hybrid polyols on the properties of biopolyurethane. Macromol. Res. 2015, 23, 333–340. [Google Scholar] [CrossRef]
- Ramaiah, K.P.; Mishra, K.; Atkar, A.; Sridhar, S. Pervaporation separation of chlorinated environmental pollutants from aqueous solutions by castor oil based composite interpenetrating network membranes. Chem. Eng. J. 2020, 387, 124050. [Google Scholar] [CrossRef]
- Zhao, X.H.; Qi, X.; Chen, Q.L.; Ao, X.Q.; Guo, Y. Sulfur-Modified Coated Slow-Release Fertilizer Based on Castor Oil: Synthesis and a Controlled-Release Model. Acs Sustain. Chem. Eng. 2020, 8, 18044–18053. [Google Scholar] [CrossRef]
- Brostow, W.; Lu, X.Y.; Osmanson, A.T. Nontoxic bio-plasticizers for PVC as replacements for conventional toxic plasticizers. Polym. Test. 2018, 69, 63–70. [Google Scholar] [CrossRef]
- Jia, P.; Zhang, M.; Hu, L.; Feng, G.; Bo, C.; Zhou, Y. Synthesis and Application of Environmental Castor Oil Based Polyol Ester. Plasticizers for Poly(vinyl chloride). Acs Sustain. Chem. Eng. 2015, 3, 2187–2193. [Google Scholar] [CrossRef]
- Castor oil (Main Component Structural Formulae) V2.svg. (2022, August 11). Wikimedia Commons, the Free Media Repository. Available online: https://commons.wikimedia.org/w/index.php?title=File:Castor_oil_(Main_Component_Structural_Formulae)_V2.svg&oldid=681682598 (accessed on 27 August 2022).
- Fu, Q.; Tan, J.; Wang, F.; Zhu, X. Study on the Synthesis of Castor Oil-Based Plasticizer and the Properties of Plasticized Nitrile Rubber. Polymers 2020, 12, 2584. [Google Scholar] [CrossRef] [PubMed]
- Tavares, L.B.; Boas, C.V.; Schleder, G.R.; Nacas, A.M.; Rosa, D.S.; Santos, D.J. Bio-based polyurethane prepared from Kraft lignin and modified castor oil. Express Polym. Lett. 2016, 10, 927–940. [Google Scholar] [CrossRef]
- Tripathi, K.M.; Sachan, A.; Castro, M.; Choudhary, V.; Sonkar, S.K.; Feller, J.F. Green carbon nanostructured quantum resistive sensors to detect volatile biomarkers. Sustain. Mater. Technol. 2018, 16, 1–11. [Google Scholar] [CrossRef]
- Darie-Nita, R.N.; Rapa, M.; Sivertsvik, M.; Rosnes, J.T.; Popa, E.E.; Dumitriu, R.P.; Marincas, O.; Matei, E.; Predescu, C.; Vasile, C. PLA-Based Materials Containing Bio-Plasticizers and Chitosan Modified with Rosehip Seed Oil for Ecological Packaging. Polymers 2021, 13, 1610. [Google Scholar] [CrossRef]
- Ingrao, C.; Gigli, M.; Siracusa, V. An attributional Life Cycle Assessment application experience to highlight environmental hotspots in the production of foamy polylactic acid trays for fresh-food packaging usage. J. Clean. Prod. 2017, 150, 93–103. [Google Scholar] [CrossRef]
- Luchian-Lupu, A.M.; Zaharescu, T.; Lungulescu, E.M.; Rapa, M.; Iovu, H. Availability of PLA/SIS blends for packaging and medical applications. Radiat. Phys. Chem. 2020, 172, 108696. [Google Scholar] [CrossRef]
- Rapa, M.; Stefan, L.M.; Preda, P.; Darie-Nita, R.N.; Gaspar-Pintiliescu, A.; Seciu, A.M.; Vasile, C.; Matei, E.; Predescu, A.M. Effect of hydrolyzed collagen on thermal, mechanical and biological properties of poly(lactic acid) bionanocomposites. Iran. Polym. J. 2019, 28, 271–282. [Google Scholar] [CrossRef]
- Tyler, B.; Gullotti, D.; Mangraviti, A.; Utsuki, T.; Brem, H. Polylactic acid (PLA) controlled delivery carriers for biomedical applications. Adv. Drug Deliv. Rev. 2016, 107, 163–175. [Google Scholar] [CrossRef]
- Bobirica, C.; Bobirica, L.; Rapa, M.; Matei, E.; Predescu, A.M.; Orbeci, C. Photocatalytic Degradation of Ampicillin Using PLA/TiO2 Hybrid Nanofibers Coated on Different Types of Fiberglass. Water 2020, 12, 176. [Google Scholar] [CrossRef]
- Vatanpour, V.; Dehqan, A.; Paziresh, S.; Zinadini, S.; Zinatizadeh, A.A.; Koyuncu, I. Polylactic acid in the fabrication of separation membranes: A review. Sep. Purif. Technol. 2022, 296, 121433. [Google Scholar] [CrossRef]
- Notta-Cuvier, D.; Odent, J.; Delille, R.; Murariu, M.; Lauro, F.; Raquez, J.M.; Bennani, B.; Dubois, P. Tailoring polylactide (PLA) properties for automotive applications: Effect of addition of designed additives on main mechanical properties. Polym. Test. 2014, 36, 1–9. [Google Scholar] [CrossRef]
- Baiardo, M.; Frisoni, G.; Scandola, M.; Rimelen, M.; Lips, D.; Ruffieux, K.; Wintermantel, E. Thermal and mechanical properties of plasticized poly(L-lactic acid). J. Appl. Polym. Sci. 2003, 90, 1731–1738. [Google Scholar] [CrossRef]
- Guo, Y.J.; Ma, J.; Lv, Z.R.; Zhao, N.; Wang, L.X.; Li, Q. The effect of plasticizer on the shape memory properties of poly(lactide acid)/poly(ethylene glycol) blends. J. Mater. Res. 2018, 33, 4101–4112. [Google Scholar] [CrossRef]
- Kontarova, S.; Prikryl, R.; Melcova, V.; Mencik, P.; Horalek, M.; Figalla, S.; Plavec, R.; Feranc, J.; Sadilek, J.; Pospisilova, A. Printability, Mechanical and Thermal Properties of Poly(3-Hydroxybutyrate)-Poly(Lactic Acid)-Plasticizer Blends for Three-Dimensional (3D) Printing. Materials 2020, 13, 4736. [Google Scholar] [CrossRef] [PubMed]
- Chaikeaw, C.; Srikulkit, K. Preparation and Properties of Poly(lactic Acid)/PLA-g-ABS Blends. Fibers Polym. 2018, 19, 2016–2022. [Google Scholar] [CrossRef]
- Mencik, P.; Prikryl, R.; Stehnova, I.; Melcova, V.; Kontarova, S.; Figalla, S.; Alexy, P.; Bockaj, J. Effect of Selected Commercial Plasticizers on Mechanical, Thermal, and Morphological Properties of Poly(3-hydroxybutyrate)/Poly(lactic acid)/Plasticizer Biodegradable Blends for Three-Dimensional (3D) Print. Materials 2018, 11, 1893. [Google Scholar] [CrossRef]
- Ortega-Toro, R.; Lopez-Cordoba, A.; Avalos-Belmontes, F. Epoxidised sesame oil as a biobased coupling agent and plasticiser in polylactic acid/thermoplastic yam starch blends. Heliyon 2021, 7, e06176. [Google Scholar] [CrossRef]
- Wang, S.S.; Daelemans, L.; Fiorio, R.; Gou, M.L.; D’Hooge, D.R.; De Clerck, K.; Cardon, L. Improving Mechanical Properties for Extrusion-Based Additive Manufacturing of Poly(Lactic Acid) by Annealing and Blending with Poly(3-Hydroxybutyrate). Polymers 2019, 11, 1529. [Google Scholar] [CrossRef] [Green Version]
- Roy, S.; Rhim, J.W. Preparation of bioactive functional poly(lactic acid)/curcumin composite film for food packaging application. Int. J. Biol. Macromol. 2020, 162, 1780–1789. [Google Scholar] [CrossRef] [PubMed]
- Saravana, S.; Girija, B.; Kandaswamy, R. Fabrication and characterization of dental mirror product using polylactic acid biocomposites. Int. J. Polym. Mater. Polym. Biomater. 2017, 66, 679–685. [Google Scholar] [CrossRef]
- Dominguez-Robles, J.; Martin, N.K.; Fong, M.L.; Stewart, S.A.; Irwin, N.J.; Rial-Hermida, M.I.; Donnelly, R.F.; Larraneta, E. Antioxidant PLA Composites Containing Lignin for 3D Printing Applications: A Potential Material for Healthcare Applications. Pharmaceutics 2019, 11, 165. [Google Scholar] [CrossRef] [PubMed]
- Robertson, M.L.; Paxton, J.M.; Hillmyer, M.A. Tough Blends of Polylactide and Castor Oil. Acs Appl. Mater. Interfaces 2011, 3, 3402–3410. [Google Scholar] [CrossRef]
- Mustata, F.; Tudorachi, N. Synthesis and thermal characterization of some hardeners for epoxy resins based on castor oil and cyclic anhydrides. Ind. Crops Prod. 2021, 159, 113087. [Google Scholar] [CrossRef]
- Menon, A.R.R. Melt-rheology of natural rubber modified with phosphorylated cashew nut shell liquid prepolymer—A comparative study with spindle oil. Iran. Polym. J. 1999, 8, 167–173. [Google Scholar]
- Xuan, W.; Odelius, K.; Hakkarainen, M. Tailoring Oligomeric Plasticizers for Polylactide through Structural Control. Acs Omega 2022, 7, 14305–14316. [Google Scholar] [CrossRef]
- Liu, H.J.; Hsieh, C.T.; Hu, D.S.G. Solute diffusion through degradable semicrystalline polyethylene-glycol poly(l-lactide) copolymers. Polym. Bull. 1994, 32, 463–470. [Google Scholar] [CrossRef]
- Zeng, Q. The lubrication performance and viscosity behavior of castor oil under high temperature. Green Mater. 2021, 10, 51–58. [Google Scholar] [CrossRef]
- Bouti, M.; Irinislimane, R.; Belhaneche-Bensemra, N. Properties Investigation of Epoxidized Sunflower Oil as Bioplasticizer for Poly(Lactic Acid). J. Polym. Environ. 2022, 30, 232–245. [Google Scholar] [CrossRef]
- Darie-Nita, R.N.; Vasile, C.; Irimia, A.; Lipsa, R.; Rapa, M. Evaluation of some eco-friendly plasticizers for PLA films processing. J. Appl. Polym. Sci. 2016, 133. [Google Scholar] [CrossRef]
- Masturi; Sunarno. Estimation of Van Der Waals Interaction Using FTIR Spectroscopy. Adv. Mater. Res. 2015, 1123, 61–64. [Google Scholar] [CrossRef]
- Auras, R.; Harte, B.; Selke, S. An overview of polylactides as packaging materials. Macromol. Biosci. 2004, 4, 835–864. [Google Scholar] [CrossRef] [PubMed]
- Ristic, I.S.; Tanasic, L.; Nikolic, L.B.; Cakic, S.M.; Ilic, O.Z.; Radicevic, R.Z.; Budinski-Simendic, J.K. The Properties of Poly(l-Lactide) Prepared by Different Synthesis Procedure. J. Polym. Environ. 2011, 19, 419–430. [Google Scholar] [CrossRef]
- Stoleru, E.; Munteanu, B.S.; Darie-Nita, R.N.; Pricope, G.M.; Lungu, M.; Irimia, A.; Rapa, M.; Lipsa, R.D.; Vasile, C. Complex poly(lactic acid)-based biomaterial for urinary catheters: II. Biocompatibility. Bioinspired Biomim. Nanobiomater. 2016, 5, 152–166. [Google Scholar] [CrossRef]
- Hendrick, E.; Frey, M. Increasing Surface Hydrophilicity in Poly(Lactic Acid) Electrospun Fibers by Addition of Pla-b-Peg Co-Polymers. J. Eng. Fibers Fabr. 2014, 9, 153–164. [Google Scholar] [CrossRef]
- Amorim, F.V.; Padilha, R.J.R.; Vinhas, G.M.; Luiz, M.R.; de Souza, N.C.; de Almeida, Y.M.B. Development of hydrophobic polyurethane/castor oil biocomposites with agroindustrial residues for sorption of oils and organic solvents. J. Colloid Interface Sci. 2021, 581, 442–454. [Google Scholar] [CrossRef]
- Bhasney, S.M.; Patwa, R.; Kumar, A.; Katiyar, V. Plasticizing effect of coconut oil on morphological, mechanical, thermal, rheological, barrier, and optical properties of poly(lactic acid): A promising candidate for food packaging. J. Appl. Polym. Sci. 2017, 134, 45390. [Google Scholar] [CrossRef]
- Asim, N.; Badiei, M.; Mohammad, M. Recent advances in cellulose-based hydrophobic food packaging. Emergent Mater. 2022, 5, 703–718. [Google Scholar] [CrossRef]
- Ansari, I.A.; Gupta, G.A.; Ramkumar, J.; Kar, K.K. Fly ash-mixed polymeric media for abrasive flow machining process. In Handbook of Fly Ash; Kar, K.K., Ed.; Butterworth-Heinemann: Oxford, UK, 2021; pp. 681–713. [Google Scholar]
- Xu, Y.; You, M.; Qu, J. Melt rheology of poly (lactic acid) plasticized by epoxidized soybean oil. Wuhan Univ. J. Nat. Sci. 2009, 14, 349–354. [Google Scholar] [CrossRef]
- Dominguez-Candela, I.; Ferri, J.M.; Cardona, S.C.; Lora, J.; Fombuena, V. Dual Plasticizer/Thermal Stabilizer Effect of Epoxidized Chia Seed Oil (Salvia hispanica L.) to Improve Ductility and Thermal Properties of Poly(Lactic Acid). Polymers 2021, 13, 1283. [Google Scholar] [CrossRef]
- He, W.D.; Huang, H.W.; Xie, L.J.; Wang, C.H.; Yu, J.; Lu, S.J.; Fan, H.S. The influence of self-crosslinked epoxidized castor oil on the properties of Poly(lactic acid) via dynamic vulcanization: Toughening effect, thermal properties and structures. Colloids Surf. A Physicochem. Eng. Asp. 2021, 630, 127517. [Google Scholar] [CrossRef]
- Carbonell-Verdu, A.; Samper, M.D.; Garcia-Garcia, D.; Sanchez-Nacher, L.; Balart, R. Plasticization effect of epoxidized cottonseed oil (ECSO) on poly(lactic acid). Ind. Crops Prod. 2017, 104, 278–286. [Google Scholar] [CrossRef]
- Kang, H.L.; Li, Y.S.; Gong, M.; Guo, Y.L.; Guo, Z.; Fang, Q.H.; Li, X. An environmentally sustainable plasticizer toughened polylactide. RSC Adv. 2018, 8, 11643–11651. [Google Scholar] [CrossRef] [PubMed]
- Rapa, M.; Nita, R.N.D.; Vasile, C. Influence of Plasticizers Over Some Physico-chemical Properties of PLA. Mater. Plast. 2017, 54, 73–78. [Google Scholar] [CrossRef]
- Orue, A.; Eceiza, A.; Arbelaiz, A. Preparation and characterization of poly(lactic acid) plasticized with vegetable oils and reinforced with sisal fibers. Ind. Crops Prod. 2018, 112, 170–180. [Google Scholar] [CrossRef]
- Ali, F.; Chang, Y.W.; Kang, S.C.; Yoon, J.Y. Thermal, mechanical and rheological properties of poly(lactic acid)/epoxidized soybean oil blends. Polym. Bull. 2009, 62, 91–98. [Google Scholar] [CrossRef]
- Xing, C.; Matuana, L.M. Epoxidized soybean oil-plasticized poly(lactic acid) films performance as impacted by storage. J. Appl. Polym. Sci. 2016, 133, 43201. [Google Scholar] [CrossRef]
- Piorkowska, E.; Kulinski, Z.; Galeski, A.; Masirek, R. Plasticization of semicrystalline poly(L-lactide) with poly(propylene glycol). Polymer 2006, 47, 7178–7188. [Google Scholar] [CrossRef]
- Lehrle, R.S.; Williams, R.J. Thermal-degradation of bacterial poly(hydroxybutyric acid): Mechanisms from the dependence of pyrolysis yields on sample thickness. Macromolecules 1994, 27, 3782–3789. [Google Scholar] [CrossRef]
- Hafiezal, M.R.M.; Khalina, A.; Zurina, Z.A.; Azaman, M.D.M.; Hanafee, Z.M. Thermal and Flammability Characteristics of Blended Jatropha Bio-Epoxy as Matrix in Carbon Fiber-Reinforced Polymer. J. Compos. Sci. 2019, 3, 6. [Google Scholar] [CrossRef] [Green Version]
- Borugadda, V.B.; Goud, V.V. Comparative studies of thermal, oxidative and low temperature properties of waste cooking oil and castor oil. J. Renew. Sustain. Energy 2013, 5, 063104. [Google Scholar] [CrossRef]
- Kopinke, F.D.; Remmler, M.; Mackenzie, K.; Moder, M.; Wachsen, O. Thermal decomposition of biodegradable polyesters—II. Poly(lactic acid). Polym. Degrad. Stab. 1996, 53, 329–342. [Google Scholar] [CrossRef]


| Sample | PLA (wt%) | Natural Castor Oil (wt%) | Modified Castor Oil (wt%) | Visual Aspect |
|---|---|---|---|---|
| PLA | 100 | 0 | 0 |  |
| PLA/5R | 95 | 5 | 0 |  |
| PLA/10R | 90 | 10 | 0 |  |
| PLA/15R | 85 | 15 | 0 |  |
| PLA/20R | 80 | 20 | 0 |  |
| PLA/15R-MA | 85 | 0 | 15 |  |
| PLA/15R-NA | 85 | 0 | 15 |  |
| PLA/15R-HA | 85 | 0 | 15 |  |
| Sample | TQmax (Nm) | TQ1min (Nm) | TQ5min (Nm) | TQfin (Nm) | Melt Viscosity (Pa·s) | Power (kW) |
|---|---|---|---|---|---|---|
| PLA | 70 | 65 | 37 | 28 | 0.467 | 0.176 |
| PLA/5R | 28.9 | 7.1 | 6.9 | 5.8 | 0.097 | 0.036 |
| PLA/10R | 18.7 | 6.2 | 5.3 | 4.8 | 0.080 | 0.030 |
| PLA/15R | 13.9 | 4.1 | 2.2 | 2.1 | 0.035 | 0.013 |
| PLA/20R | 12.7 | 2.8 | 1.4 | 1.4 | 0.023 | 0.009 |
| PLA/15R-MA | 10.7 | 3.7 | 3.1 | 2.5 | 0.042 | 0.016 |
| PLA/15R-NA | 12.1 | 3.4 | 2.3 | 1.1 | 0.018 | 0.007 |
| PLA/15R-HA | 10.3 | 2.6 | 2.4 | 2.3 | 0.038 | 0.014 |
| Sample | Tg (°C) | Tcc (°C) | ∆Hcc (J/g) | Tm (°C) | ∆Hm (J/g) | Xc (%) |
|---|---|---|---|---|---|---|
| PLA | 59.82 | 118.48 | 17.66 | 147.43 | 19.65 | 2.12 |
| PLA/5R | 57.60 | - | - | 150.42 | 2.101 | 2.37 |
| PLA/10R | 56.93 | - | - | 150.08 | 3.376 | 4.00 |
| PLA/15R | 56.71 | - | - | 149.84 | 3.274 | 4.11 |
| PLA/20R | 56.26 | - | - | 149.91 | 5.161 | 6.88 |
| PLA/15R-MA | 48.94 | 108.42 | 25.21 | 141.96; 151.48 | 27.98 | 3.48 |
| Sample | Tonset (°C) | Tmax (°C) | ∆Wstep (%) | Residue (%) | T5% (°C) | T30% (°C) | Ts (°C) | ||
|---|---|---|---|---|---|---|---|---|---|
| I | II | III | |||||||
| PLA | 264.56 | 316.15 | 98.46 | - | - | 1.54 | 273.50 | 301.00 | 142.10 |
| PLA/5R | 281.41 | 324.00 | 98.53 | - | - | 1.47 | 286.40 | 305.80 | 146.04 |
| PLA/10R | 303.56 | 338.80 | 98.41 | - | - | 1.60 | 305.12 | 327.20 | 156.00 |
| PLA/15R | 285.86 | 335.20 | 91.15 | 3.93 | 5.53 | 0.62 | 299.80 | 324.60 | 154.19 |
| PLA/20R | 298.11 | 328.90 | 85.91 | 7.29 | 5.74 | 1.12 | 302.70 | 322.50 | 154.14 |
| R | 344.33 | 388.00 | 57.09 | 31.17 | 11.97 | 0.23 | 351.60 | 385.70 | 182.30 |
| MA * | 426(III) | 14.61 | 21.15 | 61.51 | 3.15 | 166.00 | 438.00 | 161.00 | |
| NA * | 434(III) | 14.79 | 28.84 | 54.8 | 0.62 | 184.00 | 425.00 | 161.00 | |
| HA * | 423(III) | 5.73 | 35.83 | 57.15 | 1.29 | 213.00 | 425.00 | 167.00 | |
| PLA/15R-MA | 271.40 | 327.00 | 91.74 | 3.50 | 3.79 | 0.97 | 256.70 | 286.70 | 134.60 |
| PLA/15R-NA | 250.68 | 300.30 | 88.76 | 5.03 | 5.54 | 0.68 | 283.20 | 306.20 | 145.53 |
| PLA/15R-HA | 260.93 | 294.20 | 94.55 | 6.13 | - | 0.75 | 270.50 | 290.30 | 138.37 |
Publisher’s Note: MDPI stays neutral with regard to jurisdictional claims in published maps and institutional affiliations. |
© 2022 by the authors. Licensee MDPI, Basel, Switzerland. This article is an open access article distributed under the terms and conditions of the Creative Commons Attribution (CC BY) license (https://creativecommons.org/licenses/by/4.0/).
Share and Cite
Darie-Niță, R.N.; Irimia, A.; Grigoraș, V.C.; Mustață, F.; Tudorachi, N.; Râpă, M.; Ludwiczak, J.; Iwanczuk, A. Evaluation of Natural and Modified Castor Oil Incorporation on the Melt Processing and Physico-Chemical Properties of Polylactic Acid. Polymers 2022, 14, 3608. https://doi.org/10.3390/polym14173608
Darie-Niță RN, Irimia A, Grigoraș VC, Mustață F, Tudorachi N, Râpă M, Ludwiczak J, Iwanczuk A. Evaluation of Natural and Modified Castor Oil Incorporation on the Melt Processing and Physico-Chemical Properties of Polylactic Acid. Polymers. 2022; 14(17):3608. https://doi.org/10.3390/polym14173608
Chicago/Turabian StyleDarie-Niță, Raluca Nicoleta, Anamaria Irimia, Vasile Cristian Grigoraș, Fănică Mustață, Niță Tudorachi, Maria Râpă, Joanna Ludwiczak, and Andrzej Iwanczuk. 2022. "Evaluation of Natural and Modified Castor Oil Incorporation on the Melt Processing and Physico-Chemical Properties of Polylactic Acid" Polymers 14, no. 17: 3608. https://doi.org/10.3390/polym14173608
APA StyleDarie-Niță, R. N., Irimia, A., Grigoraș, V. C., Mustață, F., Tudorachi, N., Râpă, M., Ludwiczak, J., & Iwanczuk, A. (2022). Evaluation of Natural and Modified Castor Oil Incorporation on the Melt Processing and Physico-Chemical Properties of Polylactic Acid. Polymers, 14(17), 3608. https://doi.org/10.3390/polym14173608