
An Optical Algorithm for Relative Thickness of Each Monochrome Component in Multilayer Transparent Mixed Films

 ,
, 
Abstract
:1. Introduction
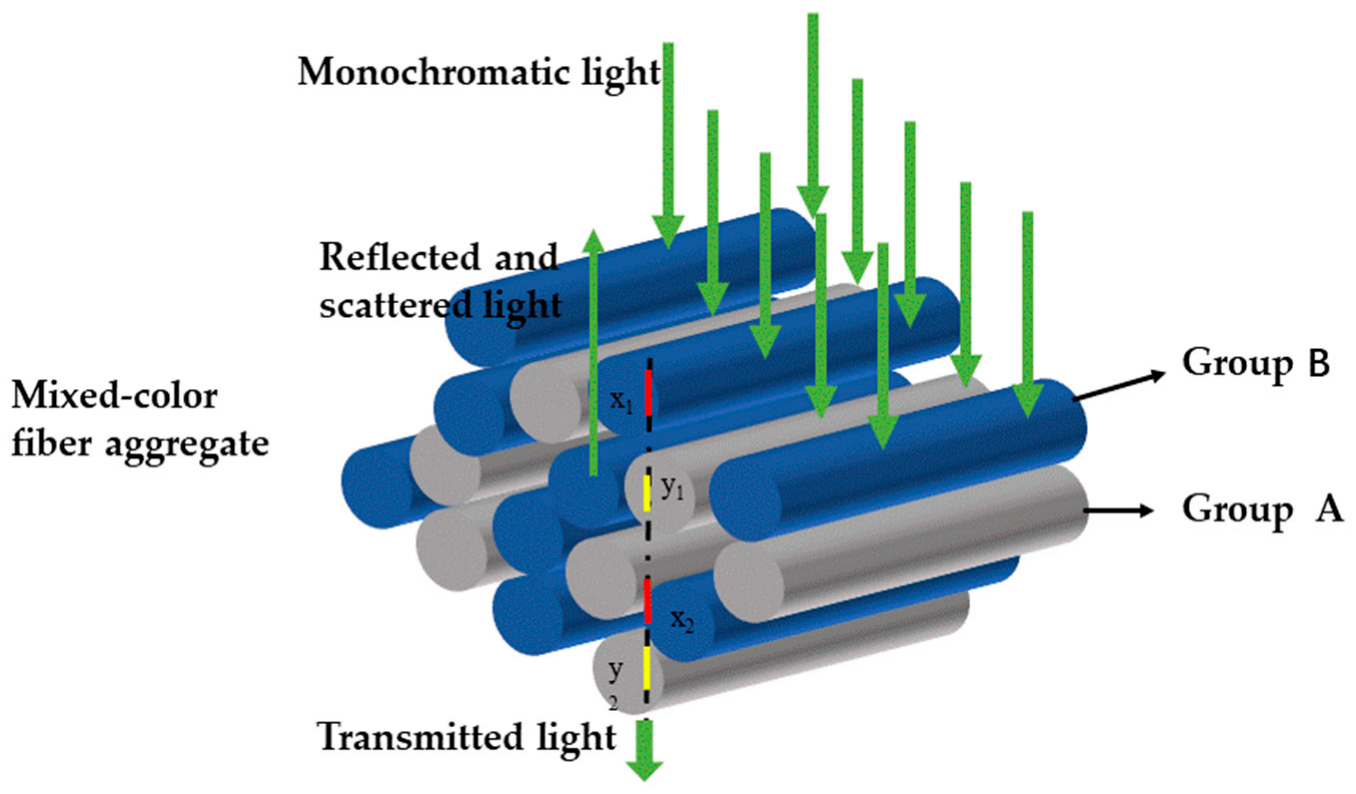
2. Theory
2.1. Lambert-Beer Law
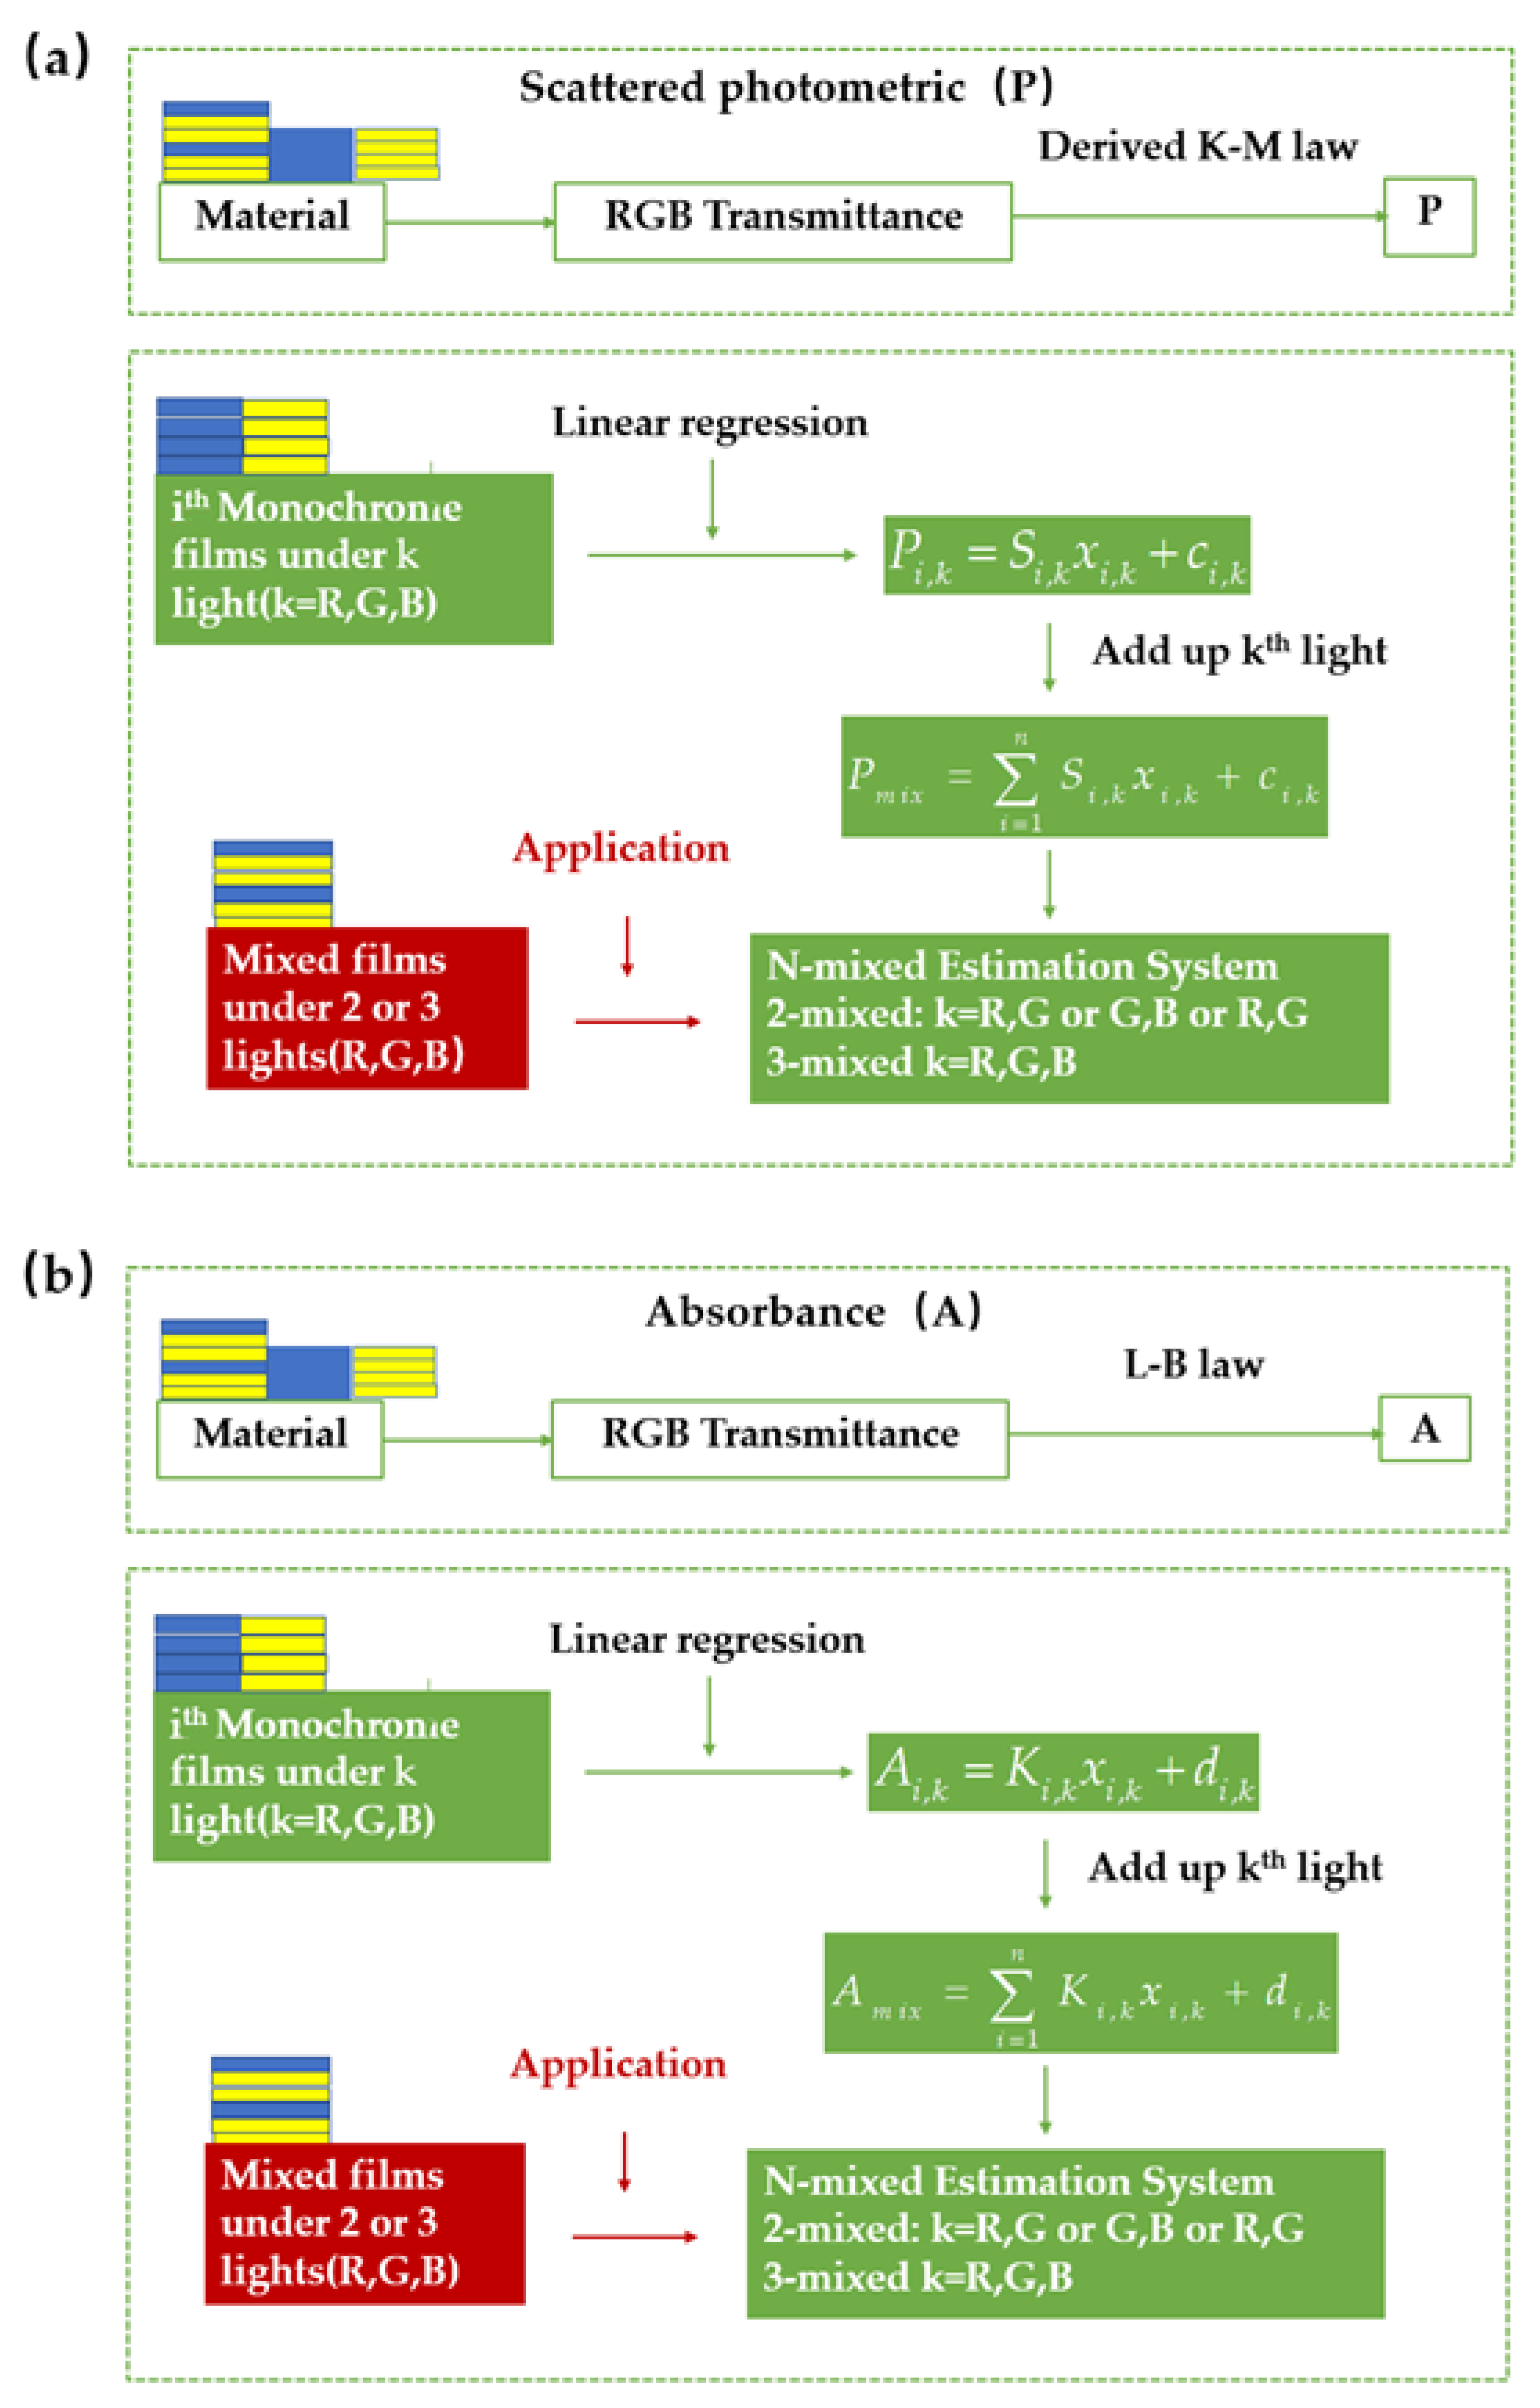
2.2. Derived Kubelka-Munk Theory
2.3. Proposed Estimation Procedure
3. Experiment
3.1. Material
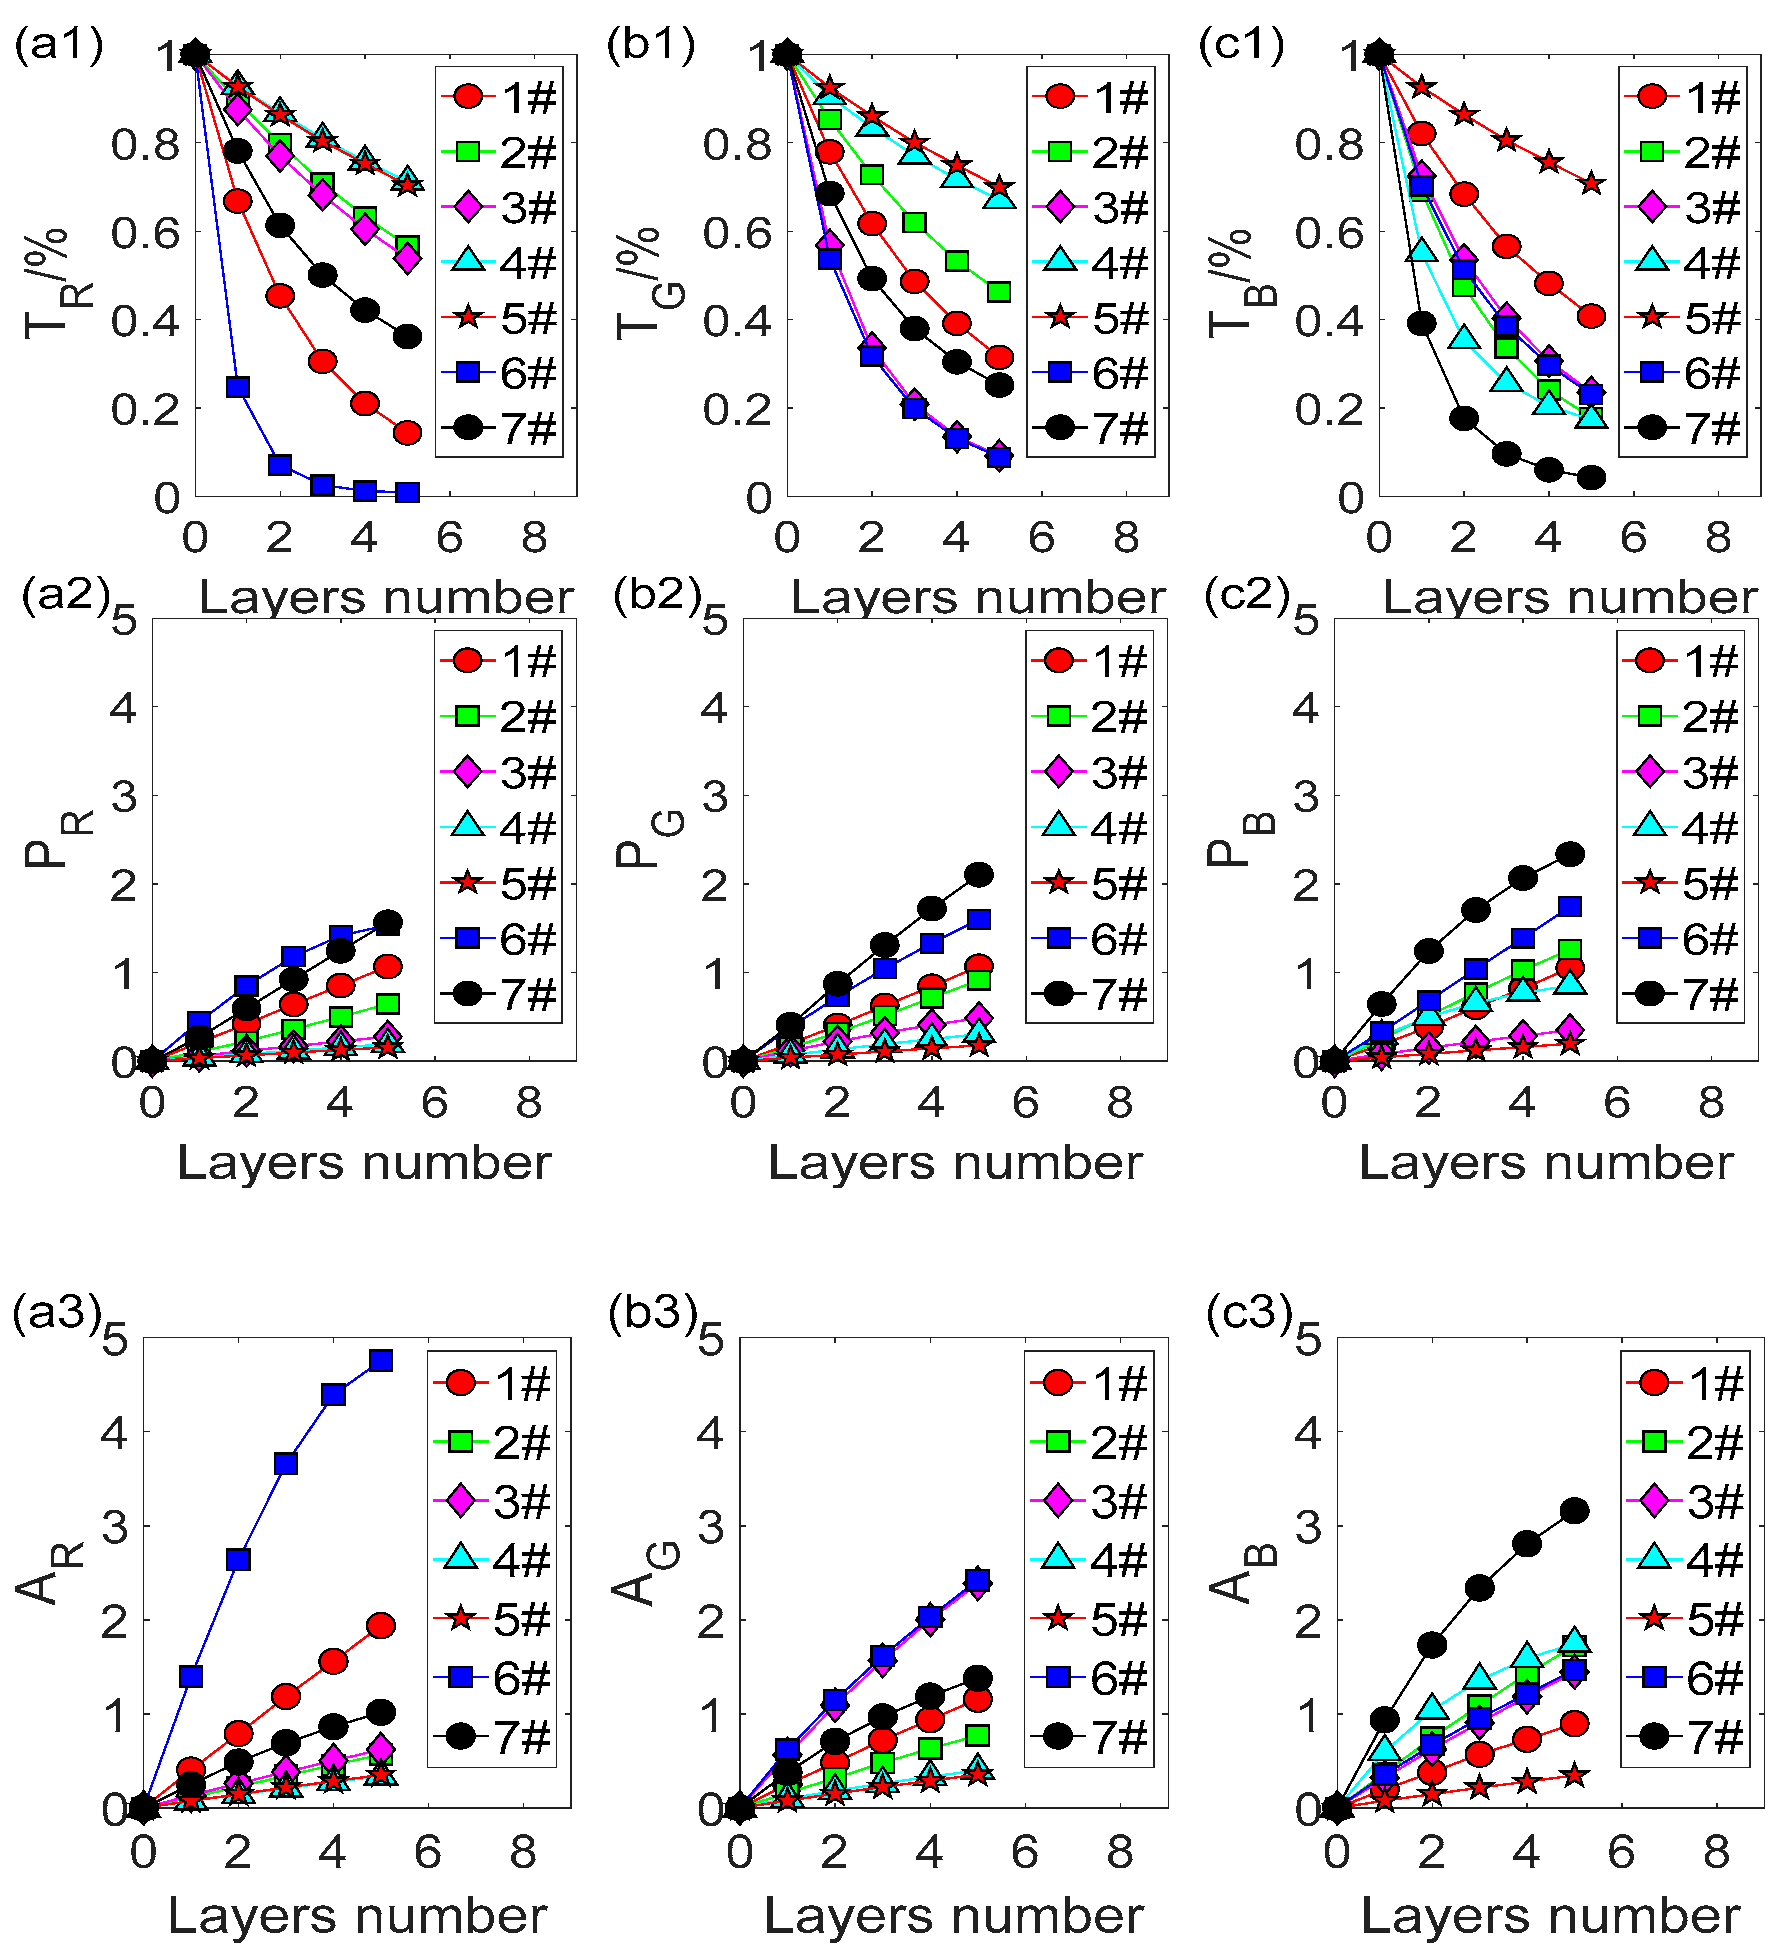
3.2. Optical Parameter
3.3. Monochrome Estimation Equation
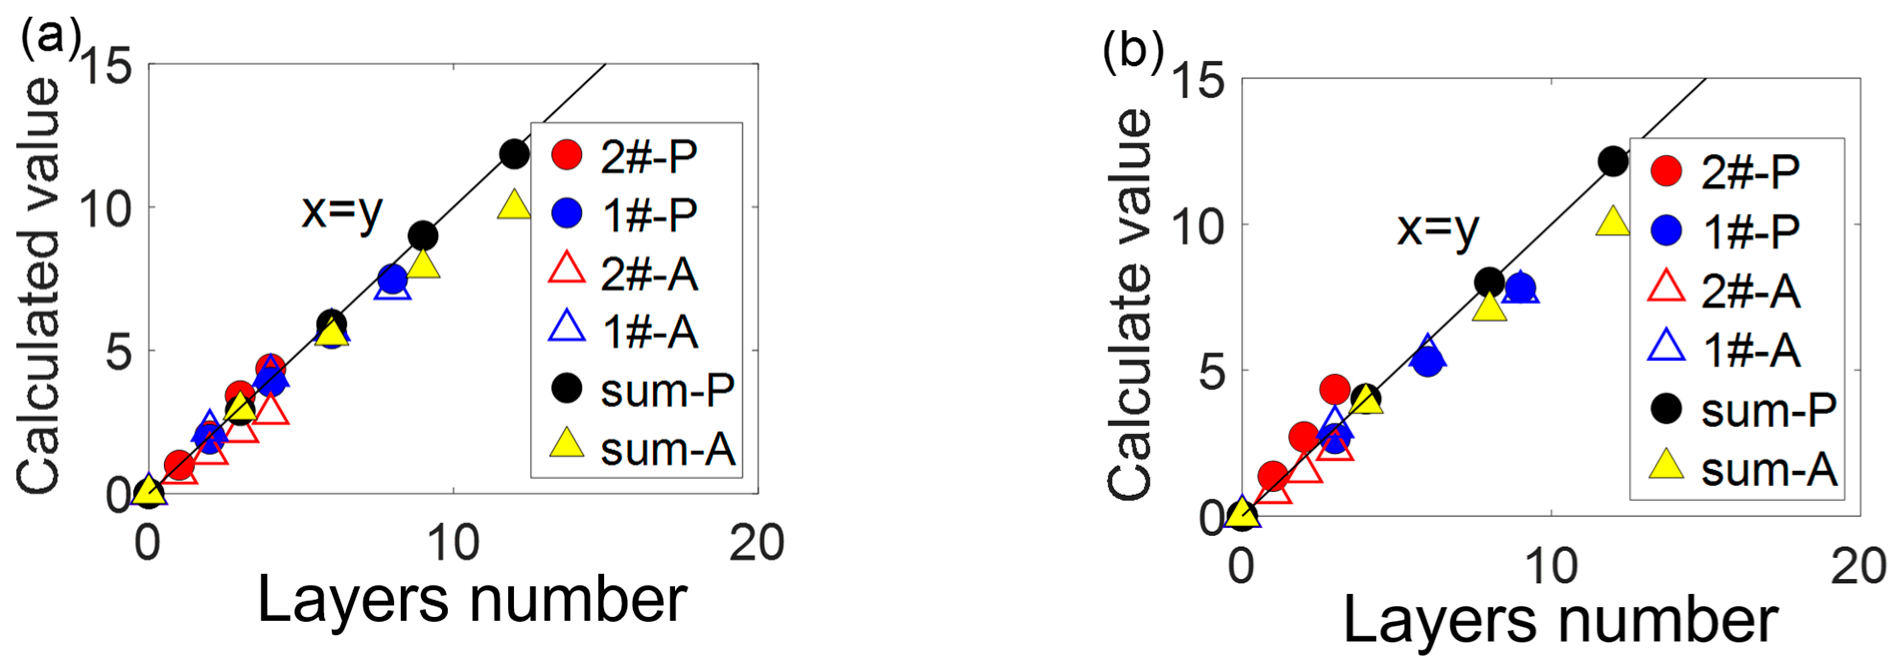
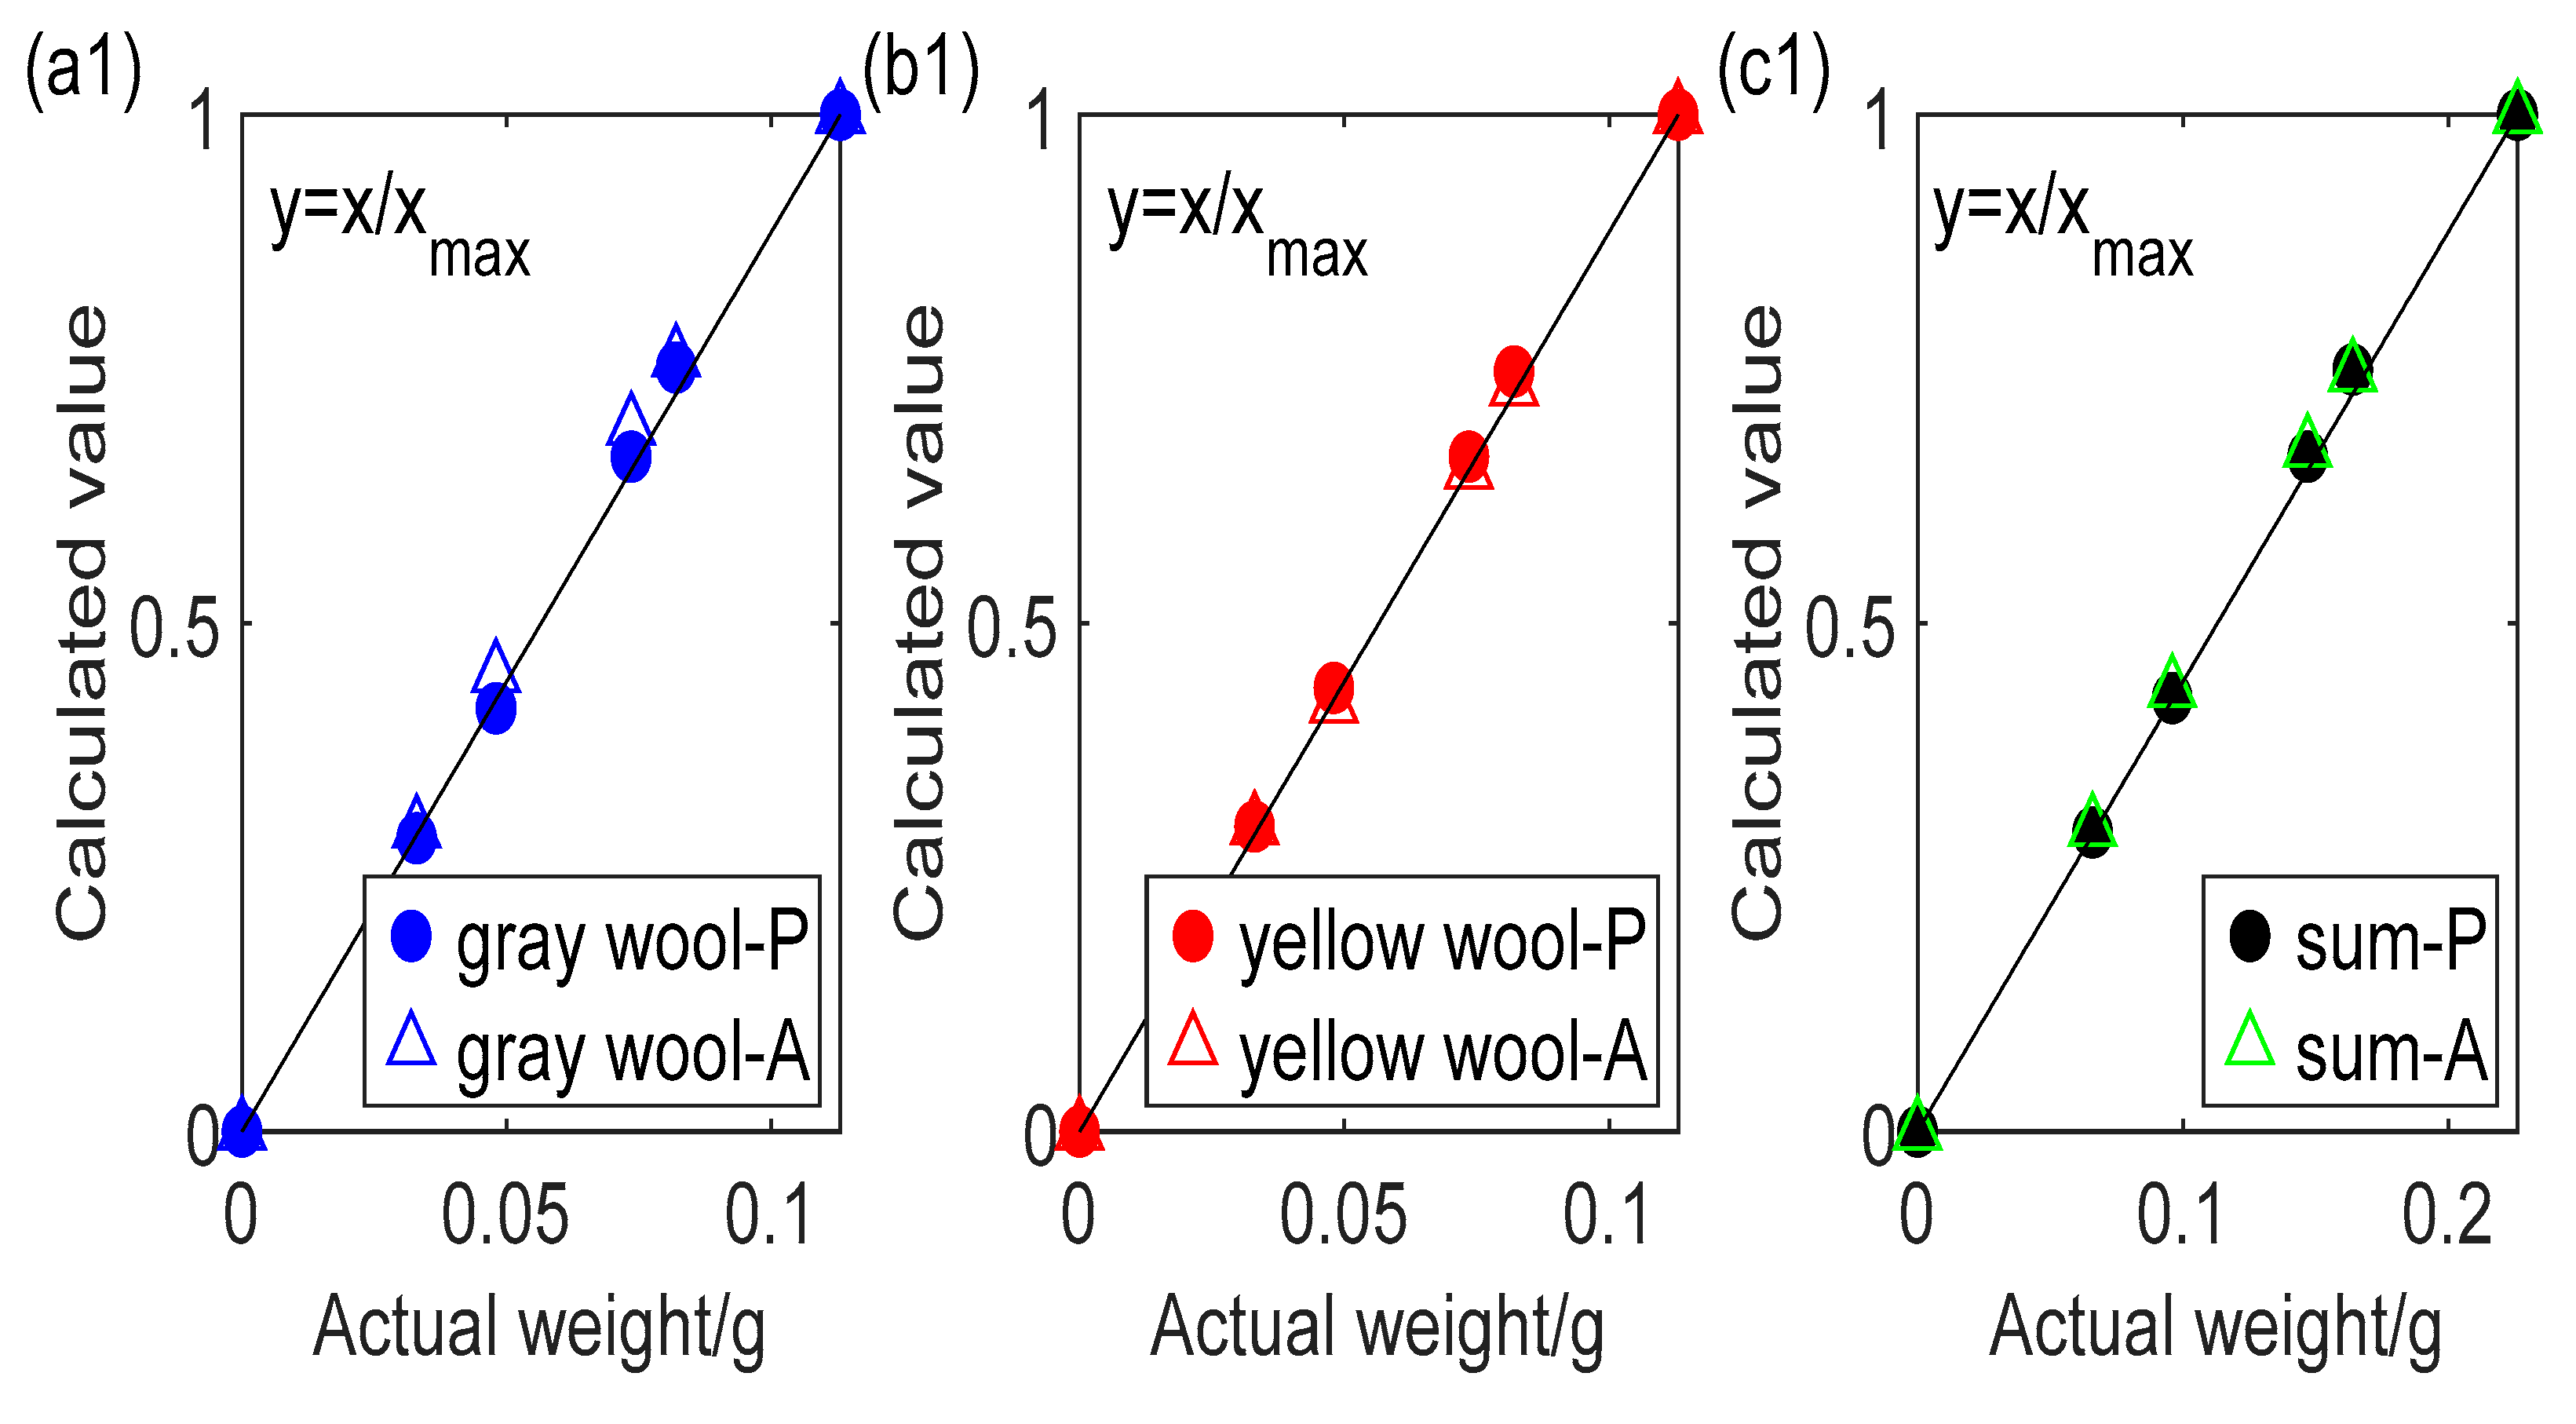
3.4. Thickness of Each Component in Mixed Samples
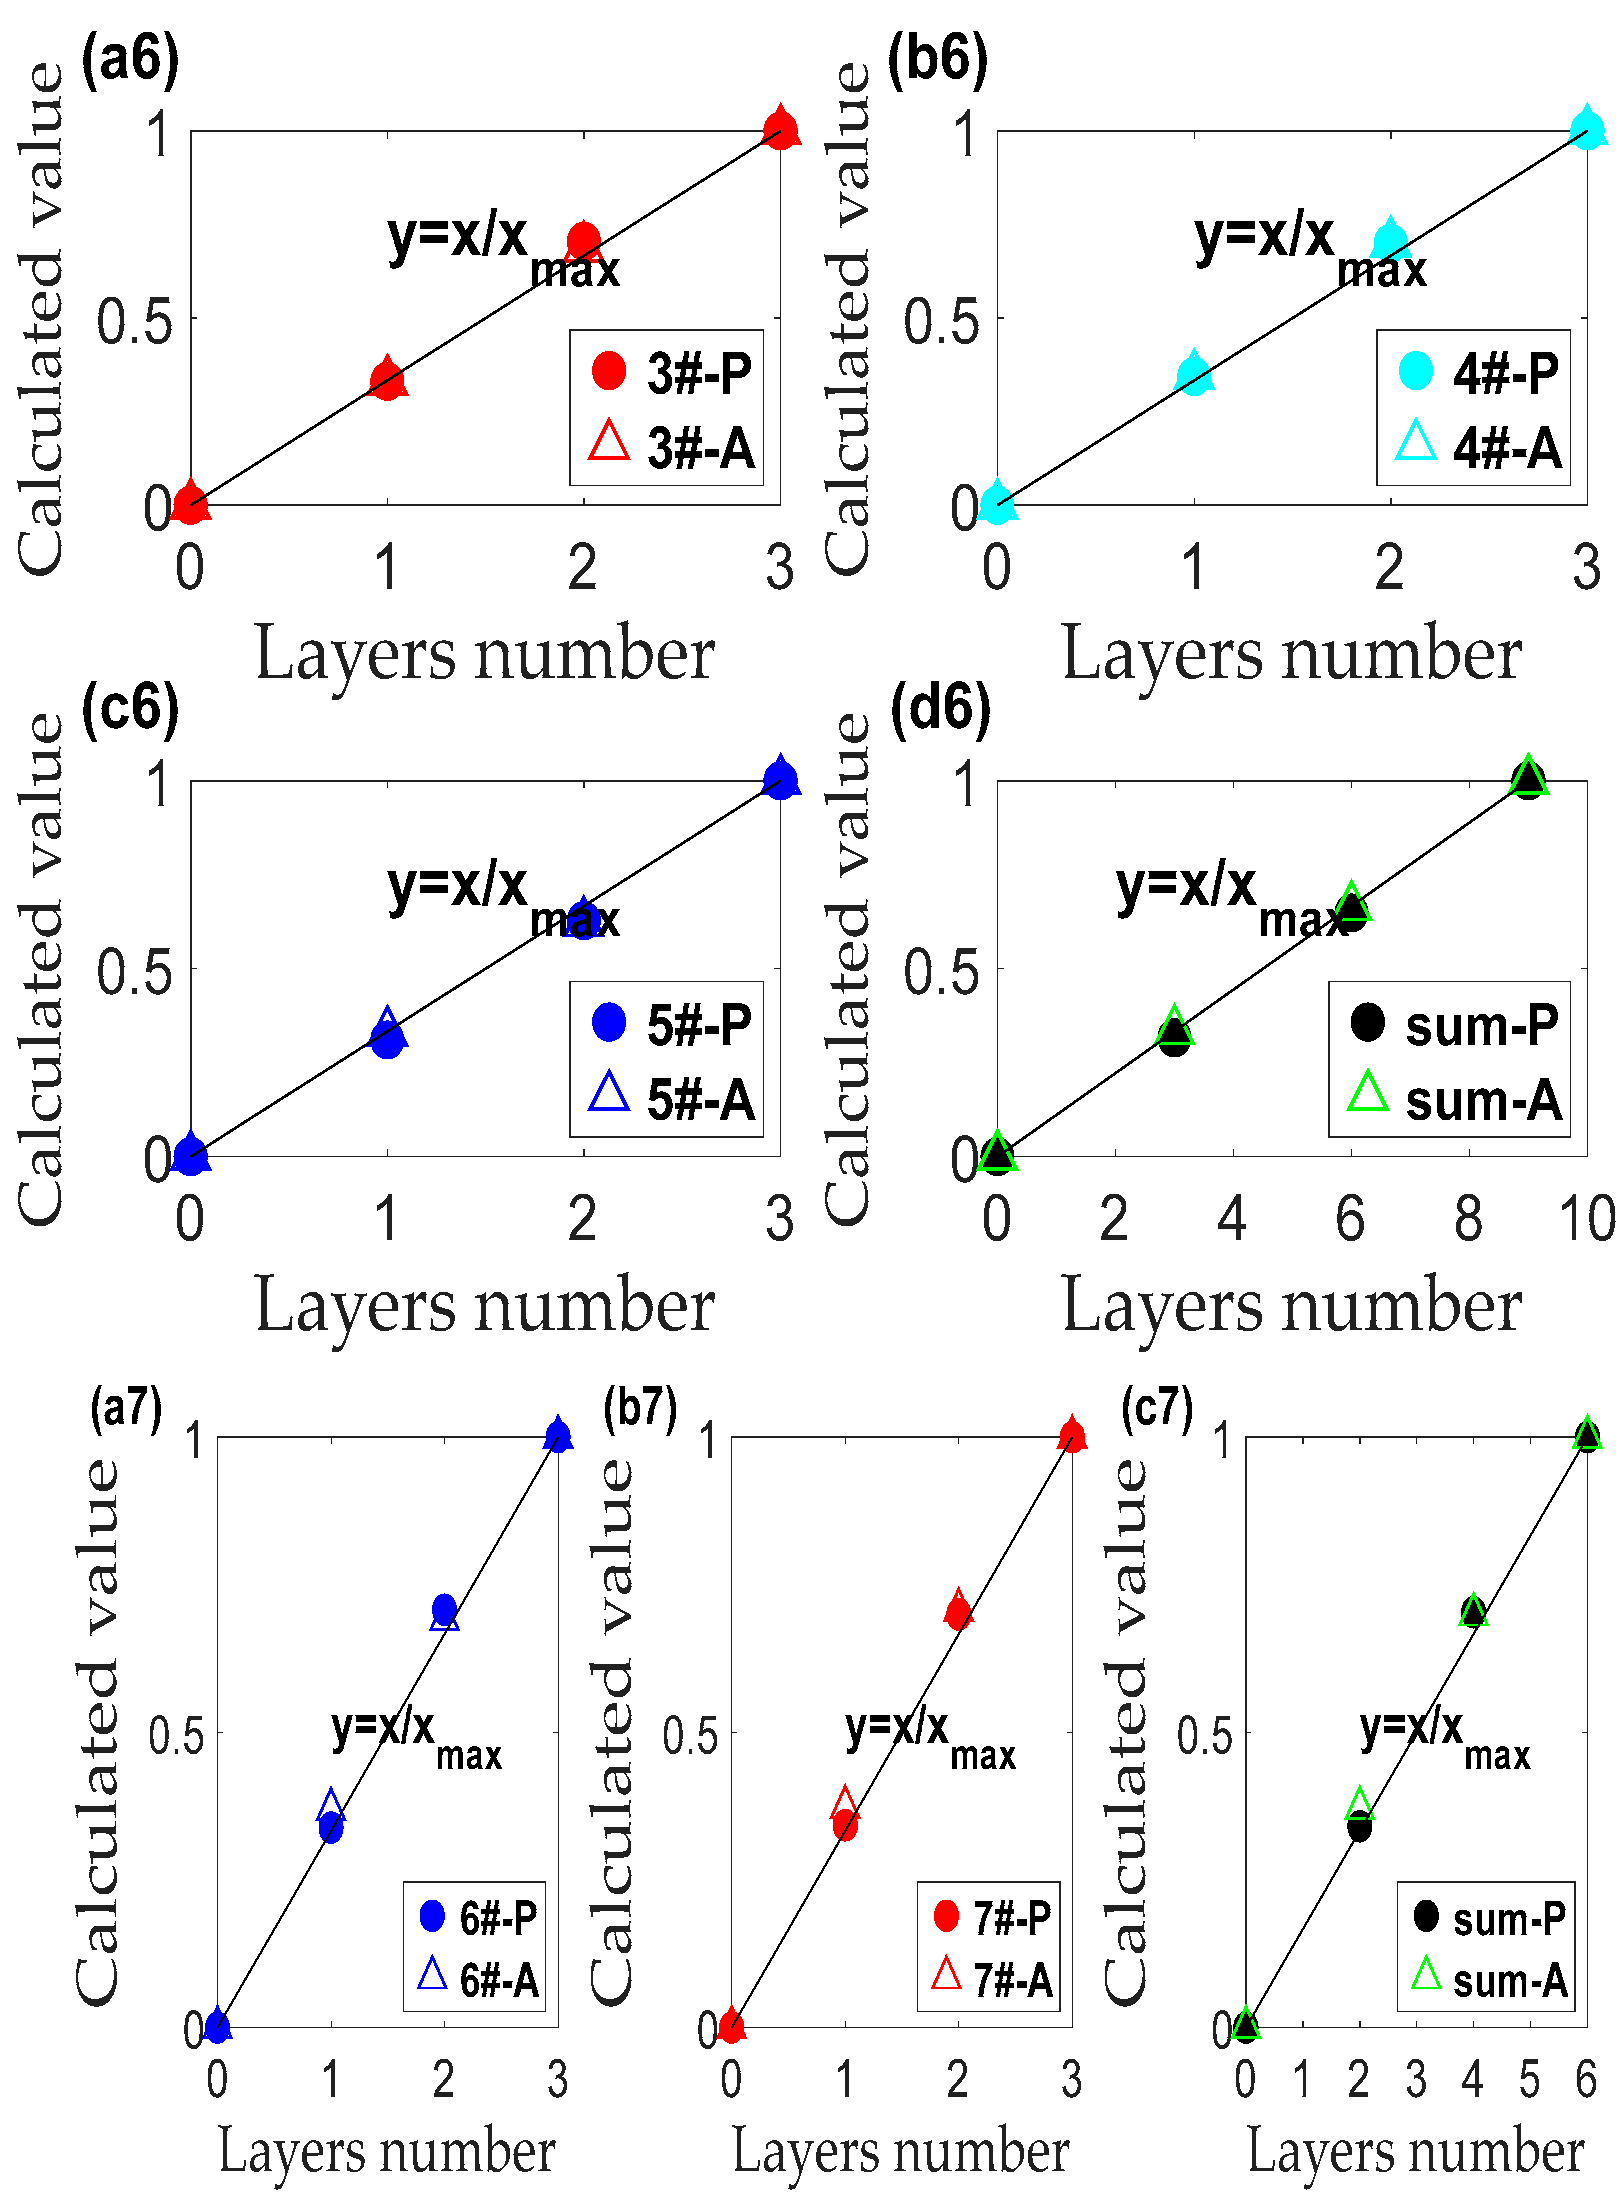
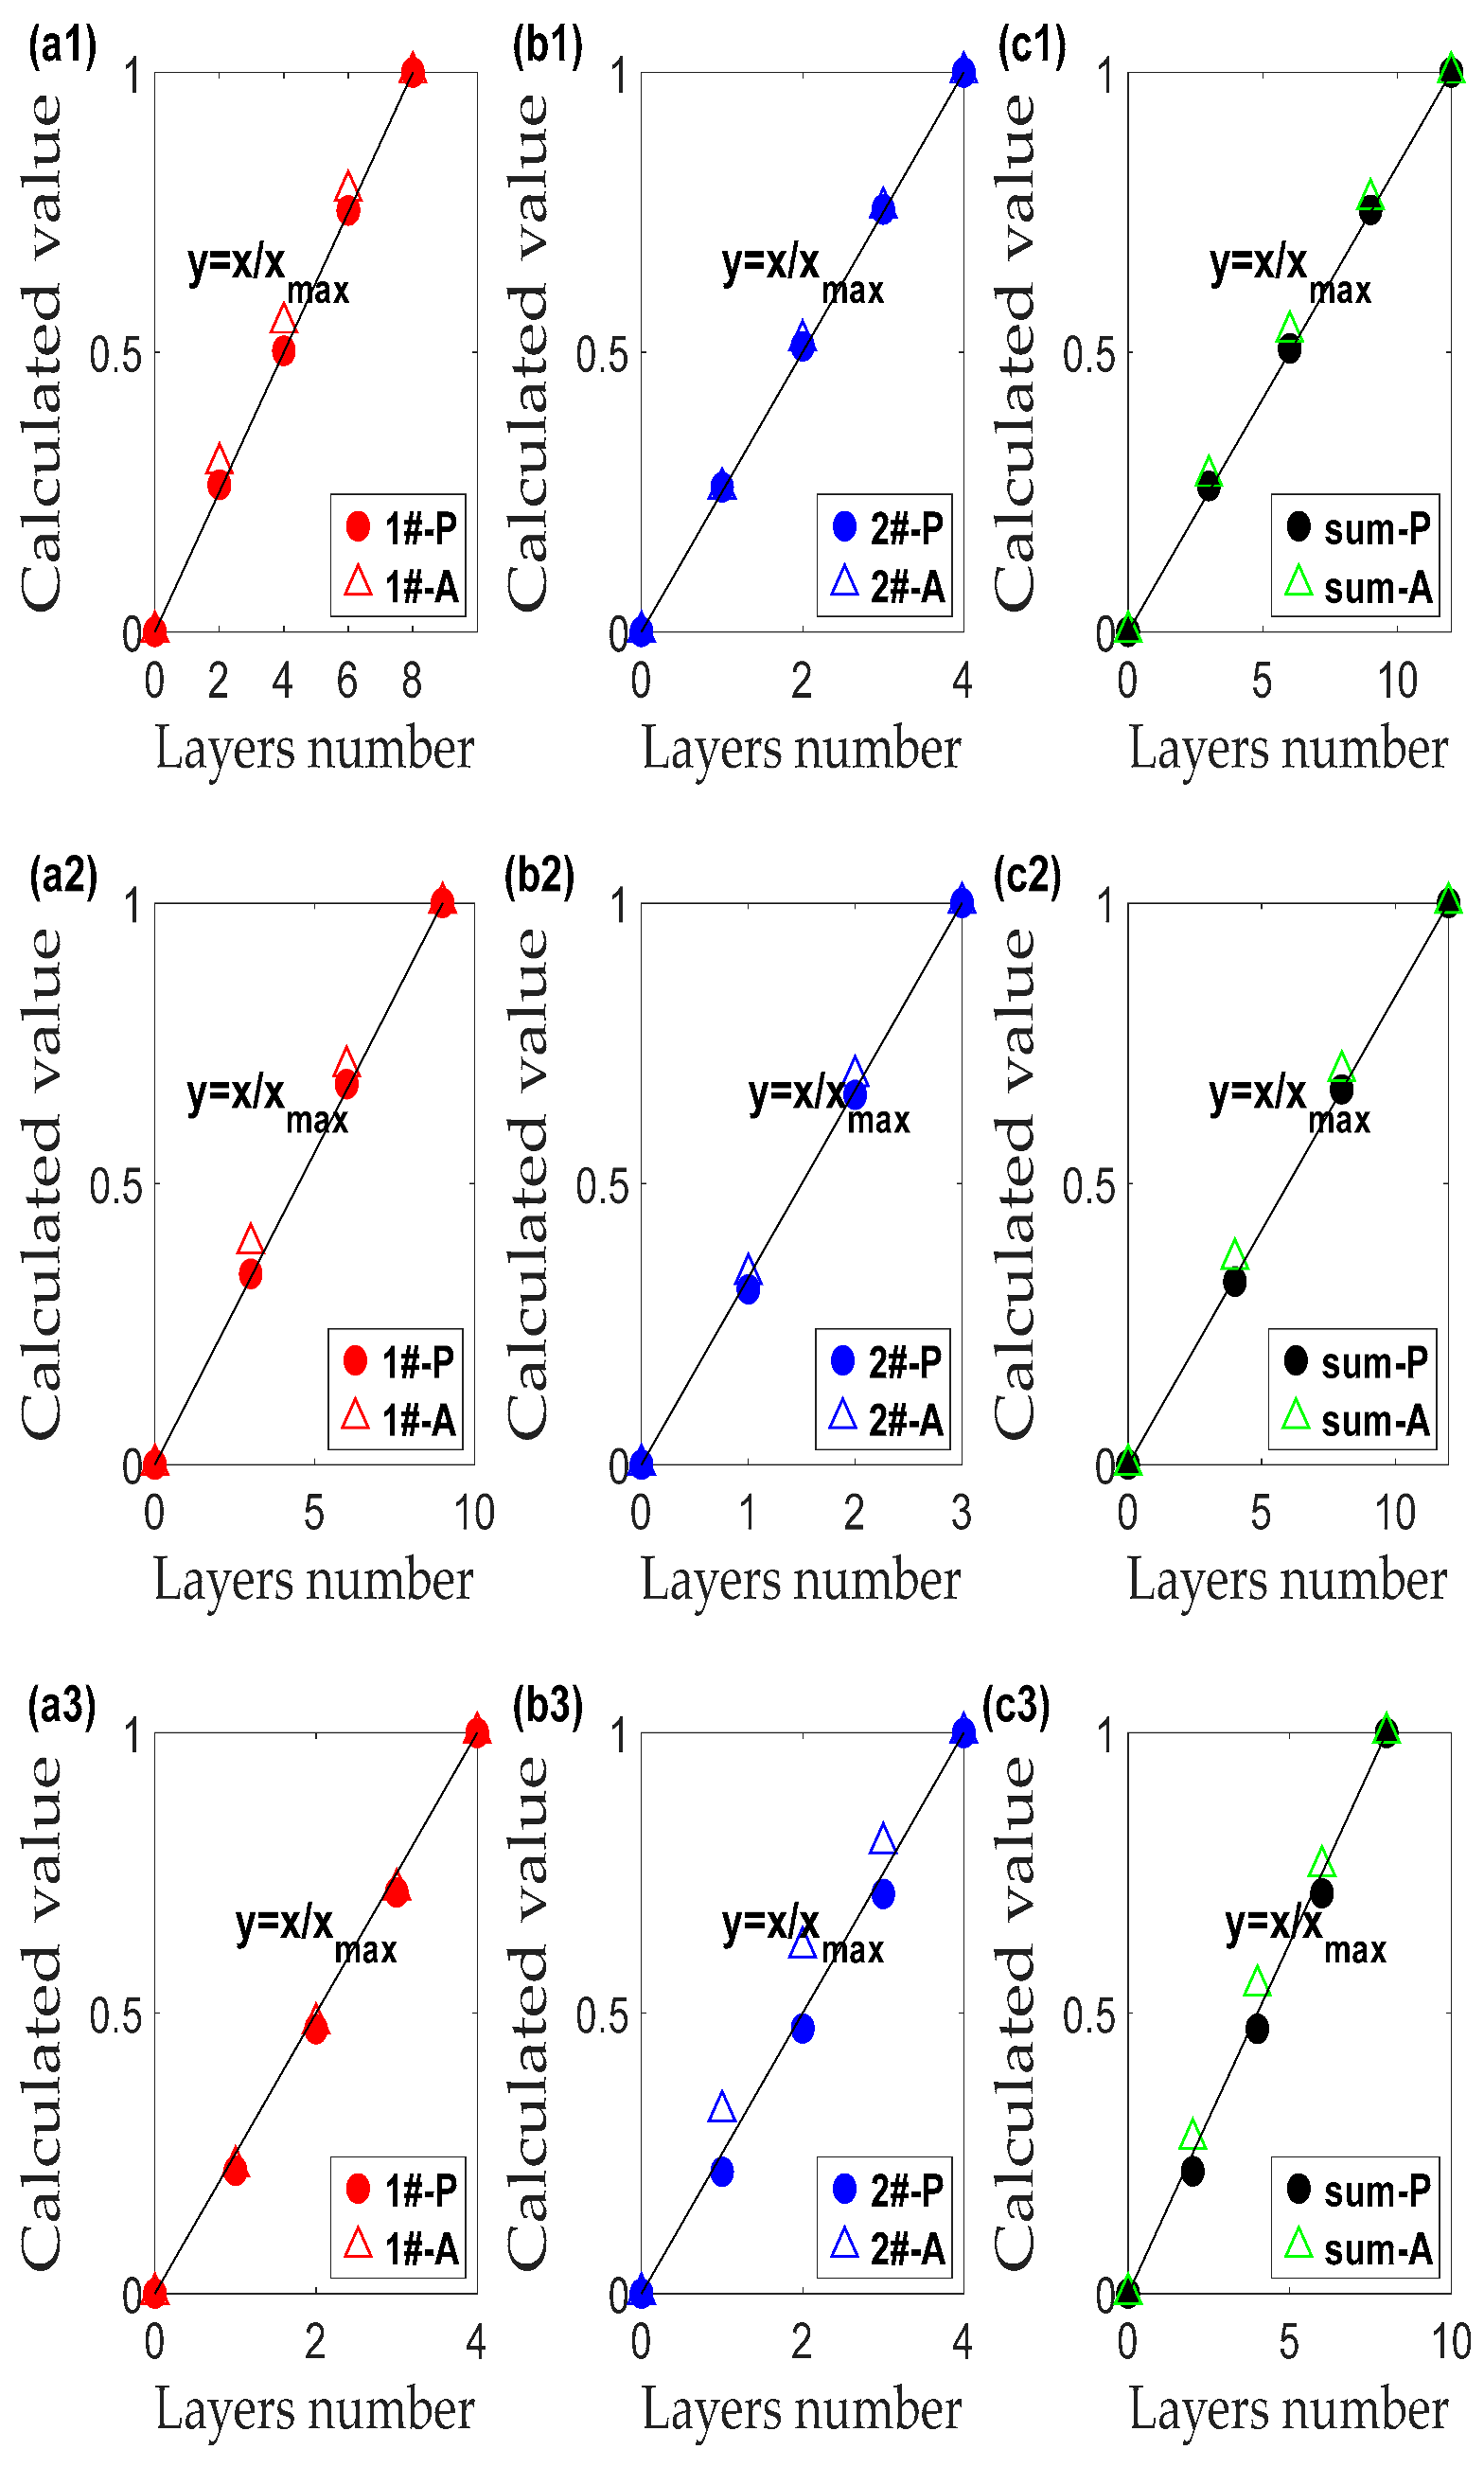
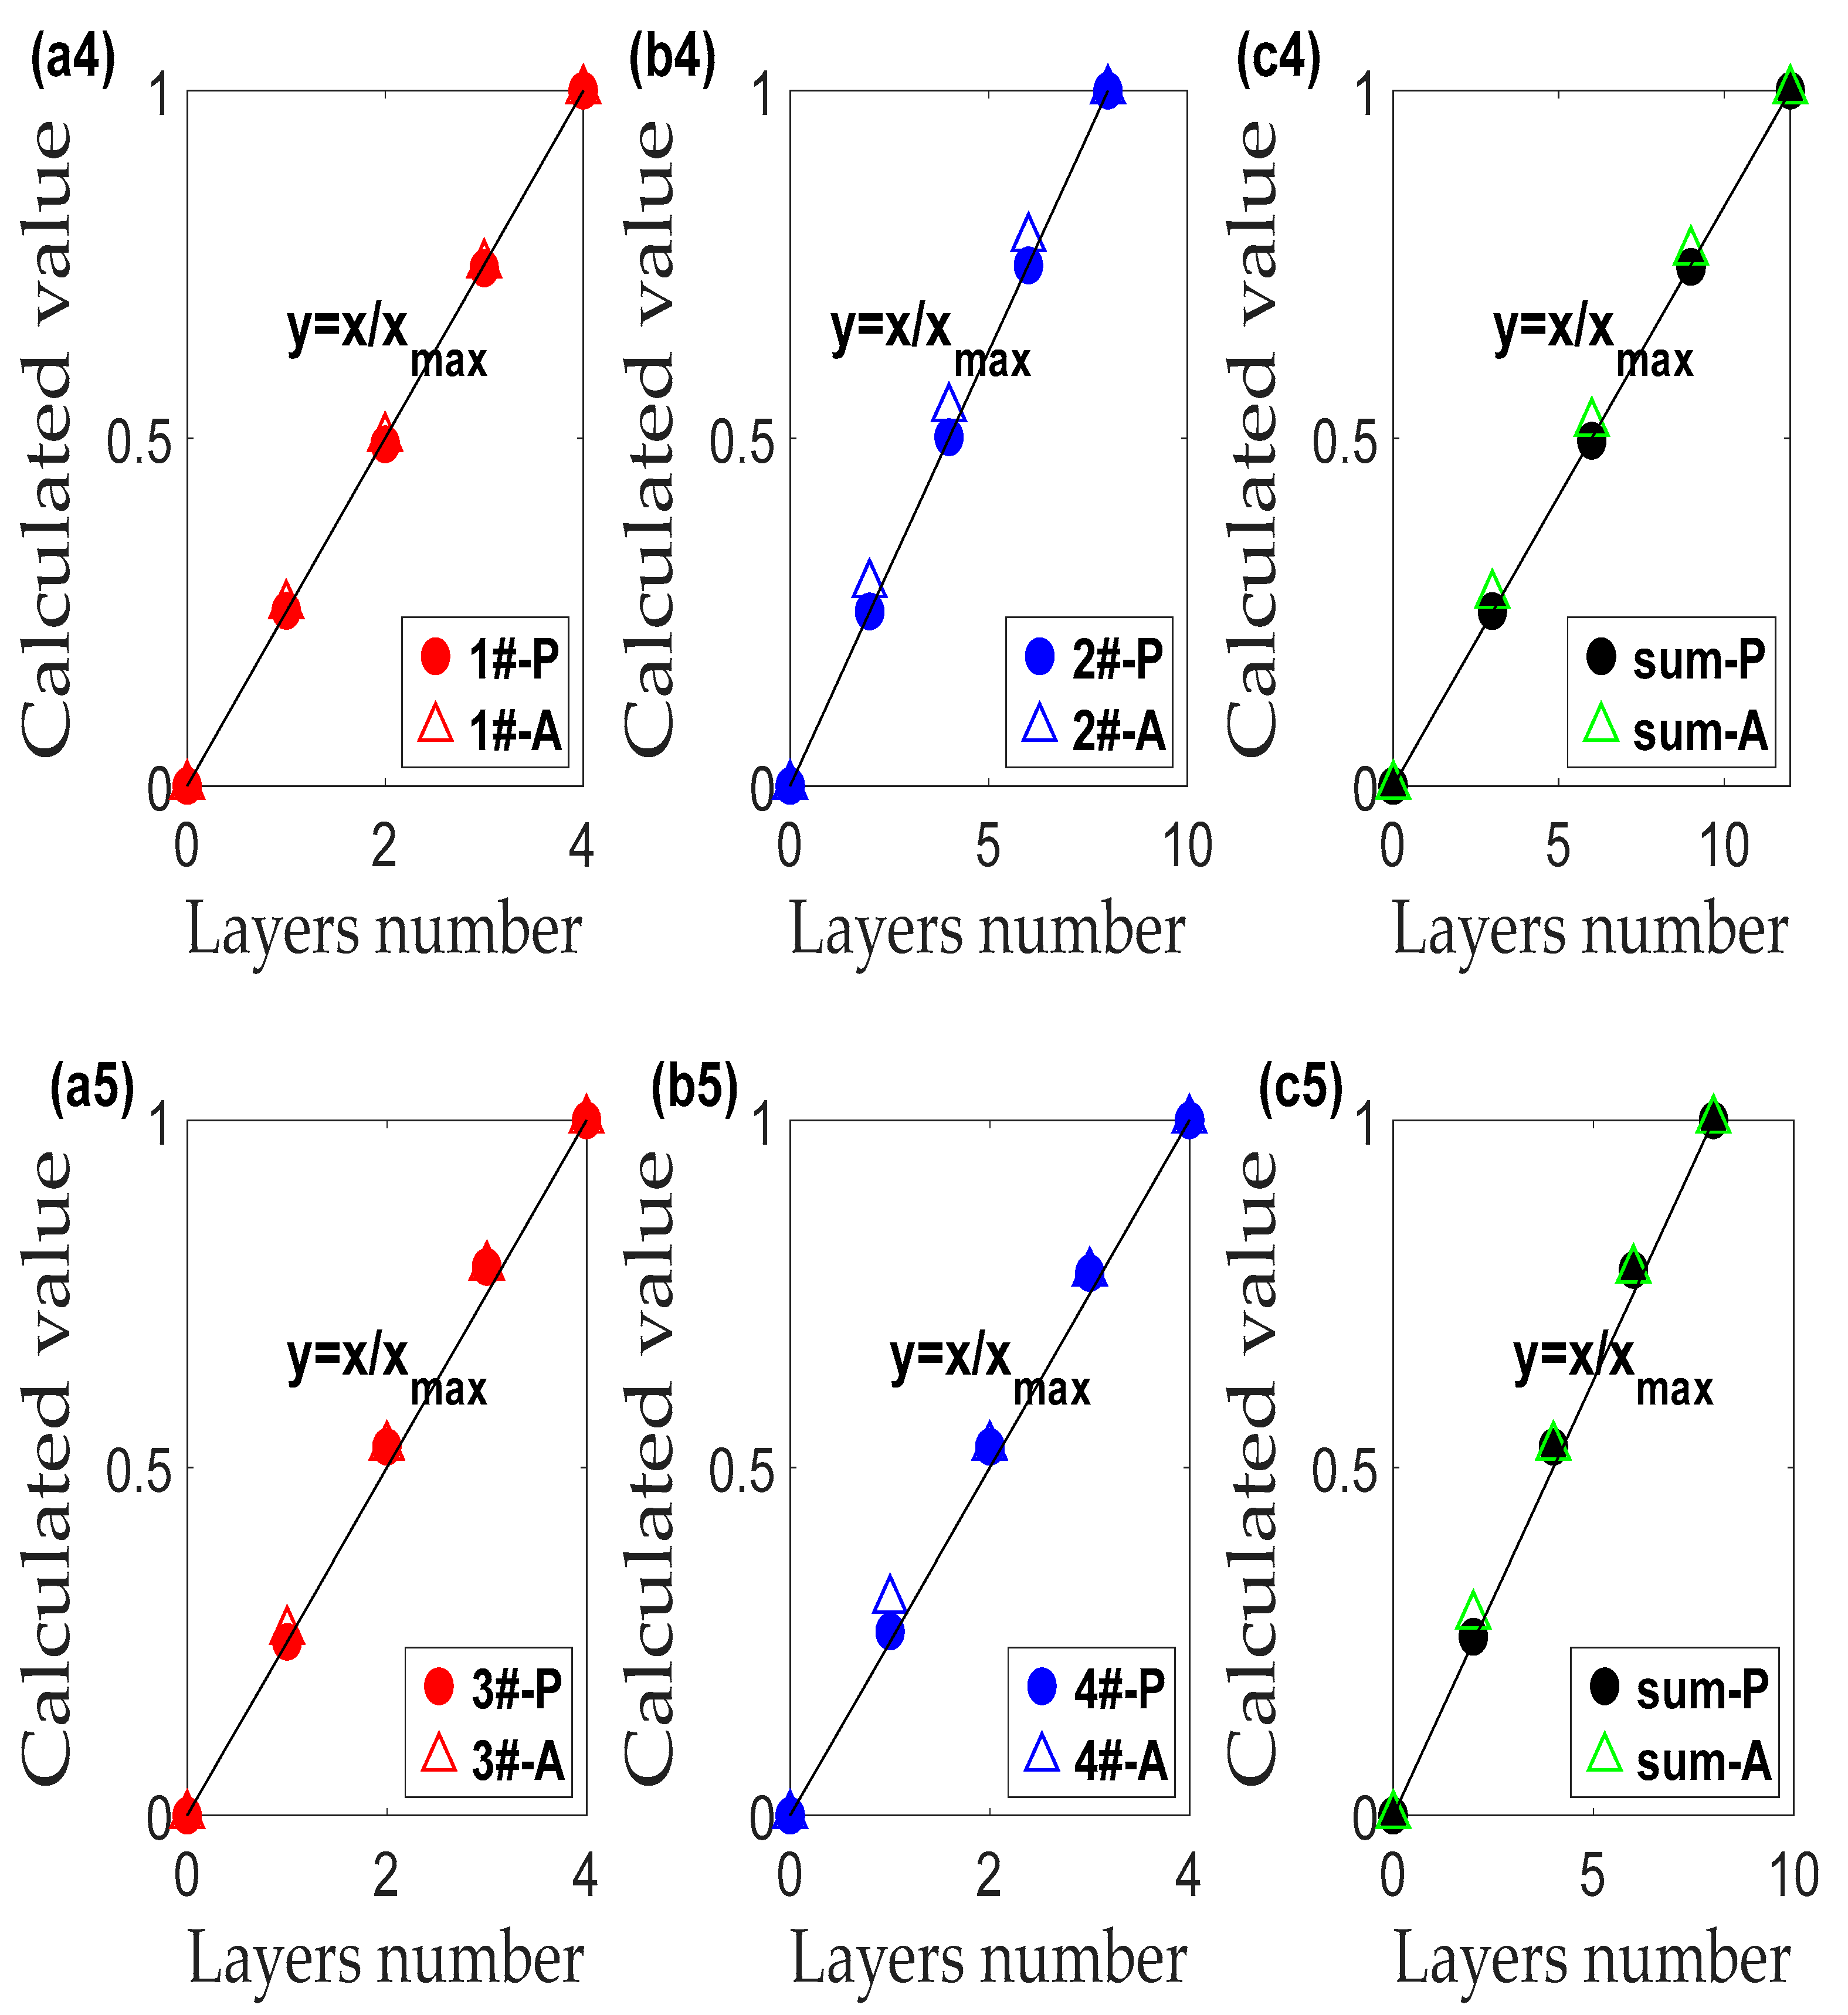
3.5. Relative Thickness of Each Component in Mixed Material
4. Application
5. Conclusions
Author Contributions
Funding
Institutional Review Board Statement
Informed Consent Statement
Data Availability Statement
Acknowledgments
Conflicts of Interest
References
- Yang, R.H.; Pan, B.; Wang, L.J.; Lin, J.W. Blending effects and performance of ring-, rotor-, and air-jet-spun color-blended viscose yarns. Cellulose 2021, 28, 1769–1780. [Google Scholar] [CrossRef]
- Lam, N.Y.K.; Zhang, M.; Guo, H.F.; Ho, C.P.; Li, L. Effect of fiber length and blending method on the tensile properties of ring spun chitosan–cotton blend yarn. Text. Res. J. 2017, 87, 244–257. [Google Scholar] [CrossRef]
- Li, S.Y.; Fu, H. Image analysis and evaluation for internal structural properties of cellulosic yarn. Cellulose 2021, 28, 6739–6756. [Google Scholar] [CrossRef]
- Hertel, K.L.; Zervigon, M.G. An optical method for the length analysis of cotton fibres. Text. Res. J. 1936, 6, 331–339. [Google Scholar] [CrossRef]
- Hertel, K.L. A method of fibre-length analysis using the fibrograph. Text. Res. J. 1940, 10, 510–520. [Google Scholar] [CrossRef]
- Wu, H.Y.; Wang, F.M. Image measuring method for fiber length measurements. Ind. Text. 2013, 64, 321–325. [Google Scholar]
- Jin, J.Y.; Xu, B.G.; Wang, F.M. Measurement of short fiber contents in raw cotton using dual-beard images. Text. Res. J. 2018, 88, 14–26. [Google Scholar] [CrossRef]
- Gordon, H.R. Can the Lambert-Beer law be applied to the diffuse attenuation coefficient of ocean water? Limnol. Oceanogr. 1989, 34, 1389–1409. [Google Scholar] [CrossRef]
- Naylor, G.R.; Delhom, C.D.; Cui, X.; Gourlot, J.P.; Rodgers, J. Understanding the influence of fiber length on the high volume instrument measurement of cotton fiber strength. Text. Res. J. 2014, 84, 979–988. [Google Scholar] [CrossRef]
- Wu, M.Q.; Wang, F.M. Optical algorithm for calculating the quantity distribution of fiber assembly. Appl. Opt. 2016, 55, 7157–7162. [Google Scholar] [CrossRef] [PubMed]
- Wu, M.Q.; Jin, J.Y.; Zhang, J.; Wang, F.M. Calculation method of a random beard fibrogram based on the derived Kubelka–Munk theory. Text. Res. J. 2019, 89, 2281–2293. [Google Scholar] [CrossRef]
- Lang, C.H.; Wu, M.Q.; Pan, X.X.; Jin, J.Y.; Wang, F.M.; Xu, B.G.; Qiu, Y.P. Algorithm for measuring fiber length distributions of raw cotton and combed wool using dual-beard image method. Text. Res. J. 2020, 90, 2149–2160. [Google Scholar] [CrossRef]
- Chen, L.J.; Shen, H.; Wang, F.M. Quantifying the thickness of each color material in multilayer transparent specimen based on transmission image. Text. Res. J. 2020, 90, 2522–2532. [Google Scholar] [CrossRef]
- Chen, L.J.; Shen, H.; Heng, C.; Wang, F.M. Algorithm for predicting the length of each color fiber in mixed-wool fiber assemblies based on the transmission image. Text. Res. J. 2020, 90, 357–366. [Google Scholar] [CrossRef]
- Strong, F.C. Theoretical basis of Bouguer-Beer law of radiation absorption. Anal. Chem. 1952, 24, 338–342. [Google Scholar] [CrossRef]
- Molenaar, R.; Jaap, J.; Zijp, J.R. Determination of Kubelka–Munk scattering and absorption coefficients by diffuse illumination. Appl. Opt. 1999, 38, 2068–2077. [Google Scholar] [CrossRef] [PubMed]
- Dong, T.; Li, Q.; Tian, N.; Zhao, H.G.; Zhang, Y.M.; Han, G.T. Concus Finn Capillary driven fast viscous oil-spills removal by superhydrophobic cruciate polyester fibers. J. Hazard. Mater. 2021, 417, 126133. [Google Scholar] [CrossRef] [PubMed]
- Tian, N.; Wu, S.H.; Han, G.T.; Zhang, Y.M.; Li, Q.; Dong, T. Biomass-derived oriented neurovascular network-like superhydrophobic aerogel as robust and recyclable oil droplets captor for versatile oil/water separation. J. Hazard. Mater. 2022, 424, 127393. [Google Scholar] [CrossRef] [PubMed]
- Guo, Z.J.; Lu, Z.; Li, Y.; Liu, W. Highly Performed Fiber-Based Supercapacitor in a Conjugation of Mesoporous MXene. Adv. Mater. Interfaces 2022, 9, 2101977. [Google Scholar] [CrossRef]


| Number | Color | Image | Thickness/mm | Material | Surface |
|---|---|---|---|---|---|
| 1# | Blue |  | 0.02 | PET | S |
| 2# | Yellow |  | 0.02 | PET | S |
| 3# | Pink |  | 0.35 | PET | S |
| 4# | Cyan |  | 0.35 | PET | S |
| 5# | White |  | 0.01 | PET | S |
| 6# | Dark blue |  | 0.5 | PP | R |
| 7# | Dark Yellow |  | 0.5 | PP | R |
| Image | Order | Ratio | Group | Material | Surface | ||
|---|---|---|---|---|---|---|---|
| A# | a# |  | 2#1# | 1:2 | 4 | PET | S |
| b# |  | 1#2# | 3:1 | 3 | PET | S | |
| c# |  | 1:1 | 3 | PET | S | ||
| d# |  | 1:2 | 4 | PET | S | ||
| B# | e# |  | 4#3# | 1:1 | 3 | PET | S |
| C# | f# |  | 4#5#3# | 1:1:1 | 2 | PET | S |
| D# | g# |  | 6#7# | 1:1 | 3 | PP | R |
| E# | h# |  | 7#4# | 1:1 | 7 | PP\PET | R\S |
| i# |  | 1:2 | 4 | PP\PET | R\S |
| Number | r∞ of Monochromatic Specimen/% | Number | r∞ of Mixed Specimen/% | ||||
|---|---|---|---|---|---|---|---|
| R | G | B | R | G | B | ||
| 1# | 2.10 | 50.85 | 70.02 | a# | 27.03 | 55.84 | 42.43 |
| 2# | 74.35 | 71.79 | 22.13 | b# | 26.50 | 55.89 | 46.89 |
| 3# | 22.49 | 10.12 | 12.01 | c# | 35.33 | 59.82 | 40.22 |
| 4# | 29.37 | 40.58 | 23.73 | d# | 44.64 | 62.54 | 35.07 |
| 5# | 85.19 | 87.98 | 93.58 | e# | 30.15 | 26.93 | 20.40 |
| 6# | 15.80 | 31.11 | 53.62 | f# | 32.93 | 16.85 | 14.82 |
| 7# | 76.49 | 66.95 | 34.00 | g# | 17.40 | 32.83 | 37.44 |
| h# | 73.47 | 71.35 | 33.41 | ||||
| Order | Ratio | Scattered Photometric | Absorbance | ||
|---|---|---|---|---|---|
| Mean Deviation Rate% | Max Deviation Rate% | Mean Deviation Rate% | Max Deviation Rate% | ||
| 2#1# | 1:2 | 1.53 | 5.09 | 4.26 | 20.4 |
| 1#2# | 3:1 | 2.56 | 6.21 | 4.029 | 19.57 |
| 1:1 | 6.81 | 14.03 | 12.45 | 42.24 | |
| 1:2 | 3.36 | 8.76 | 6.35 | 23.48 | |
| 4#3# | 1:1 | 2.72 | 6.35 | 5.12 | 24.63 |
| 4#5#3# | 1:1:1 | 2.28 | 6.86 | 1.7 | 6.74 |
| 6#7# | 1:1 | 1.94 | 6.13 | 4.08 | 12.05 |
| 7#4# | 1:1 | 2.89 | 14.38 | 17.07 | 78.31 |
| 1:2 | 4.09 | 12.01 | 10.69 | 42.72 | |
Publisher’s Note: MDPI stays neutral with regard to jurisdictional claims in published maps and institutional affiliations. |
© 2022 by the authors. Licensee MDPI, Basel, Switzerland. This article is an open access article distributed under the terms and conditions of the Creative Commons Attribution (CC BY) license (https://creativecommons.org/licenses/by/4.0/).
Share and Cite
Wu, M.; Lu, Z.; Li, Y.; Yan, X.; Chen, X.; Zeng, F.; Zhu, C. An Optical Algorithm for Relative Thickness of Each Monochrome Component in Multilayer Transparent Mixed Films. Polymers 2022, 14, 3423. https://doi.org/10.3390/polym14163423
Wu M, Lu Z, Li Y, Yan X, Chen X, Zeng F, Zhu C. An Optical Algorithm for Relative Thickness of Each Monochrome Component in Multilayer Transparent Mixed Films. Polymers. 2022; 14(16):3423. https://doi.org/10.3390/polym14163423
Chicago/Turabian StyleWu, Meiqin, Zuoxiang Lu, Yongrui Li, Xiaofei Yan, Xuefei Chen, Fangmeng Zeng, and Chengyan Zhu. 2022. "An Optical Algorithm for Relative Thickness of Each Monochrome Component in Multilayer Transparent Mixed Films" Polymers 14, no. 16: 3423. https://doi.org/10.3390/polym14163423
APA StyleWu, M., Lu, Z., Li, Y., Yan, X., Chen, X., Zeng, F., & Zhu, C. (2022). An Optical Algorithm for Relative Thickness of Each Monochrome Component in Multilayer Transparent Mixed Films. Polymers, 14(16), 3423. https://doi.org/10.3390/polym14163423