
Prediction of Long-Term Tensile Properties of Glass Fiber Reinforced Composites under Acid-Base and Salt Environments


Abstract
:
1. Introduction
2. Materials and Methods
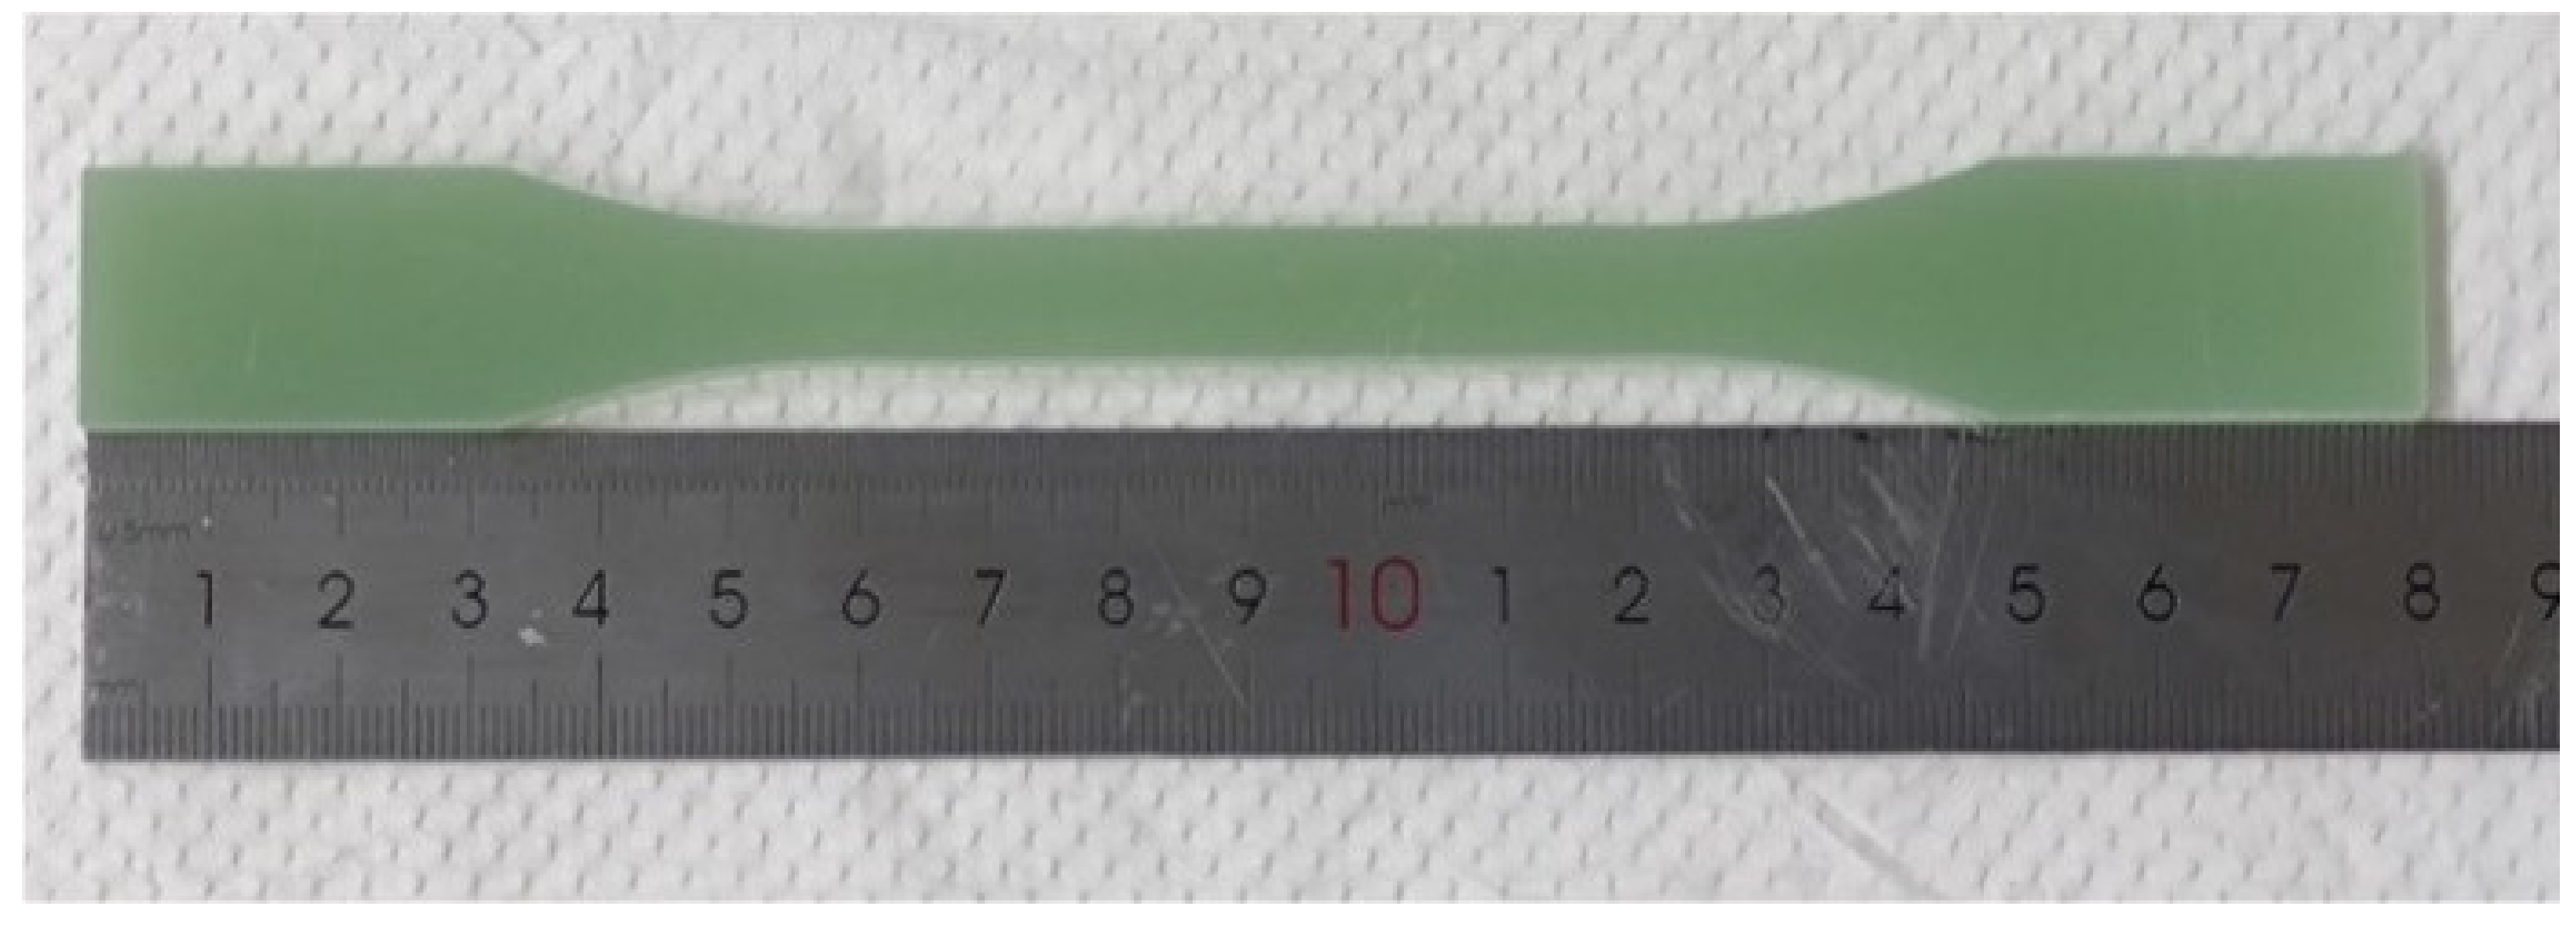
2.1. Materials
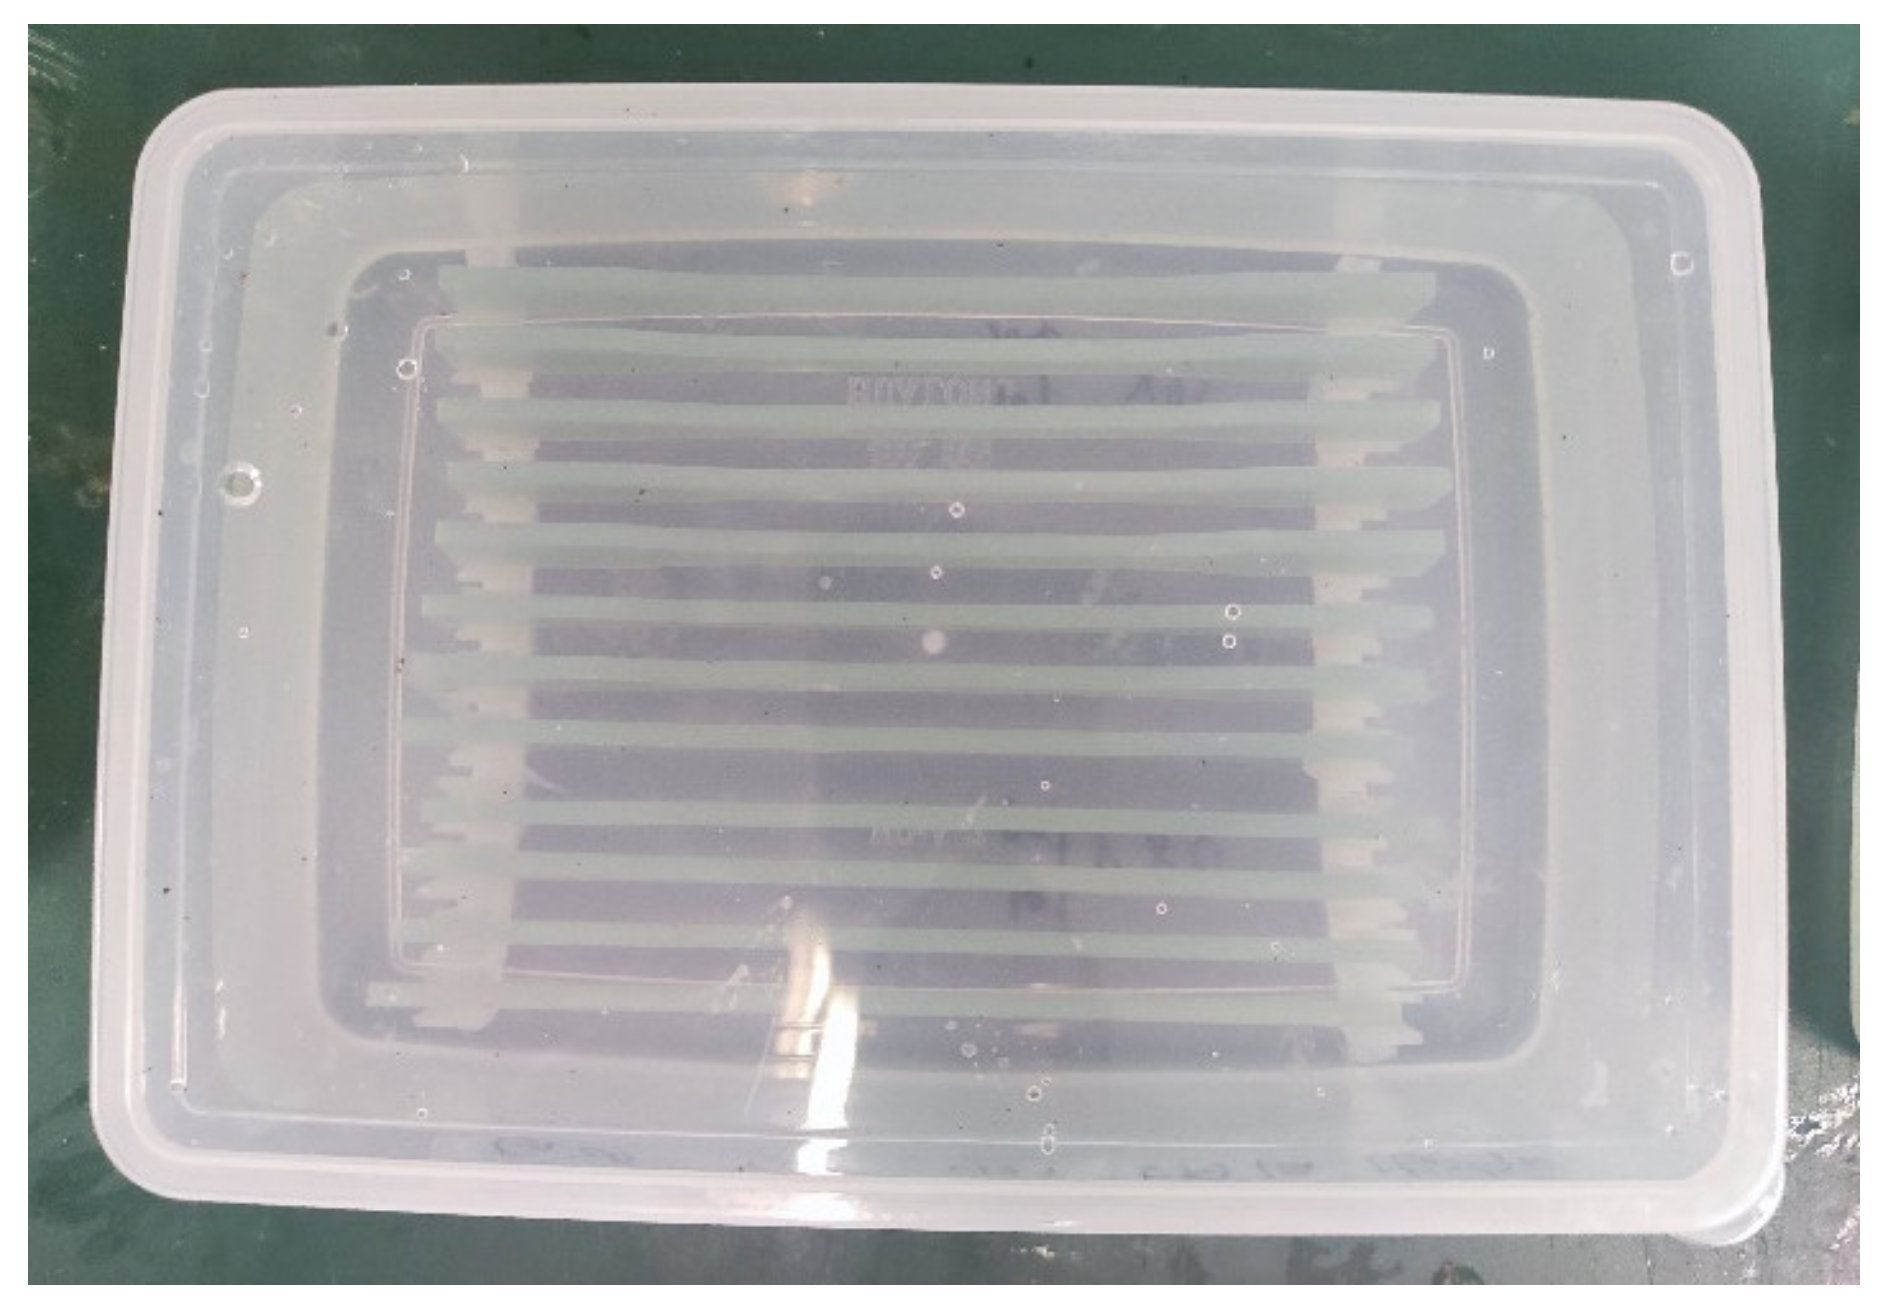
2.2. Aging Test
2.3. Mass Changes
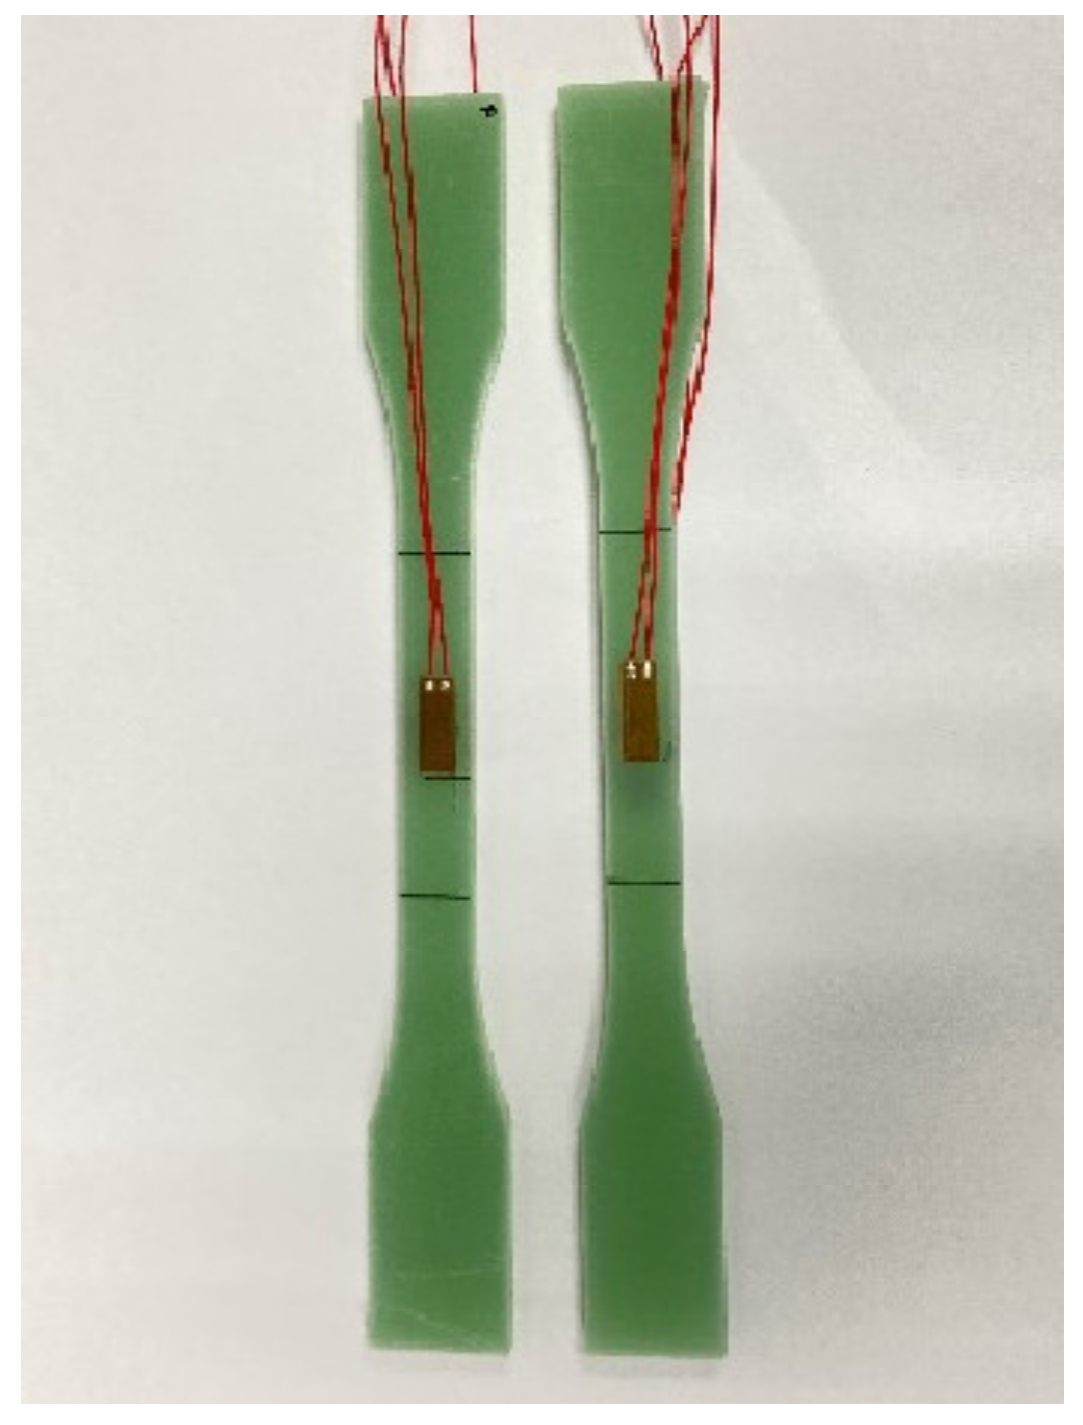
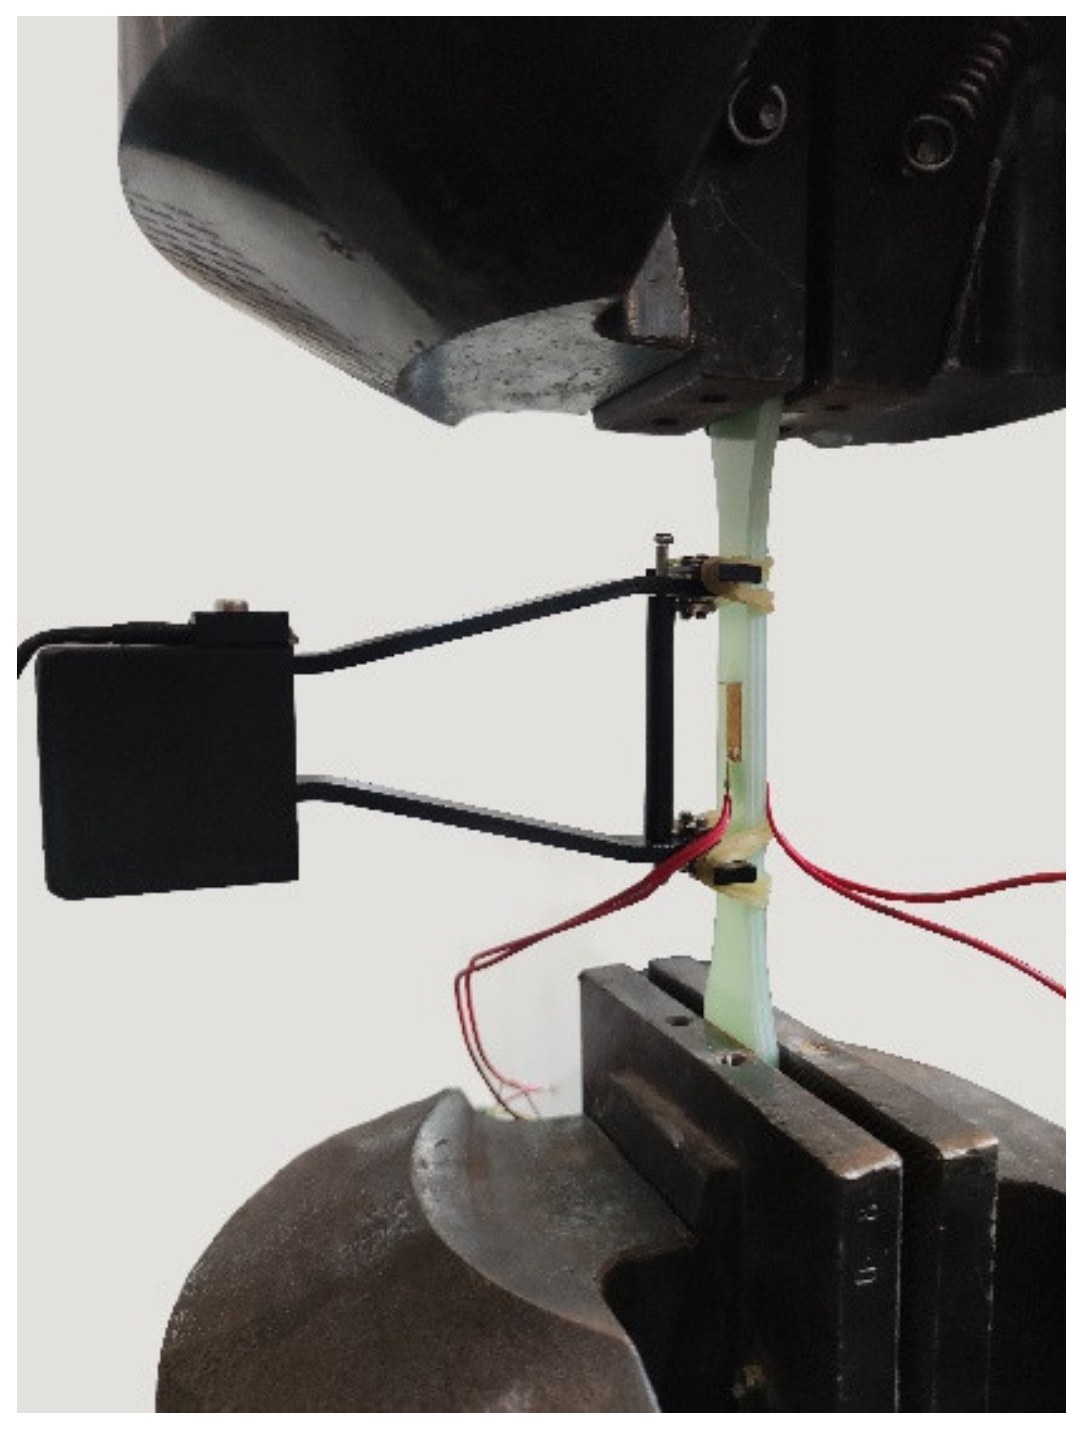
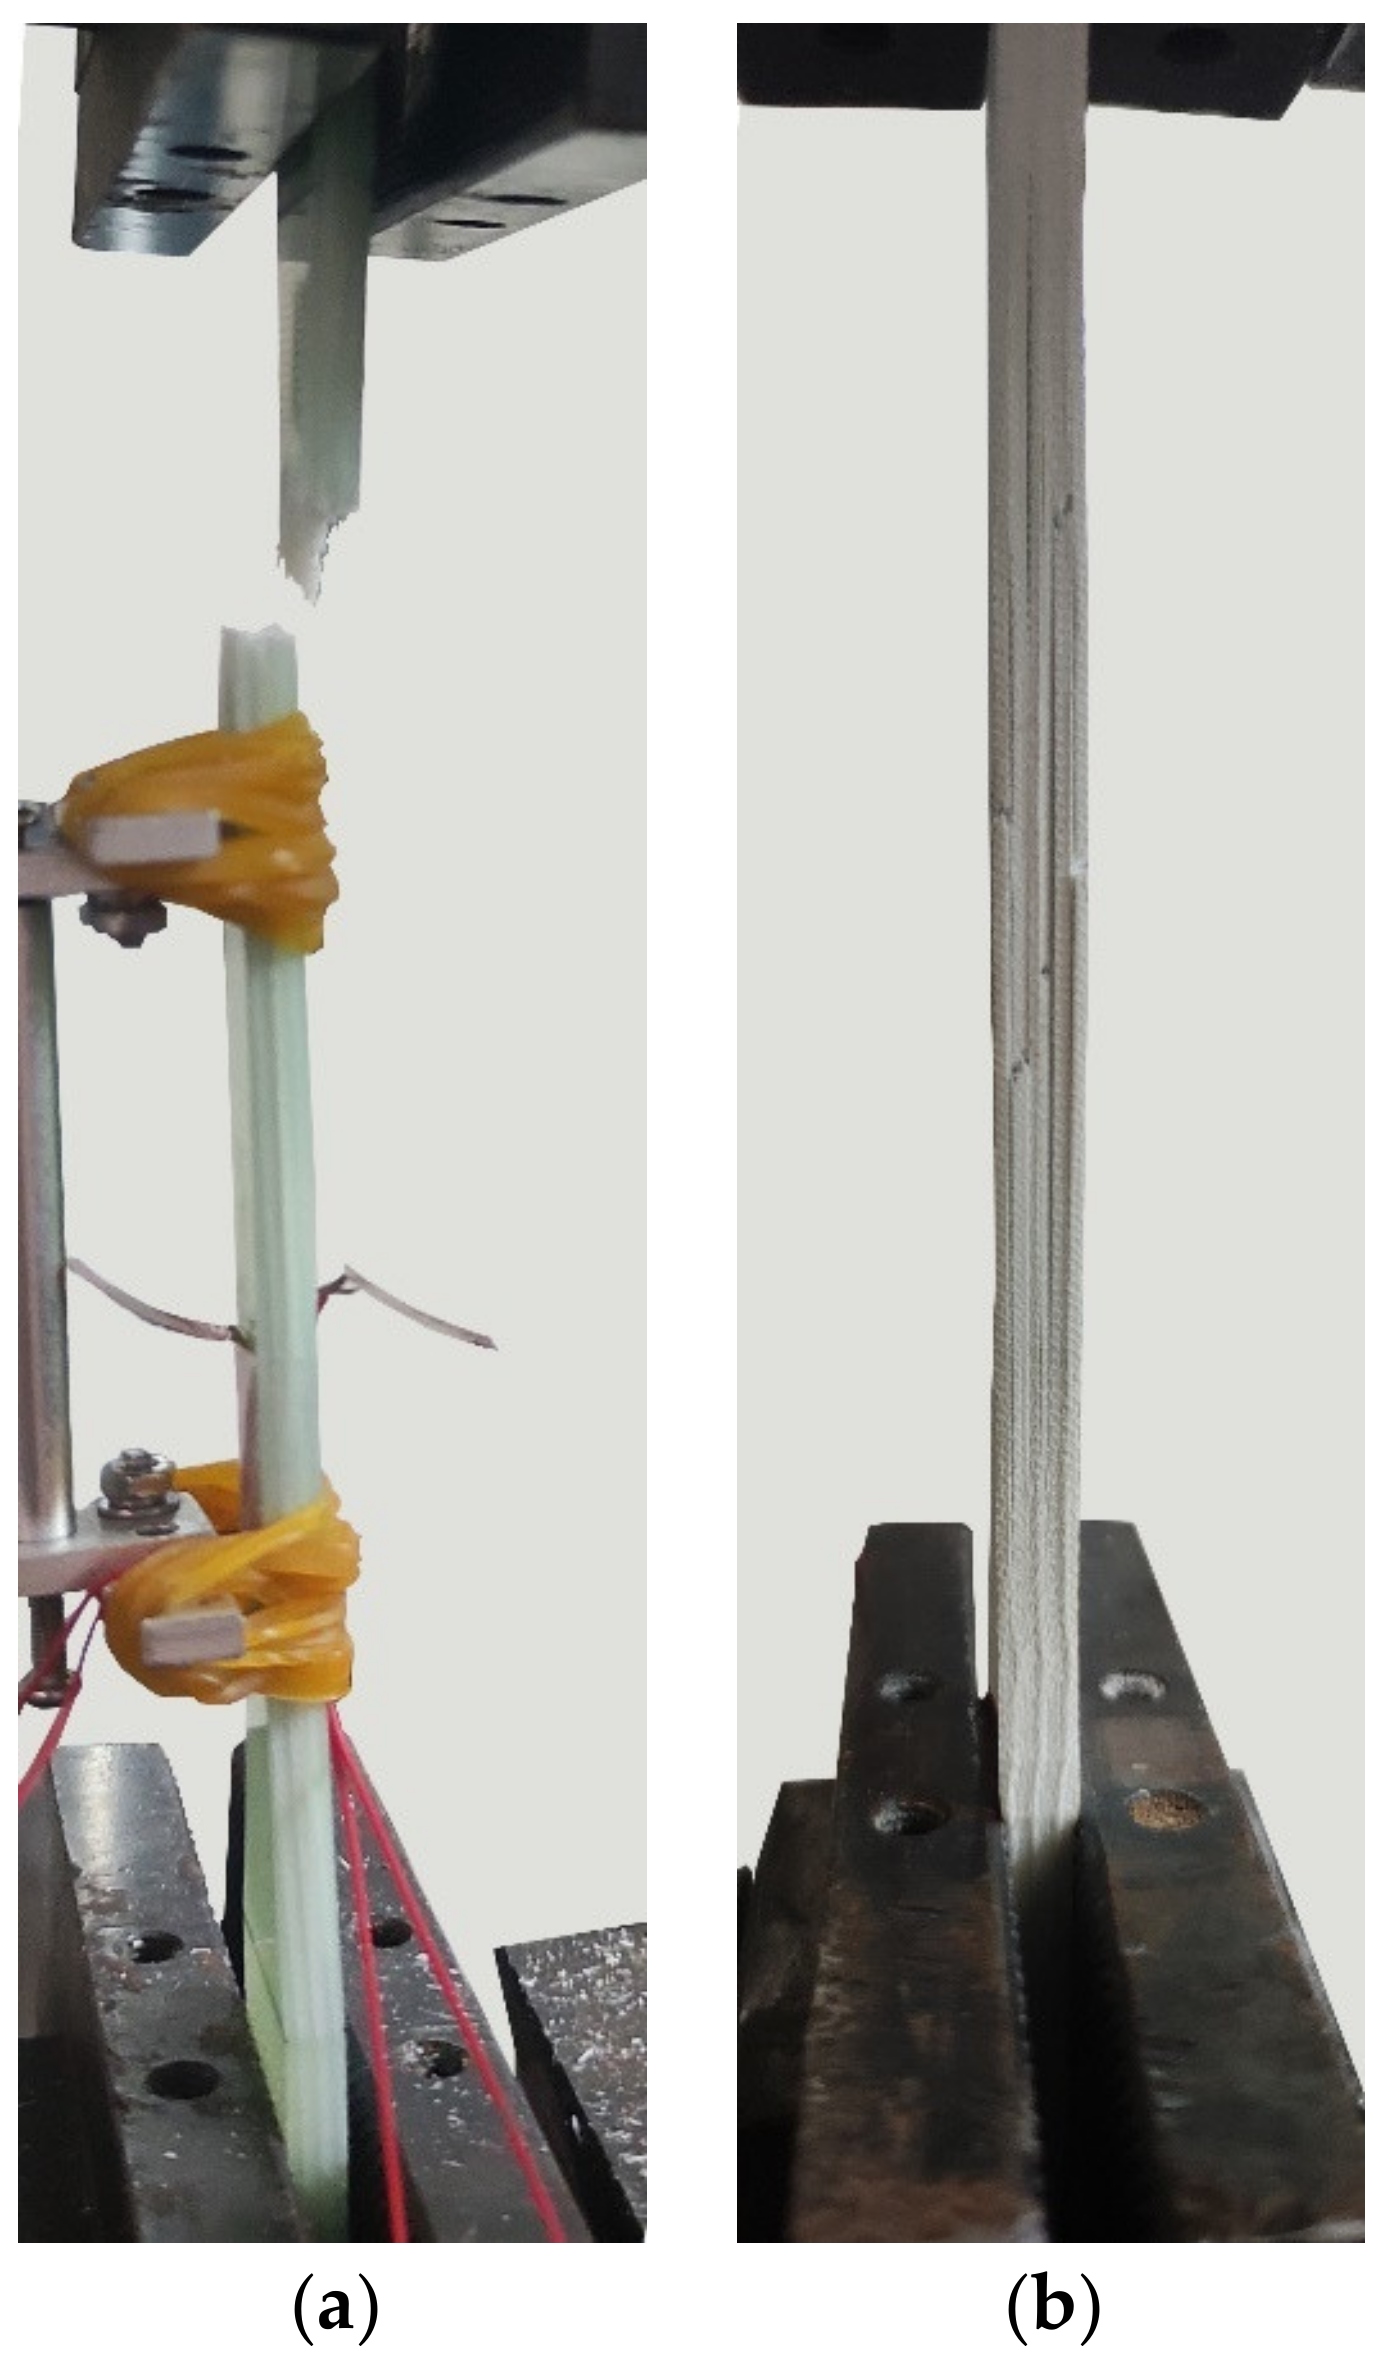
2.4. Mechanical Testing
2.5. Digital Image Correlation
2.6. Scanning Electron Microscopy
3. Results and Discussion
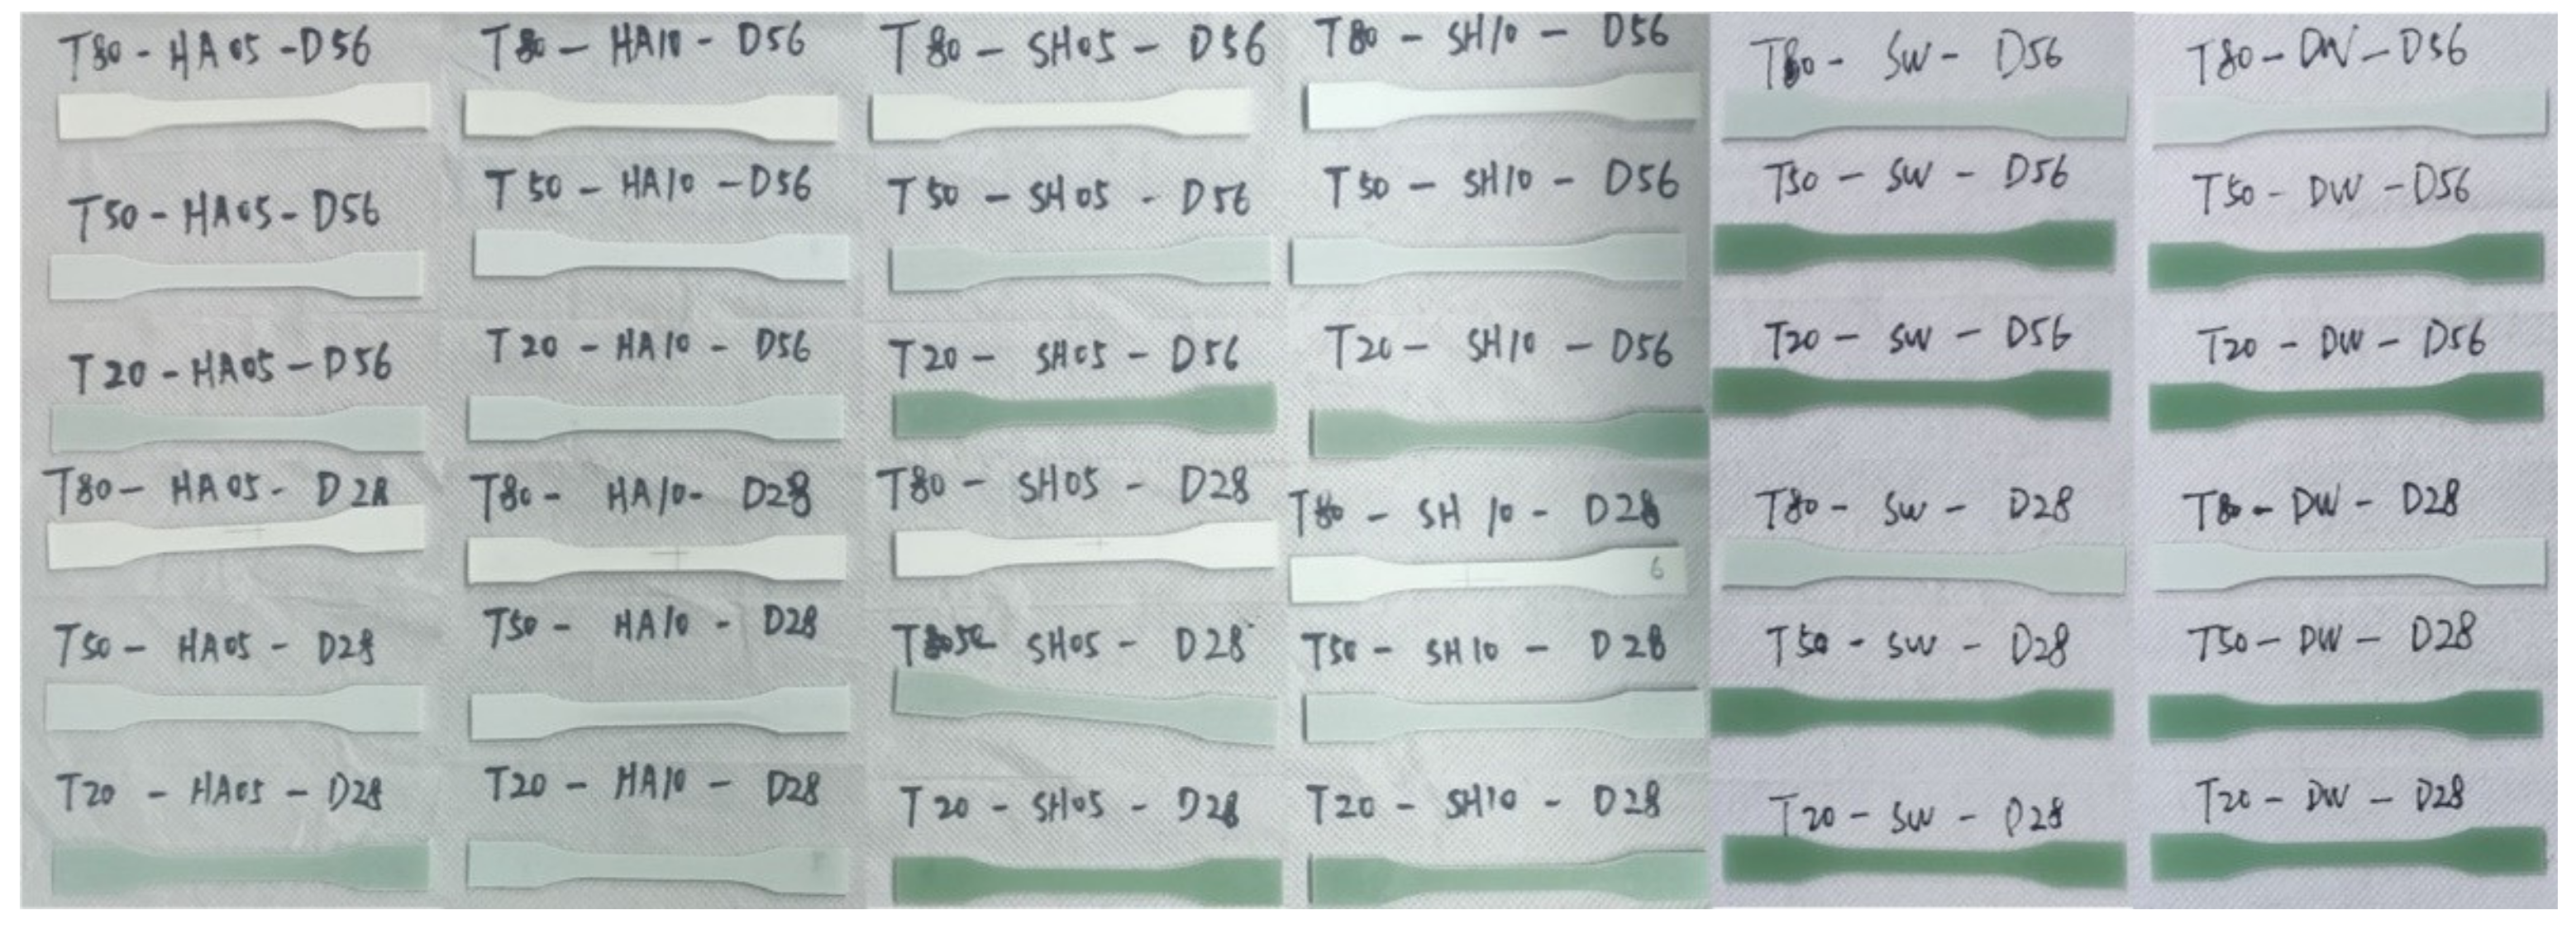
3.1. Appearance
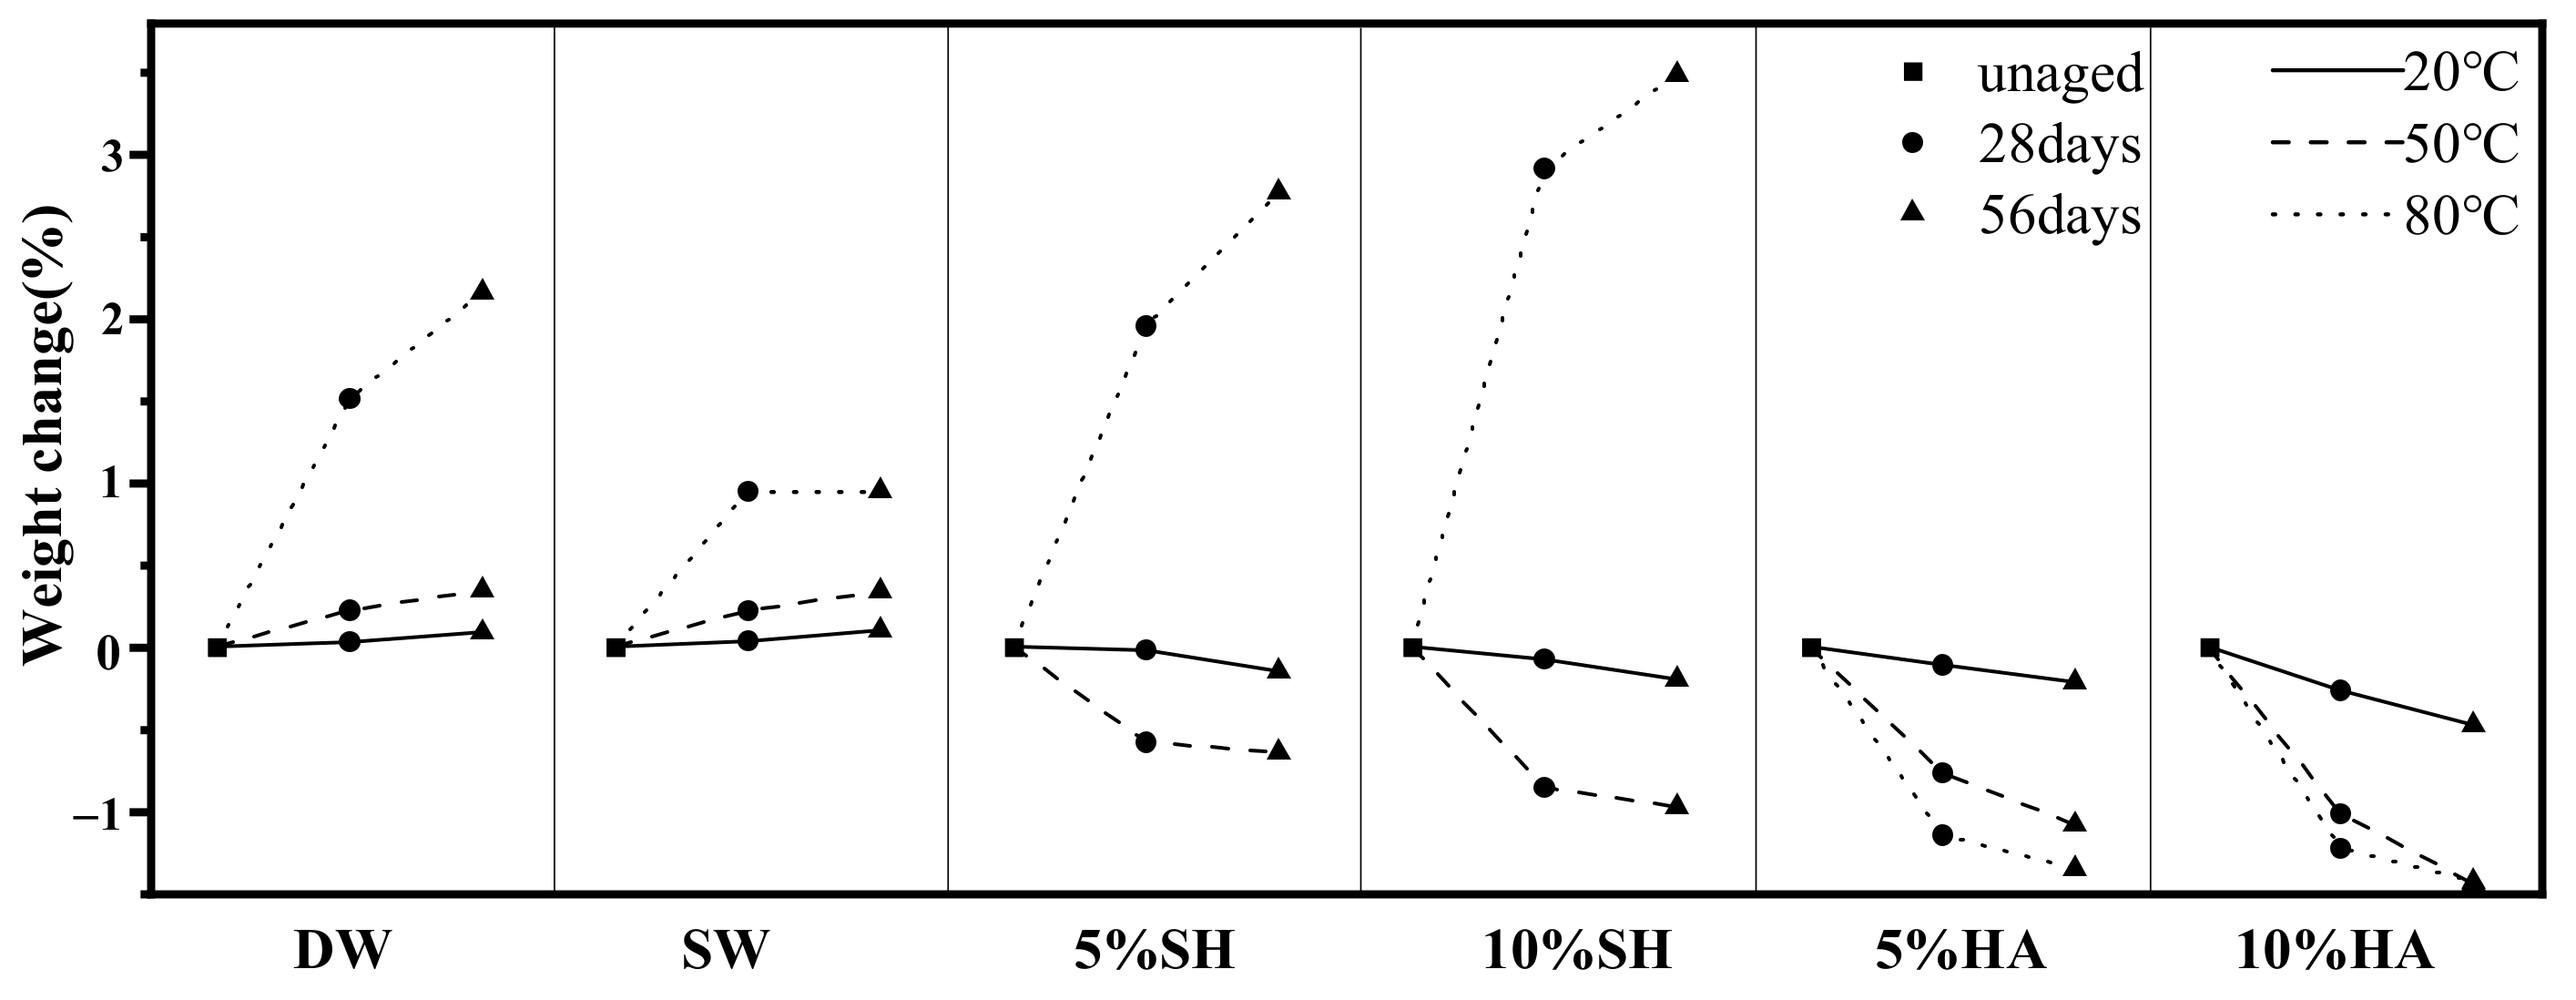
3.2. Mass Changes
3.3. Tensile Properties
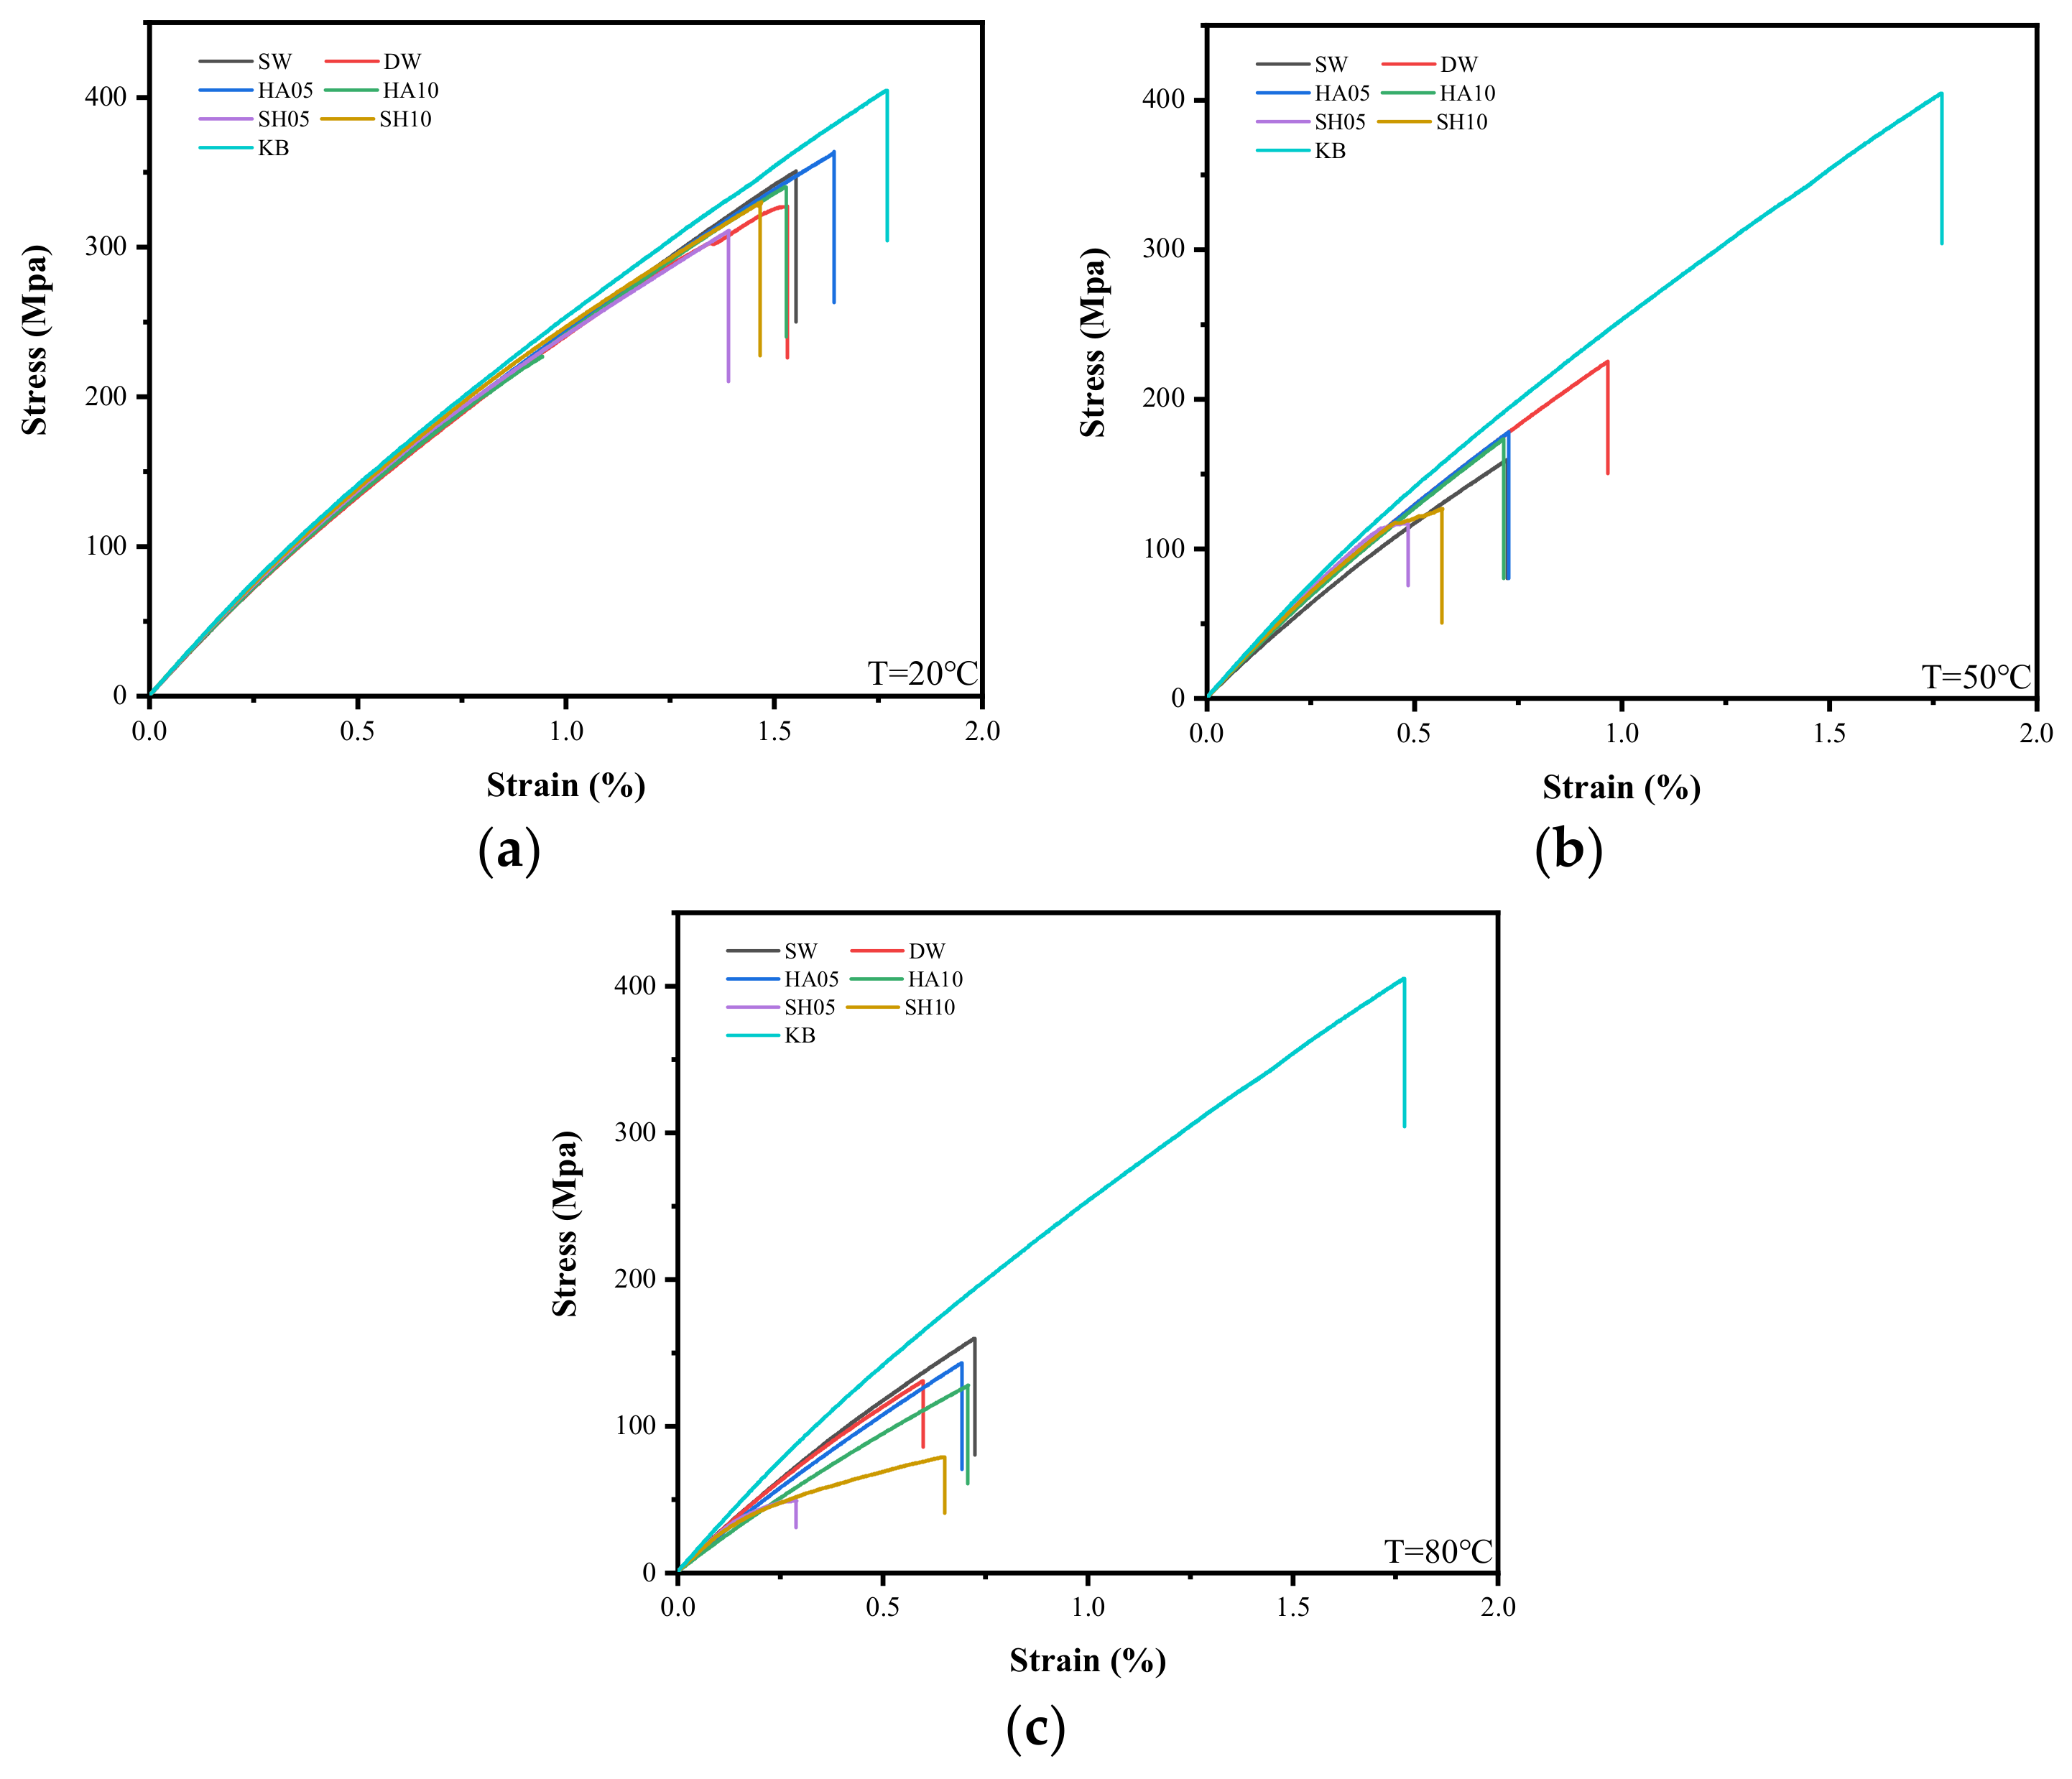
3.3.1. Stress-Strain Curves and Failure Modes
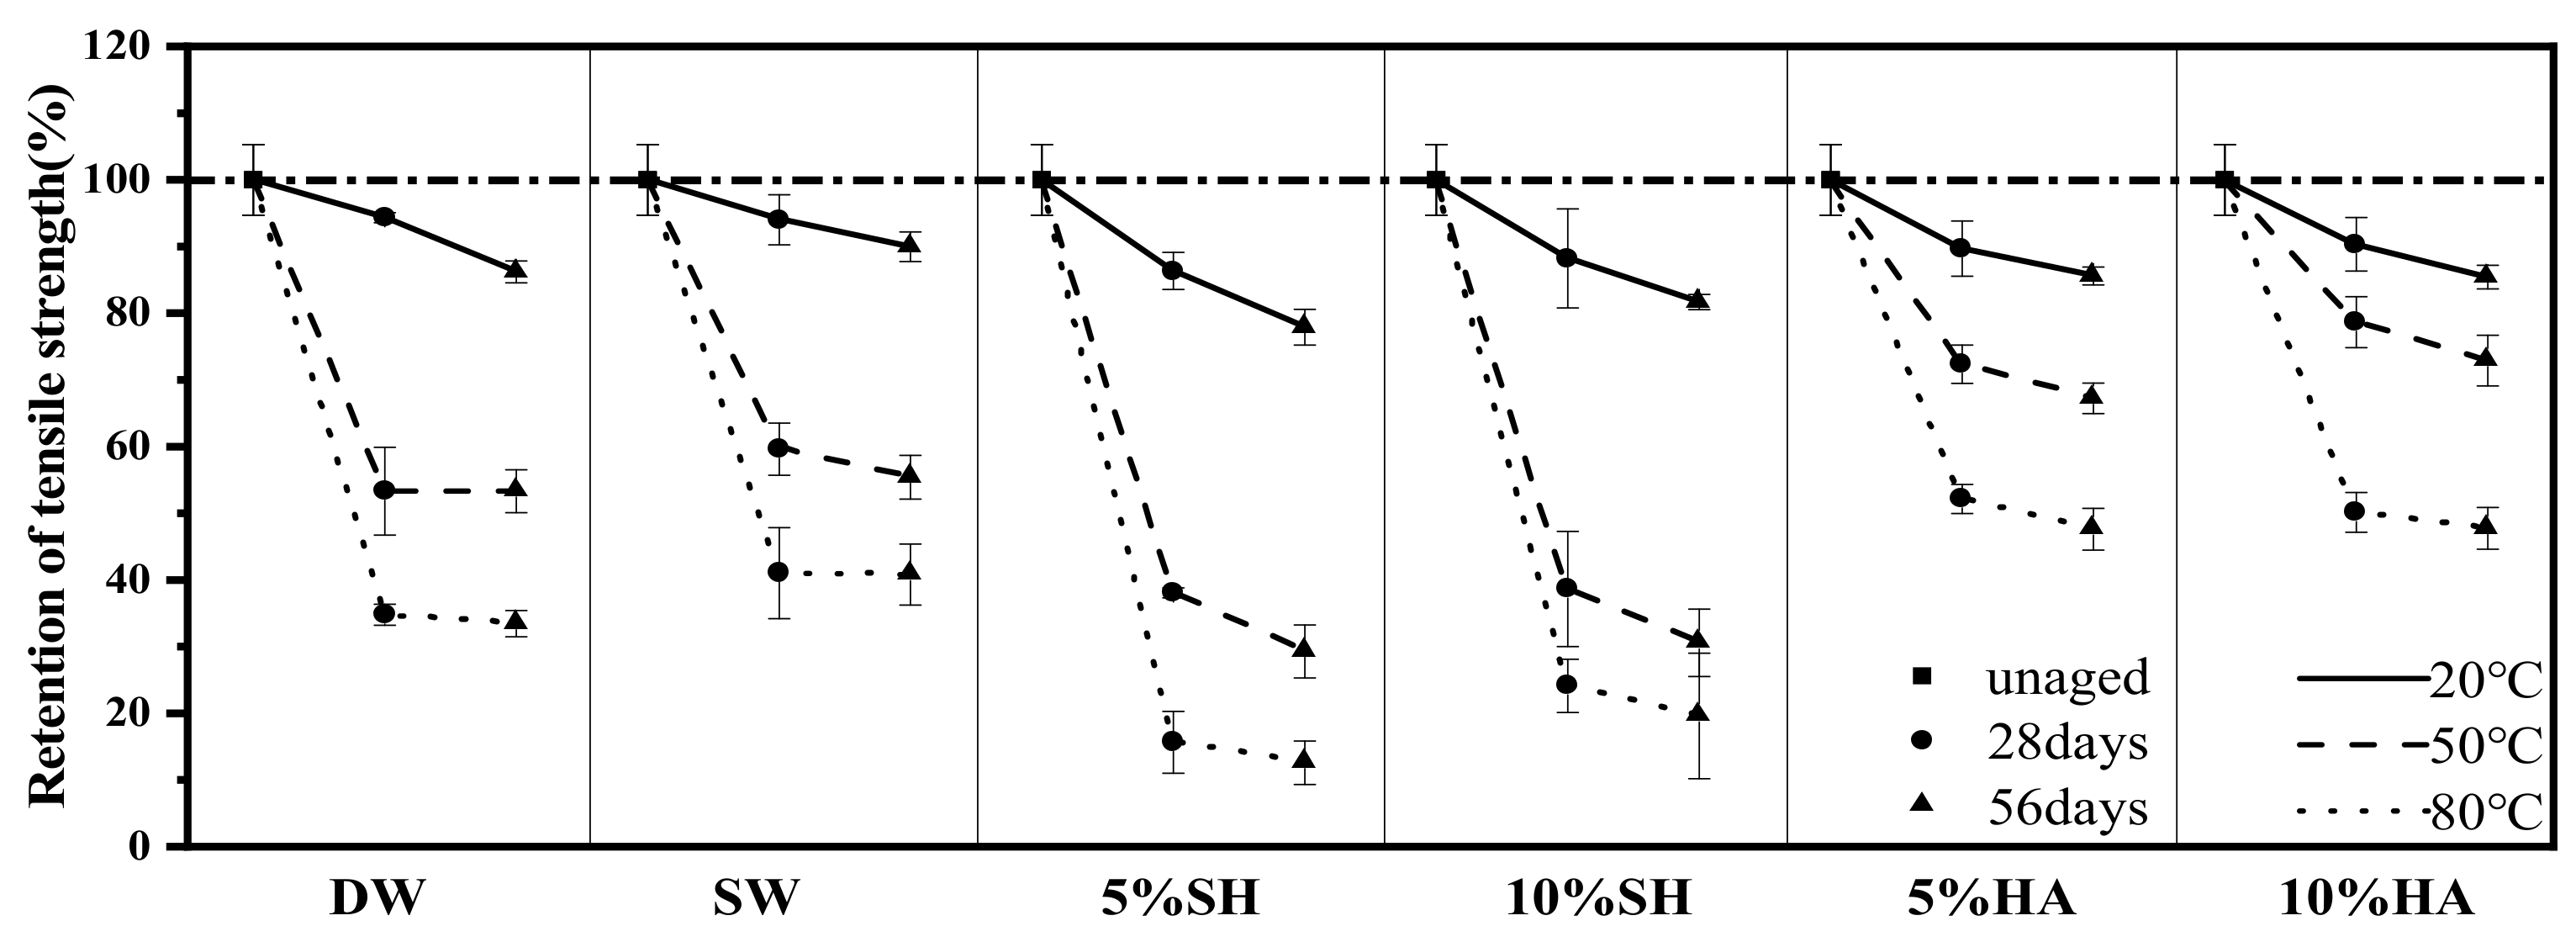
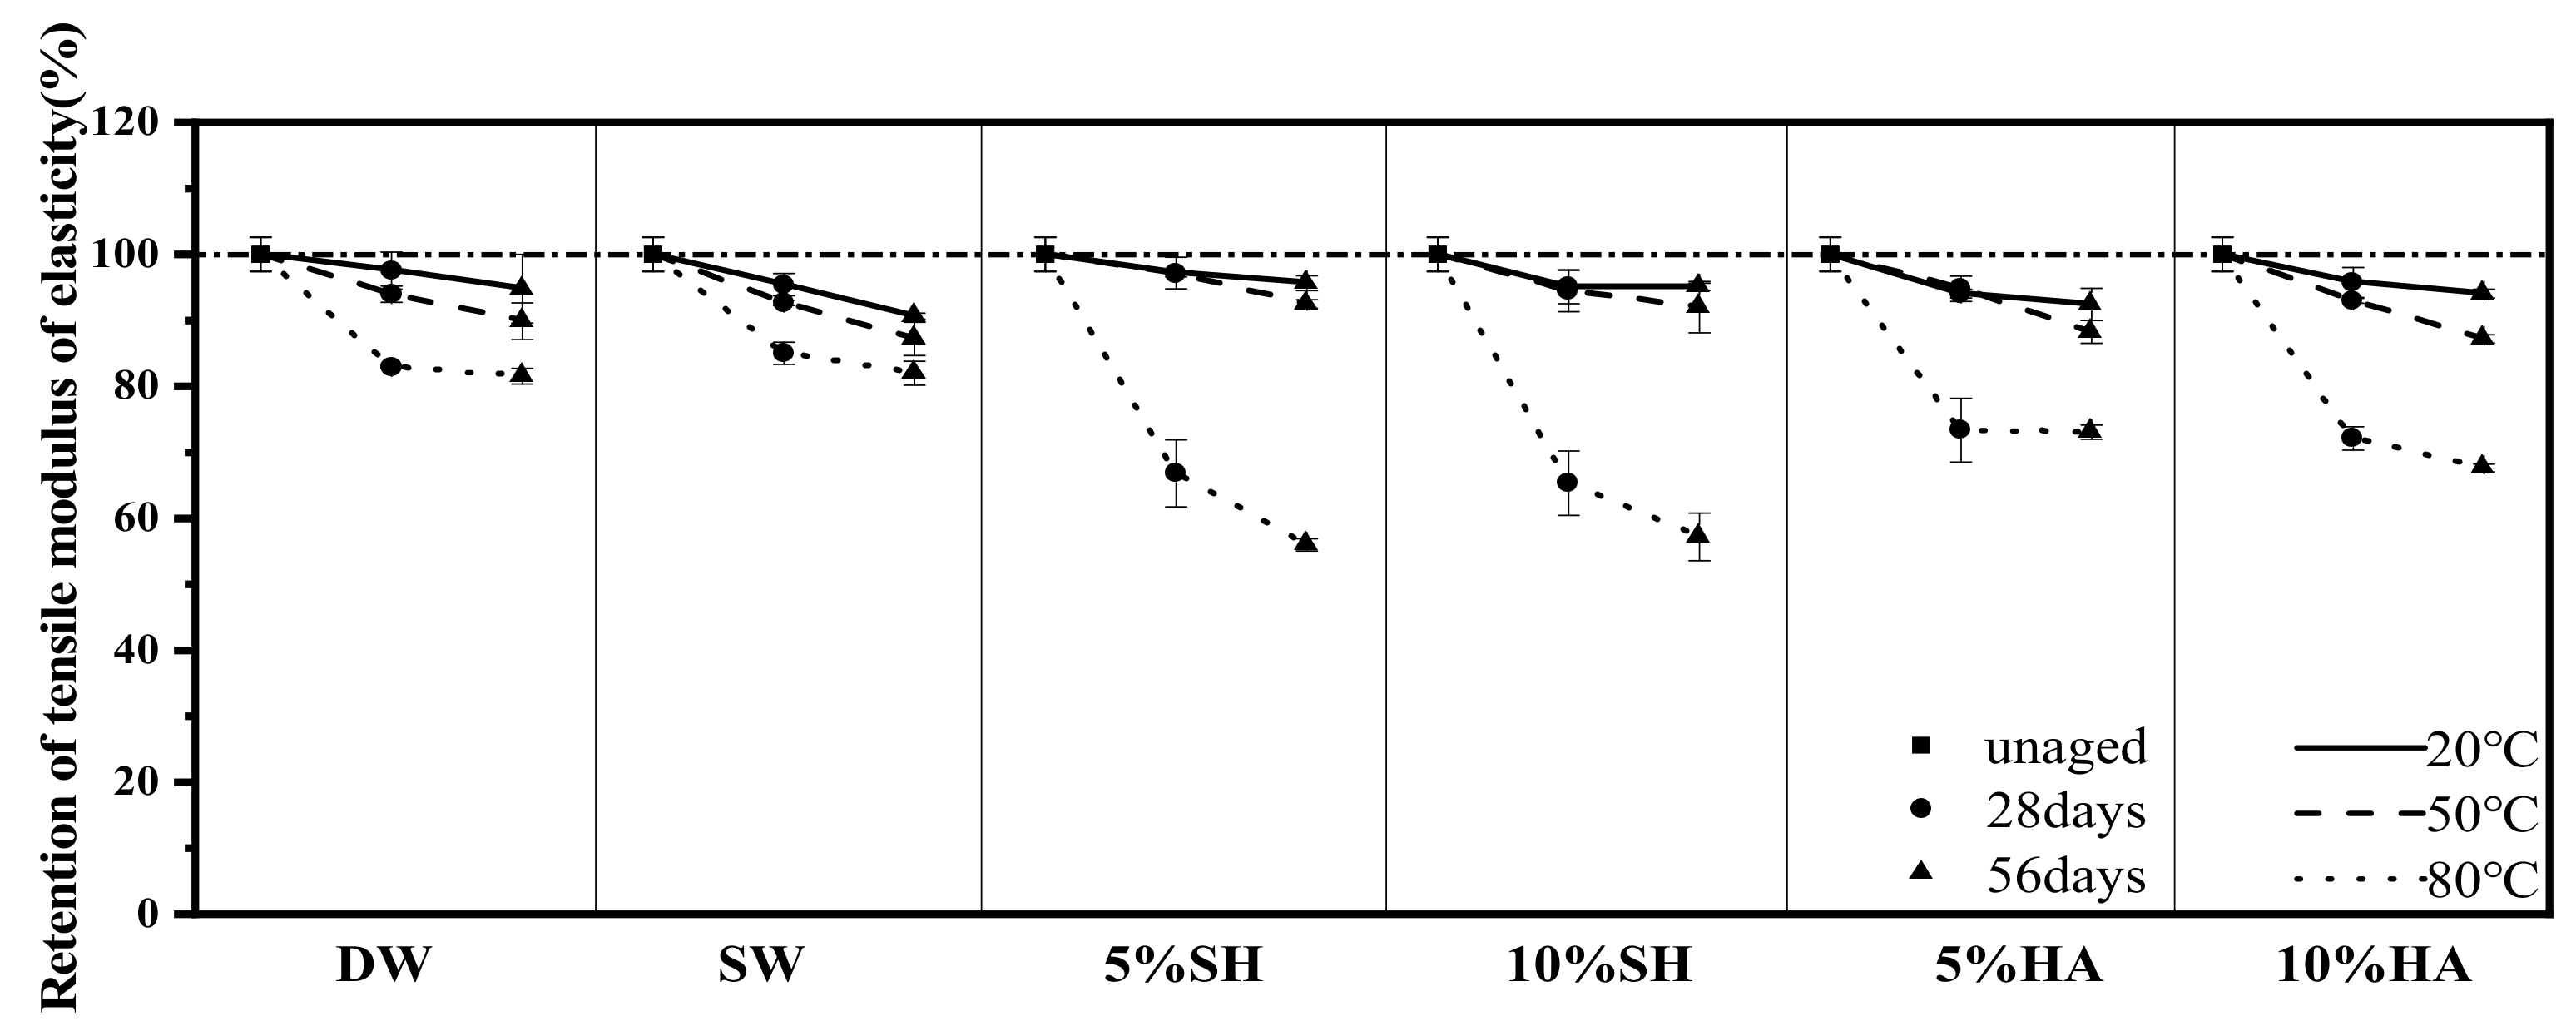
3.3.2. Tensile Strength and Modulus
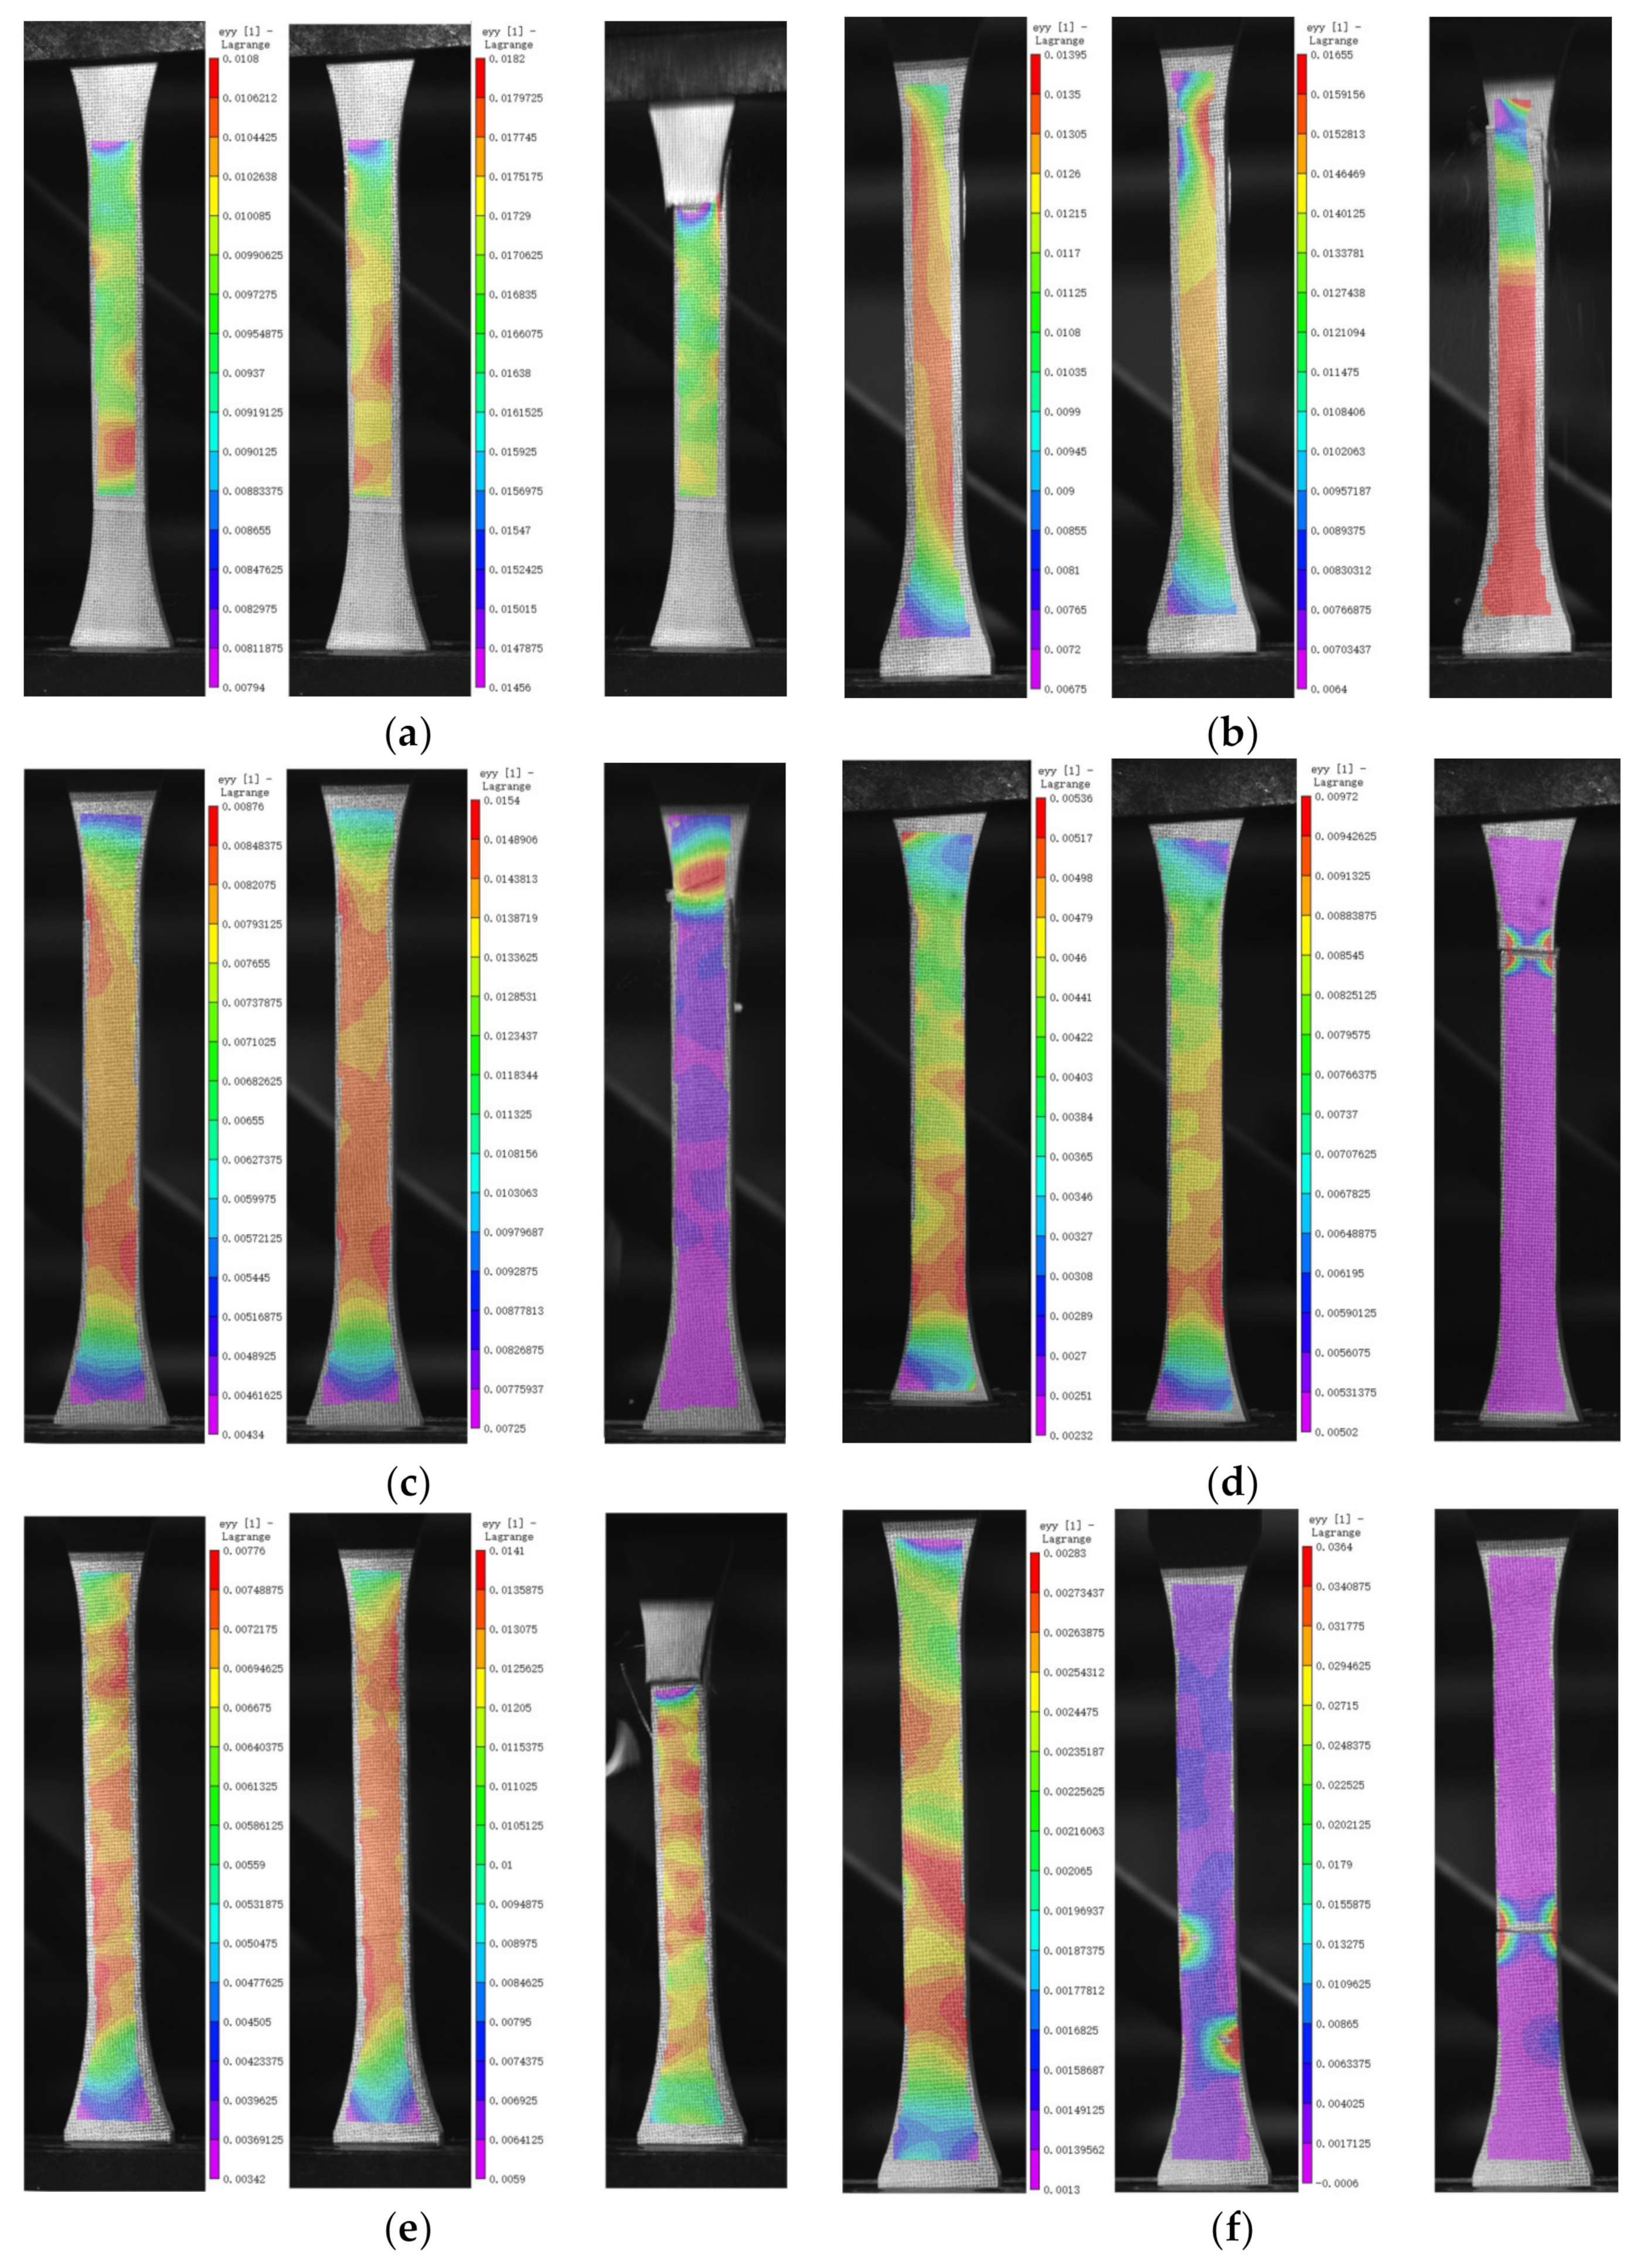
3.4. DIC Analysis
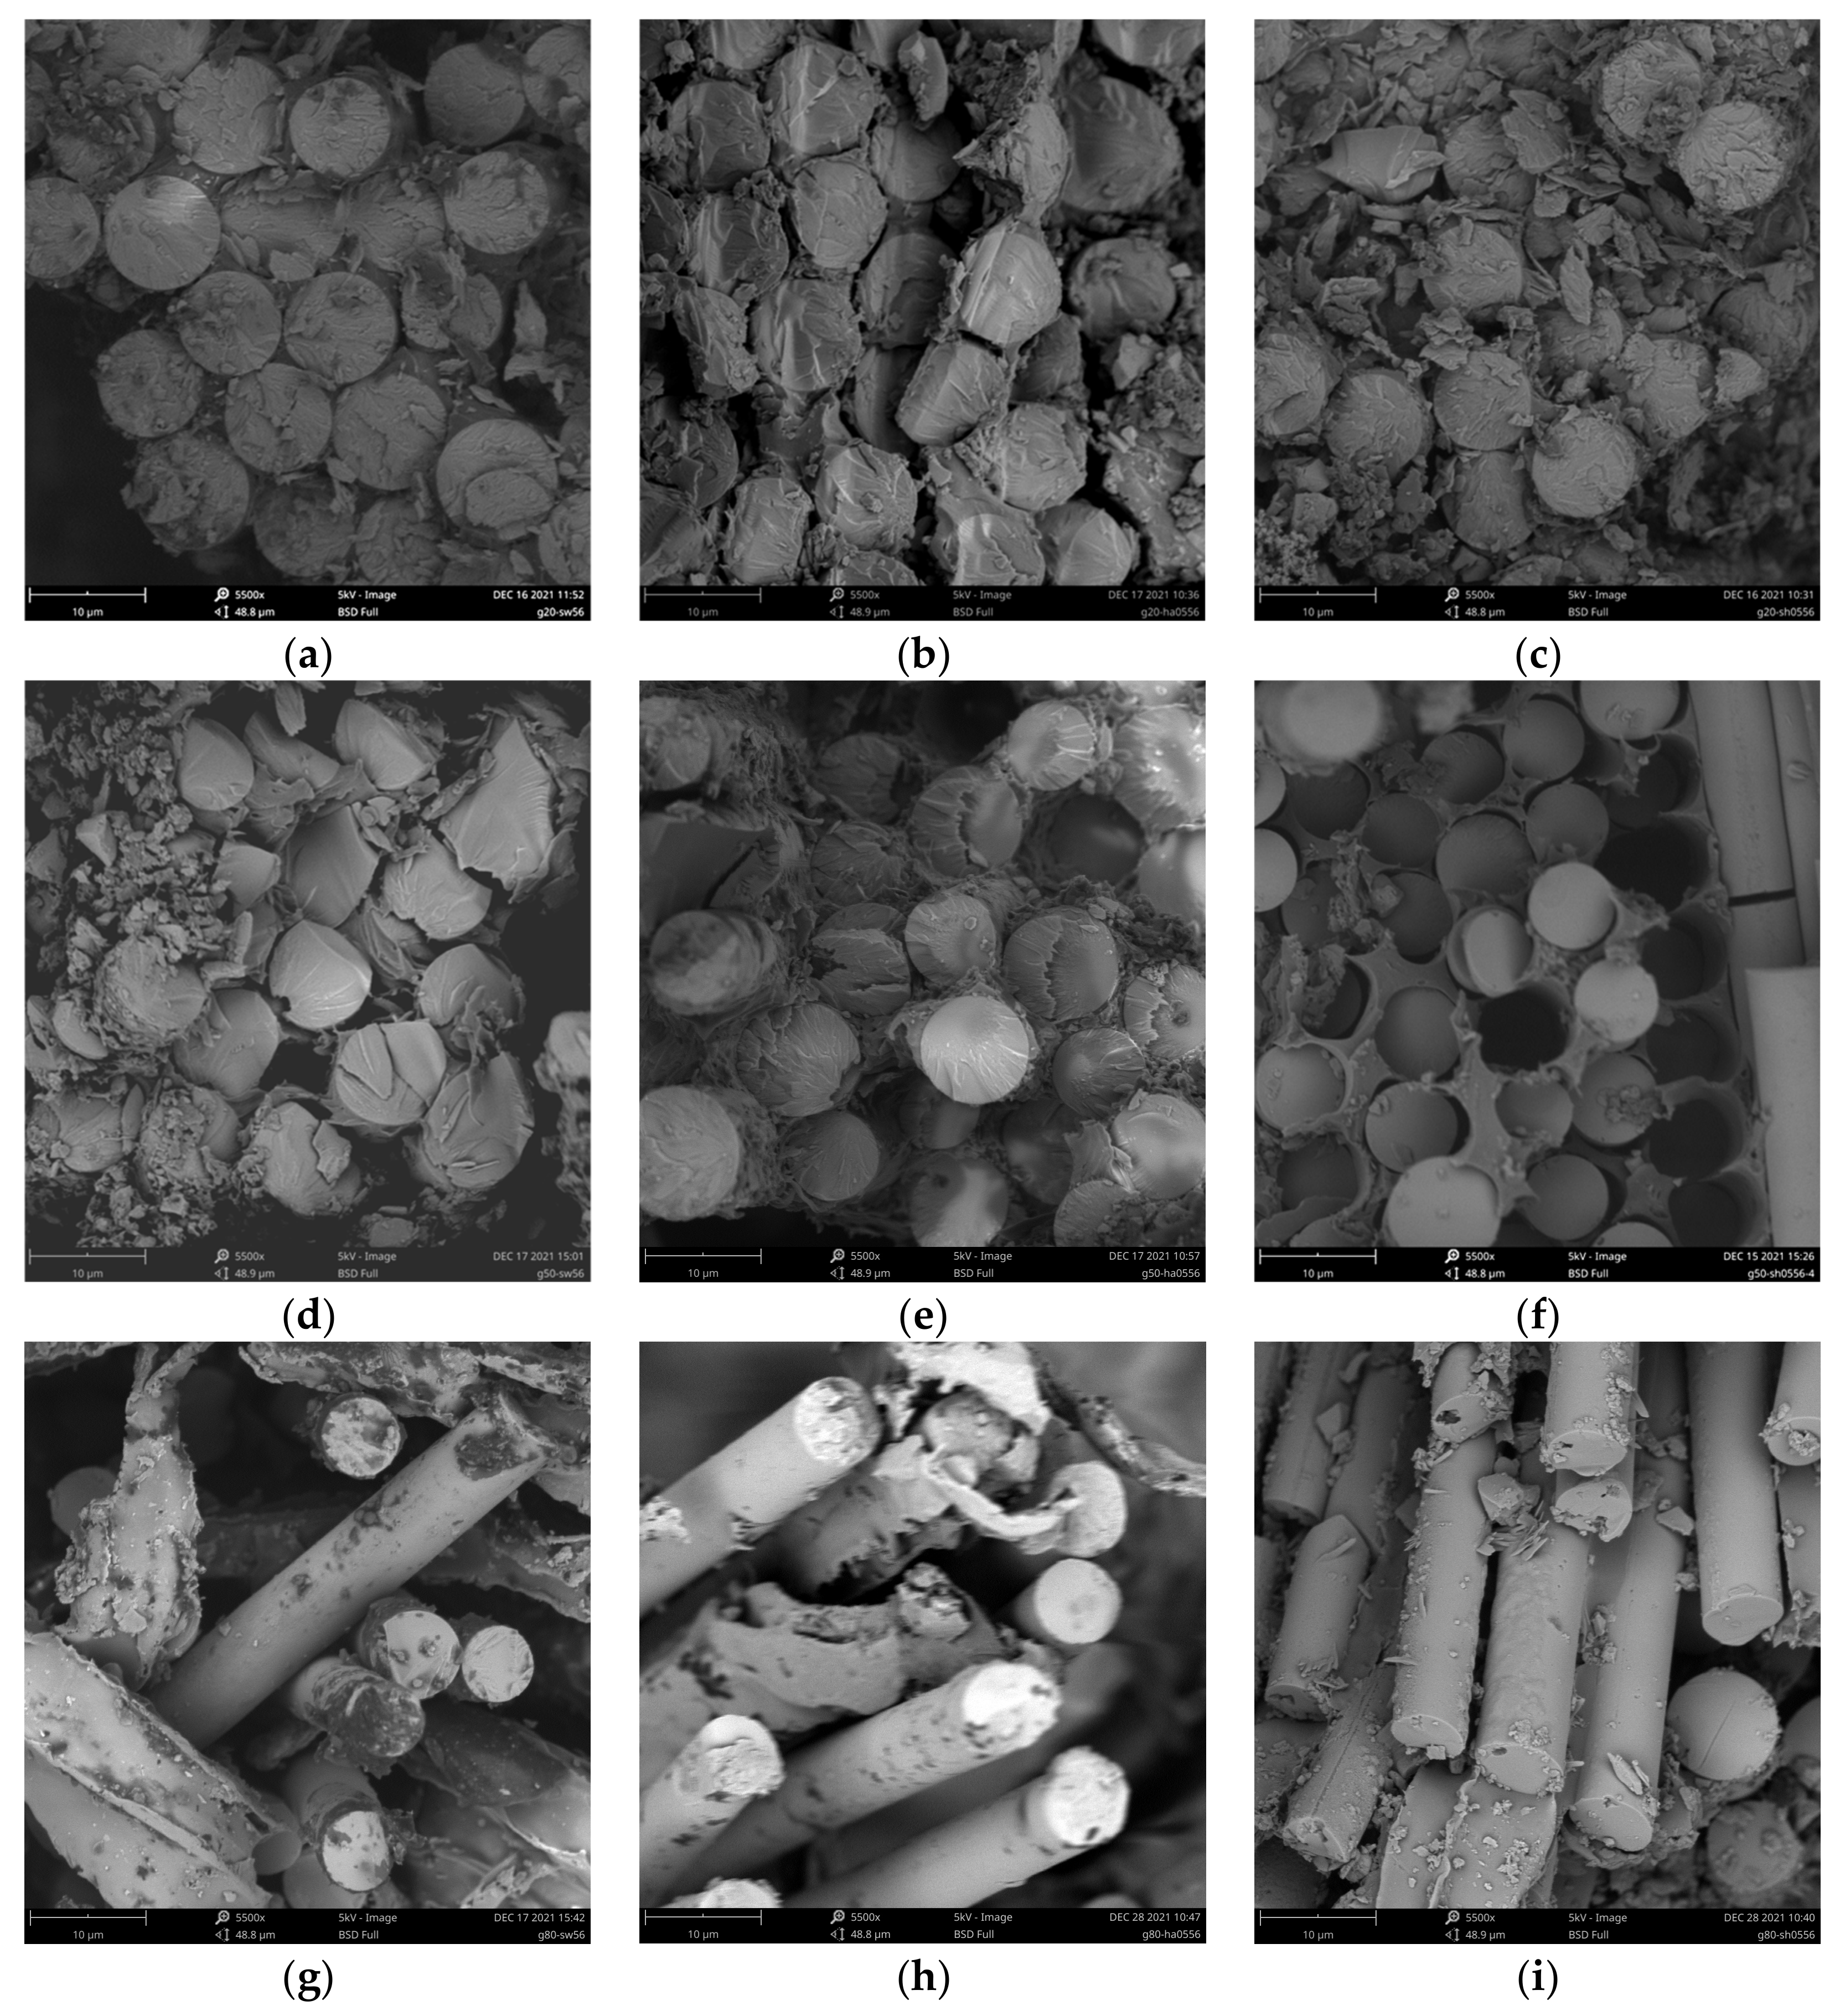
3.5. SEM Analysis
3.6. Prediction of the Long-Term Behavior and Service Life of GFRP Tensile Strength
4. Conclusions
Author Contributions
Funding
Institutional Review Board Statement
Informed Consent Statement
Data Availability Statement
Acknowledgments
Conflicts of Interest
References
- Rajak, D.K.; Pagar, D.D.; Menezes, P.L.; Linul, E. Fiber-Reinforced Polymer Composites: Manufacturing, Properties, and Applications. Polymers 2019, 11, 1667. [Google Scholar] [CrossRef] [PubMed] [Green Version]
- Hollaway, L.C. Polymer composites in construction: A brief history. Proc. Inst. Civ. Eng. Eng. Comput. Mech. 2009, 162, 107–118. [Google Scholar] [CrossRef]
- Lu, C.; Yang, Y.; He, L. Mechanical and durability properties of GFRP bars exposed to aggressive solution environments. Sci. Eng. Compos. Mater. 2021, 28, 11–23. [Google Scholar] [CrossRef]
- Wang, M.; Xu, X.; Ji, J.; Yang, Y.; Shen, J.; Ye, M. The hygrothermal aging process and mechanism of the novolac epoxy resin. Compos. Part B Eng. 2016, 107, 1–8. [Google Scholar] [CrossRef]
- Liao, K.; Schultheisz, C.R.; Hunston, D.L. Effects of environmental aging on the properties of pultruded GFRP. Compos. Part B Eng. 1999, 30, 485–493. [Google Scholar] [CrossRef]
- Nishizaki, I.; Meiarashi, S. Long-term deterioration of GFRP in water and moist environment. J. Compos. Constr. 2002, 6, 21–27. [Google Scholar] [CrossRef]
- Liu, T.; Liu, X.; Feng, P. A comprehensive review on mechanical properties of pultruded FRP composites subjected to long-term environmental effects. Compos. Part B Eng. 2020, 191, 107958. [Google Scholar] [CrossRef]
- Ameli, A.; Datla, N.V.; Papini, M.; Spelt, J.K. Hygrothermal Properties of Highly Toughened Epoxy Adhesives. J. Adhes. 2010, 86, 698–725. [Google Scholar] [CrossRef]
- Mubashar, A.; Ashcroft, I.A.; Critchlow, G.W.; Crocombe, A.D. Moisture absorption-desorption effects in adhesive joints. Int. J. Adhes. Adhes. 2009, 29, 751–760. [Google Scholar] [CrossRef] [Green Version]
- Shao, Y.; Kouadio, S. Durability of Fiberglass Composite Sheet Piles in Water. J. Compos. Constr. 2002, 6, 280–287. [Google Scholar] [CrossRef] [Green Version]
- Grammatikos, S.A.; Evernden, M.; Mitchels, J.; Zafari, B.; Mottram, J.T.; Papanicolaou, G.C. On the response to hygrothermal aging of pultruded FRPs used in the civil engineering sector. Mater. Des. 2016, 96, 283–295. [Google Scholar] [CrossRef] [Green Version]
- Xin, H.; Liu, Y.; Mosallam, A.; Zhang, Y. Moisture diffusion and hygrothermal aging of pultruded glass fiber reinforced polymer laminates in bridge application. Compos. Part B Eng. 2016, 100, 197–207. [Google Scholar] [CrossRef]
- Sousa, J.M.; Correia, J.R.; Cabral-Fonseca, S. Durability of an epoxy adhesive used in civil structural applications. Constr. Build. Mater. 2018, 161, 618–633. [Google Scholar] [CrossRef]
- Sousa, J.M.; Correia, J.R.; Gonilha, J.; Cabral-Fonseca, S.; Firmo, J.P.; Keller, T. Durability of adhesively bonded joints between pultruded GFRP adherends under hygrothermal and natural ageing. Compos. Part B Eng. 2019, 158, 475–488. [Google Scholar] [CrossRef]
- Cabral-Fonseca, S.; Correia, J.R.; Rodrigues, M.P.; Branco, F.A. Artificial Accelerated Ageing of GFRP Pultruded Profiles Made of Polyester and Vinylester Resins: Characterisation of Physical-Chemical and Mechanical Damage. Strain 2012, 48, 162–173. [Google Scholar] [CrossRef] [Green Version]
- Xin, H.; Liu, Y.; Mosallam, A.; Zhang, Y.; Wang, C. Hygrothermal aging effects on flexural behavior of pultruded glass fiber reinforced polymer laminates in bridge applications. Constr. Build. Mater. 2016, 127, 237–247. [Google Scholar] [CrossRef]
- Karbhari, V.M.; Zhang, S. E-glass/vinylester composites in aqueous environments-I: Experimental results. Appl. Compos. Mater. 2003, 10, 19–48. [Google Scholar] [CrossRef]
- Feng, P.; Wang, J.; Wang, Y.; Loughery, D.; Niu, D. Effects of corrosive environments on properties of pultruded GFRP plates. Compos. Part B Eng. 2014, 67, 427–433. [Google Scholar] [CrossRef]
- Hota, G.; Barker, W.; Manalo, A. Degradation mechanism of glass fiber/vinylester-based composite materials under accelerated and natural aging. Constr. Build. Mater. 2020, 256, 119462. [Google Scholar] [CrossRef]
- Kanerva, M.; Jokinen, J.; Sarlin, E.; Pärnänen, T.; Lindgren, M.; Järventausta, M.; Vuorinen, J. Lower stiffness of GFRP after sulfuric acid-solution aging is due to degradation of fibre-matrix interfaces? Compos. Struct. 2019, 212, 524–534. [Google Scholar] [CrossRef]
- Bazli, M.; Ashrafi, H.; Oskouei, A.V. Effect of harsh environments on mechanical properties of GFRP pultruded profiles. Compos. Part B Eng. 2016, 99, 203–215. [Google Scholar] [CrossRef]
- Xue, W.; Li, Y.; Fu, K.; Hu, X.; Li, Y. Accelerated ageing test and durability prediction model for mechanical properties of GFRP connectors in precast concrete sandwich panels. Constr. Build. Mater. 2020, 237, 117632. [Google Scholar] [CrossRef]
- Pan, B.; Qian, K.; Xie, H.; Asundi, A. Two-dimensional digital image correlation for in-plane displacement and strain measurement: A review. Meas. Sci. Technol. 2009, 20, 062001. [Google Scholar] [CrossRef]
- Fergani, H.; Di Benedetti, M.; Miàs Oller, C.; Lynsdale, C.; Guadagnini, M. Durability and degradation mechanisms of GFRP reinforcement subjected to severe environments and sustained stress. Constr. Build. Mater. 2018, 170, 637–648. [Google Scholar] [CrossRef]
- Sousa, J.M.; Garrido, M.; Correia, J.R.; Cabral-Fonseca, S. Hygrothermal ageing of pultruded GFRP profiles: Comparative study of unsaturated polyester and vinyl ester resin matrices. Compos. Part A Appl. Sci. Manuf. 2021, 140, 106193. [Google Scholar] [CrossRef]
- Soykok, I.F.; Sayman, O.; Pasinli, A. Effects of hot water aging on failure behavior of mechanically fastened glass fiber/epoxy composite joints. Compos. Part B Eng. 2013, 54, 59–70. [Google Scholar] [CrossRef]
- Correia, J.R.; Cabral-Fonseca, S.; Branco, F.A.; Ferreira, J.G.; Eusébio, M.I.; Rodrigues, M.P. Durability of pultruded glass-fiber-reinforced polyester profiles for structural applications. Mech. Compos. Mater. 2006, 42, 325–338. [Google Scholar] [CrossRef]
- Xin, H.; Liu, Y.; Mosallam, A.S.; He, J.; Du, A. Evaluation on material behaviors of pultruded glass fiber reinforced polymer (GFRP) laminates. Compos. Struct. 2017, 182, 283–300. [Google Scholar] [CrossRef] [Green Version]
- Huang, G.; Sun, H. Effect of water absorption on the mechanical properties of glass/polyester composites. Mater. Des. 2007, 28, 1647–1650. [Google Scholar] [CrossRef]
- Chen, Y.; Davalos, J.F.; Ray, I.; Kim, H.Y. Accelerated aging tests for evaluations of durability performance of FRP reinforcing bars for concrete structures. Compos. Struct. 2007, 78, 101–111. [Google Scholar] [CrossRef]
- Stamenović, M.; Putić, S.; Rakin, M.; Medjo, B.; Čikara, D. Effect of alkaline and acidic solutions on the tensile properties of glass-polyester pipes. Mater. Des. 2011, 32, 2456–2461. [Google Scholar] [CrossRef]
- Amaro, A.M.; Reis, P.N.B.; Neto, M.A.; Louro, C. Effects of alkaline and acid solutions on glass/epoxy composites. Polym. Degrad. Stabil. 2013, 98, 853–862. [Google Scholar] [CrossRef]
- D’Antino, T.; Pisani, M.A.; Poggi, C. Effect of the environment on the performance of GFRP reinforcing bars. Compos. Part B Eng. 2018, 141, 123–136. [Google Scholar] [CrossRef]
- Wu, G.; Dong, Z.Q.; Wang, X.; Zhu, Y.; Wu, Z.S. Prediction of Long-Term Performance and Durability of BFRP Bars under the Combined Effect of Sustained Load and Corrosive Solutions. J. Compos. Constr. 2015, 19, 04014058. [Google Scholar] [CrossRef]
- Bank, L.C.; Gentry, T.R.; Thompson, B.P.; Russell, J.S. A model specification for FRP composites for civil engineering structures. Constr. Build. Mater. 2003, 17, 405–437. [Google Scholar] [CrossRef]
- Naya, S.; Meneses, A.; Tarrio-Saavedra, J.; Artiaga, R.; Lopez-Beceiro, J.; Gracia-Fernandez, C. New method for estimating shift factors in time-temperature superposition models. J. Therm. Anal. Calorim. 2013, 113, 453–460. [Google Scholar] [CrossRef]


| Groups | Conditioning Environment | Immersion Medium | TEMP (°C) | Age (d) |
|---|---|---|---|---|
| 1 | DW-20 | Deionized water | 20 | 28, 56 |
| 2 | DW-50 | 50 | ||
| 3 | DW-80 | 80 | ||
| 4 | SW-20 | Sea water | 20 | 28, 56 |
| 5 | SW-50 | 50 | ||
| 6 | SW-80 | 80 | ||
| 7 | 05HA-20 | 5% HCl solution | 20 | 28, 56 |
| 8 | 05HA-50 | 50 | ||
| 9 | 05HA-80 | 80 | ||
| 10 | 10HA-20 | 10% HCl solution | 20 | 28, 56 |
| 11 | 10HA-50 | 50 | ||
| 12 | 10HA-80 | 80 | ||
| 13 | 05SH-20 | 5% NaOH solution | 20 | 28, 56 |
| 14 | 05SH-50 | 50 | ||
| 15 | 05SH-80 | 80 | ||
| 16 | 10SH-20 | 10% NaOH solution | 20 | 28, 56 |
| 17 | 10SH-50 | 50 | ||
| 18 | 10SH-80 | 80 |
| Conditioning | Tensile Strength | Modulus of Elasticity | ||||||
|---|---|---|---|---|---|---|---|---|
| Exp. | T | Age | Avg | COV | Retention | Avg | COV | Retention |
| (°C) | (Week) | (MPa) | (%) | (%) | (GPa) | (%) | (%) | |
| REF | 20 | - | 407.9 | 5.3 | 100 | 30.6 | 0.0 | 100 |
| DW | 20 | 4 | 384.8 | 0.8 | 94 | 29.9 | 2.8 | 98 |
| 8 | 351.6 | 1.6 | 86 | 29.1 | 5.2 | 95 | ||
| 50 | 4 | 223.4 | 6.6 | 55 | 28.8 | 1.2 | 94 | |
| 8 | 217.5 | 3.2 | 53 | 27.6 | 2.8 | 90 | ||
| 80 | 4 | 141.8 | 1.6 | 35 | 25.5 | 0.2 | 83 | |
| 8 | 136.4 | 2.0 | 33 | 25.0 | 1.2 | 82 | ||
| SW | 20 | 4 | 383.4 | 3.8 | 94 | 29.3 | 1.7 | 96 |
| 8 | 367.0 | 2.2 | 90 | 27.8 | 0.4 | 91 | ||
| 50 | 4 | 243.2 | 3.9 | 60 | 28.5 | 0.4 | 93 | |
| 8 | 226.0 | 3.3 | 55 | 26.8 | 2.5 | 88 | ||
| 80 | 4 | 167.4 | 6.8 | 41 | 26.1 | 1.7 | 85 | |
| 8 | 166.5 | 4.6 | 41 | 25.2 | 1.8 | 82 | ||
| 5% SH | 20 | 4 | 352.2 | 2.8 | 86 | 29.8 | 2.4 | 98 |
| 8 | 317.8 | 2.7 | 13 | 29.4 | 1.1 | 96 | ||
| 50 | 4 | 155.3 | 4.6 | 38 | 29.8 | 5.1 | 98 | |
| 8 | 119.4 | 3.3 | 29 | 28.4 | 0.9 | 93 | ||
| 80 | 4 | 63.8 | 8.6 | 16 | 20.5 | 3.1 | 67 | |
| 8 | 51.4 | 5.0 | 13 | 17.2 | 3.9 | 56 | ||
| 10% SH | 20 | 4 | 359.9 | 0.8 | 88 | 29.2 | 0.5 | 96 |
| 8 | 333.3 | 4.0 | 82 | 29.2 | 0.6 | 96 | ||
| 50 | 4 | 157.7 | 7.4 | 39 | 29.0 | 2.6 | 95 | |
| 8 | 124.7 | 1.1 | 31 | 28.3 | 0.5 | 92 | ||
| 80 | 4 | 98.4 | 4.0 | 24 | 20.1 | 4.9 | 66 | |
| 8 | 80.0 | 9.4 | 20 | 17.6 | 3.6 | 57 | ||
| 5% HA | 20 | 4 | 365.9 | 4.2 | 90 | 28.9 | 0.7 | 94 |
| 8 | 349.1 | 1.3 | 86 | 28.4 | 2.4 | 93 | ||
| 50 | 4 | 295.2 | 2.2 | 72 | 29.1 | 4.8 | 95 | |
| 8 | 274.3 | 3.1 | 67 | 27.1 | 1.1 | 89 | ||
| 80 | 4 | 212.7 | 3.8 | 52 | 22.5 | 0.4 | 74 | |
| 8 | 194.2 | 3.8 | 48 | 22.4 | 0.6 | 73 | ||
| 10% HA | 20 | 4 | 368.5 | 1.5 | 90 | 29.4 | 1.9 | 96 |
| 8 | 348.4 | 1.8 | 85 | 28.9 | 1.8 | 94 | ||
| 50 | 4 | 320.9 | 4.0 | 79 | 28.6 | 2.3 | 93 | |
| 8 | 297.4 | 1.8 | 73 | 26.8 | 0.7 | 88 | ||
| 80 | 4 | 204.5 | 3.0 | 50 | 22.1 | 1.8 | 72 | |
| 8 | 194.7 | 3.1 | 48 | 20.8 | 0.6 | 68 | ||
| Conditioning | TEMP (°C) | τ | Y∞ | Ea/R | TSF (Shenzhen-22.3 °C) |
|---|---|---|---|---|---|
| DW | 20 | 125.93 | 61.53 | 6054 | 0.85 |
| 50 | 8.13 | 53.26 | 6054 | 5.79 | |
| 80 | 7.18 | 33.42 | 6054 | 28.44 | |
| SW | 20 | 70.11 | 81.75 | 7222 | 0.83 |
| 50 | 12.41 | 54.89 | 7222 | 8.13 | |
| 80 | 4.96 | 40.81 | 7222 | 54.25 | |
| 5% NaOH | 20 | 58.05 | 64.30 | 5111 | 0.87 |
| 50 | 14.35 | 27.81 | 5111 | 4.41 | |
| 80 | 8.43 | 12.49 | 5111 | 16.89 | |
| 10% NaOH | 20 | 47.44 | 73.58 | 5015 | 0.88 |
| 50 | 13.82 | 29.33 | 5015 | 4.28 | |
| 80 | 9.92 | 19.33 | 5015 | 16.02 | |
| 5% HCl | 20 | 30.71 | 82.79 | 4226 | 0.89 |
| 50 | 16.61 | 66.06 | 4226 | 3.41 | |
| 80 | 11.88 | 47.14 | 4226 | 10.50 | |
| 10% HCl | 20 | 41.37 | 80.33 | 4665 | 0.88 |
| 50 | 21.39 | 70.76 | 4665 | 3.87 | |
| 80 | 9.23 | 47.61 | 4665 | 13.19 |
Publisher’s Note: MDPI stays neutral with regard to jurisdictional claims in published maps and institutional affiliations. |
© 2022 by the authors. Licensee MDPI, Basel, Switzerland. This article is an open access article distributed under the terms and conditions of the Creative Commons Attribution (CC BY) license (https://creativecommons.org/licenses/by/4.0/).
Share and Cite
Zhu, J.; Deng, Y.; Chen, P.; Wang, G.; Min, H.; Fang, W. Prediction of Long-Term Tensile Properties of Glass Fiber Reinforced Composites under Acid-Base and Salt Environments. Polymers 2022, 14, 3031. https://doi.org/10.3390/polym14153031
Zhu J, Deng Y, Chen P, Wang G, Min H, Fang W. Prediction of Long-Term Tensile Properties of Glass Fiber Reinforced Composites under Acid-Base and Salt Environments. Polymers. 2022; 14(15):3031. https://doi.org/10.3390/polym14153031
Chicago/Turabian StyleZhu, Jihua, Yangjian Deng, Piyu Chen, Gang Wang, Hongguang Min, and Wujun Fang. 2022. "Prediction of Long-Term Tensile Properties of Glass Fiber Reinforced Composites under Acid-Base and Salt Environments" Polymers 14, no. 15: 3031. https://doi.org/10.3390/polym14153031
APA StyleZhu, J., Deng, Y., Chen, P., Wang, G., Min, H., & Fang, W. (2022). Prediction of Long-Term Tensile Properties of Glass Fiber Reinforced Composites under Acid-Base and Salt Environments. Polymers, 14(15), 3031. https://doi.org/10.3390/polym14153031