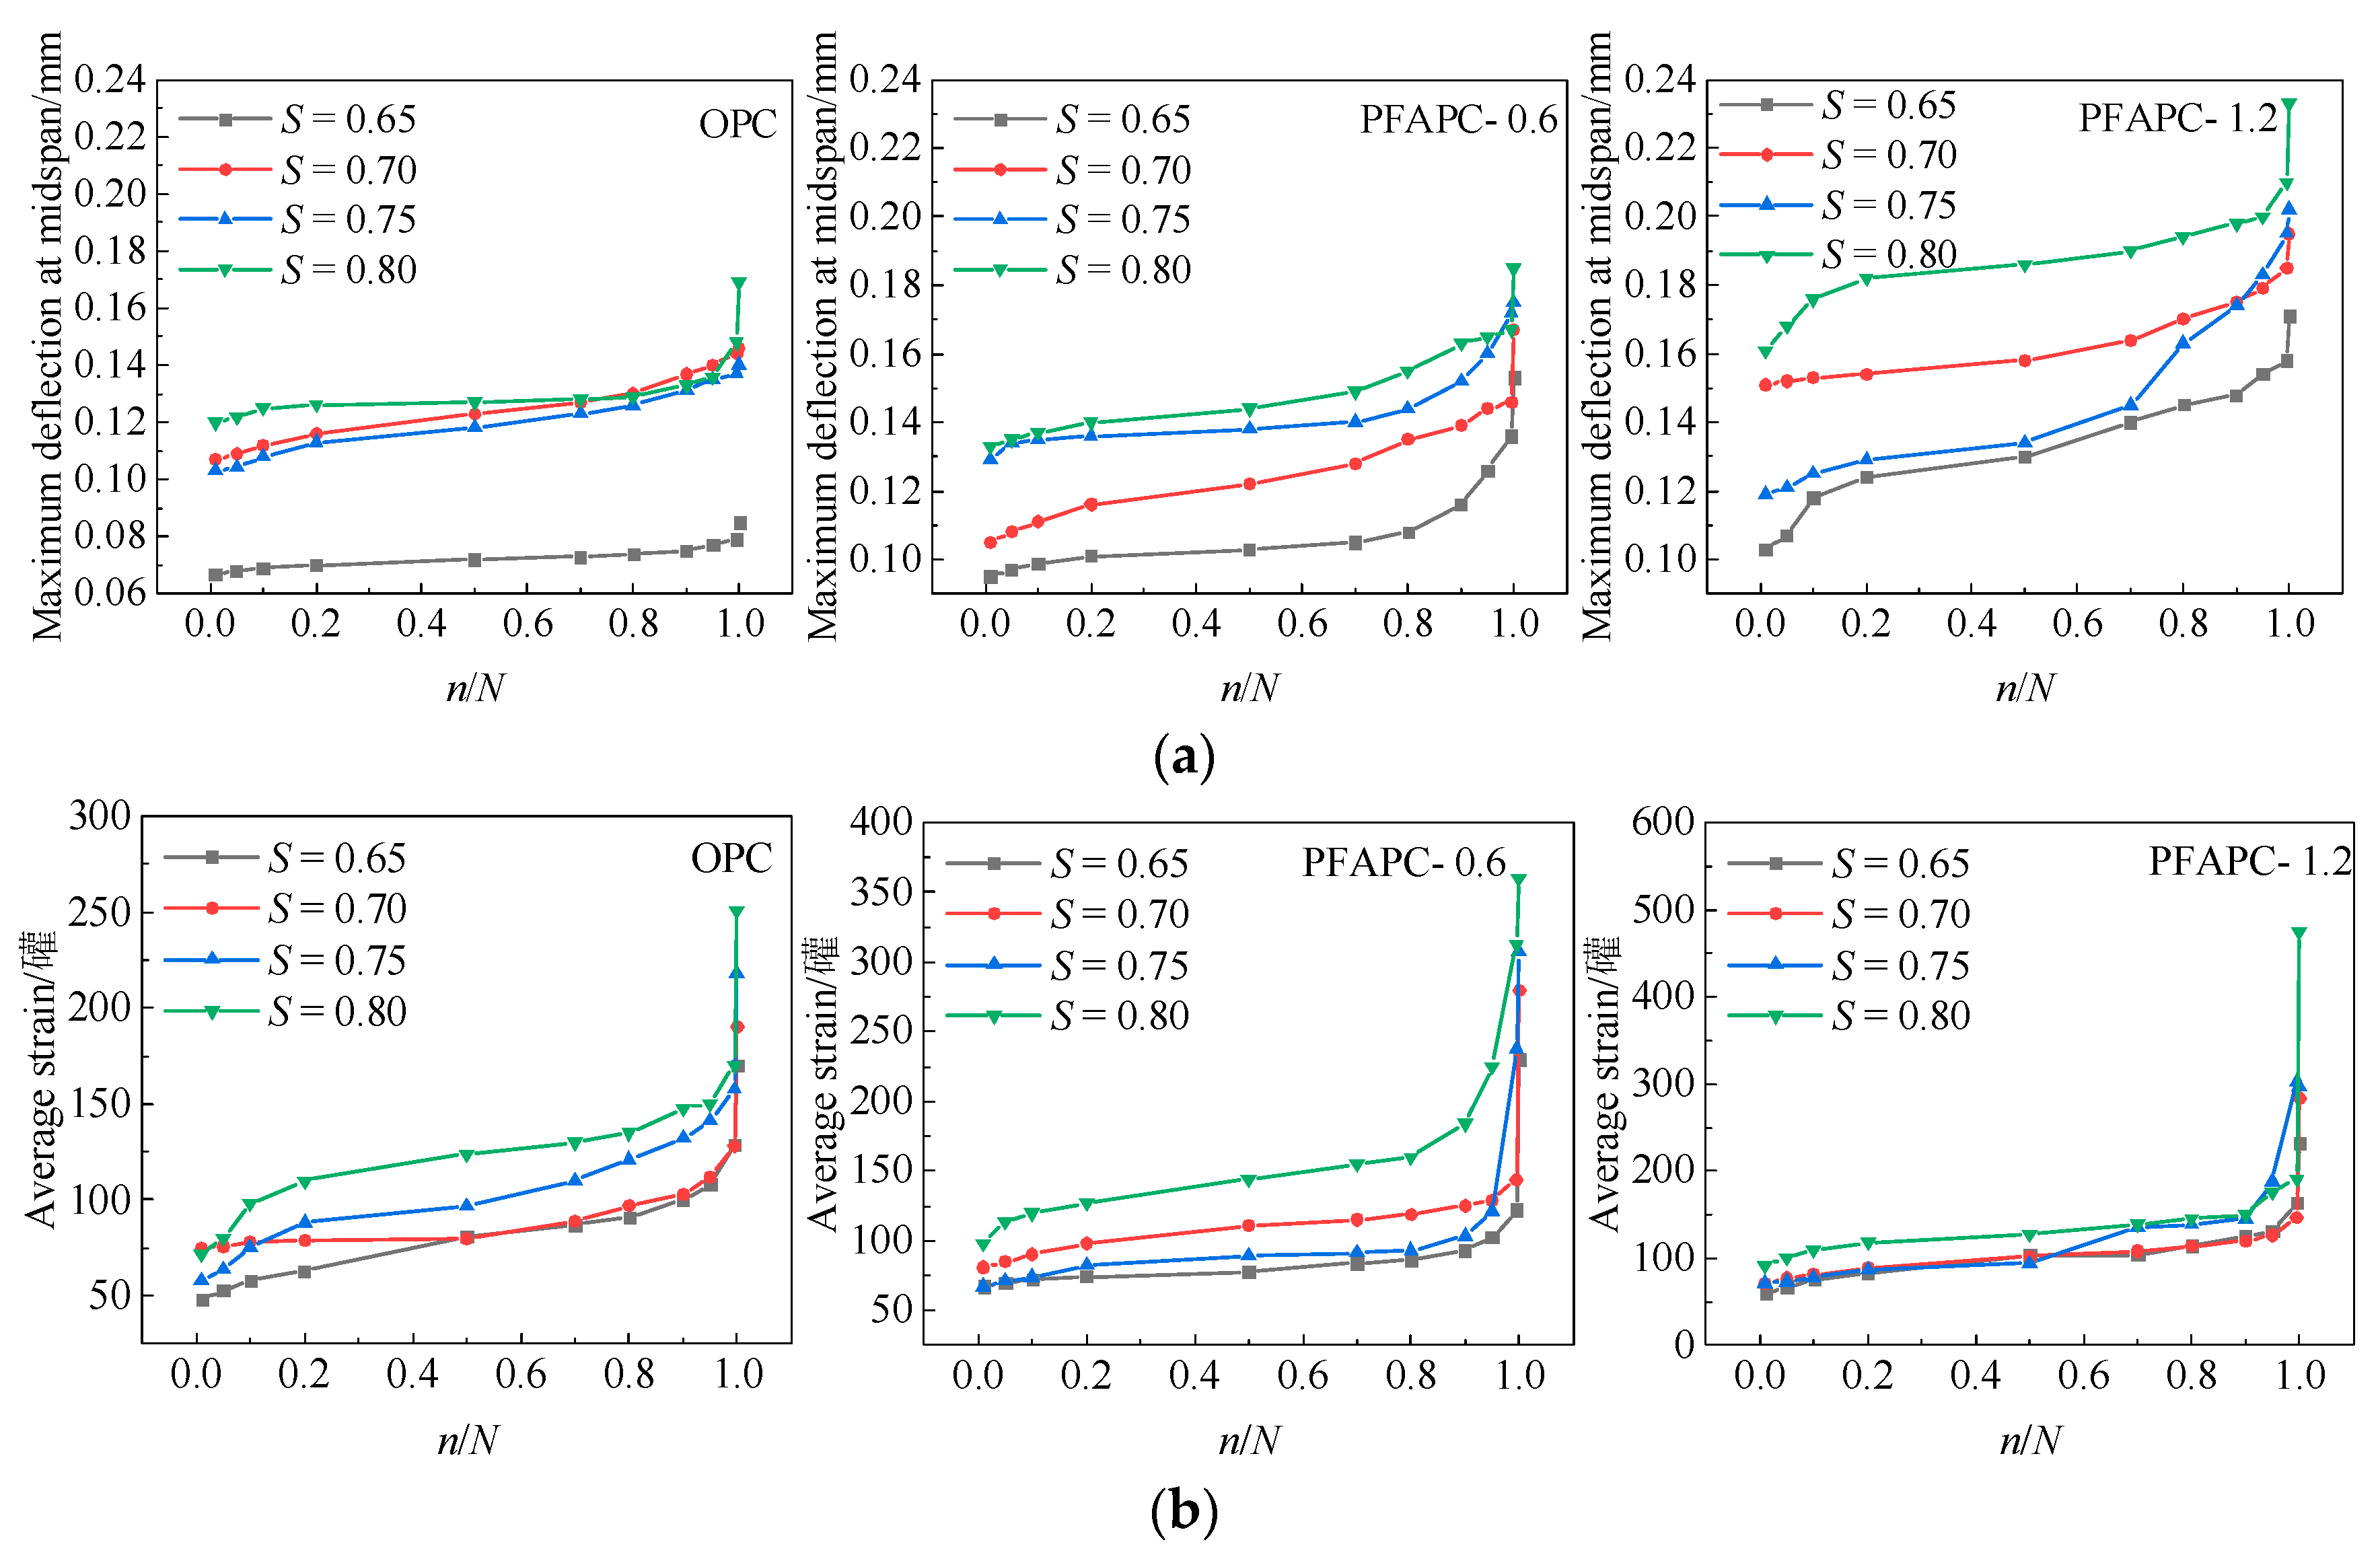
3.2. Flexural Fatigue Deformation
In this study, the average bottom tensile strain and maximum midspan deflection of specimens were employed to describe the fatigue deformation at various stress levels. In
Figure 4, the maximum midspan deflection and average tensile strain at the bottom are shown on the ordinate; the variation curves of specimen deformation were generated on the abscissa with the cyclic ratio
n/
N (the ratio of current cycle times to fatigue life) based on 11 data points. The maximum midspan deflection and average tensile strain at 1, 5, 10, 20, 50, 70, 80, 90, 95, 99.5 and 100% of specimen fatigue life at each stress level represent the 11 selected data points [
27].
The maximum midspan deflection and average tensile strain of OPC and PFAPC both increased as the cycle ratio increased, and their deformation characteristics were broadly categorized into three stages [
4,
5,
27,
28]: development, stable, and failure stages, as shown in
Figure 4. The interior microcracks of the material started to increase under fatigue stress during the development stage (often before a 20% cyclic ratio). The maximum midspan deflection and average tensile strain rapidly increased with increasing cycle ratio, as a result of the cracks in the weak region of the matrix. Fewer fissures were present at this point, and the material began to suffer interior damage. The maximum midspan deflection and average tensile strain gradually and consistently increased, and new fractures started to emerge in the material during the stable period (generally at a cycle ratio between 20% and 80%). The damage to the material expanded at a stable rate. In the failure stage (mainly at a cycle ratio greater than 80%), sharp increases were observed in specimen instability, internal damage across the maximum deflection, and the average tensile strain. The stress level and the average tensile strain specimen failure (when the average tensile strain was 100%) increased with increasing POM fiber content, increasing average maximum deflection, and increasing failure in specimen cross tensile strain. In this phase, the main crack matrix was internal, but due to the influence of POM fiber bridge cracks, the front of the specimen could absorb more destructive energy, delaying specimen destruction. According to Liu et al. [
5], the main crack width matrix is responsible for the stage of accelerated fatigue deformation. PFAPC is tougher under fatigue load than OPC. At the 0.80 stress level, the maximum midspan deflection and average tensile strain of the 0.6% PFAPC group increased by 9.5% and 43.4%, respectively; those of the 1.2% PFAPC group increased by 37.9% and 89.2%, respectively. Under the 0.65 stress level the maximum midspan deflection and average tensile strain of the 0.6% dosage group increased by 80% and 35.3%, respectively, whereas those of the 1.2% dosage group increased by 101.2% and 36.5%, respectively. The average tensile strain growth rate of OPC and PFAPC accelerated as the stress level increased, particularly in the failure stage, as shown in
Figure 4b. Additionally, as evidenced by fatigue deformation test findings for the majority of fiber-reinforced concrete materials [
4,
5,
27], differing stress levels have no appreciable impact on the fatigue deformation of specimens within a group.
3.3. Fatigue Life Probability Distribution
Weibull distribution was used for assessing the distribution of the fatigue life of concrete materials [
29]. The two-parameter Weibull distribution equation can be condensed into Equation (1) [
30,
31]:
because
,
,
. Then, Equation (1) can be written as:
where
b is the Weibull shape parameter (slope parameter),
p is the reliability,
N is the fatigue life, and
Na is the characteristic life parameter. As Equation (2) is a linear equation, each Weibull parameter can be directly determined from the fitting line. Two-parameter Weibull distribution of experimental data is considered valid if regression analysis demonstrates a strong linear relationship between
Y and
X.
Table 5 displays the fatigue life for each stress level, where the data for fatigue life (
n) from each stress level are organized from small to large, starting with serial number
i. Equation (3) can be used to compute the reliability
p related to the fatigue life
N:
The averaged fatigue life values from
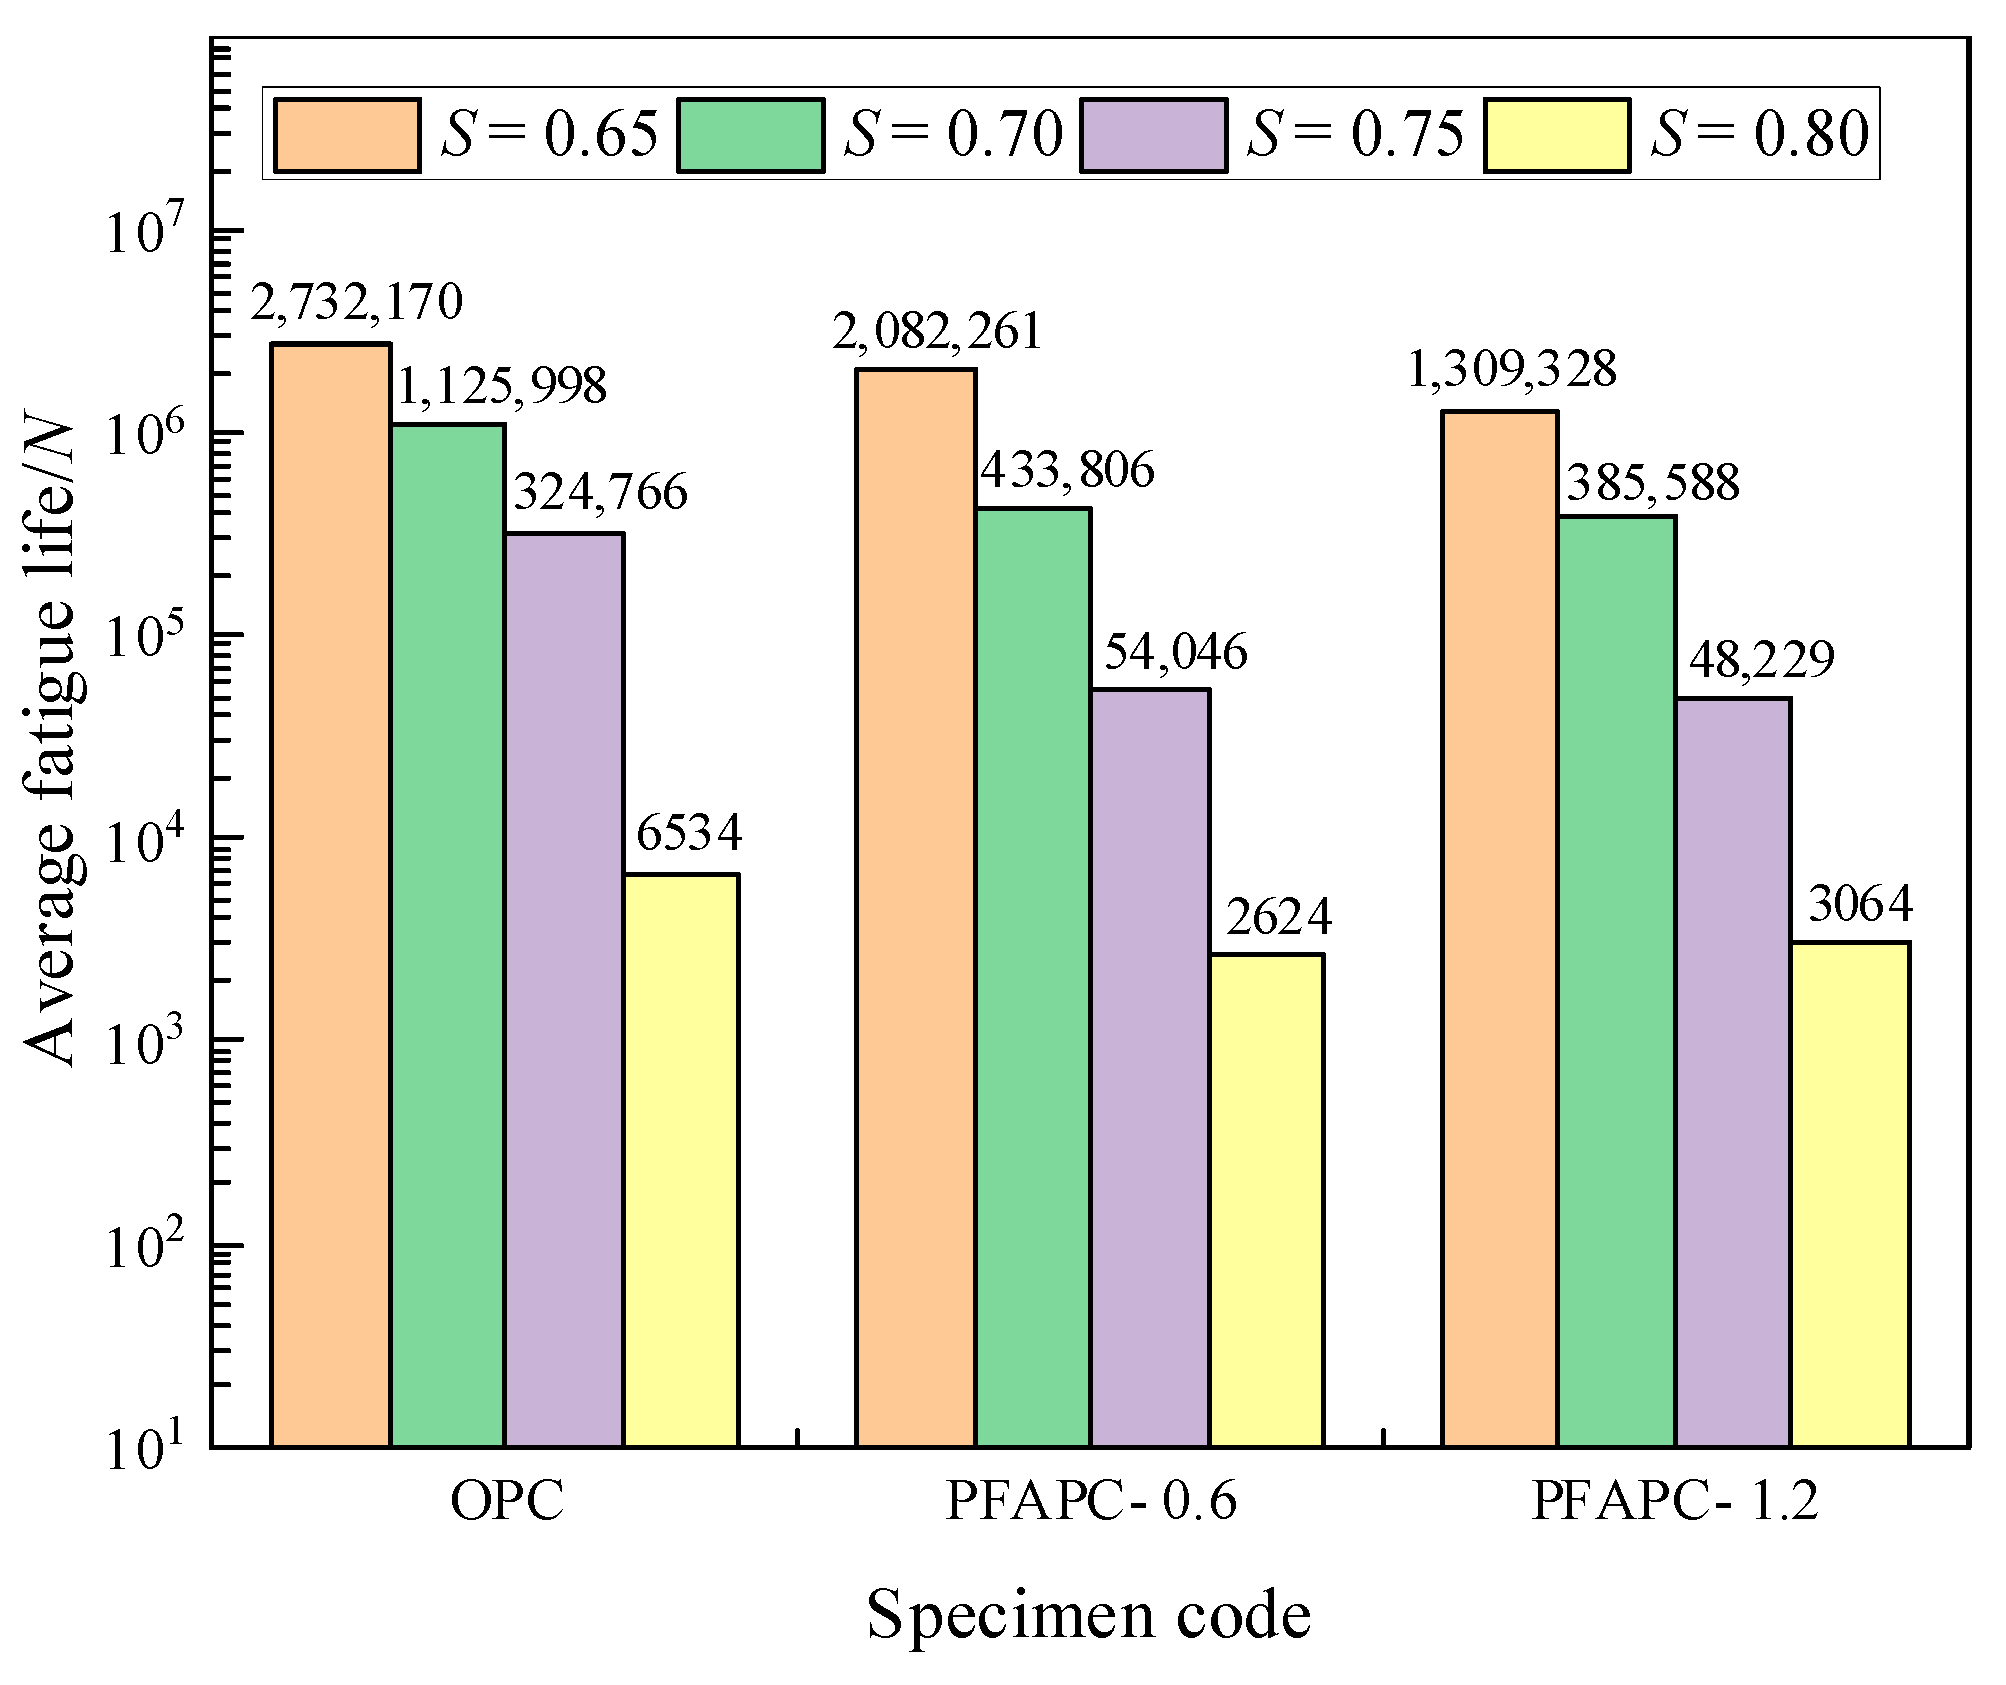
Table 5 are depicted as a histogram in
Figure 5.
Figure 5 shows that when the stress level was 0.65, the fatigue life of concrete with POM fibers at 0.6 and 1.2% volume reduced by 23.8 and 52.1%, respectively; when the stress level was 0.70, the fatigue life reduced by 61.5 and 65.8%, respectively; when the stress level was 0.75, the fatigue life reduced by 83.4 and 85.1%, respectively; and when the stress level was 0.80, the fatigue life reduced by 59.8 and 53.1%, respectively. The concrete fatigue life of airport pavement considerably decreased after POM fiber was introduced. The fatigue life of the 1.2% dosage group was shorter than that of the 0.6% dosage group, except at a stress level of 0.80. Contrary to the findings of most fiber concrete fatigue tests, POM fiber did not extend the fatigue life of airport pavement concrete: the inclusion of POM fiber substantially reduced the fatigue life. No authoritative research findings have yet been published on the fatigue performance of POM fiber concrete. Both types of POM fibers generally hadshorter fatigue lives than regular concrete. POM fibers did not increase the fatigue life of airport pavement concrete according to the parameter values used in this investigation.
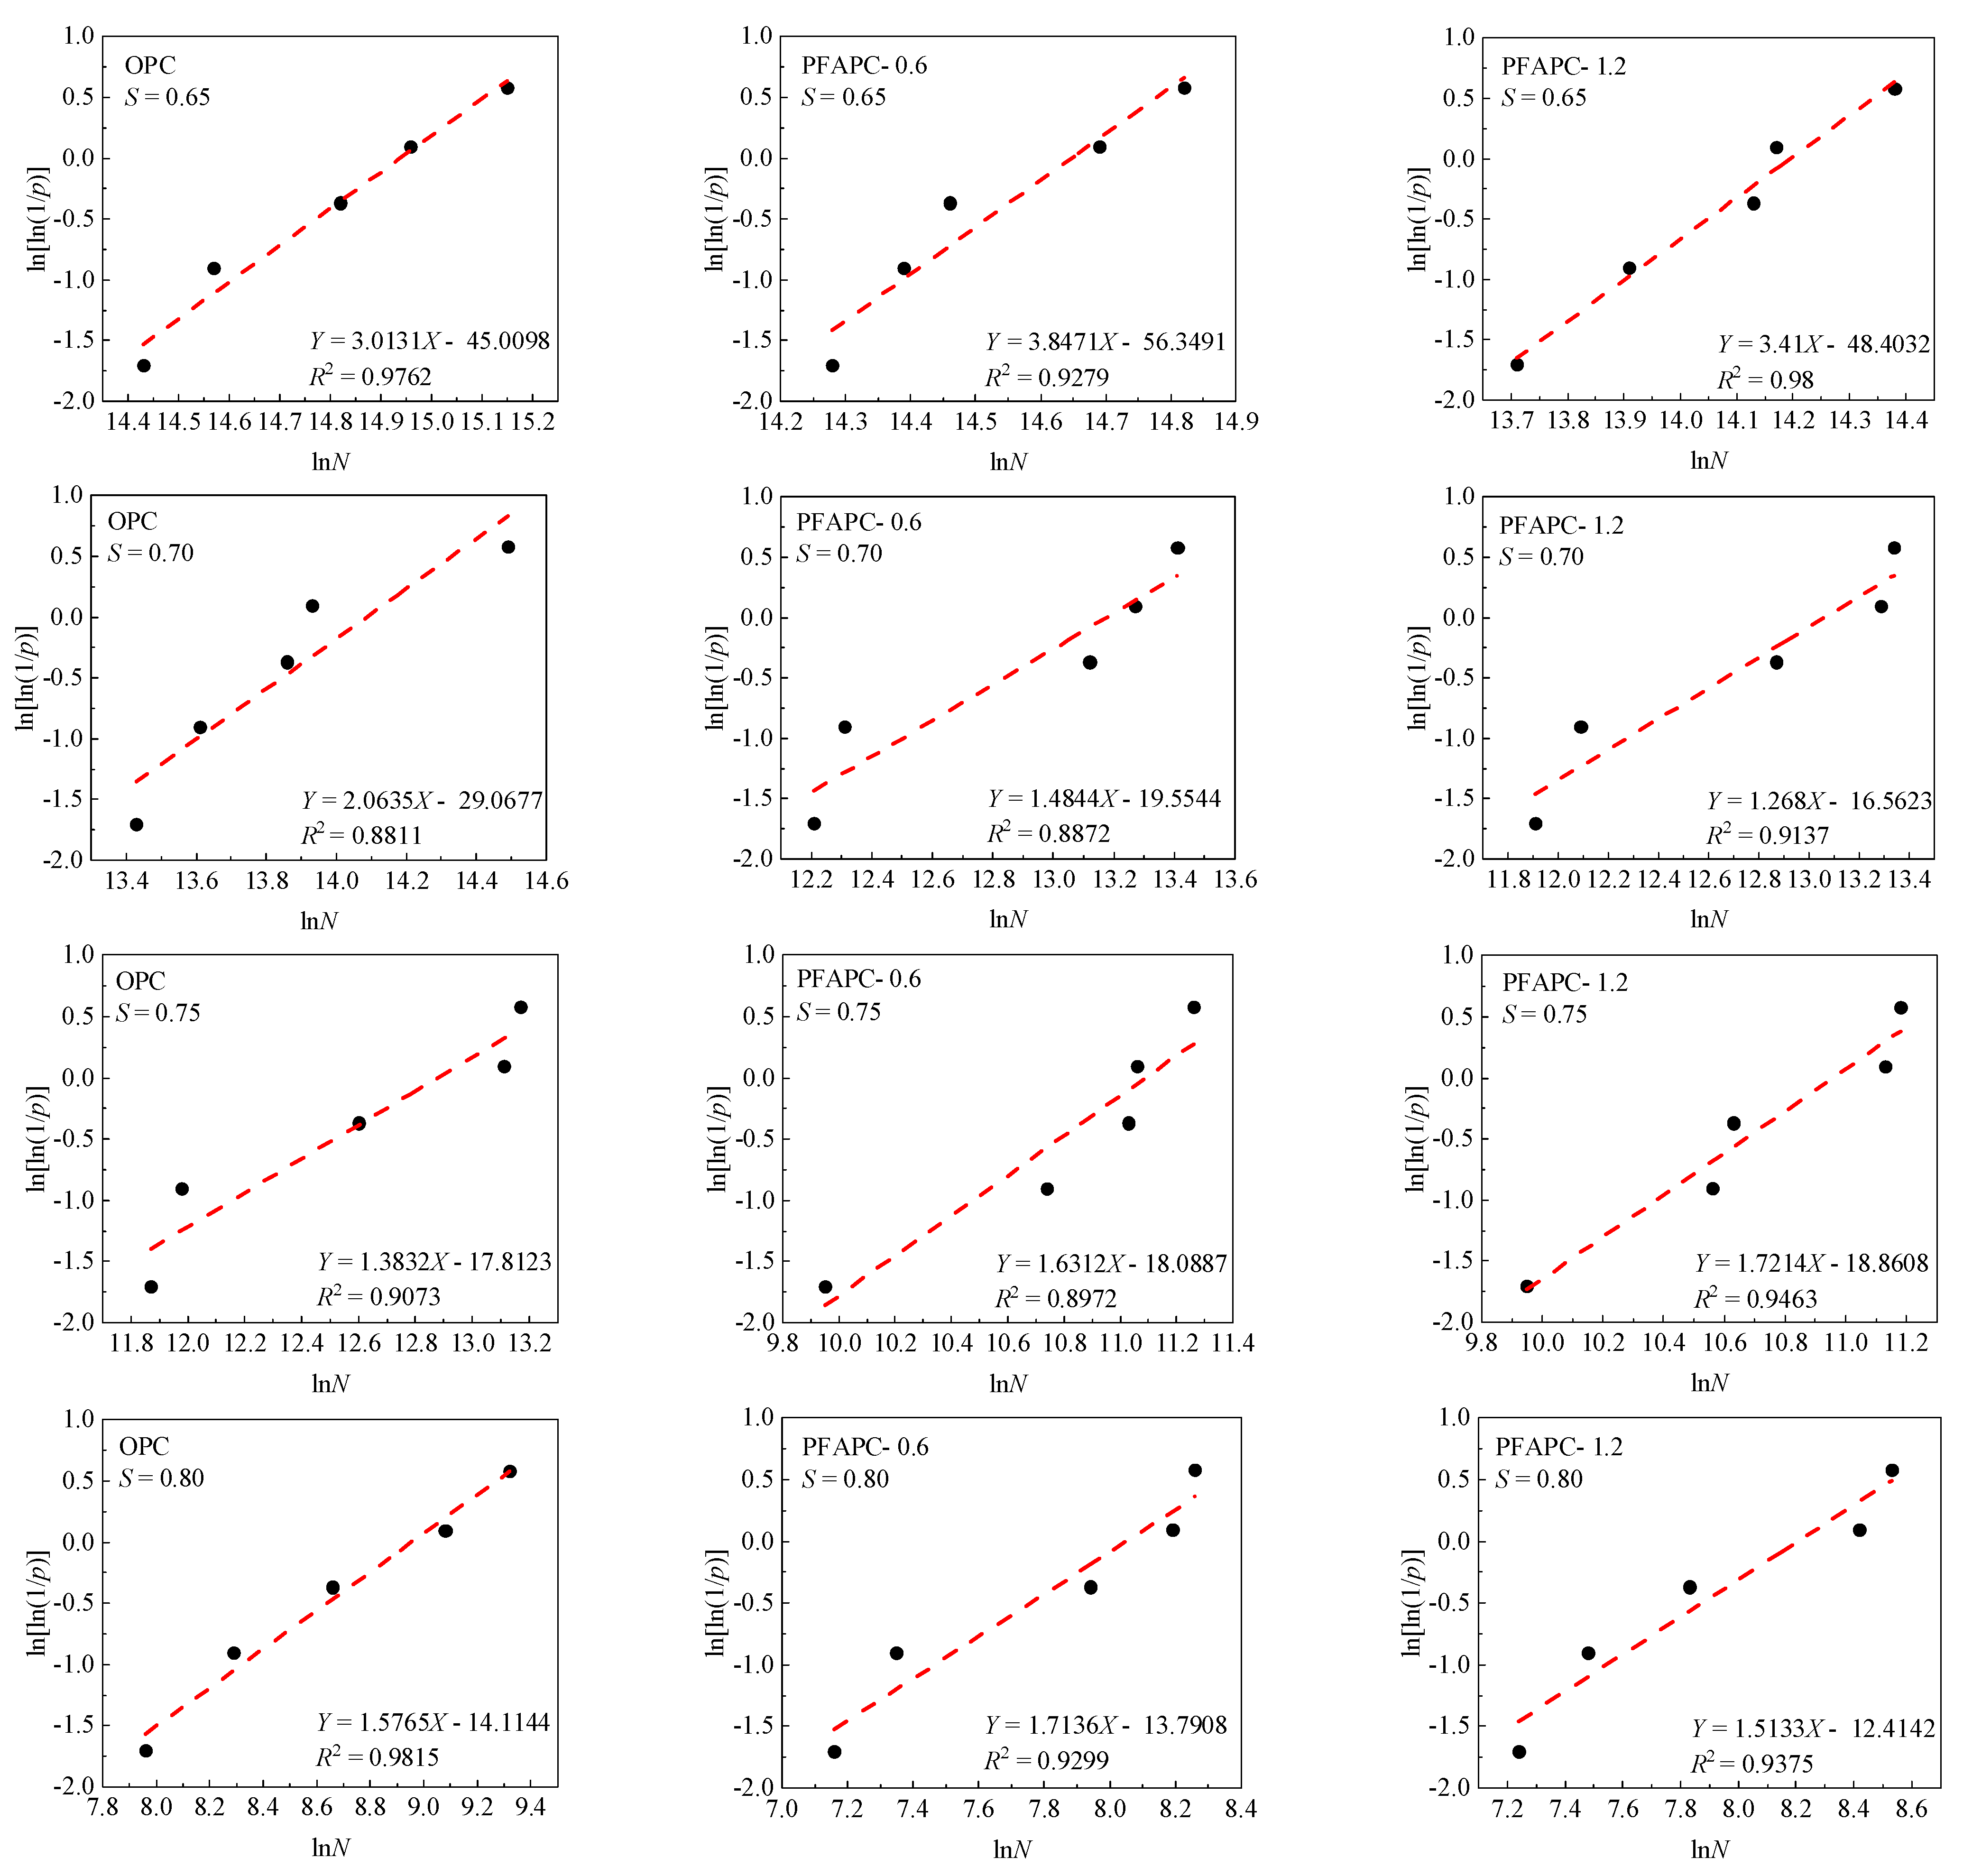
According to the information in
Table 5, the ln[ln(1/
p)]-ln
N curves of OPC and PFAPC were developed with varying fiber contents under various stress levels, as shown in
Figure 6.
Figure 6 shows that the OPC and PFAPC test data fitting lines were linear at different stress levels. A strong, statistically significant linear relationship was found between ln[ln(1/
p)] and ln
N, and the correlation coefficient
R2 was greater than 0.9. The fatigue life could be described by a two-parameter Weibull distribution.
Table 6 provides a summary of the Weibull distribution parameters of OPC and PFAPC at various stress levels, as shown in
Figure 6.
3.5. Flexural Fatigue Equation
The single-logarithm (
S-lg
N) and double-logarithm (lg
S-lg
N) fatigue equations for concrete are frequently used by engineers to match fatigue performance curves. The single-logarithm fatigue equation is as follows [
33]:
The fatigue equation has two boundary conditions [
33]:
The second boundary condition of the single-log fatigue equation cannot be satisfied, preventing the determination of the fatigue properties of concrete at low stress levels (
S < 0.50). The double-log fatigue equation [
30] is established to prolong the fatigue curve in the direction of
S→0:
The test findings and the aforementioned boundary requirements can both be satisfied by this ideal form of the fatigue equation.
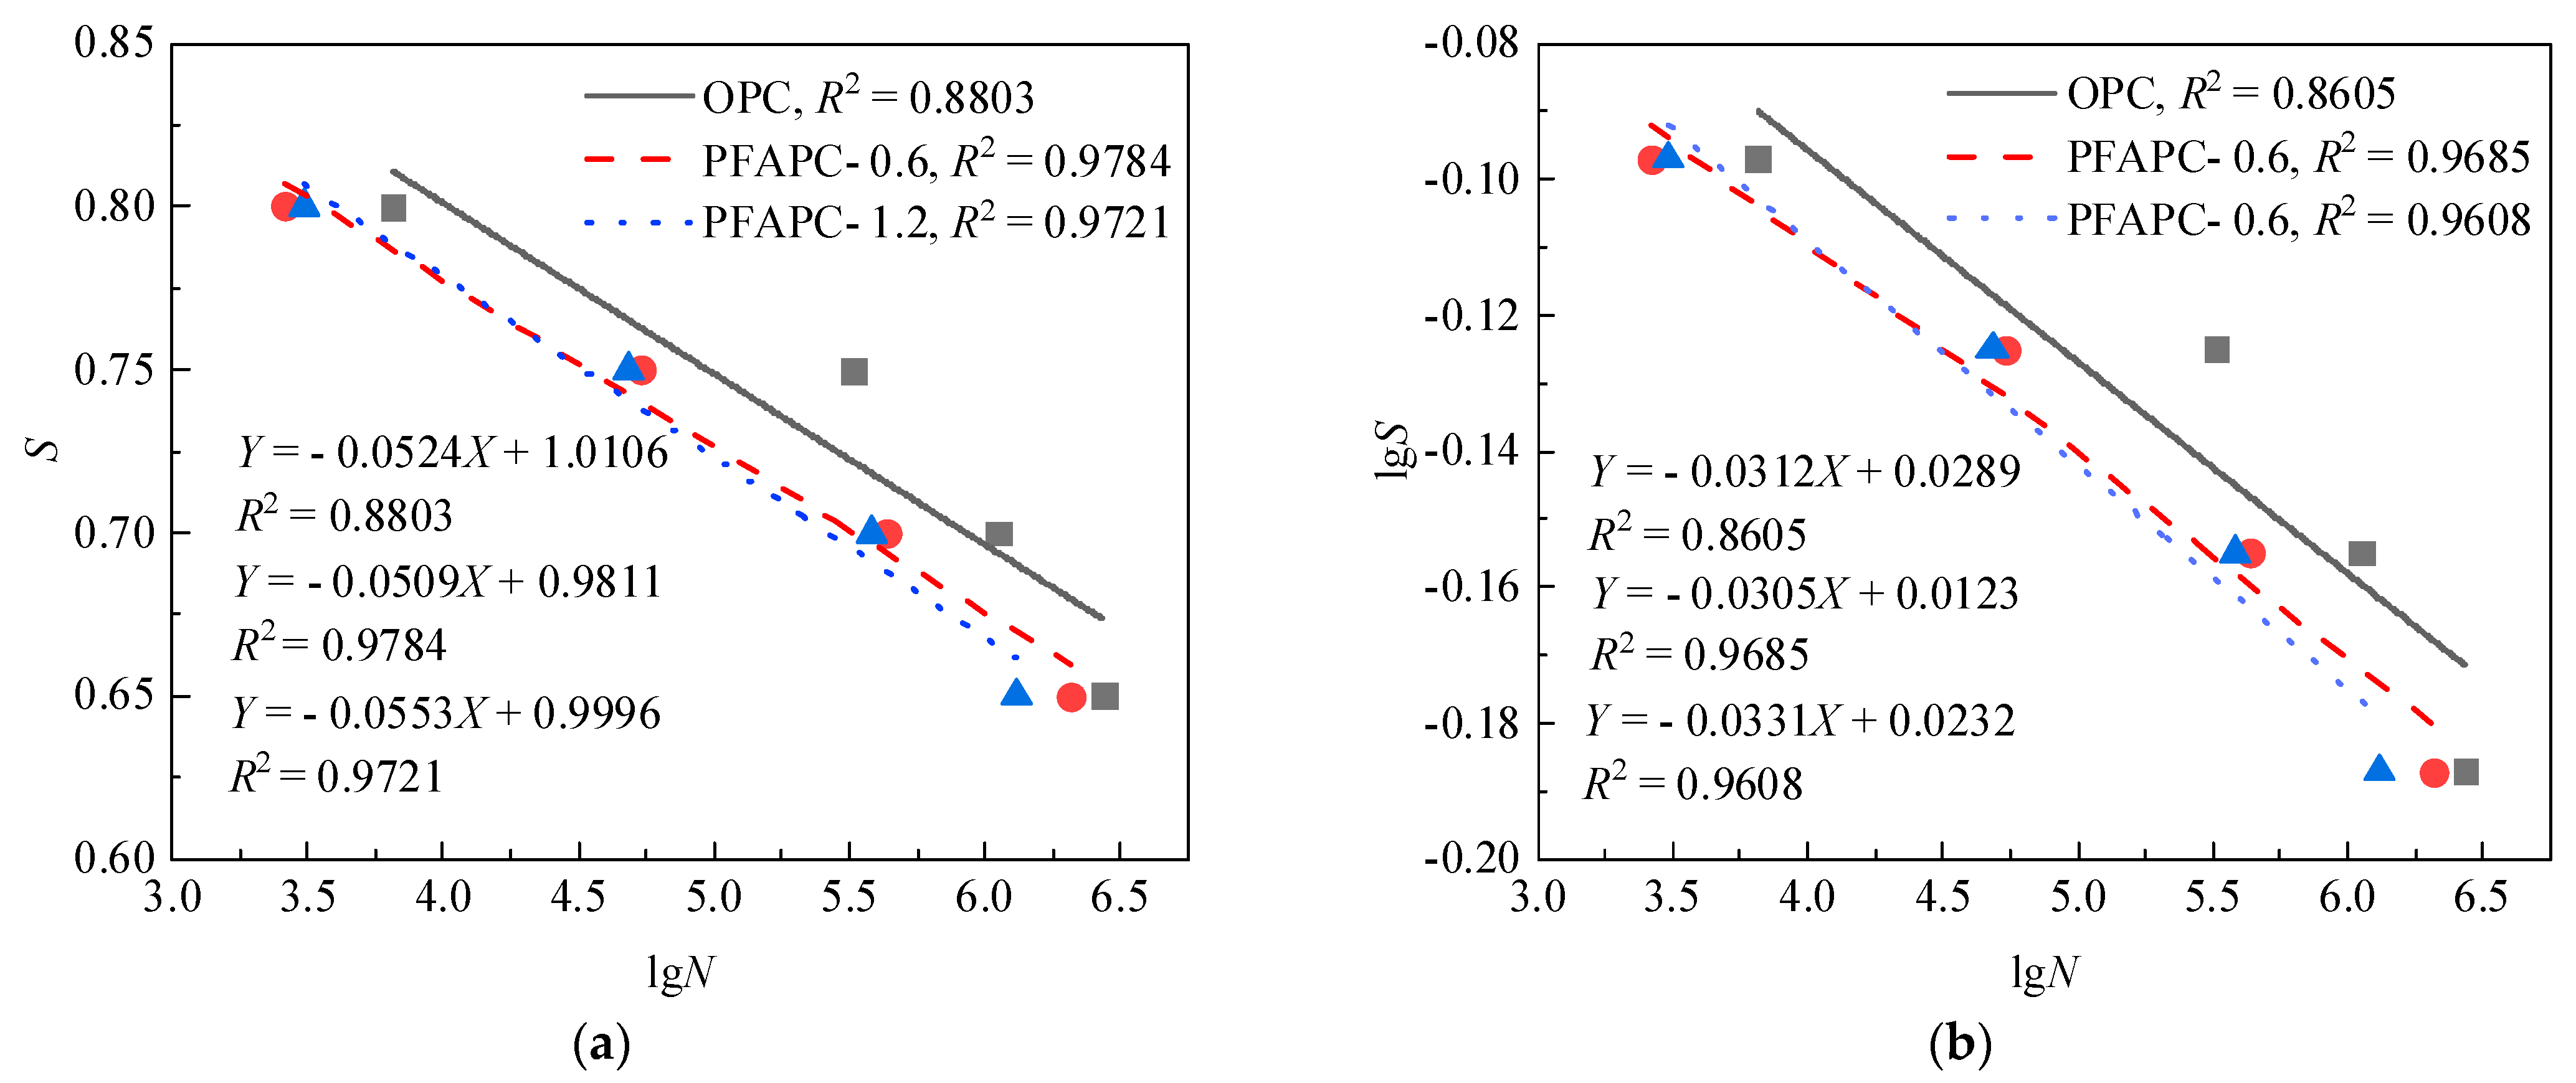
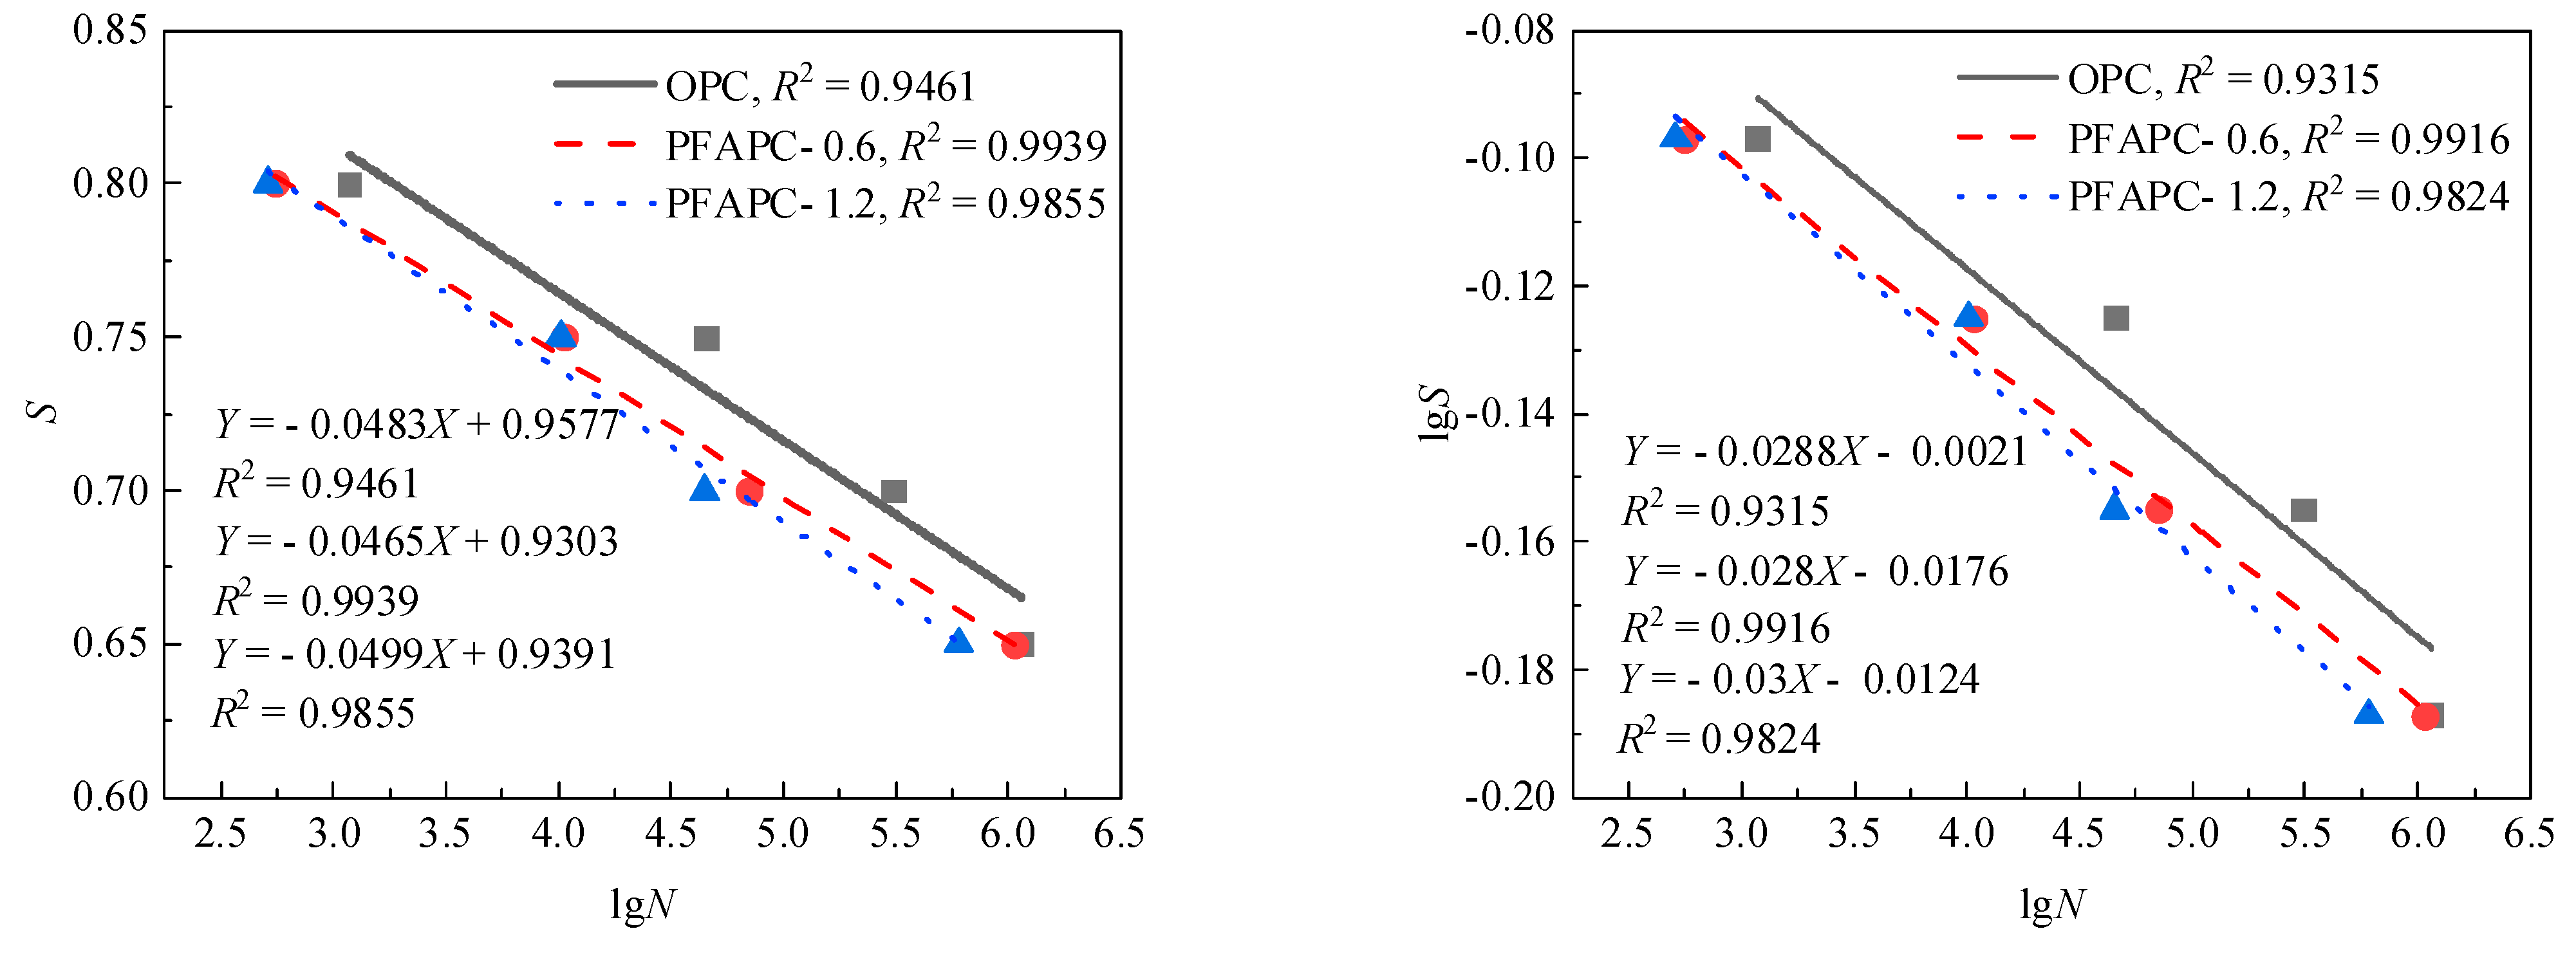
S–N curves are traditionally created using the stress level
S as the ordinate and the average fatigue life as the abscissa [
4]. As illustrated in
Figure 7, the standard
S–N curves of OPC and PFAPC were constructed in this study using the average fatigue life in shown
Figure 5.
Figure 7 shows that the correlation coefficients of the PFAPC fitting lines were all very high, with the exception of a slightly lower OPC, demonstrating that
S, lg
S, and lg
N each had a solid linear relationship in the PFAPC power function model. According to the fitting correlation, the fitting impact of the single-logarithm form was marginally superior to that of the double-logarithm form. As a result, the following single-log and double-log fatigue equations can be used to calculate the average fatigue life of OPC and PFAPC:
To meet the safety performance requirements under cyclic loading in practical engineering, the
P-S-N fatigue equations of OPC and PFAPC were established under a given failure probability in the form of single- and double-logarithm fatigue equations. The aim was to establish a direct quantitative relationship between the regression fatigue equation and failure probability
F (or survival rate
P = 1 −
F). The fatigue lives of OPC and PFAPC both followed a two-parameter Weibull distribution, according to the analysis in
Section 3.3 and
Section 3.4. Equation (10) can be used to compute the fatigue life
Nf under various failure probabilities
F:
The coefficients
b and
Na obtained in
Table 6 were substituted into Equation (10), and the fatigue lives
Nf (equivalent fatigue life) of OPC and PFAPC were calculated with given failure probability
F, as shown in
Table 8.
The data in
Table 8 were regressed using Equations (7) and (9).
Table 9 provides a summary of the regression coefficients
A,
B, lg
a, and
b of the single- and double-log fatigue equations, which correspond to various failure probabilities
F.
Table 9 demonstrates that, regardless of the shape of the single- or double-logarithm form, the correlation
R2 between OPC and PFAPC rapidly declined as the failure probability increased. In the single-logarithmic form of fitting, the correlation of other groups under different failure probabilities was over 0.90, and the correlation of the PFAPC group was above 0.97, with the exception of a slightly lower correlation in OPC when the failure probability was 0.40–0.50. With the exception of a marginally lower correlation in OPC when the failure probability was 0.20–0.50, the correlations of all other groups in the double-log fitting were over 0.90, whereas those of the PFAPC group were above 0.96. This showed that when the failure probability
F is considered, the equivalent fatigue life
Nf of the PFAPC obeyed the two-parameter Weibull distribution with high accuracy. Additionally, the corresponding linear relationship between the single-log fatigue equation and the double-log fatigue equation was essentially established, with the degree of fit for the single-log fatigue equation being slightly higher than that of the double-log equation. This is in line with the results of the fitting correlations between the average fatigue life corresponding to the single- and double-log fatigue equations.
Failure probability
F had little impact on regression coefficients
B and
b, and can be ignored, similar to the majority of the fatigue test results for fiber-reinforced concrete. The single- and double-logarithm fatigue equations of airport pavement concrete, considering failure probability
F, can be determined by using the average value of
B and
b as the general result, as shown below:
These equations serve as a guide for forecasting the fatigue life of PFAPC with various failure probabilities under various stress levels, when the above formulae are combined with the regression coefficients under various failure probabilities as shown in
Table 9. Flexural fatigue testing of concrete generally yields two
S-N curves with high reference values. The first is the
P-S-N curve, which corresponds to a survival rate of 50%, or a failure probability of 50%; the maximum fatigue strength of a material can be determined through this curve. The second is the corresponding survival-rate
P-S-N curve;
P is 95%, which means that
F is 0.05 in terms of failure probability. The ultimate strength of the material under conditional fatigue can be determined by this curve, and this value can serve as a general guide for structural design [
34,
35].
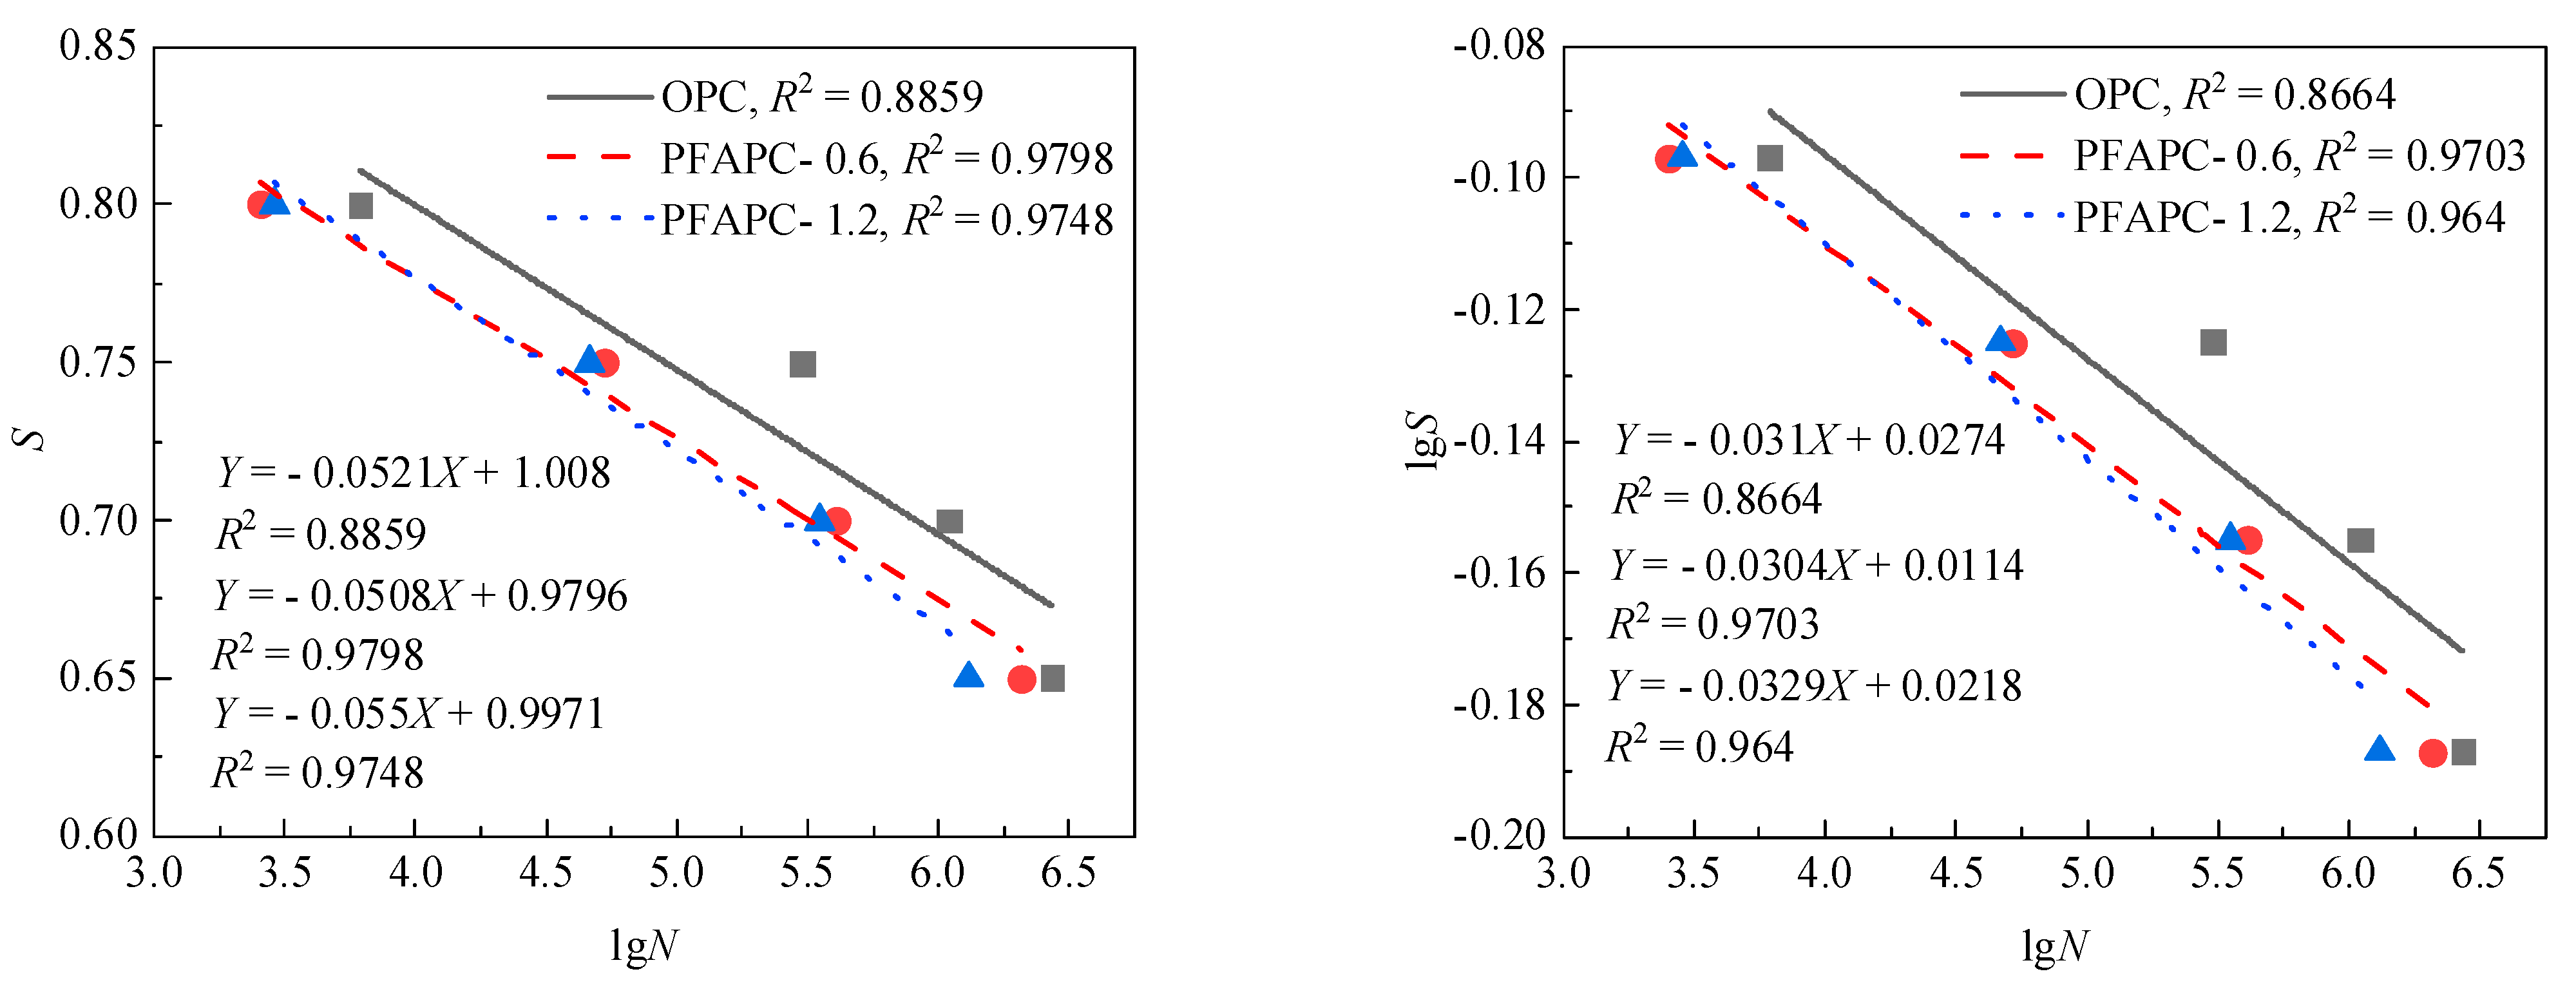
Figure 8 and
Figure 9 display the
P-S-N curves for the two survival rates.
According to a previous study [
3], a concrete specimen has an unlimited life if it is not harmed after 2 × 10
6 cycles of loading. The ultimate fatigue strength of material generally refers to the maximum fatigue stress that the material can withstand under a certain number of cycles, and is usually expressed in the form of static flexural strength percentage in practical application [
4,
7,
24]. Researchers studying the ultimate fatigue strength of concrete materials typically use a cyclic foundation of 2 × 10
6 fatigue cycles. The OPC and PFAPC ultimate fatigue strength (upper limit of stress level) and conditional ultimate fatigue strength corresponding to a 2 × 10
6 fatigue life under two survival rates was calculated using
Figure 8 and
Figure 9, as well as the established single- and double-log fatigue equations, as shown in
Table 10.
No difference in the ultimate fatigue strength was estimated by using the single-logarithm and double-logarithm form equations, as shown in the calculation results in
Table 10. The ultimate fatigue strengths of OPC, PFAPC-0.6, and PFAPC-1.2 with a survival rate of 50% were found to be 0.68
fr (where
fr is the static flexural strength of OPC and PFAPC), 0.66
fr, and 0.65
fr, respectively, equating to a 2 × 10
6 fatigue life. The conditional ultimate fatigue strengths of OPC, PFAPC-0.6, and PFAPC-1.2 corresponding to a 2 × 10
6 fatigue life were calculated as 0.65
fr, 0.64
fr, and 0.63
fr, respectively, when considering a survival rate of 95%. The average fatigue life of the material in the fatigue test was indicated to be larger than 2 × 10
6 times when the loading stress amplitude was less than or equal to the ultimate fatigue strength, suggesting no fatigue failure. When the survival rate was 50%, the fatigue strength of concrete with POM fibers at 0.6 and 1.2% volume decreased by 2.9 and 4.4%, respectively; when the survival rate was 95%, the fatigue strength fell by 1.5 and 3.1%, respectively. The addition of POM fiber reduced the flexural fatigue performance of airport pavement concrete to a certain extent.


