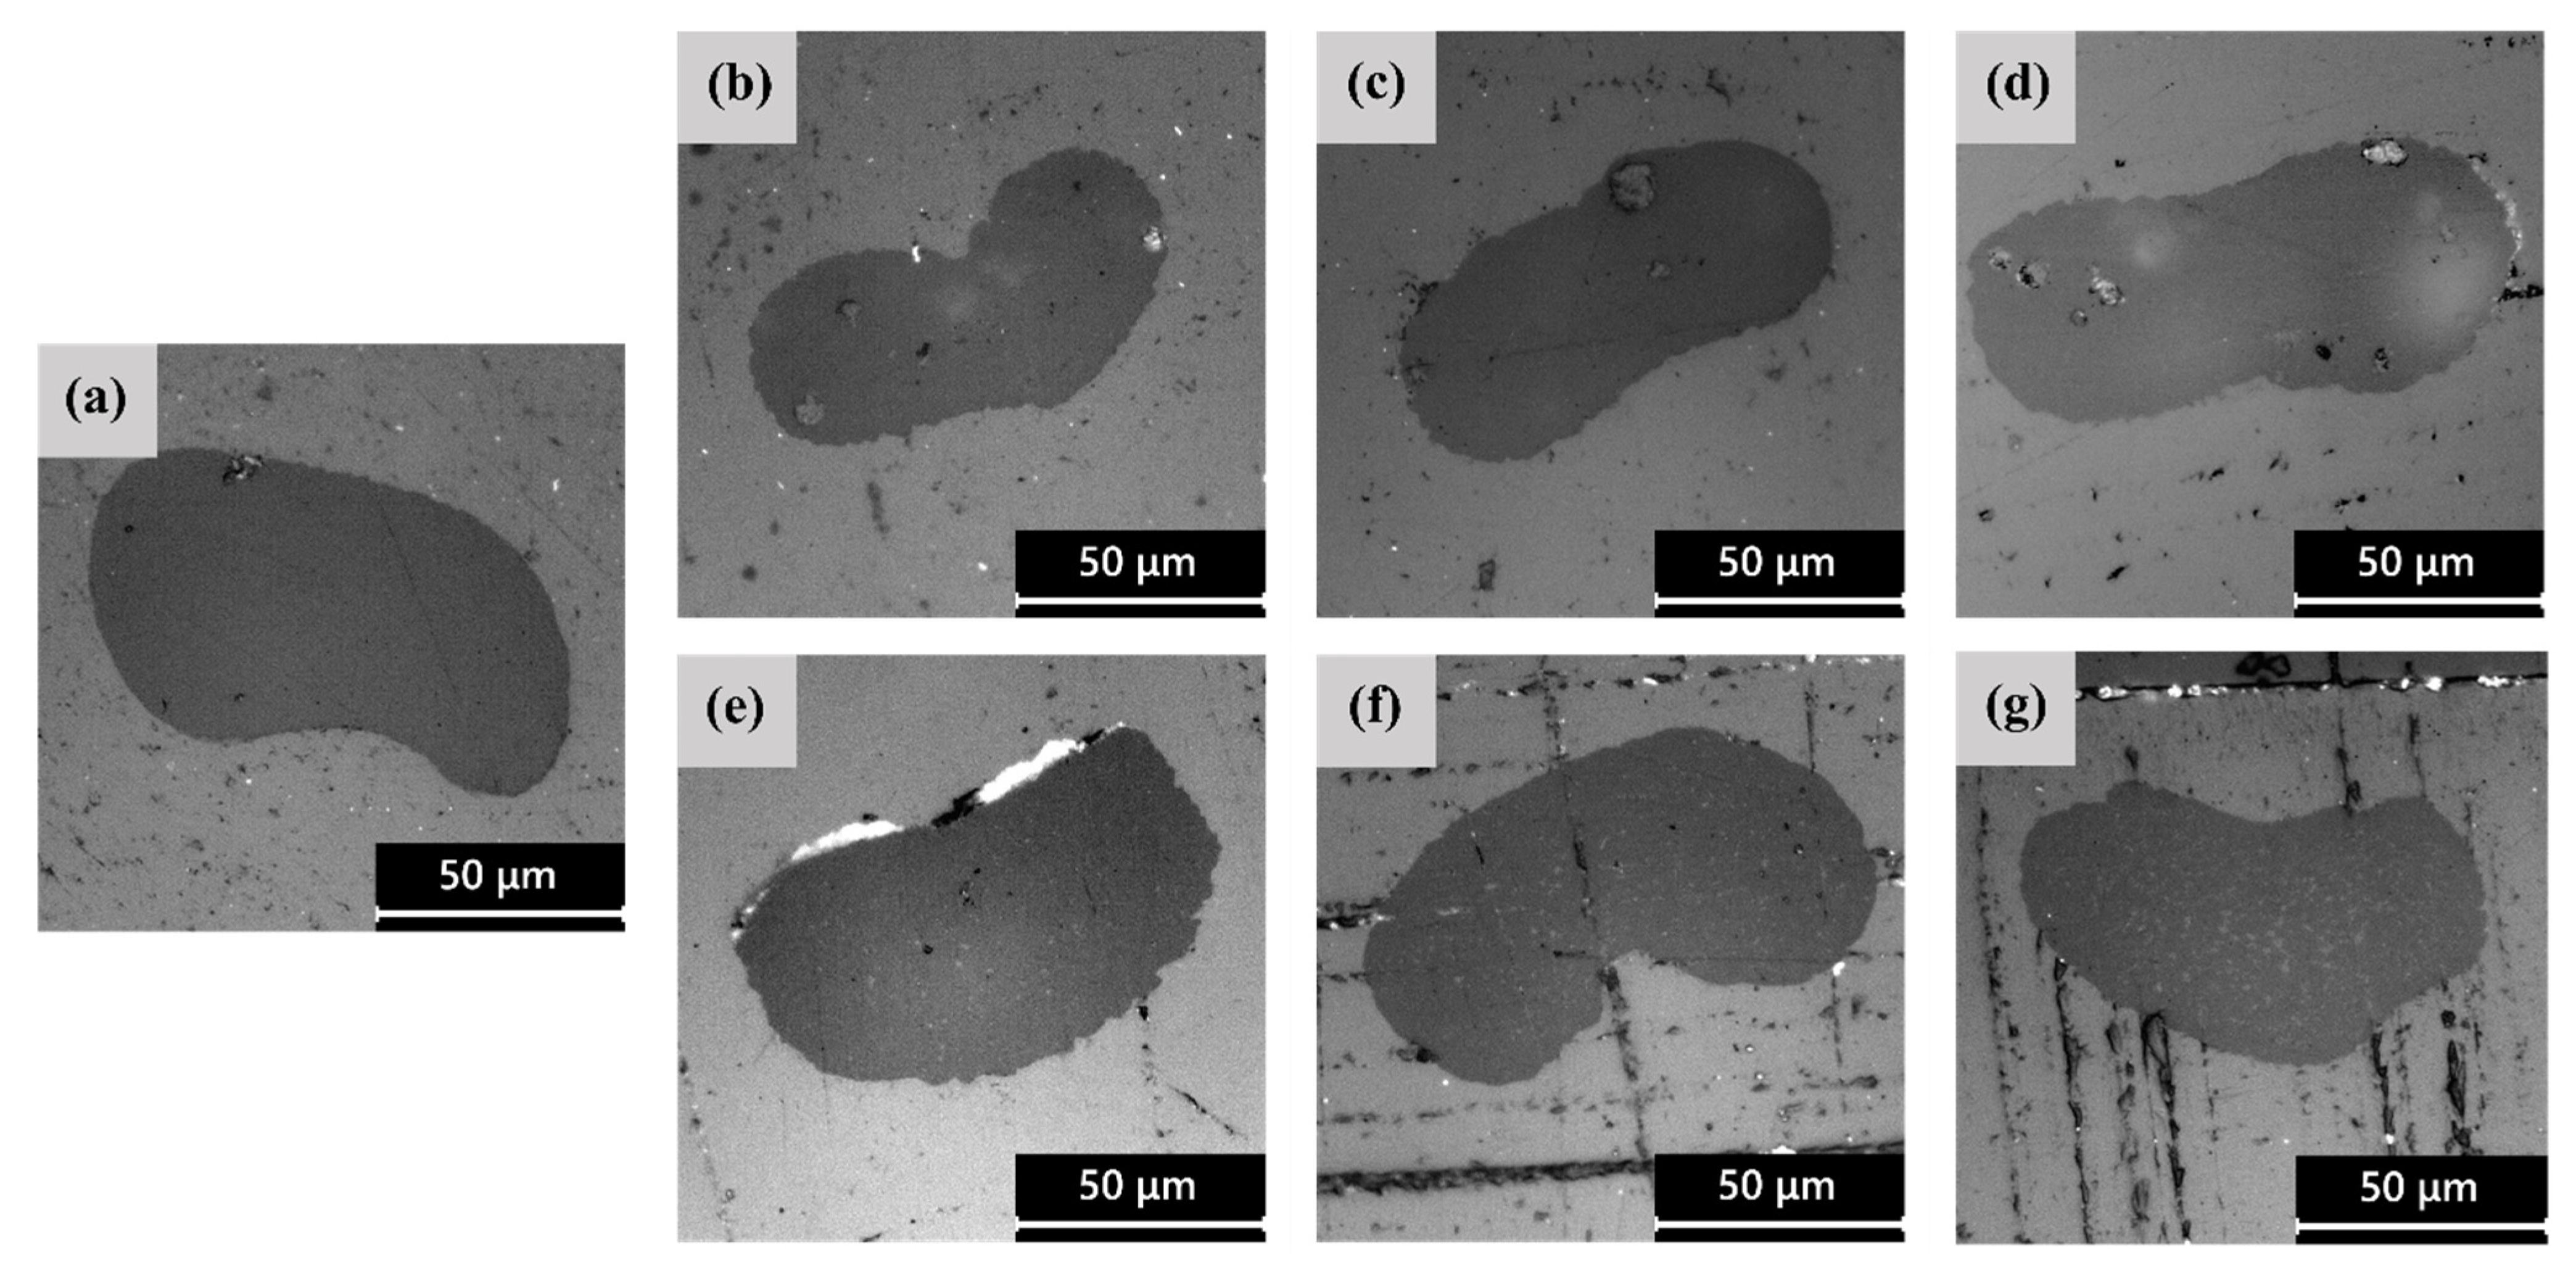
3.1. Microstructural Properties
Figure 2a–g show the LM micrographs of the cross−sections of the as−spun fibers, while the average fiber diameters and their circularity C are reported in
Table 2. The cross−sections of the fibers present a non−circular shape, which is similar to what has been observed in our previous studies on the wet spinning of PLA/PAF fibers [
24,
43,
44]. This could be the result of the deformation of the fibers, softened by the residual solvent, when collected on the take−up rolls. The crenulation effect observed in some fibers, which is formed as the fibers enter the non−solvent bath due to the kinetics of solvent removal, leads to a larger surface area from which the solvent can be extracted. This effect is more evident for all PLA/PAF fibers than for neat PLA ones, which may suggest an impact of both PEF and PDoF on the solvent removal rate. Moreover, PEF domains in PLA−PEF fibers (
Figure 2b–d) are considerably larger than the PDoF domains in PLA−PDoF fibers (
Figure 2e–g), which are fine and well−distributed, and their size increases with the distance from the fiber axis, as observed in our previous work [
22,
24]. The difference between the size of PEF and PDoF domains can be attributed to the different solubility of PEF and PDoF in the solvent mixture. Since PEF is less soluble than PDoF and especially than PLA in the selected solvent mixture, when the spinning dope enters the non−solvent bath, the rate of solvent extraction is probably higher for PLA/PEF mixtures and in particular for the PEF phase, thereby favoring the formation of solvent−poor coalescent PEF domains in a solvent−rich PLA matrix. Conversely, since PLA and PDoF show similar affinity to the chloroform/HFIP solvent mixture and similar solvent extraction rate, this leads to the formation of small and well−distributed PDoF domains. This phenomenon is accentuated where the solvent−extraction rate is slower, i.e., close to the fiber axis, and this also explains the decreasing domain size in this region compared to the cross−section peripheries.
Lastly, the addition of PAFs leads to a decrease of approx. 46% in the average fiber diameter compared to the PLA fibers and also to an increase in circularity values from approx. 0.80 for the PLA−as sample to >0.90 for all the blends.
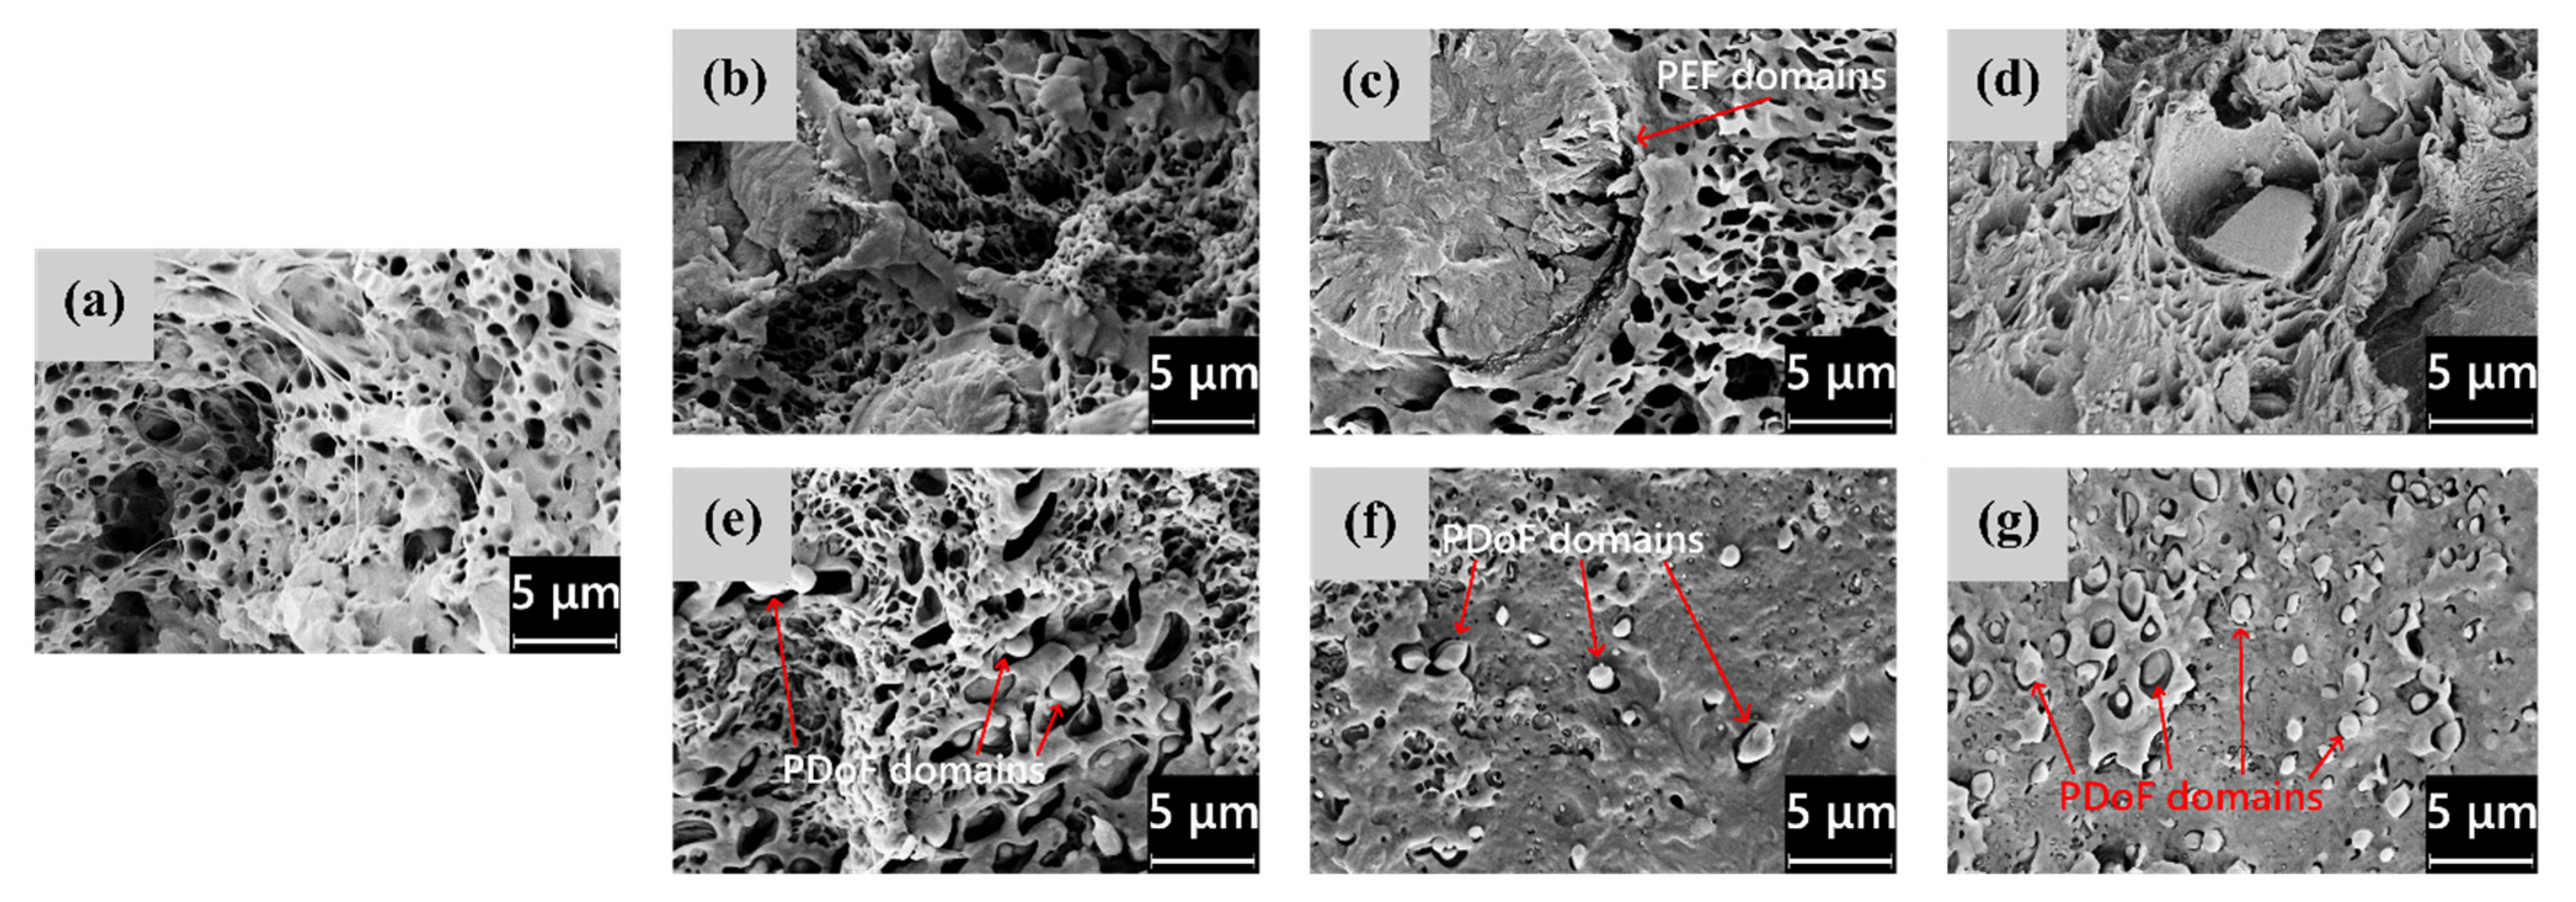
The microstructural features highlighted by LM microscopy are confirmed and expanded by the SEM analysis, whose results are shown in
Figure 3a–g, representing the FESEM micrographs of the cross−sections of the as−spun fibers, and in
Figure 4a–g, showing their lateral surface. First, from the micrographs of the cross−sections (
Figure 3a–g), the difference in domain size between PEF and PDoF is here confirmed and quantified, as the PEF domain size is 10.0 ± 0.2 μm, while that of the PDoF domains is approx. one−tenth, being 0.7 ± 0.1 μm. Moreover, the cross−sections are characterized by a compact outer ring and a porous core. This morphology has probably been favored by the non−circular cross−sections of the fibers, which allows a quicker solvent release compared to a perfectly circular fiber, thus leading to a sheath–core structure and a higher inner porosity. All porosity is concentrated in the PLA matrix, while PEF and PDoF domains appear completely dense and homogeneous along the cross−section axis, which is probably due to their small dimensions. Finally, PLA and PEF domains show scarce compatibility and poor adhesion with the surrounding PLA matrix, being worse for PDoF than for PEF. This could partially explain the limited mechanical properties of these fibers (see
Section 3.3).
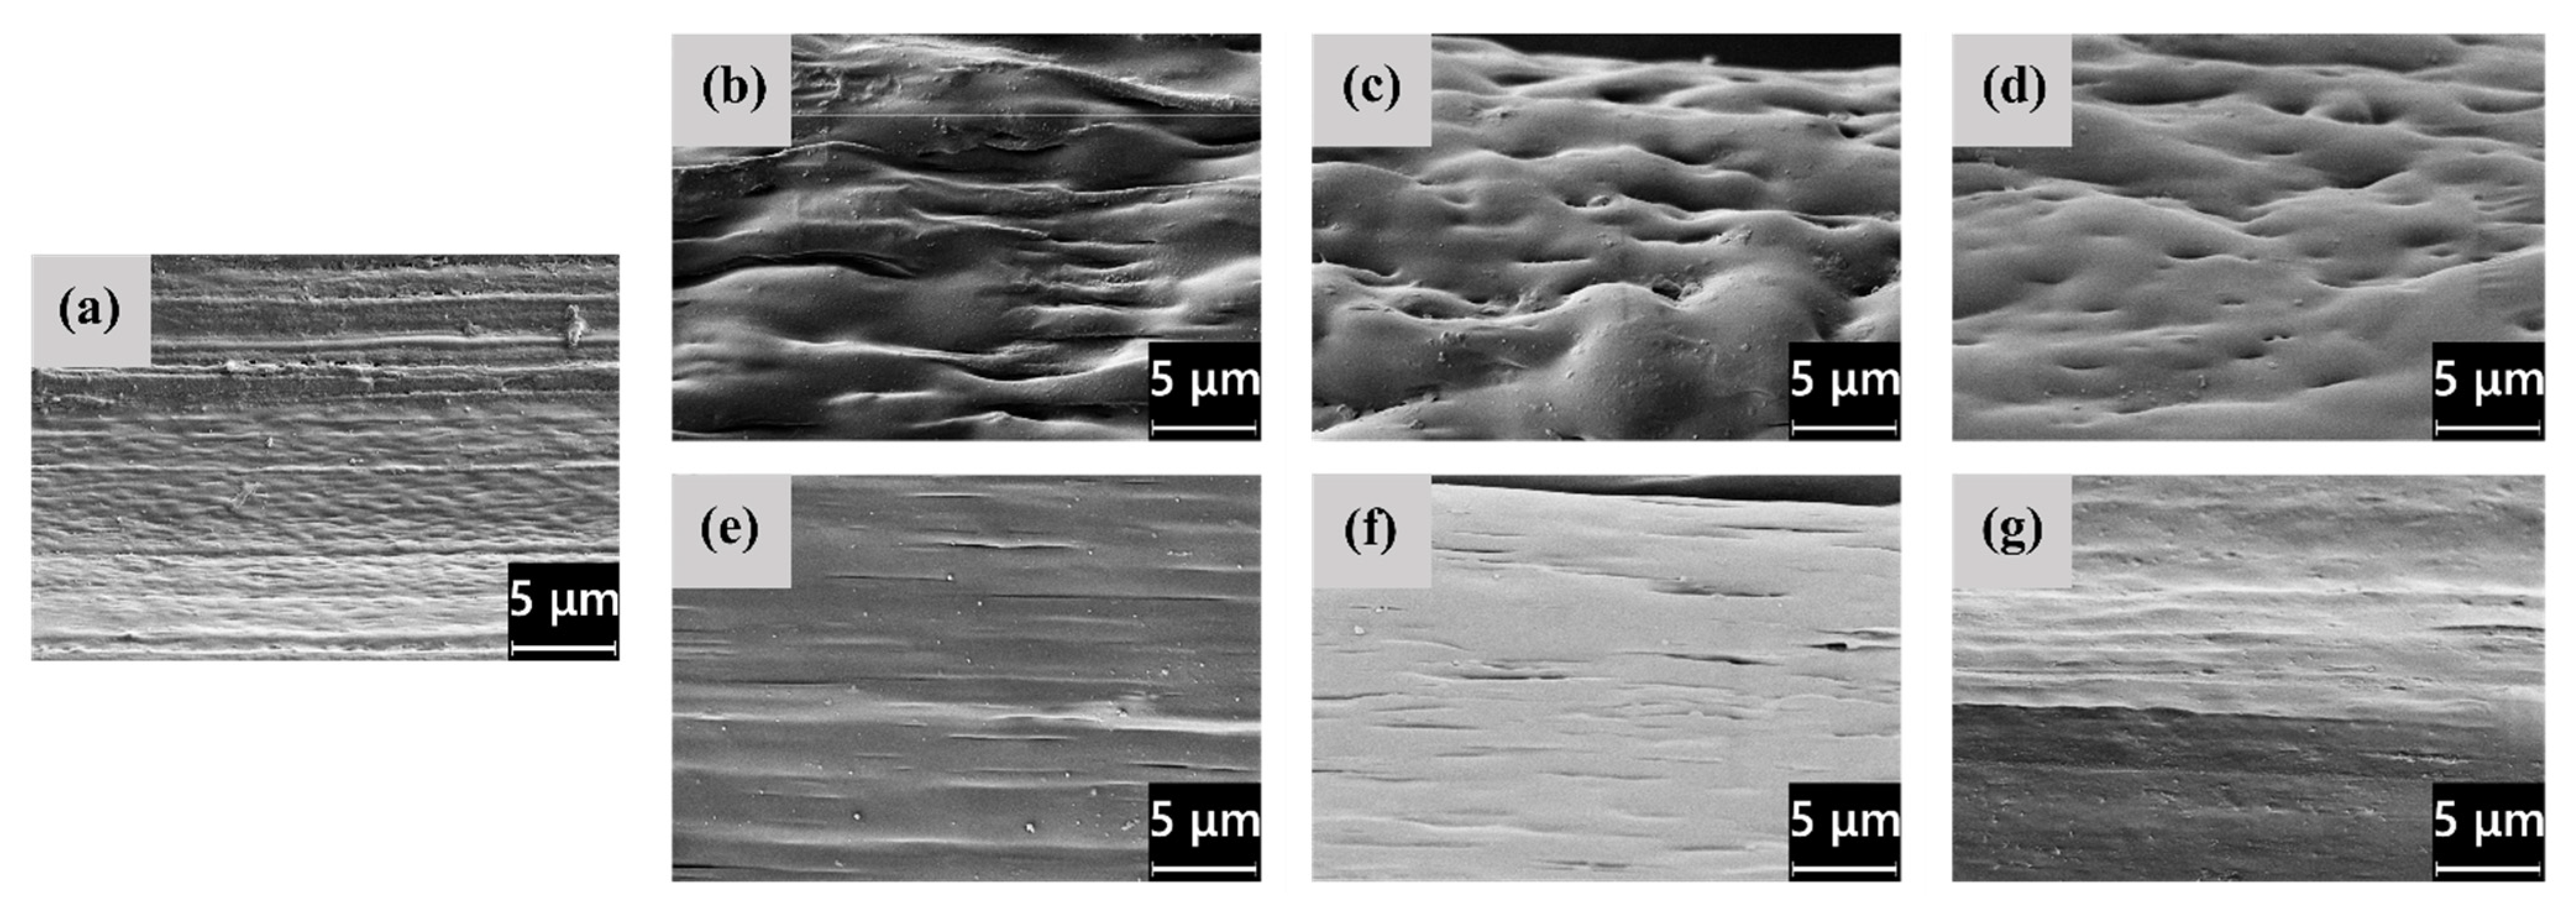
Figure 4a–g show the FESEM micrographs of the lateral surfaces of the as−spun fibers. The neat PLA fibers (
Figure 4a) and the PLA/PDoF fibers (
Figure 4e–g) present a relatively smooth lateral surface, whereas the PLA/PEF fibers (
Figure 4b–d) present a remarkable surface roughness, which is in good agreement with what has been reported for the LM micrographs. Such a defective structure, similar to that observed by Gupta et al. [
45] and Liu et al. [
46] in polyacrylonitrile spun fibers, can be attributed to the different rates of solvent release upon the addition of PEF.
The structural properties of the fibers were investigated with spectroscopic and diffraction techniques.
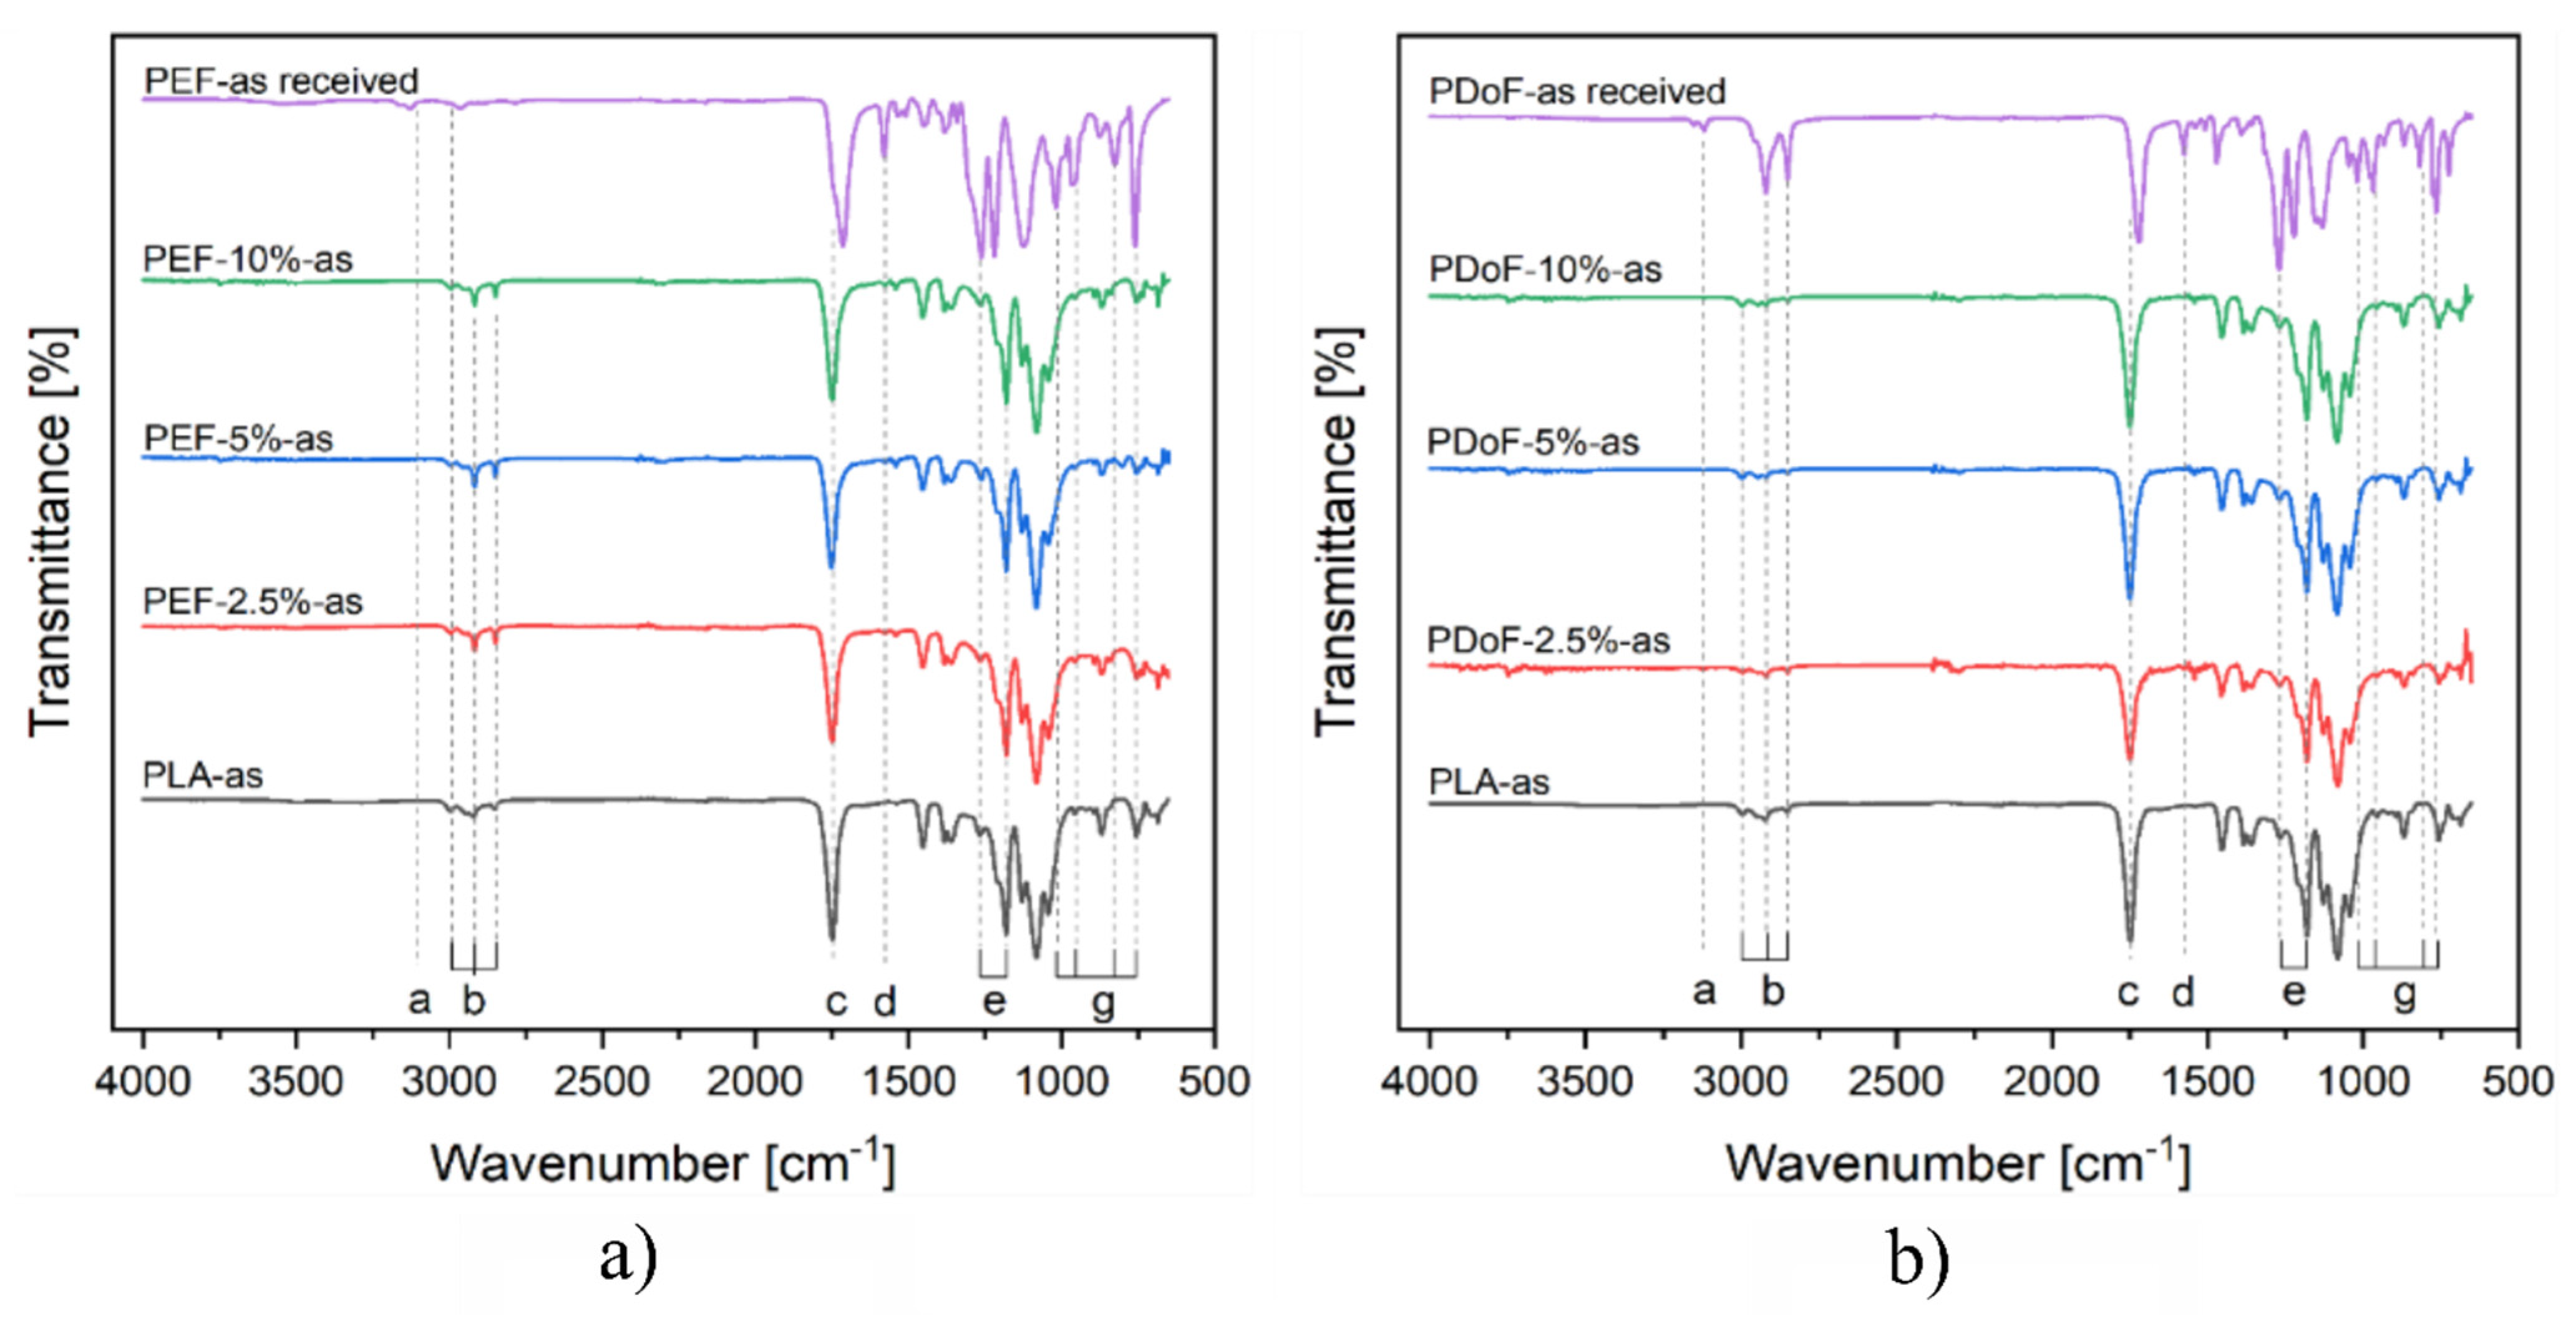
Figure 5a,b show the ATR−FTIR spectra of the PLA, PEF−x−as and PDoF−x−as fiber blends (with x = 2.5%, 5%, or 10%), and of the bulk, PEF, and PDoF samples. Neat PLA fibers show a small signal corresponding to the CH
3 out−of−phase and in−phase stretching at 2995 cm
−1 and 2950 cm
−1, respectively. The peaks at 1747 cm
−1 and 1181 cm
−1 are related to the C=O and C−O−C stretching frequencies, respectively. Moreover, CH
3 out−of−phase and in−phase bending frequencies can be identified at 1453 cm
−1 and 1380 cm
−1, respectively. Moreover, two peaks can be detected in all the analyzed samples at 868 cm
−1 and 755 cm
−1, which are related to the crystalline and amorphous phases of PLA, respectively [
22,
47], which implies that the produced fibers are semi−crystalline. The regions of interest of the neat−PEF sample are two weak bands found at 3165 cm
−1 and 3117 cm
−1, which are related to the out−of−phase and in−phase C−H stretching of the furan ring, and a weak band at 2964 cm
−1, which is related to the out−of−phase stretching of alkyl methylene groups, a strong absorption peak related to the C = O stretching centered at 1714 cm
−1, a band at 1576 cm
−1 linked to the C = C stretching vibration, the C−O in ester bond stretching vibration identified at 1260 cm
−1, a furan ring breathing band centered at 1010 cm
−1, and ring bending at 952 cm
−1, 827 cm
−1, and 751 cm
−1 [
48]. The regions of interest of PDoF are very similar to those related to PEF. The main assigned peaks are two weak bands found at 3160 and 3119 cm
−1 related to the out−of−phase and in−phase C − H stretching of the furanic ring, and a weak band at 2918 and 2854 cm
−1 related to the out−of−phase and in−phase stretching of alkyl methylene groups, a strong absorption peak related to the C = O stretching centered at 1714 cm
−1, a band at 1570 cm
−1 linked to the C = C stretching vibration, the C−O in ester bond stretching vibration identified at 1268 cm
−1, a furan ring breathing band centered at 1018 cm
−1, and ring bending at 966 cm
−1, 824 cm
−1, and 759 cm
−1.
The fiber blends do not show any peak related to the presence of PEF or PDoF, which is due to their limited weight fraction in the blends. Moreover, no red or blue shifts are highlighted when comparing the blends’ spectra with those of the neat−PEF and neat−PDoF, thus highlighting no relevant interactions between the polymer phases in the blends, which is similar to our previous findings [
22,
24,
32].
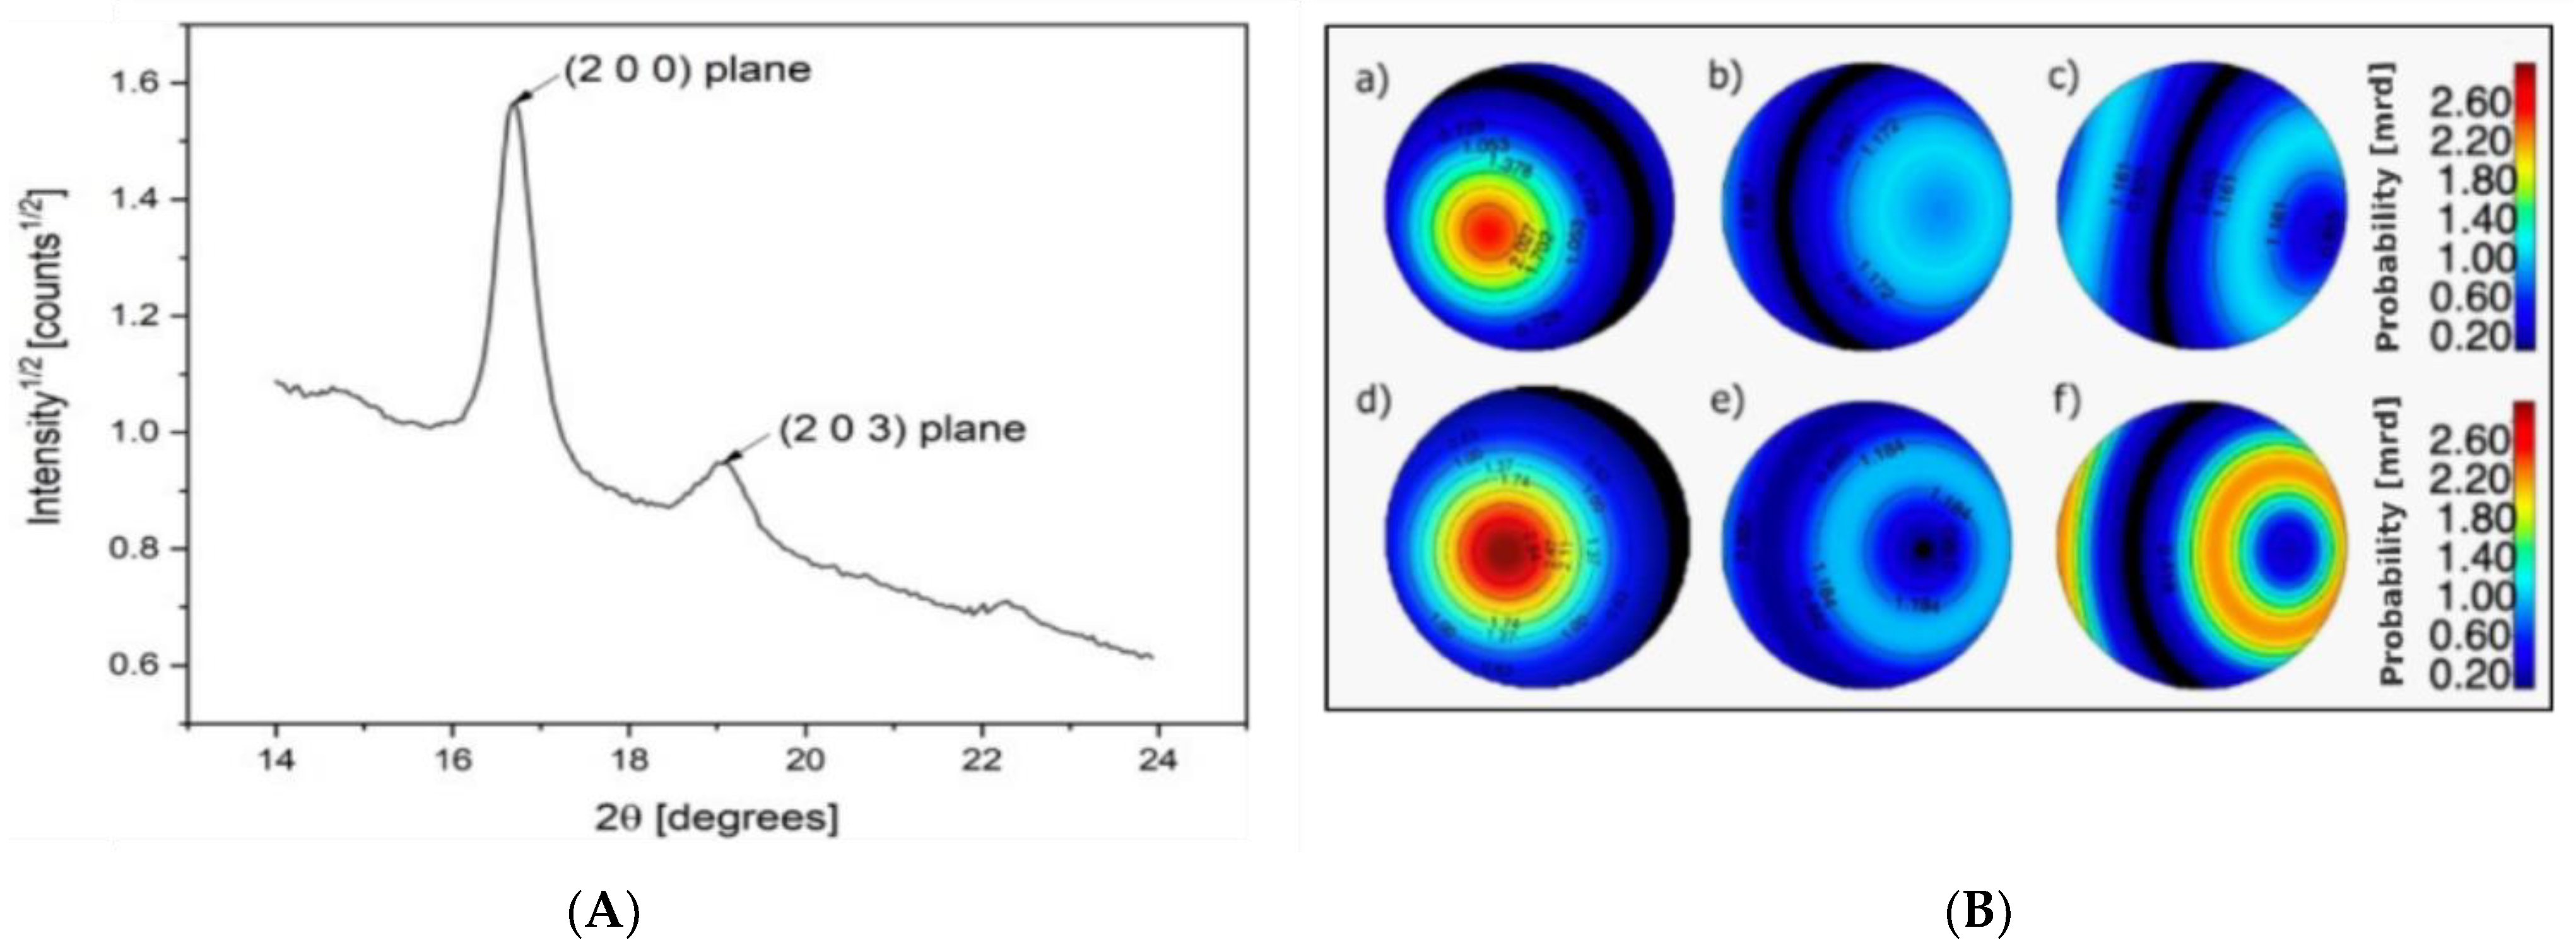
Finally, X−ray diffraction (XRD) was performed to study the differences in microstructure and crystallinity between the as−spun and drawn fibers. In
Figure 6a, the significant 2θ range of the powder diffraction pattern of PLA−as is reported, showing the two main (200) and (203) Bragg reflections located at 17° and 19°, respectively. In PLA/PAF fiber samples, no significant signals arise from the crystalline fractions of PEF and PDoF, which is likely due to their low volume fractions. For this reason, data analysis through the Rietveld method was carried out taking into account only the reference crystal structure of α−PLA reported in [
49,
50] and considering the preferred orientation and crystalline domain size refinement of the same; significant refined values are reported in
Table 3.
For preferred orientation, a satisfactory agreement with the data was obtained by means of one single Standard Function model with fiber symmetry; any further parameterization did not result in significant improvement in the fitting. Pole figure reconstruction from the Orientation Distribution Function demonstrates that the orientation of the crystallites happens preferentially with the (002) plane aligning along the fiber axis.
Figure 6b shows the pole figures of the (200) plane for the PLA−as, PEF−10%−as, PDoF−10%−as, PLA−DR2, PEF−10%−DR2, and PDoF−10%−DR2, with the orientation density represented as a color map in the Multiple of Random Distributions (M.R.D.) scale. As expected, the drawing procedure generally increases the amount of the preferred orientation compared to the as−spun samples, with again the c−axis of the orthorhombic α−PLA cell preferentially aligning along the fiber axis. Interestingly, however, the addition of the PAFs significantly decreases the preferred orientation in both the as−spun and drawn samples; this could also contribute to the lower stiffness of the fiber blends compared to the neat PLA fibers.
To characterize the microstructure, only size−broadening effects were considered, due to the relatively low information content of the diffraction pattern in terms of well−defined Bragg reflections; the average volume−weighted domain size was refined in the limits of the isotropic approximation. As expected, the drawing procedure generally increases the dimensions of the crystallites in both neat PLA and PLA/PAF fibers; moreover, the latter exhibit slightly higher domain size values with respect to neat PLA to start with.
Figure 6.
(A) Example of a 1D XRD diffraction pattern of a PLA−as sample, (B) polar figures showing the preferred orientations of the (200) plane for (a) PLA−as, (b) PEF−10%−as, (c) PDoF−10%−as, (d) PLA−DR2, (e) PEF−10%−DR2, and (f) PDoF−10%−DR2 fibers. Equal area projection on the fiber axis plane; pole density scale expressed in M.R.D.
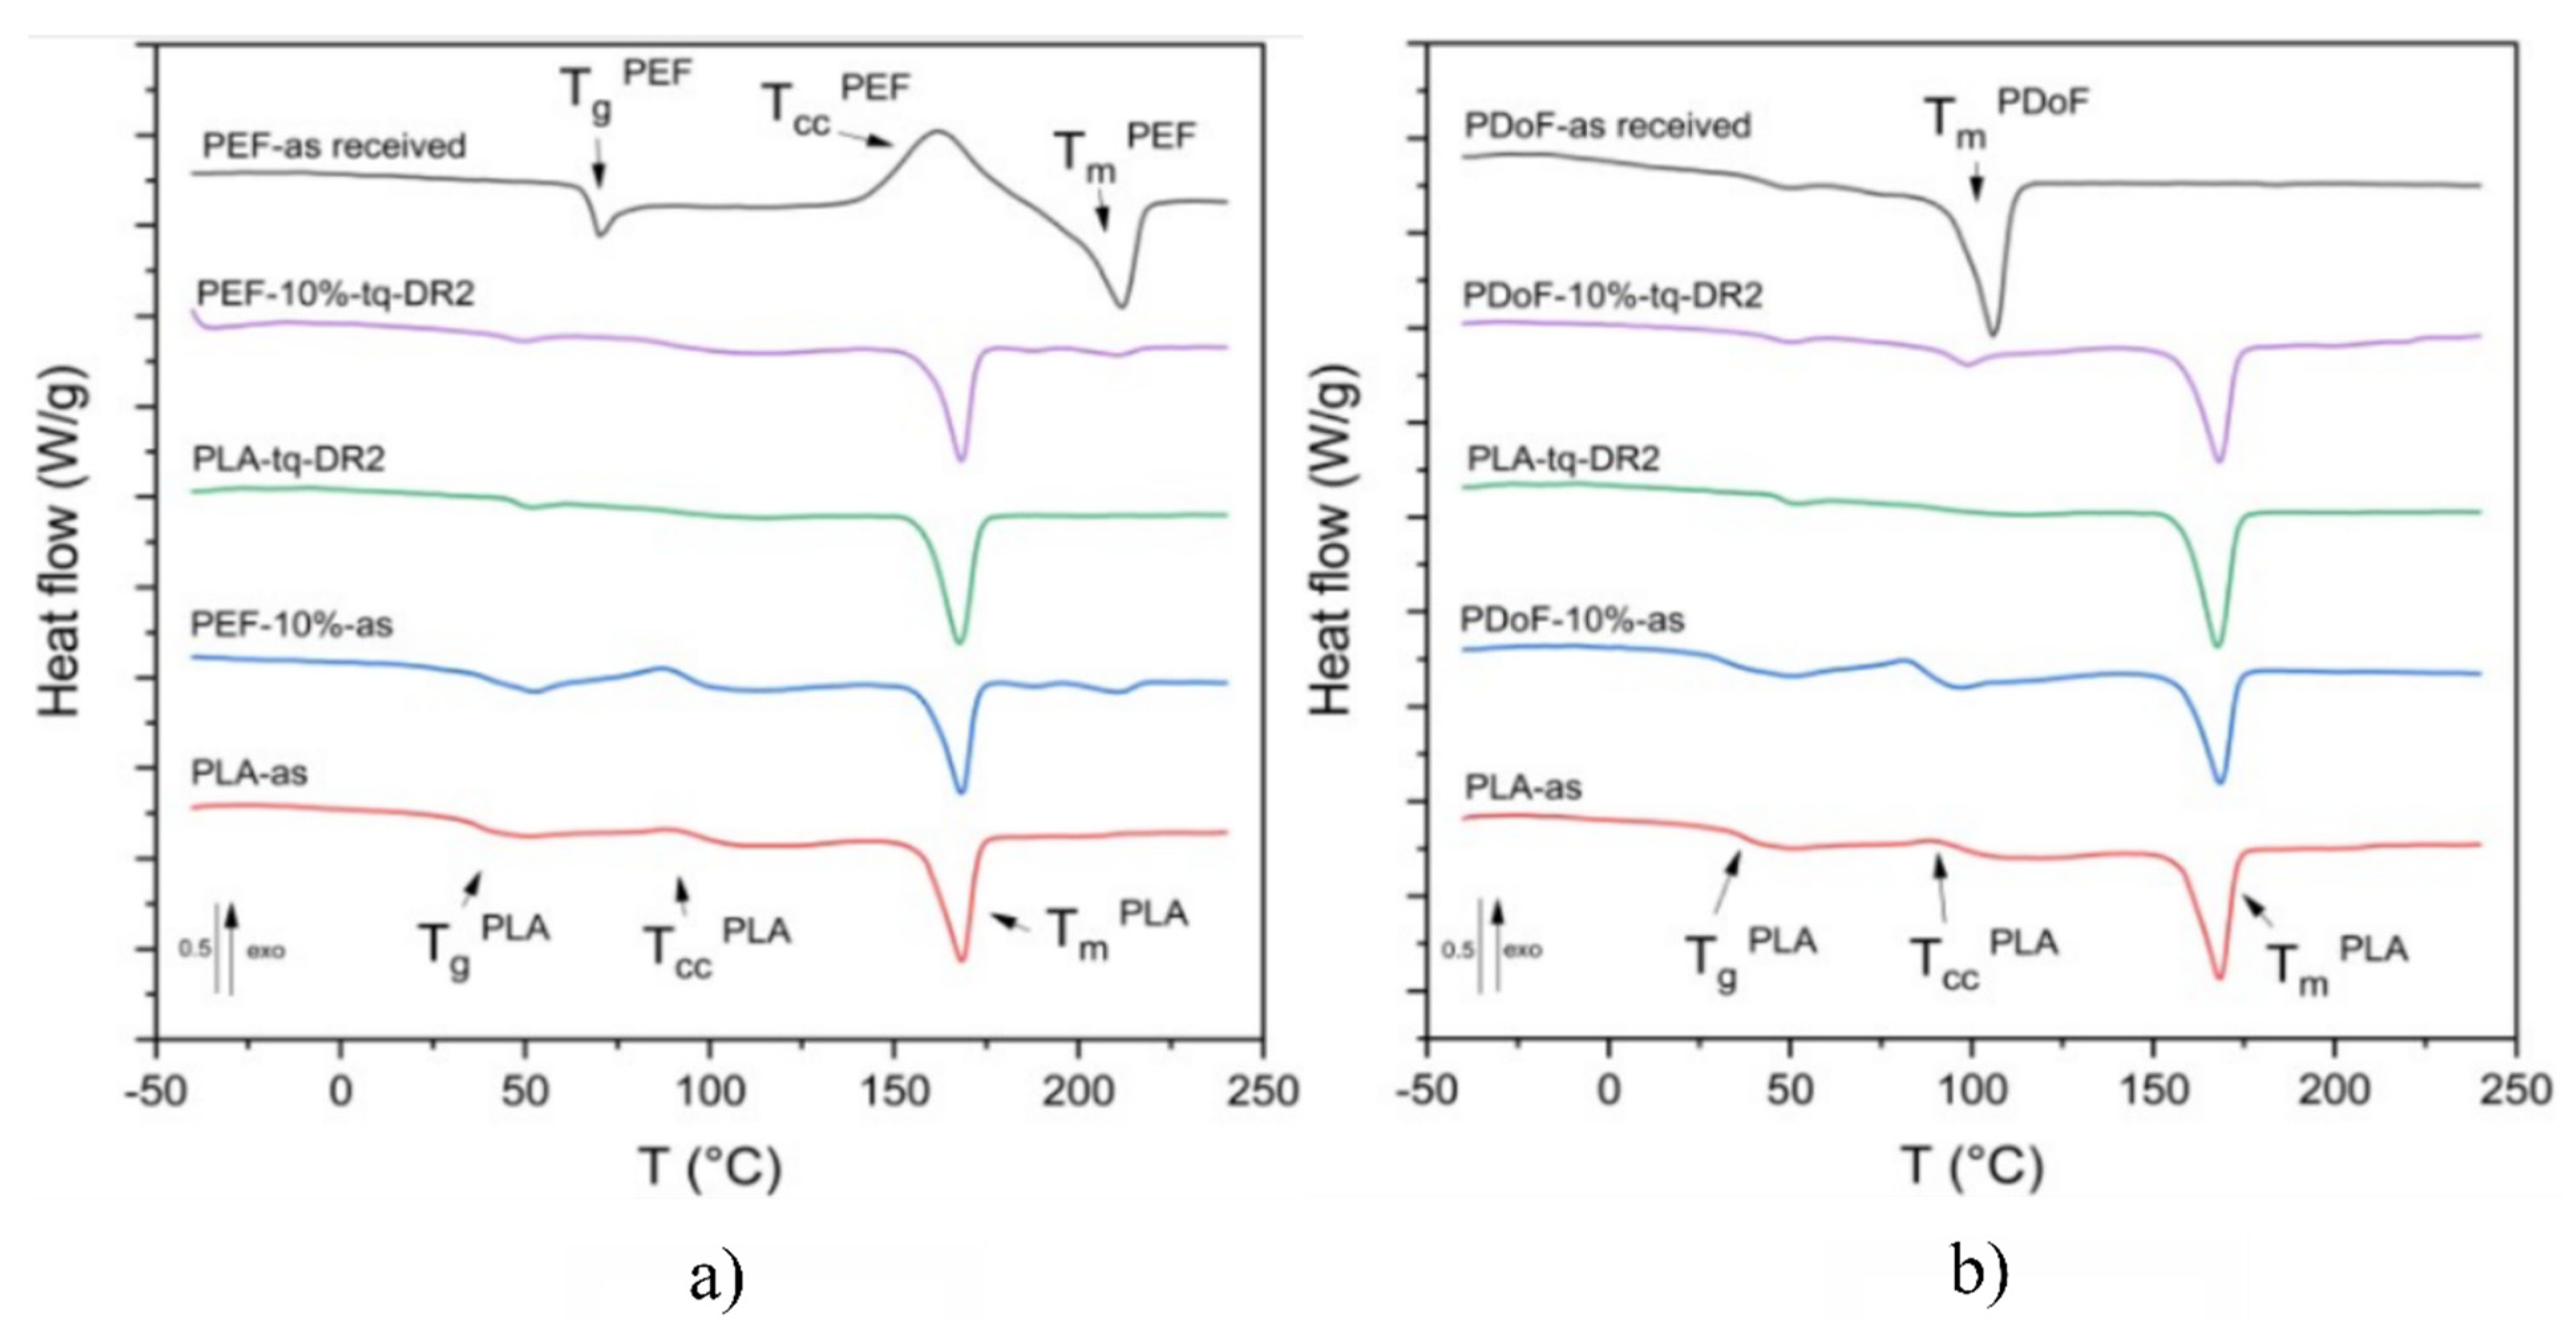
3.2. Thermal Properties
Figure 7a,b report the DSC thermograms of the prepared samples, while the main results are reported in
Table 4.
Figure 7a represents the DSC thermograms (first heating scan) of PLA−as, PEF−10%−as, PEF−10%−DR2, and PEF−as received. The neat−PEF sample presents a glass transition temperature at 68.8 °C, a cold crystallization phenomenon at 161.1 °C, and an endothermic melting peak at 211.6 °C, which is in good agreement with previous results from the literature [
30]. The glass transition of the PLA−as sample was observed at 37.4 °C, which is a lower value below with respect to those found in the literature, which are equal to 55–60 °C [
51]. Such a shift is probably linked to the plasticizing effect of moisture and the residual solvent. The small amplitude of the cold crystallization peak (approx. 85 °C) is probably due to the concurrent evaporation of the residual solvent. This could lead to a slight underestimation of the crystallinity degree of the sample, which has been found to be equal to 32%. The melting temperature for the PLA−as sample is 168 °C, which is consistent with literature values [
51].
Regarding the PEF−10%−as and PEF−10%−DR2 samples, no major differences can be observed between the Tg of the blends and that of neat PLA. Additionally, three distinct melting phenomena were identified in both PEF−10%−as and PEF−10%−DR2 samples at 167.9 °C, 187.5 °C, and 210.9 °C corresponding to the α− and αʹ−crystalline phases of PLA and the crystalline portion of the PEF phase, respectively, thus confirming the immiscibility of the polymers in the crystalline state. Higher crystallinity values were found for the drawn samples compared to the as−spun ones, which is in good agreement with XRD results. Moreover, unlike what was observed with the XRD results, the addition of PEF leads to a lower crystallinity degree, which is likely due to the hindrance effect that the PEF domains induce on PLA chains.
Figure 7b shows the DSC first heating scan thermograms of PLA−as, PDoF−10%−as, PDoF−10%−DR2 fibers, and PDoF−as received. The PDoF−as received sample shows a broad melting event with a peak temperature of 105.5 °C and an associated crystallinity degree of 65 %. The same melting event can be observed in both PDoF−10%−as and PDoF−10%−DR2, where small melting peaks are detectable. Moreover, the values of T
g, T
cc, and T
m of PLA are not different from those of neat PLA fibers, which account for the blend immiscibility, which is in good agreement with the LM and FESEM micrographs and the ATR−FTIR spectra. As expected, the drawn fibers present higher crystallinity than the as−spun samples. In addition, for these blends, and unlike what has been observed with the XRD results, the addition of PDoF leads to lower crystallinity degrees compared to neat PLA, which is probably because of the constraint that the well−distributed domains impose on the PLA chains.
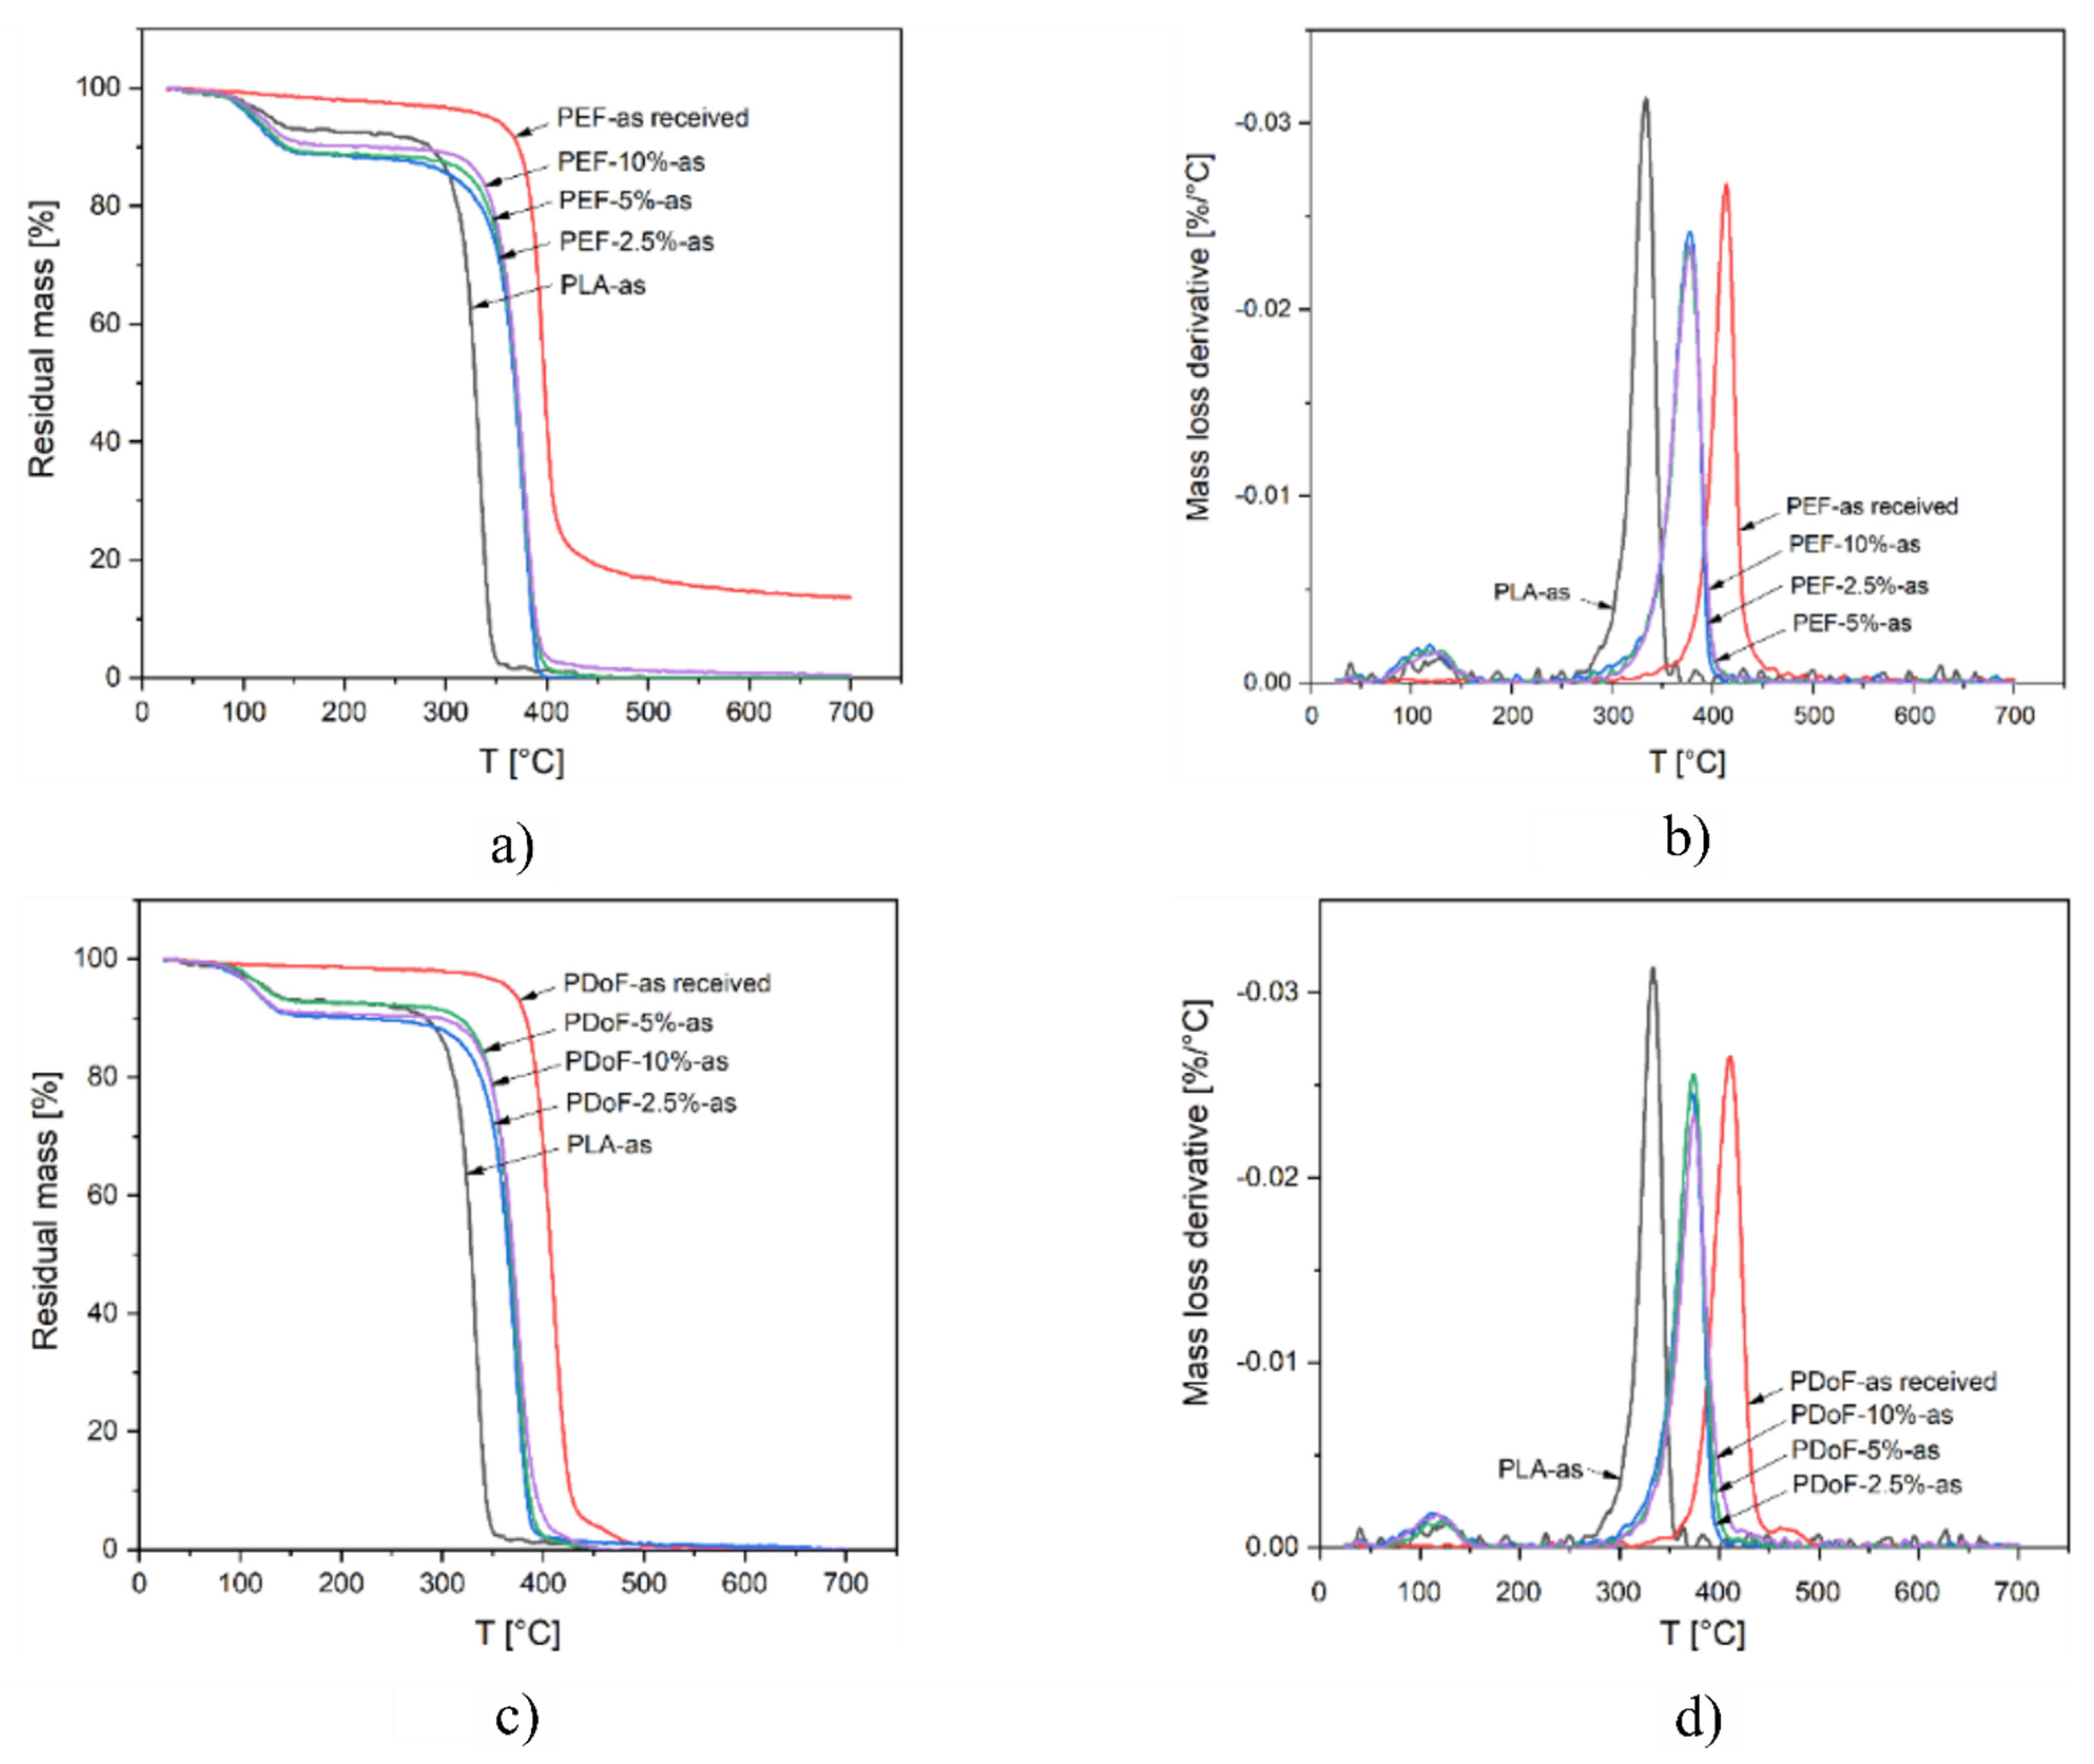
TGA tests were carried out to detect the effect on the thermal degradation resistance played by PAF addition and/or the drawing process.
Figure 8a–d show the TGA thermograms and the derivative thermogravimetric (DTG) curves of PLA, PEF−x−as, and PDoF−x−as fiber blends (with x = 2.5%, 5%, or 10%), and the bulk, PEF, and PDoF samples as received, while the main results are reported in
Table 5. The thermograms of PLA−as, PEF−x−as, and PDoF−x−as (
Figure 8a,c) show a mass loss of 7–11 wt % starting at approx. 90 °C, which is associated with the evaporation of absorbed moisture and residual solvent. This phenomenon is not present in the as−received PEF and PDoF samples, which demonstrates their non−hygroscopic tendency. After this initial mass loss, all samples experience thermal degradation in a single step. For neat PLA, the maximum degradation speed is reached at approx. 333 °C (see T
D values in
Table 5), while for both PAFs, it is at nearly 400 °C. As expected, the value of T
D for the blends is found at intermediate values, being 376–378 °C for the PEF−containing fibers and 372–374 °C for the PDoF−containing ones, but no specific trend can be observed as a function of the PAF fraction. A similar effect can be observed for the onset degradation temperature (T
onset), which is increased from 318 °C of neat PLA to approx. 352 °C of the PLA/PAF blends. Interestingly, the height of the DTG peak (
Figure 8b,d) of all blends is less intense than those of the corresponding parent polymers, which indicates a slower thermal degradation [
52]. These results suggest that the addition of a small fraction of PEF or PDoF improves the thermal degradation resistance of PLA.
3.3. Mechanical Properties
The mechanical properties of the as−spun and drawn fibers were investigated through single−fiber tensile tests in quasi−static mode.
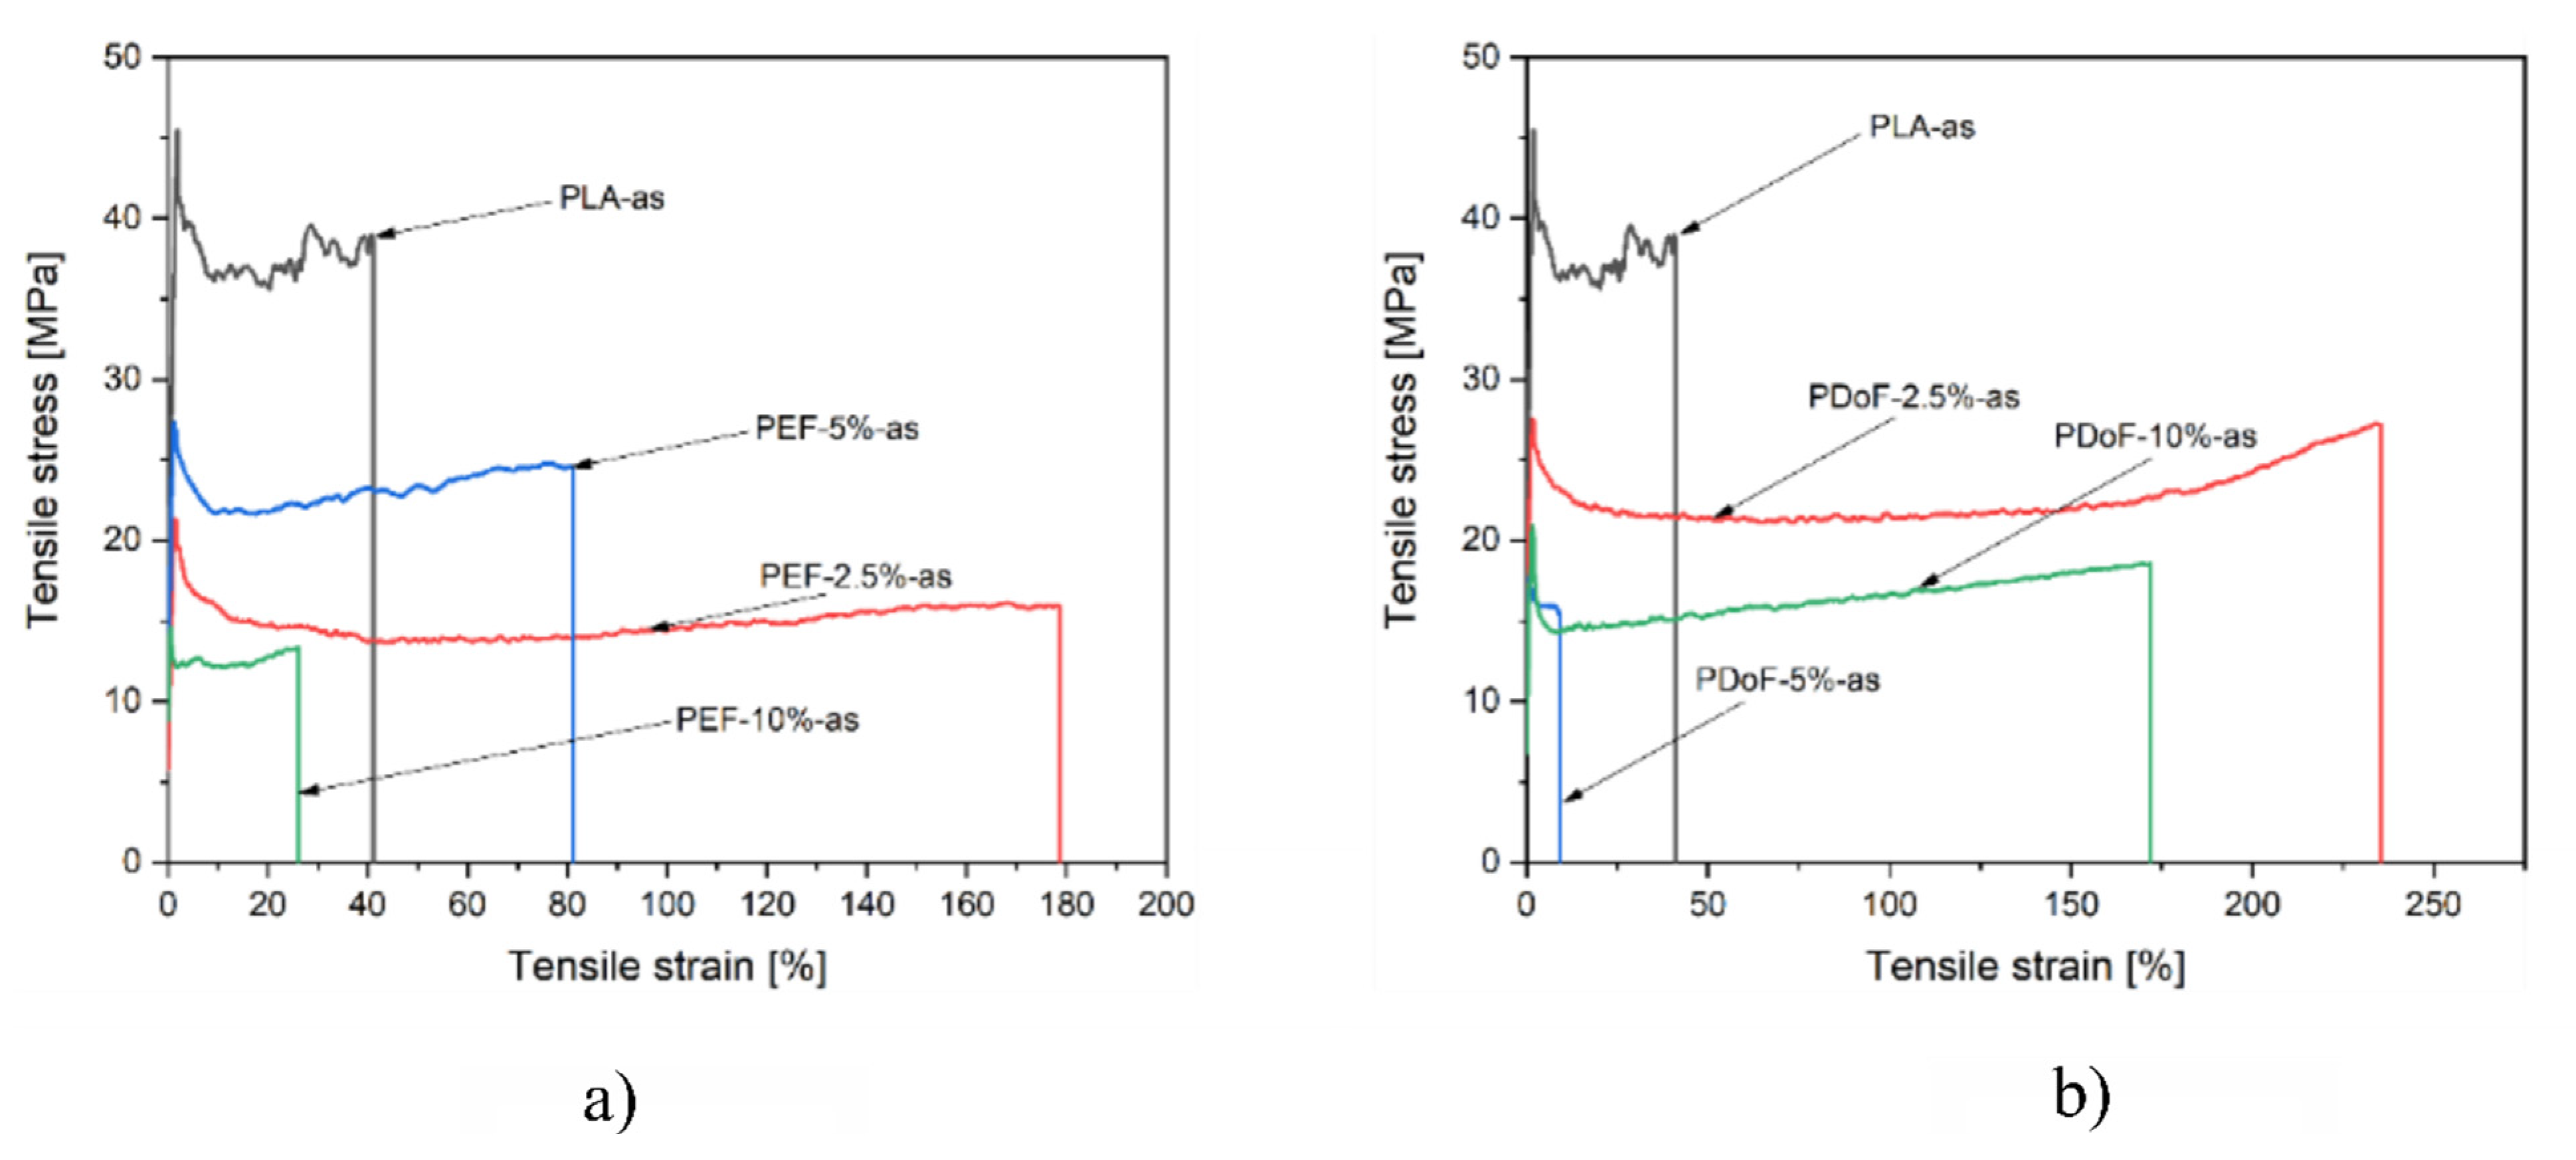
Figure 9a,b report a representative stress–strain curve of the PLA−as, PEF−x−as, and PDoF−x−as (with x = 2.5%, 5%, or 10%.) fiber blends. PLA−as fibers are characterized by relatively high mechanical properties but a limited elongation at break, as expected. Interestingly, through the addition of a small quantity of both PEF and PDoF, the elongation at break of the produced fibers increases noticeably at the expense of the other mechanical properties. As expected, by increasing the amount of PEF and PDoF, a more brittle behavior characterizes the produced fibers. Given the fact that PLA and PEF or PDoF are not miscible, as shown in the microstructural and DSC analysis, the adhesion between the two polymeric phases may be limited, resulting thus in a decrease in the mechanical properties at elevated PAFs contents.
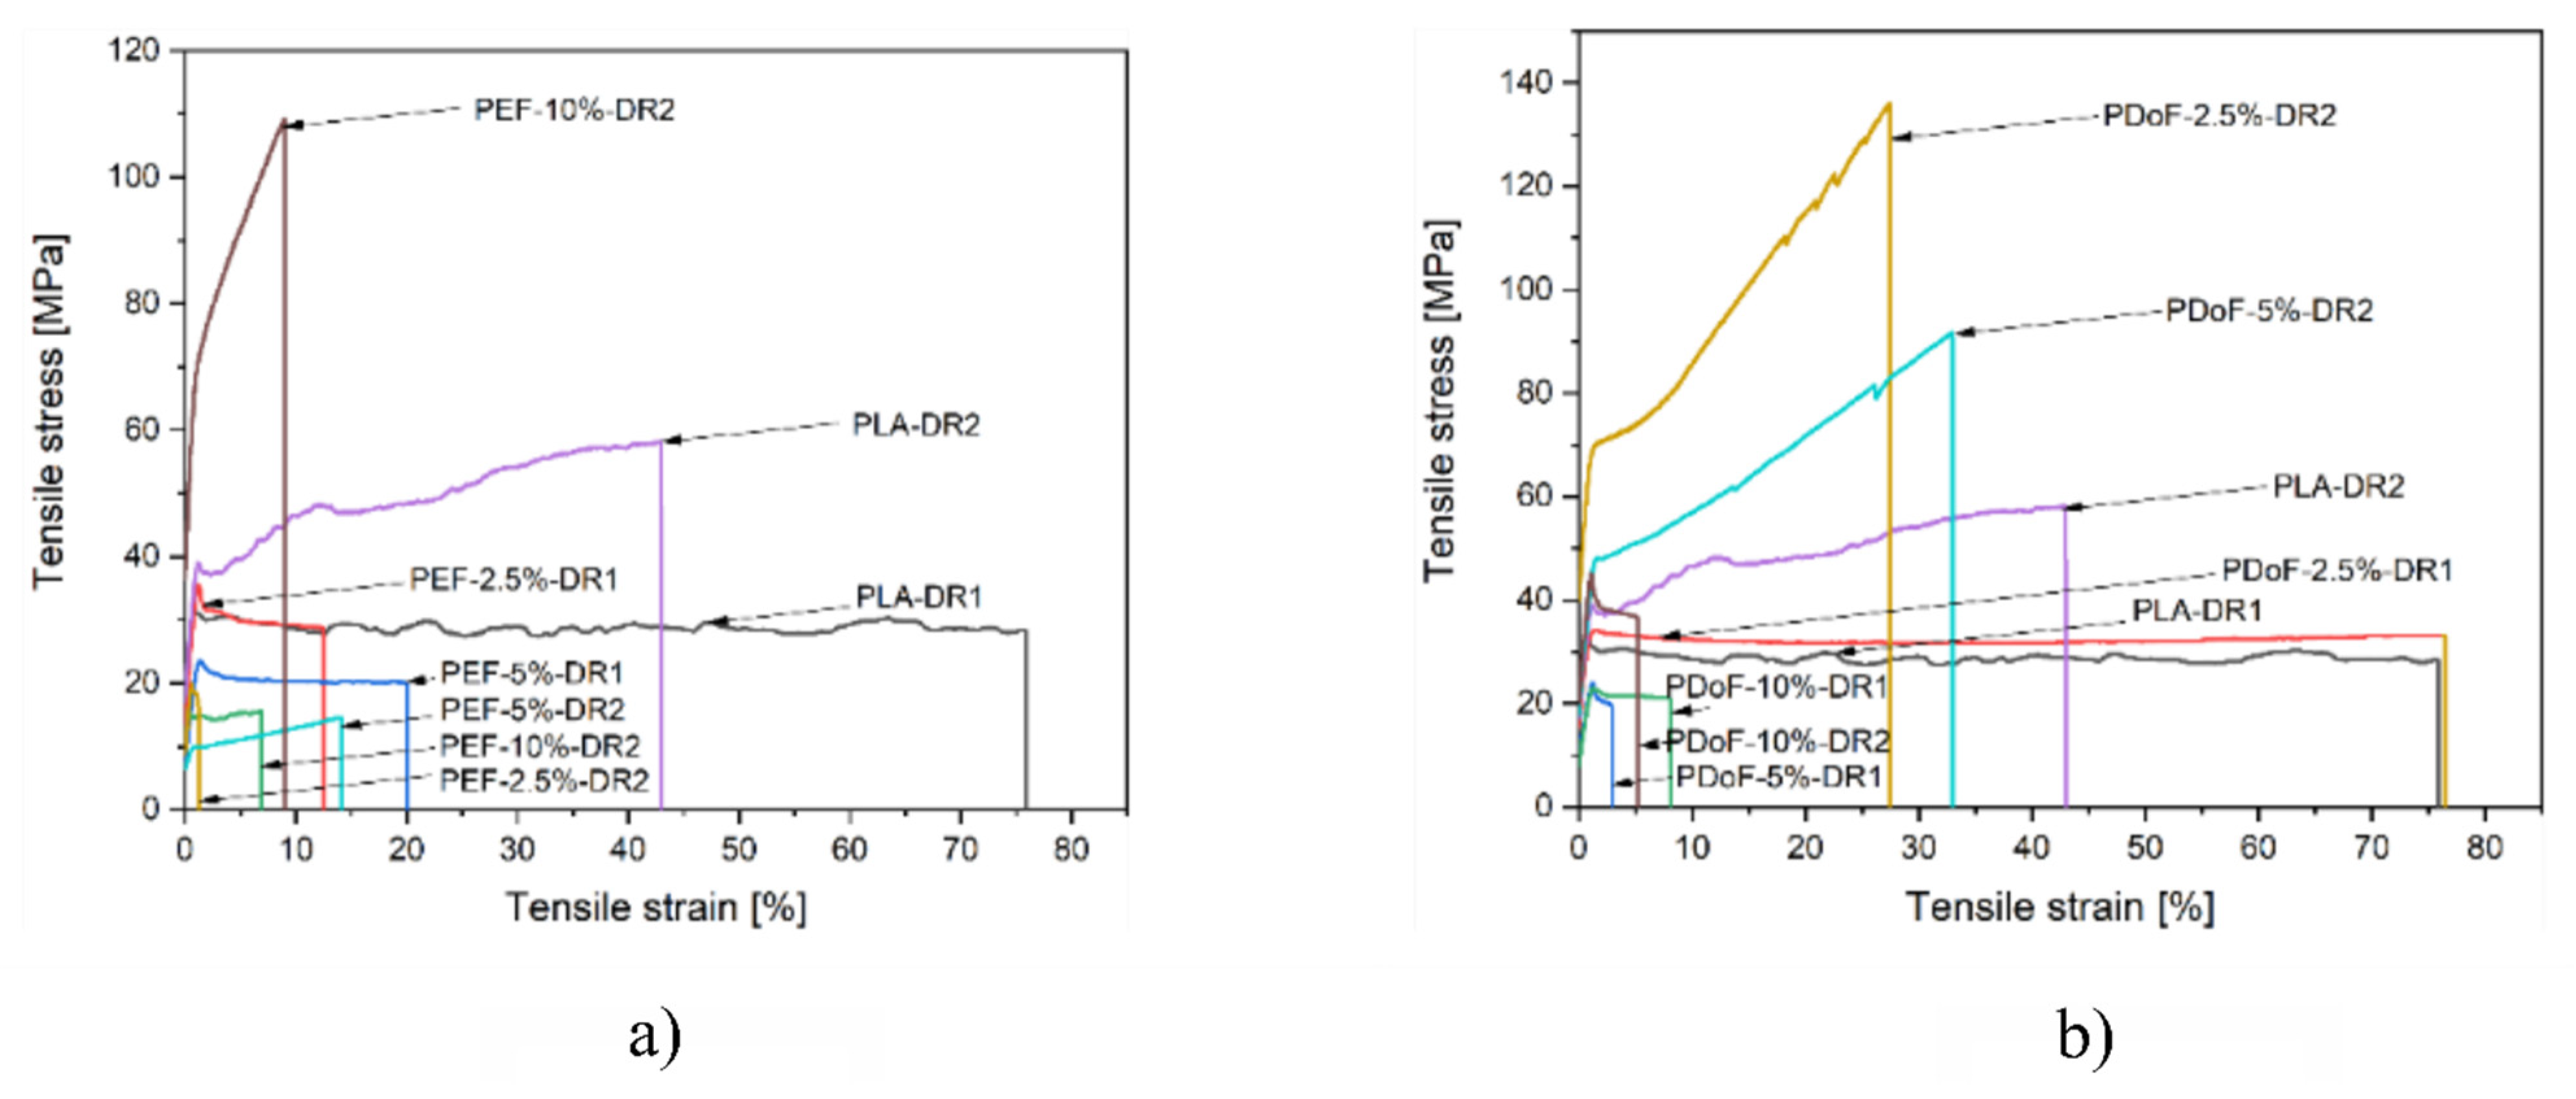
Figure 10a,b report a representative stress–strain curve of the PLA−DR1 and DR2, PEF−x−DR1 and DR2, and PDoF−x−DR1 and DR2 (with x = 2.5%, 5%, or 10%.) fiber blends. The drawing procedure, as expected, improves the mechanical properties compared to the as−spun samples, and it can be appreciated in the compositions PEF−2.5%−DR1 and PDoF−2.5%−DR1. Samples with higher percentages of PEF and PDoF (5 wt % and 10 wt %) drawn with DR = 1 still show lower maximum stress and strain at break values than those of PLA−DR1. Interestingly, by increasing the DR from 1 to 2, the PLA/PEF fiber blends become quite brittle with limited elongation at break and maximum strength. On the other hand, PLA/PDoF fiber blends drawn with higher DR showed higher maximum strength at the expense of the elongation at break. The prepared fiber blends show average elastic modulus and maximum strength values comparable to those of PLA−DR1, which are equal to 2.25 GPa and 35.9 MPa, respectively. The lower values of the elastic modulus and maximum stress of the fiber containing PAFs may also be due to the porosity and lower adhesion between the constituents. The mechanical properties of the blends could be improved by further tuning the wet−spinning parameters and by means of a compatibilizer. The elongation at break values are lower than in the as−spun case: this could also be due to both the drawing procedure and the evaporation of the residual solvent during the drawing procedure; hence, no plasticizing effect occurred.
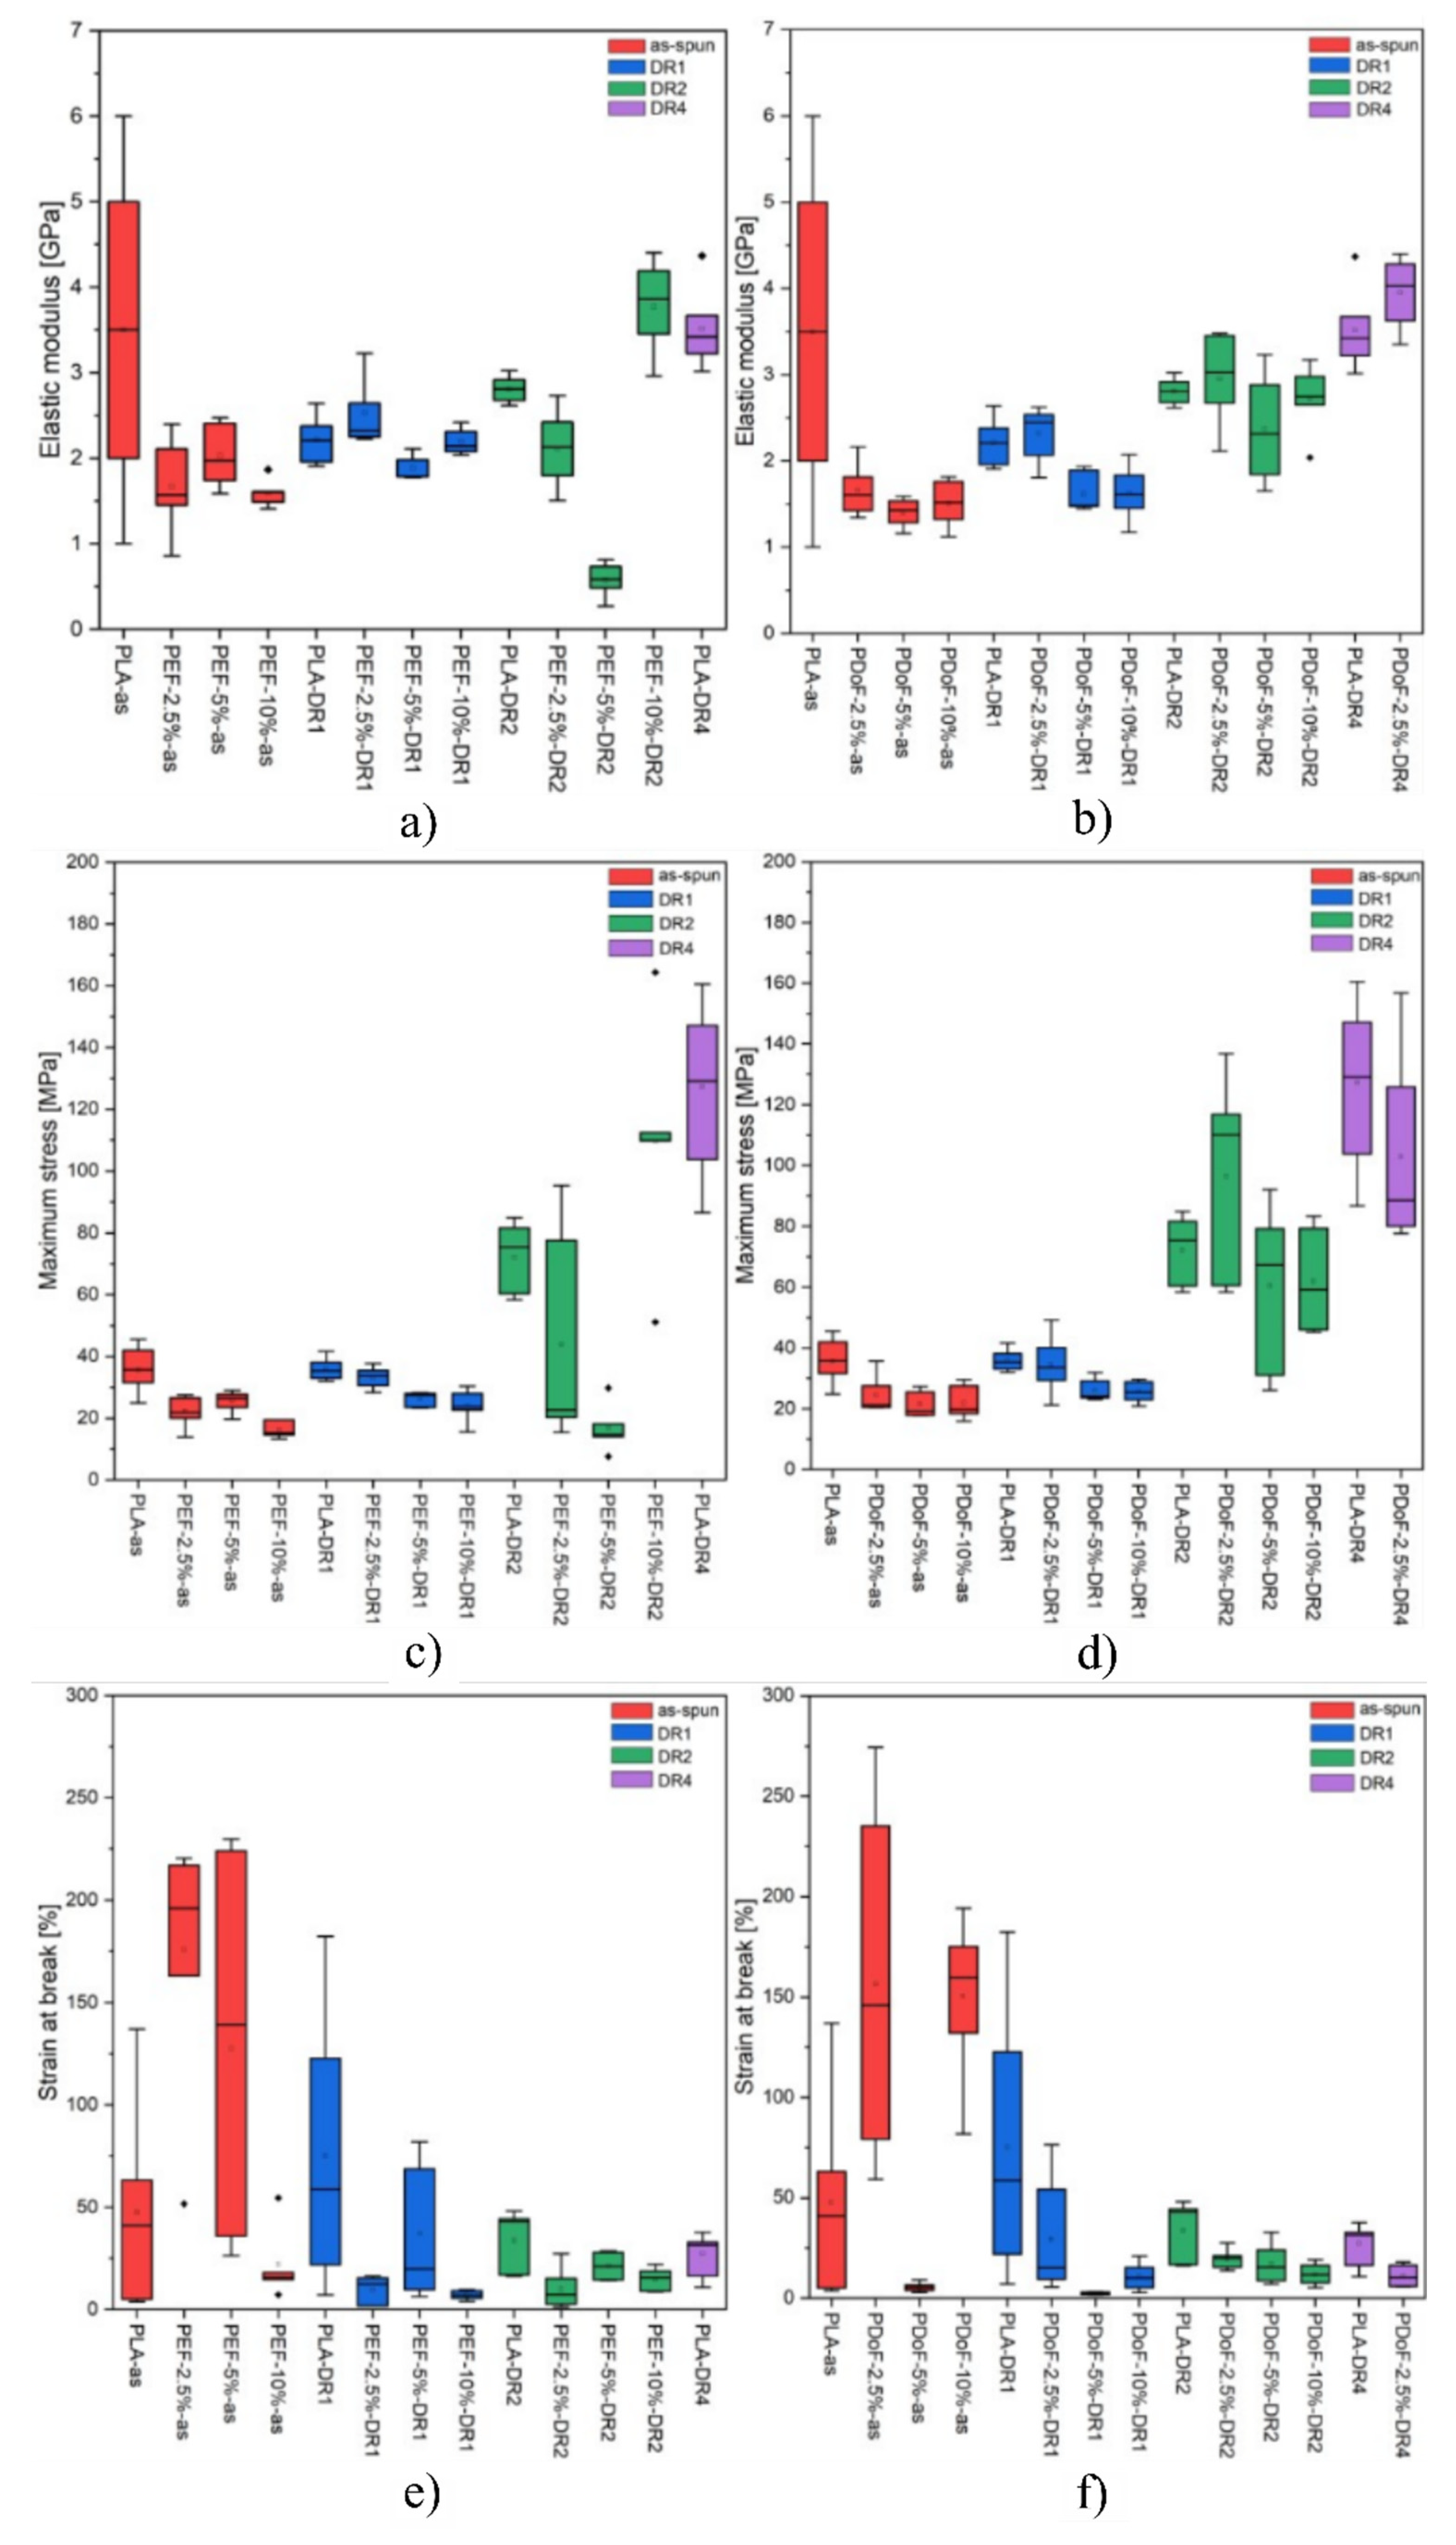
Figure 11a–f represent the boxplot plot of the elastic modulus and maximum stress of the samples grouped according to their composition and drawing procedure.
Figure 11a,b shows the boxplots related to the elastic modulus of all the prepared fibers. As expected, the fibers show an increasing elastic modulus as the DR increases, which can be observed in the PDoF−2.5% samples as it presents an increase in the elastic modulus values at DR4 of approx. 41% with respect to the as spun case. Additionally, this sample also presents an improvement of 7% in the elastic modulus values compared to PLA drawn at the same draw ratio. The PAF domains in the as−spun samples possibly act as defects when included in larger percentages, also because of the low adhesion between PLA and the PAFs, as the elastic modulus values of the fiber blends were lower than that obtained for PLA. The increasing draw ratio elongated the PAF domains in the blends, leading to a domain size reduction of approx. 14%, thus possibly acting as a reinforcement of the PLA matrix. Moreover, the addition of furanoates does not significantly alter the elastic modulus values.
Figure 11c,d shows the boxplots related to the maximum stress of all the prepared fibers. The maximum tensile stress is 15 MPa lower (average values) for the as−spun fibers containing furanoates with respect to the PLA−as sample. By increasing the draw ratio, higher maximum stress values can be detected, as expected, although a higher scattering of the values is found. An improvement of up to 66% in the maximum stress values can be seen in the drawn fiber blends compared to the PLA−DR1 sample.
Figure 11e,f show the boxplots related to the strain at break of all the prepared fibers. High ultimate strain values are reached by the as−spun samples, with average deformations up to almost 200%, which is supposed to be due to the higher solvent content present in these specimens with larger diameters. As the draw ratio increases, the fiber stretching reduces the fiber diameters. Moreover, the drawing procedure was carried out at 80 °C, which is a sufficient temperature for the evaporation of the chloroform and/or HFIP, which could have still been present in the specimens, as seen in the TGA analysis. No consistent correlation d can be thus highlighted between the furanoate content in the blends and their deformation at break.
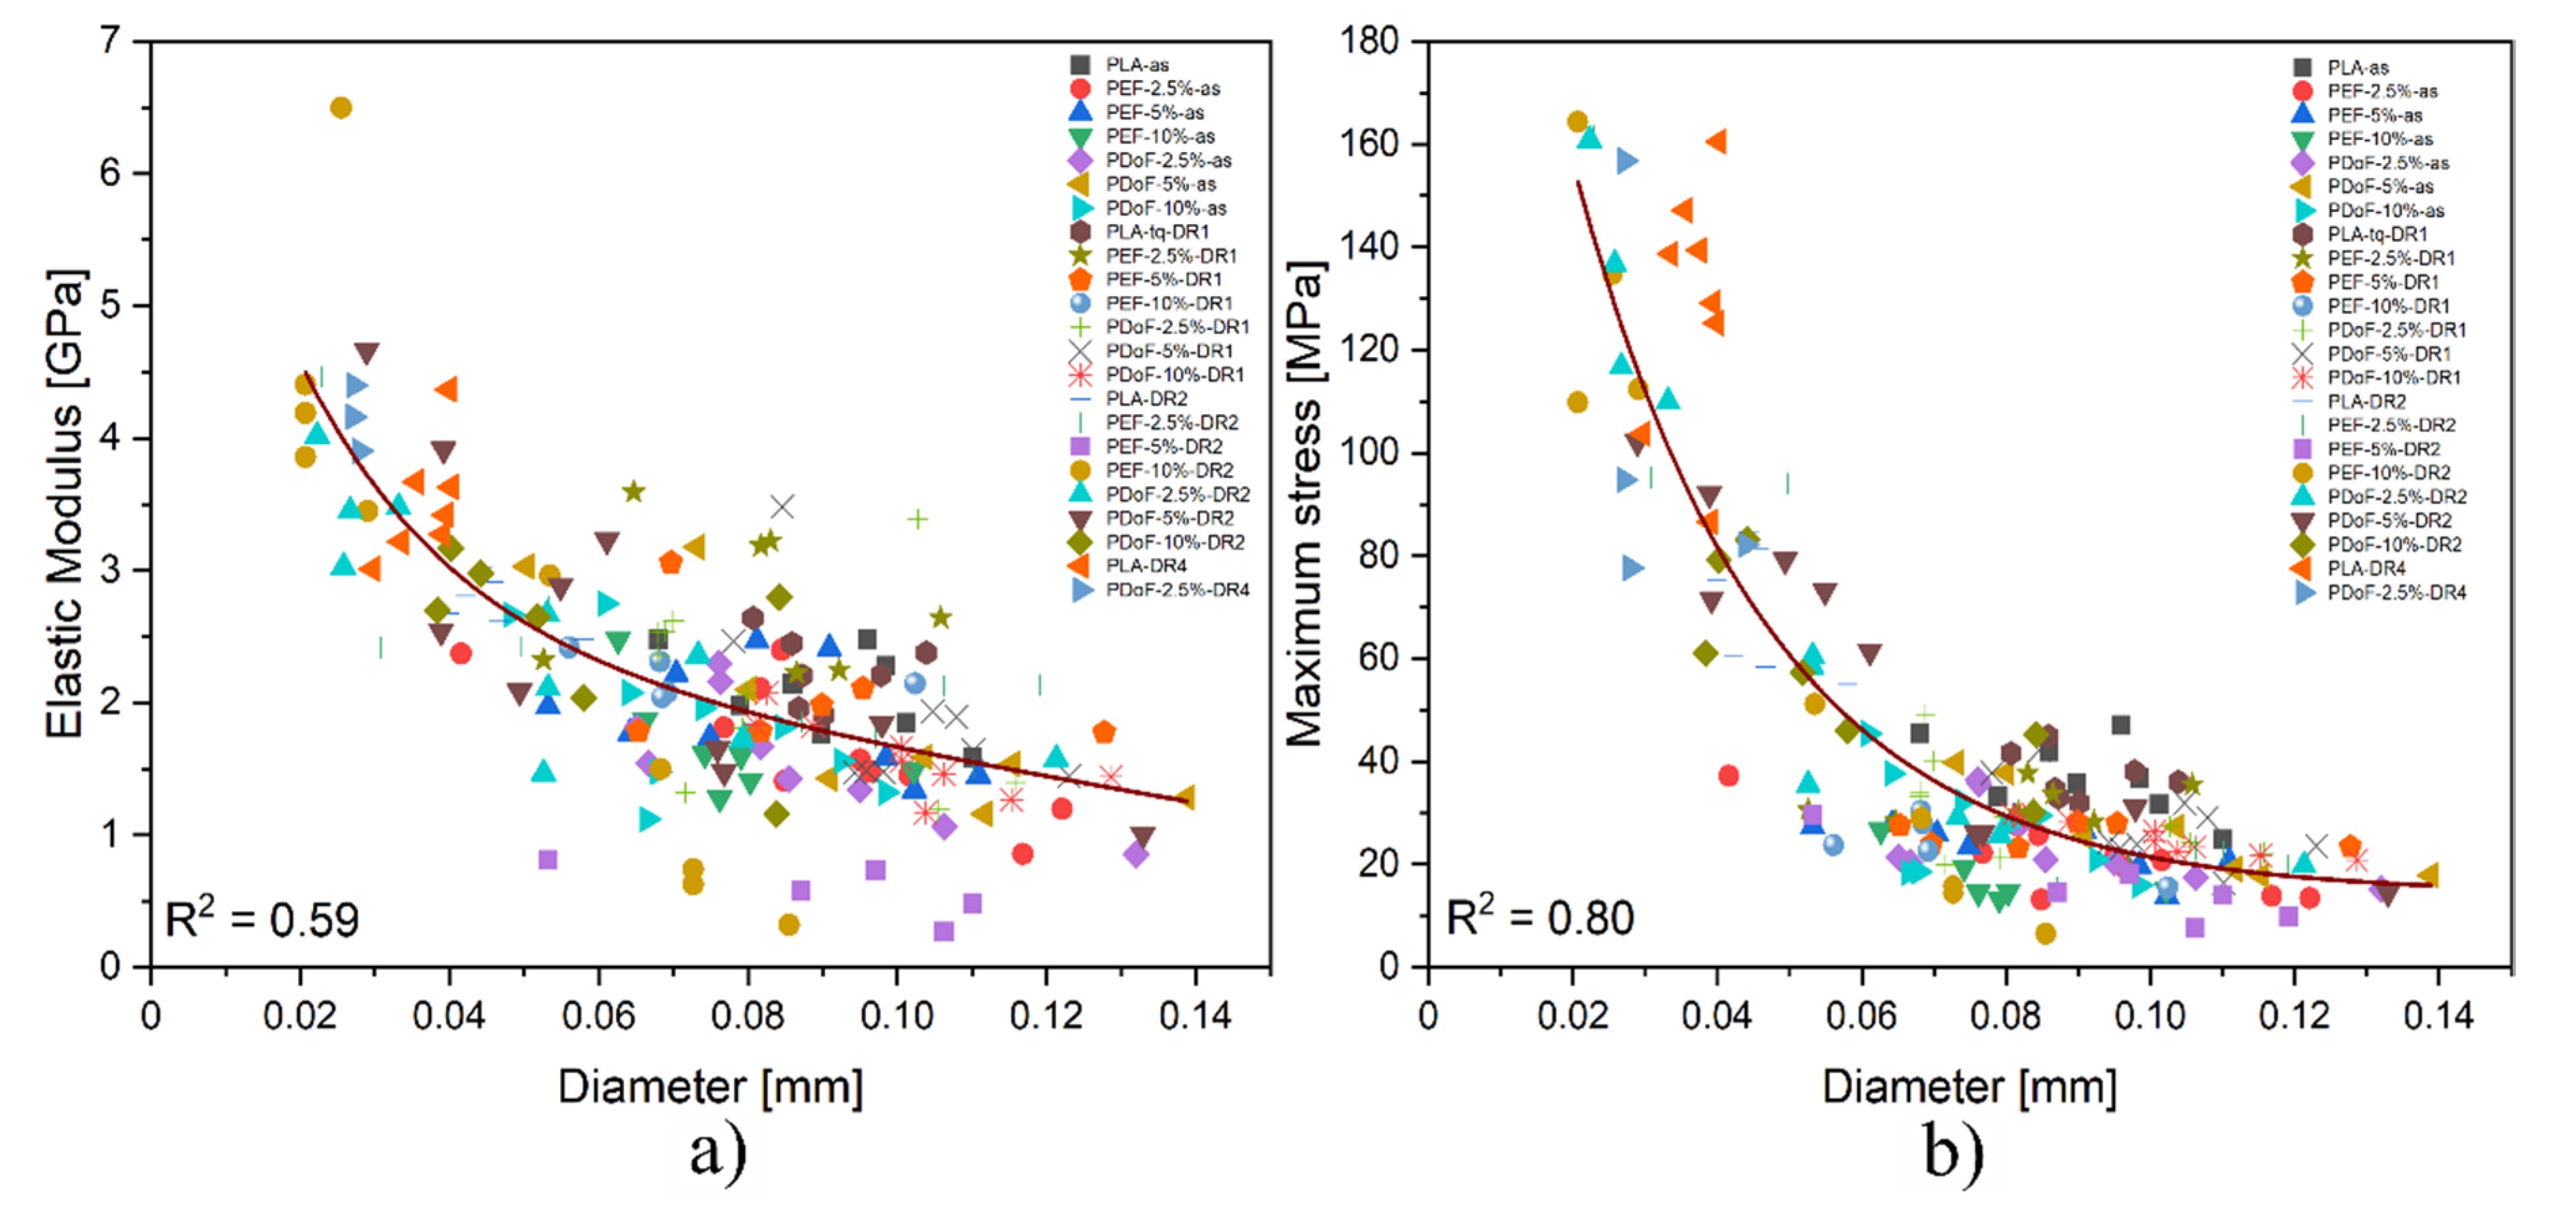
It has to be considered that due to the experimental uncertainties connected to the preparation procedure, the final diameter of the fibers could strongly affect their mechanical properties. Therefore, a comprehensive analysis that correlates the stiffness and the strength of the obtained fibers with their diameter is required.
Figure 12a,b show the trend of the elastic modulus and maximum stress as a function of the fiber diameters. Both the elastic modulus (E) and maximum stress (σ
max) present an exponential dependence on the fiber diameter, with R
2 values of 0.59 and 0.80, respectively, thus explaining the large scattering of the results obtained from the tensile tests.
In addition to the effect played by the different DR applied, fibers presenting larger diameters show a plastic behavior because of the presence of residual solvent, whose presence was confirmed also by the TGA results. The samples with smaller dimensions contain less solvent, as they could be more easily removed.
Table 6 summarizes the values of titer and tenacity of all the prepared fibers. Comparing the tenacity of the prepared PLA fibers with the literature values [
53], those reported in this work are 10 times lower. Such a difference may be due to the high porosity of the fibers, the limited draw ratio applied, and the different spinning techniques adopted. Moreover, the addition of furanoates slightly lowered the tenacity values with respect to PLA fibers. This may be due to the non−circular geometry of the fibers and also to the low compatibility between the two, which may eventually have led to low adhesion. The tenacity of the drawn PLA fibers did not improve upon drawing, whilst a great improvement in the tenacity values can be observed for the fiber blends containing PAFs. The positive effect of the drawing procedure on the tenacity is probably due to the decrease in the overall diameters of the PAFs domains, together with the fiber’s diameters, and thus, they no longer act as defects.
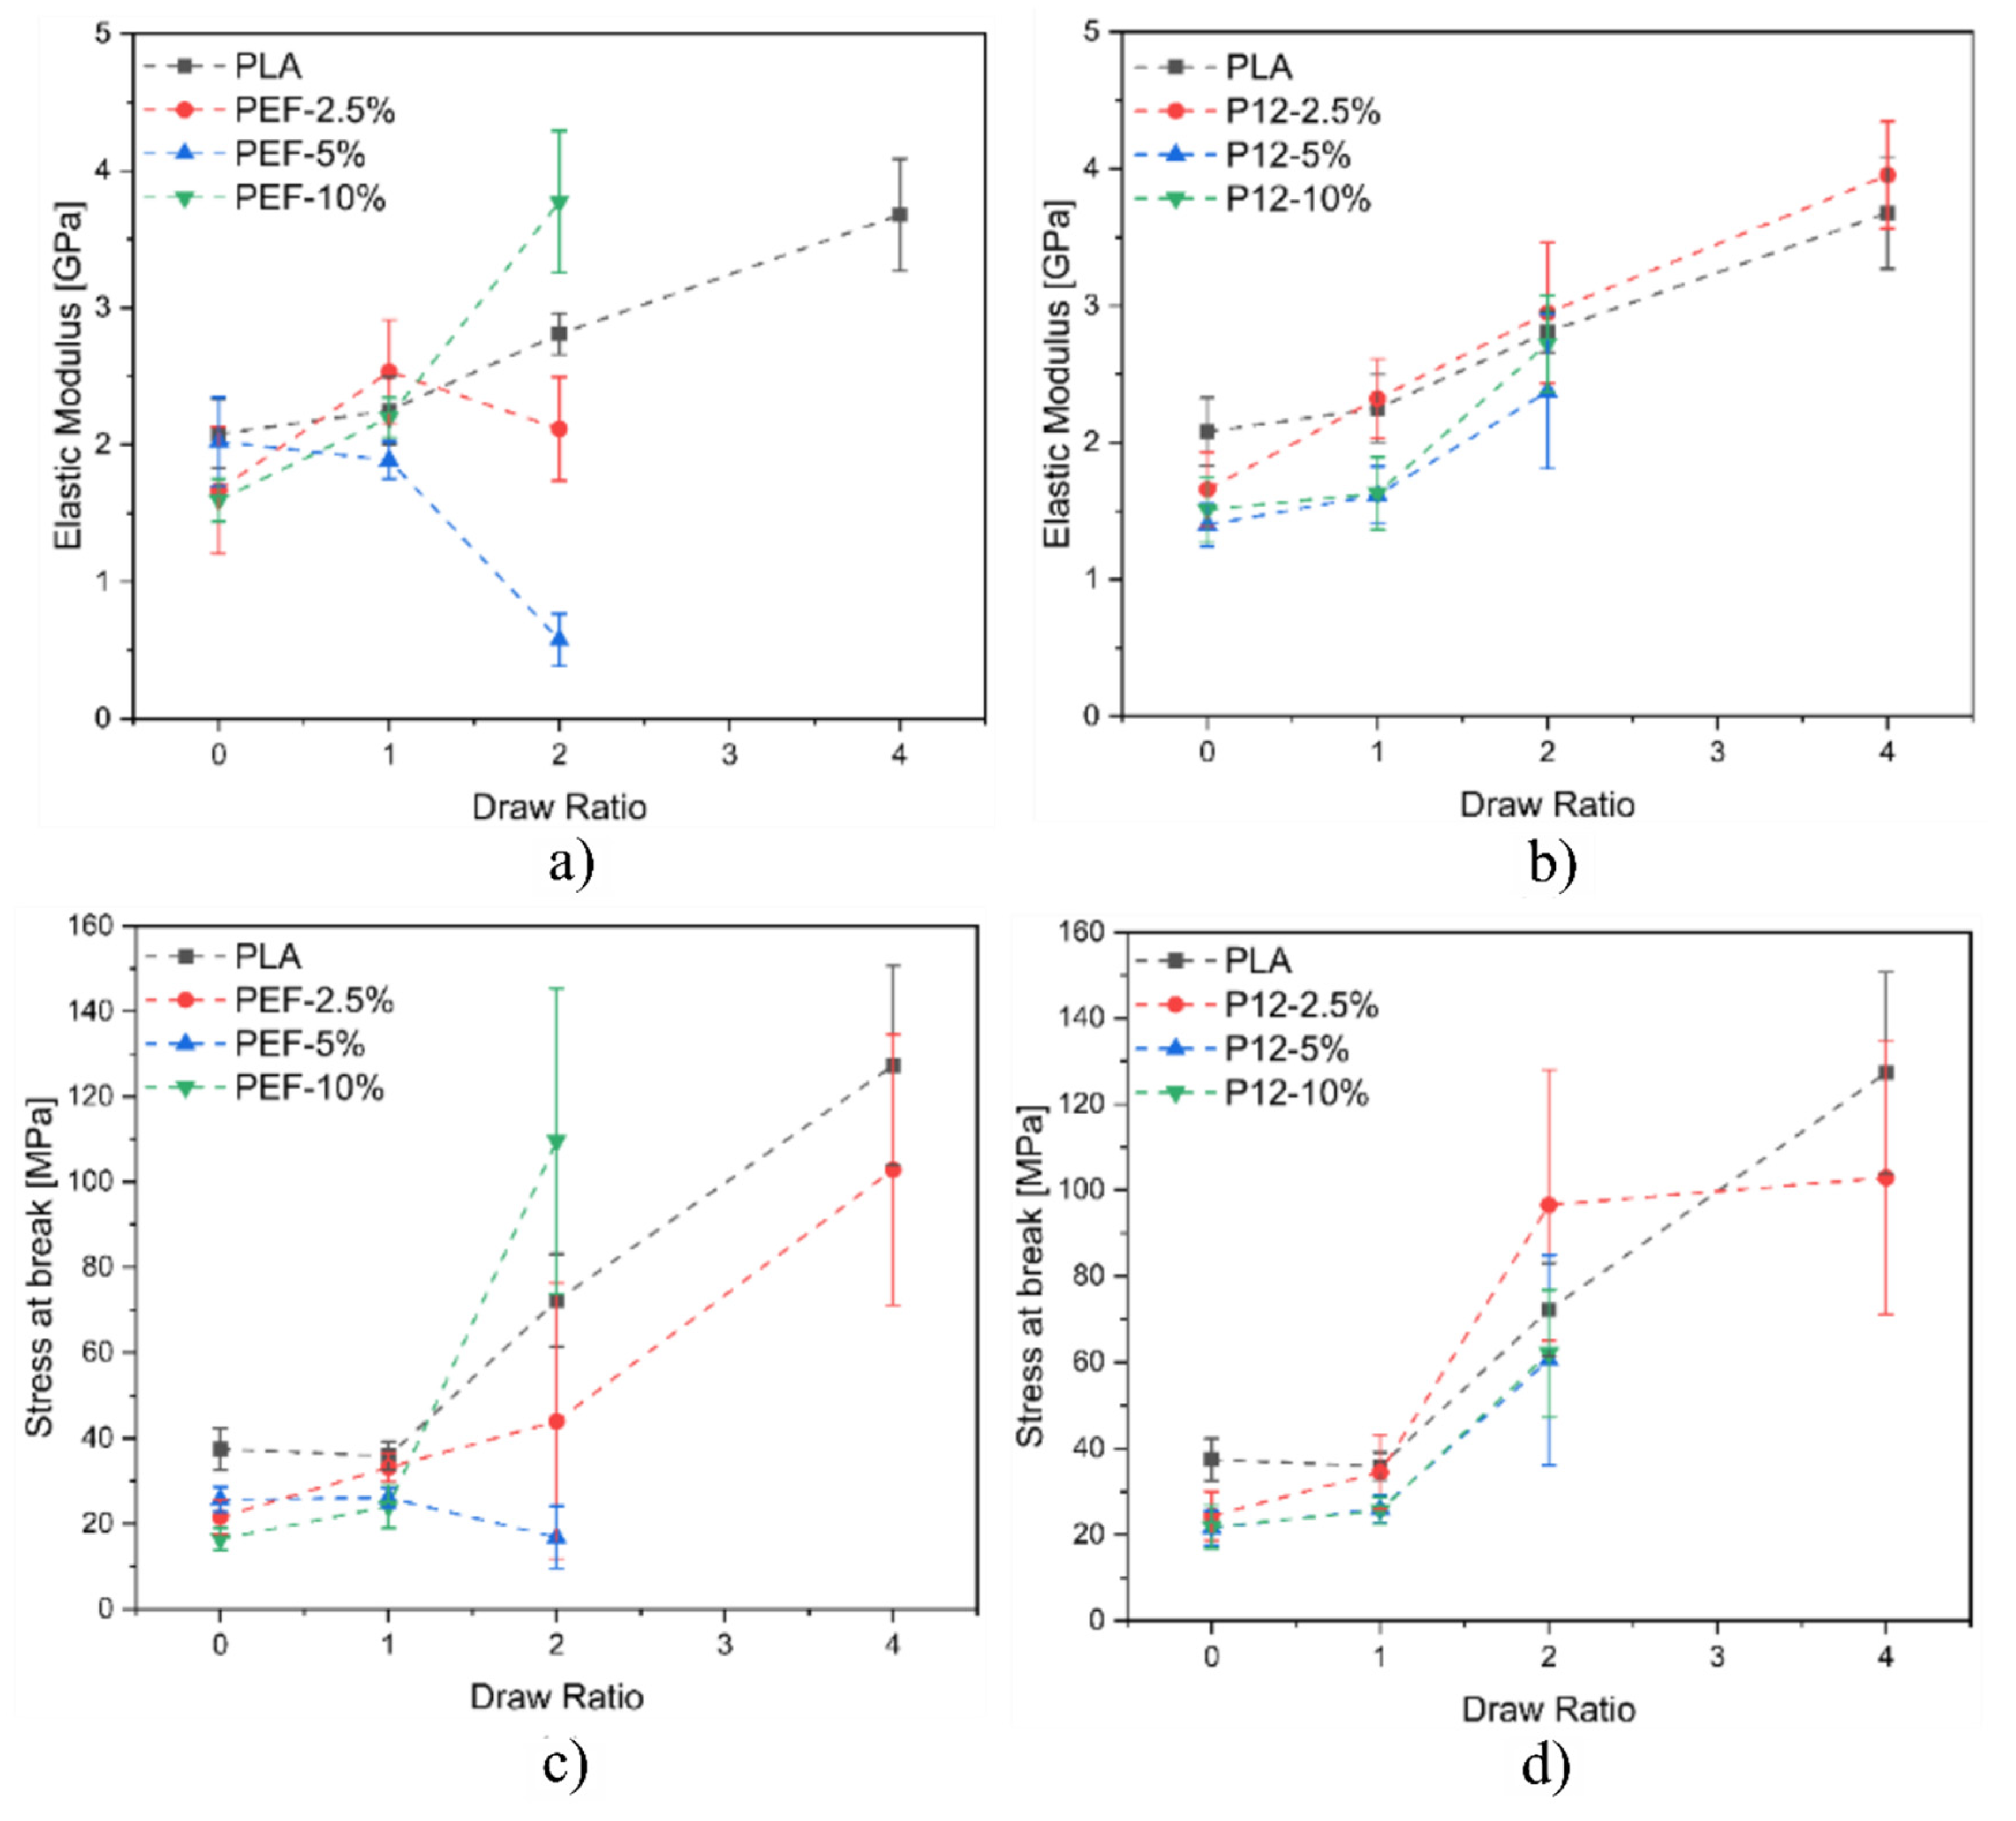
Figure 13a,b show the plots related to the elastic modulus of all the prepared fibers as a function of the DR, while
Figure 13c,d show the plots related to the maximum stress of all the prepared fibers as a function of the DR. Concerning the blends containing PEF, it is possible to notice that the elastic modulus does not substantially increase by increasing the DR. On the other hand, the fiber blends PEF−10% reported a significant increase in the elastic modulus at DR = 2. As expected, PLA fibers report an increase in the elastic modulus as a function of the DR. Regarding PLA/PDoF fiber blends, it is possible to notice that the elastic modulus increases for all the compositions as a function of the DR. This could be explained by the different morphology of the fiber blends. PLA/PEF presents several domains of PEF distributed inside the PLA matrix, while PLA/PDoF reports small and homogenously distributed PDoF domains inside the PLA matrix. The improved domain distributions of PDoF fiber blends result in an improved distribution of the loads inside the fibers in comparison to the poorer domain distributions of PEF fiber blends. In conclusion, as expected, for both fiber blends, it is possible to notice that the stress at break increases by increasing the DR due to the improved alignment of the polymeric chains.


 ,
, 


