
Improving the Wet-Spinning and Drawing Processes of Poly(lactide)/Poly(ethylene furanoate) and Polylactide/Poly(dodecamethylene furanoate) Fiber Blends


 ,
,  , , ,
, , ,  ,
,  ,
,  and
and 
Abstract
:1. Introduction
2. Materials and Methods
2.1. Materials
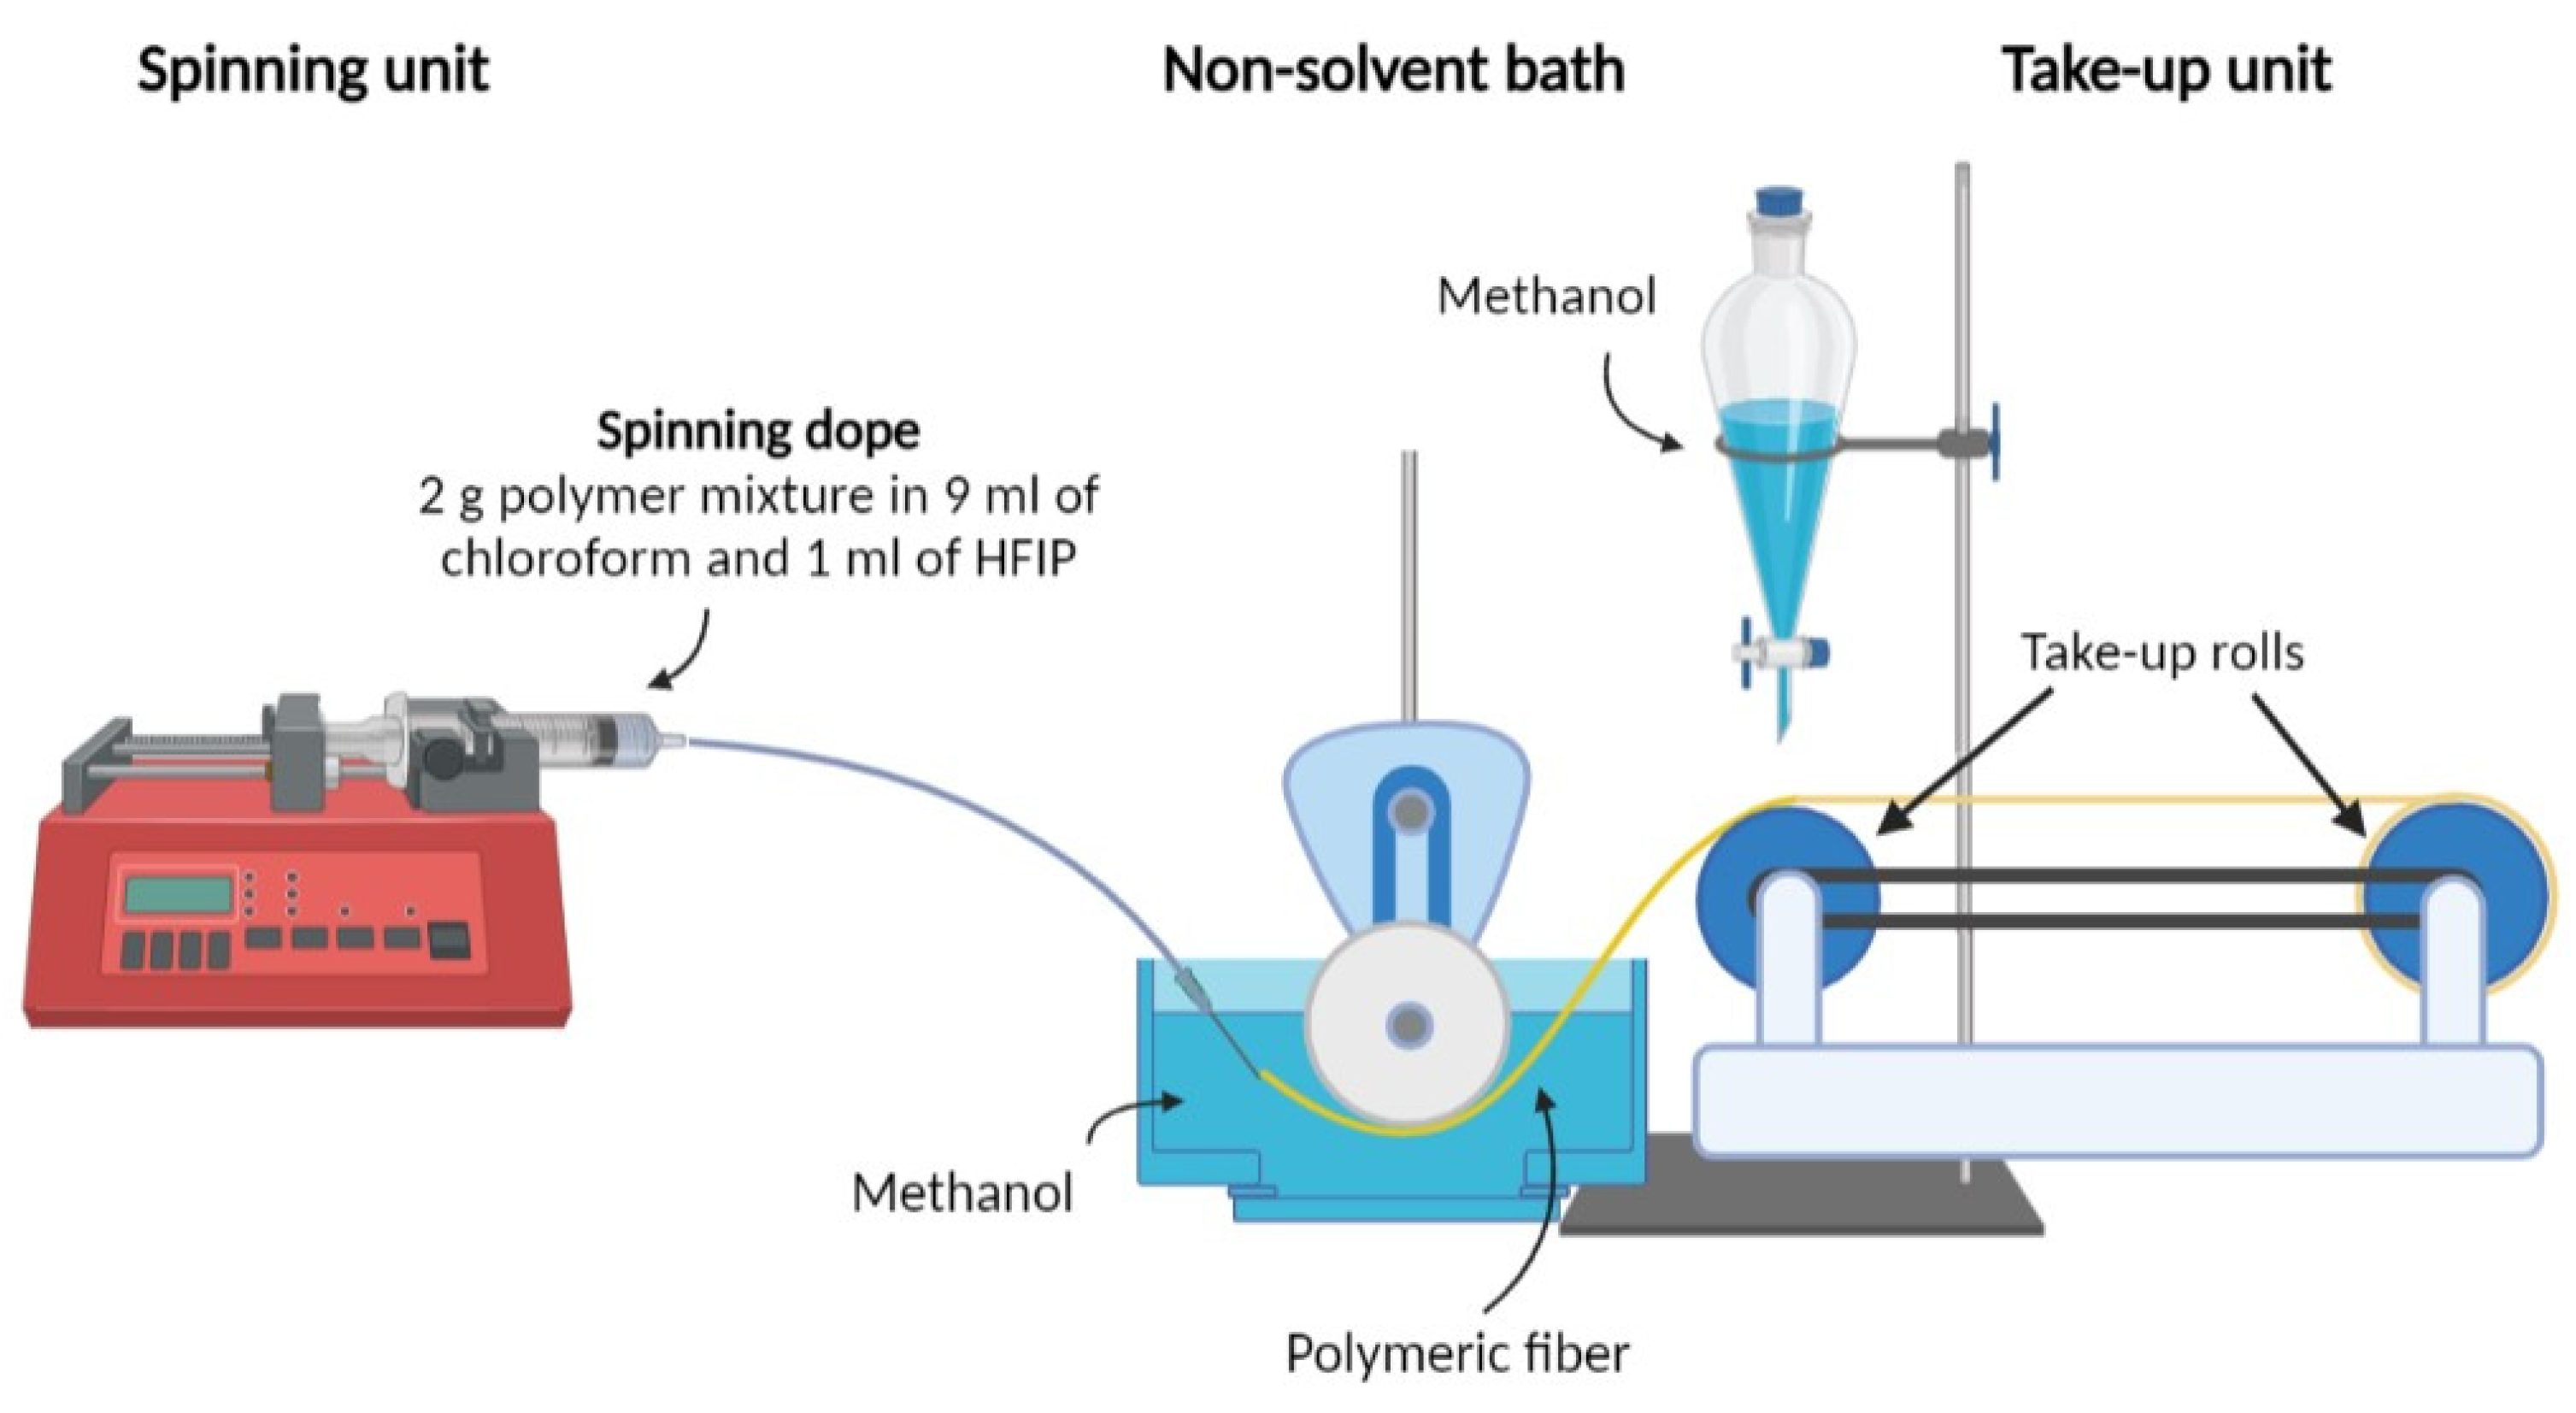
2.2. Fiber Spinning
2.3. Fiber Drawing
2.4. Experimental Techniques
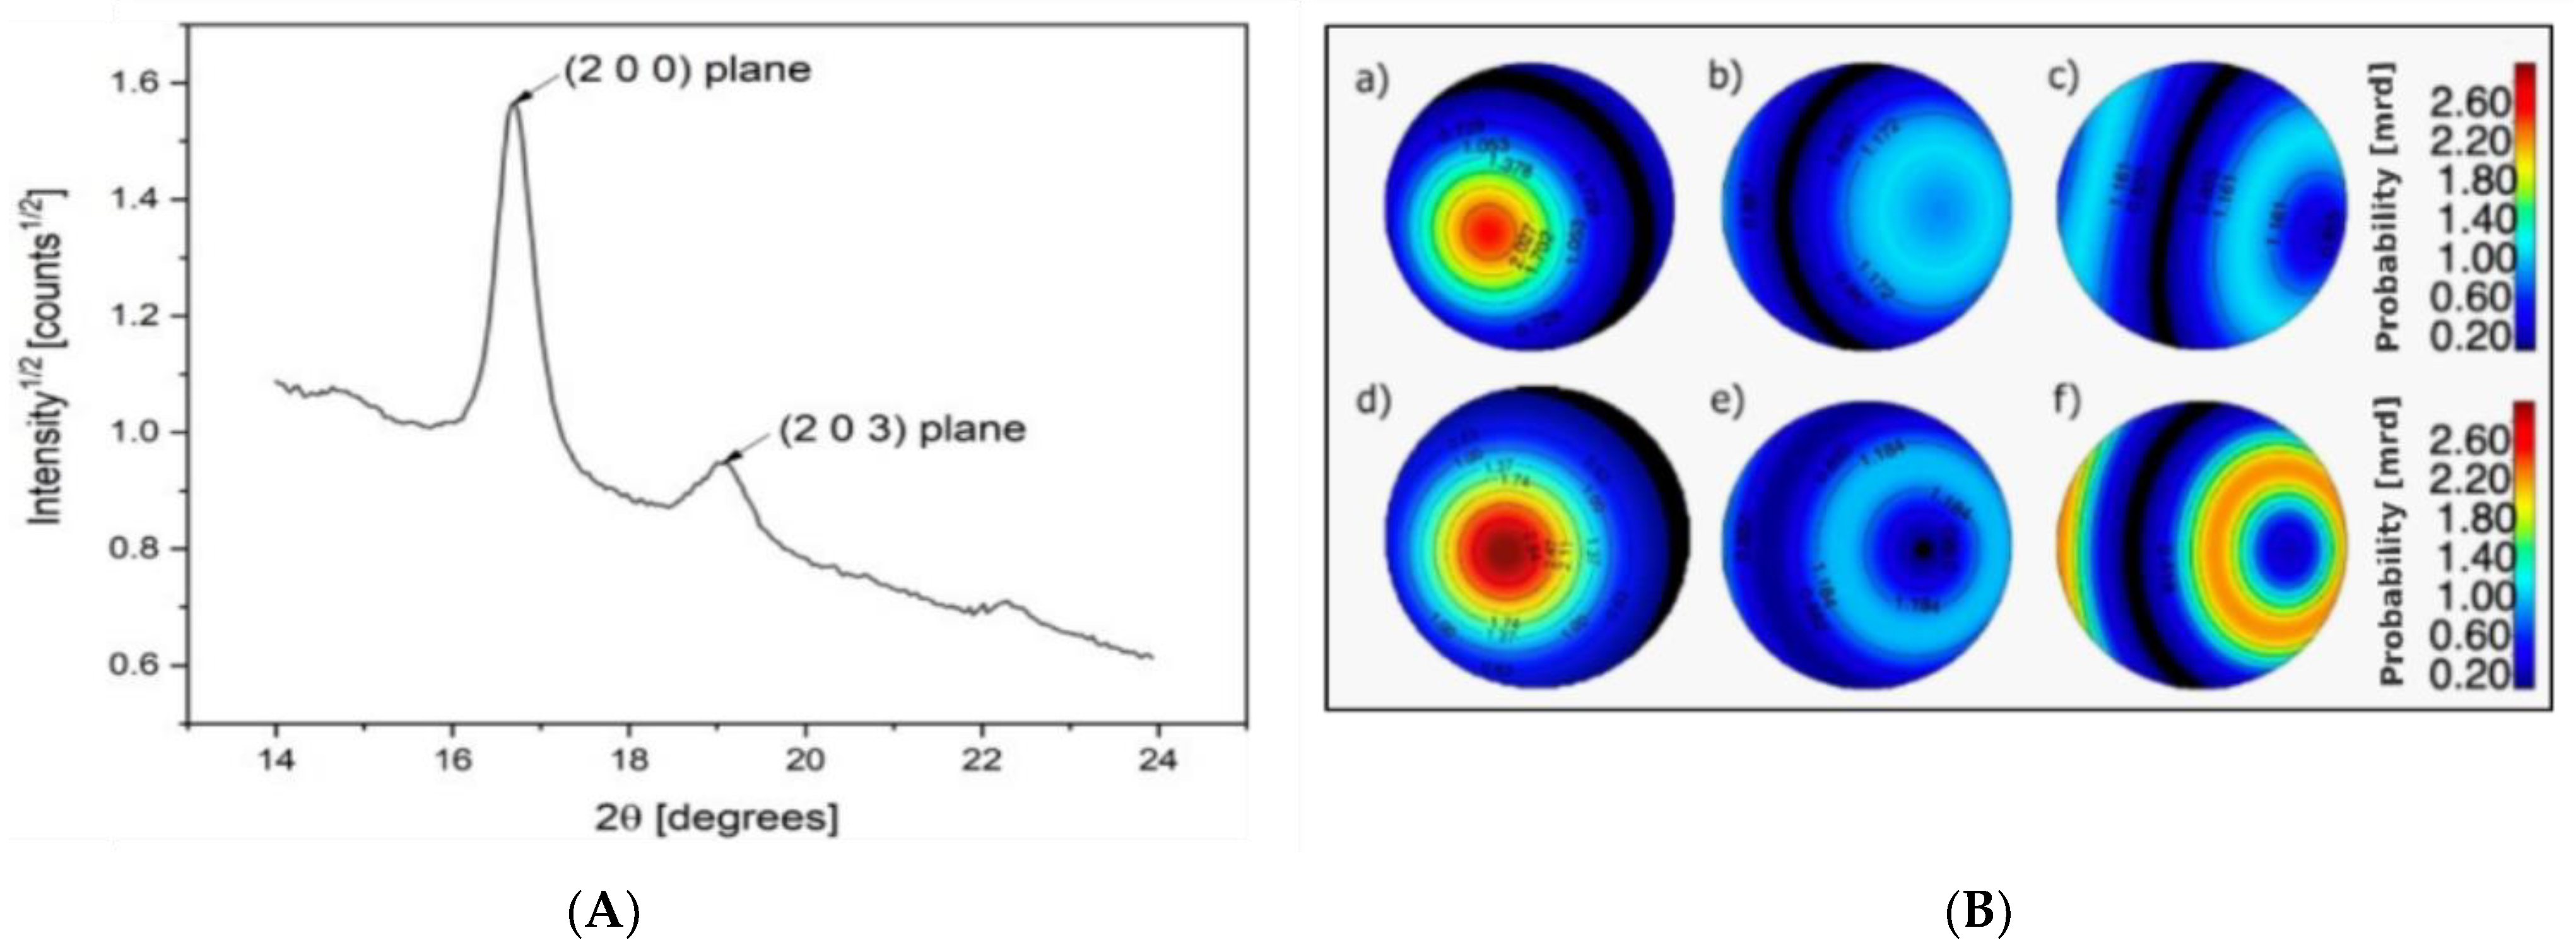
2.4.1. Microstructural Properties
2.4.2. Thermal Properties
2.4.3. Mechanical Properties
3. Results and Discussion
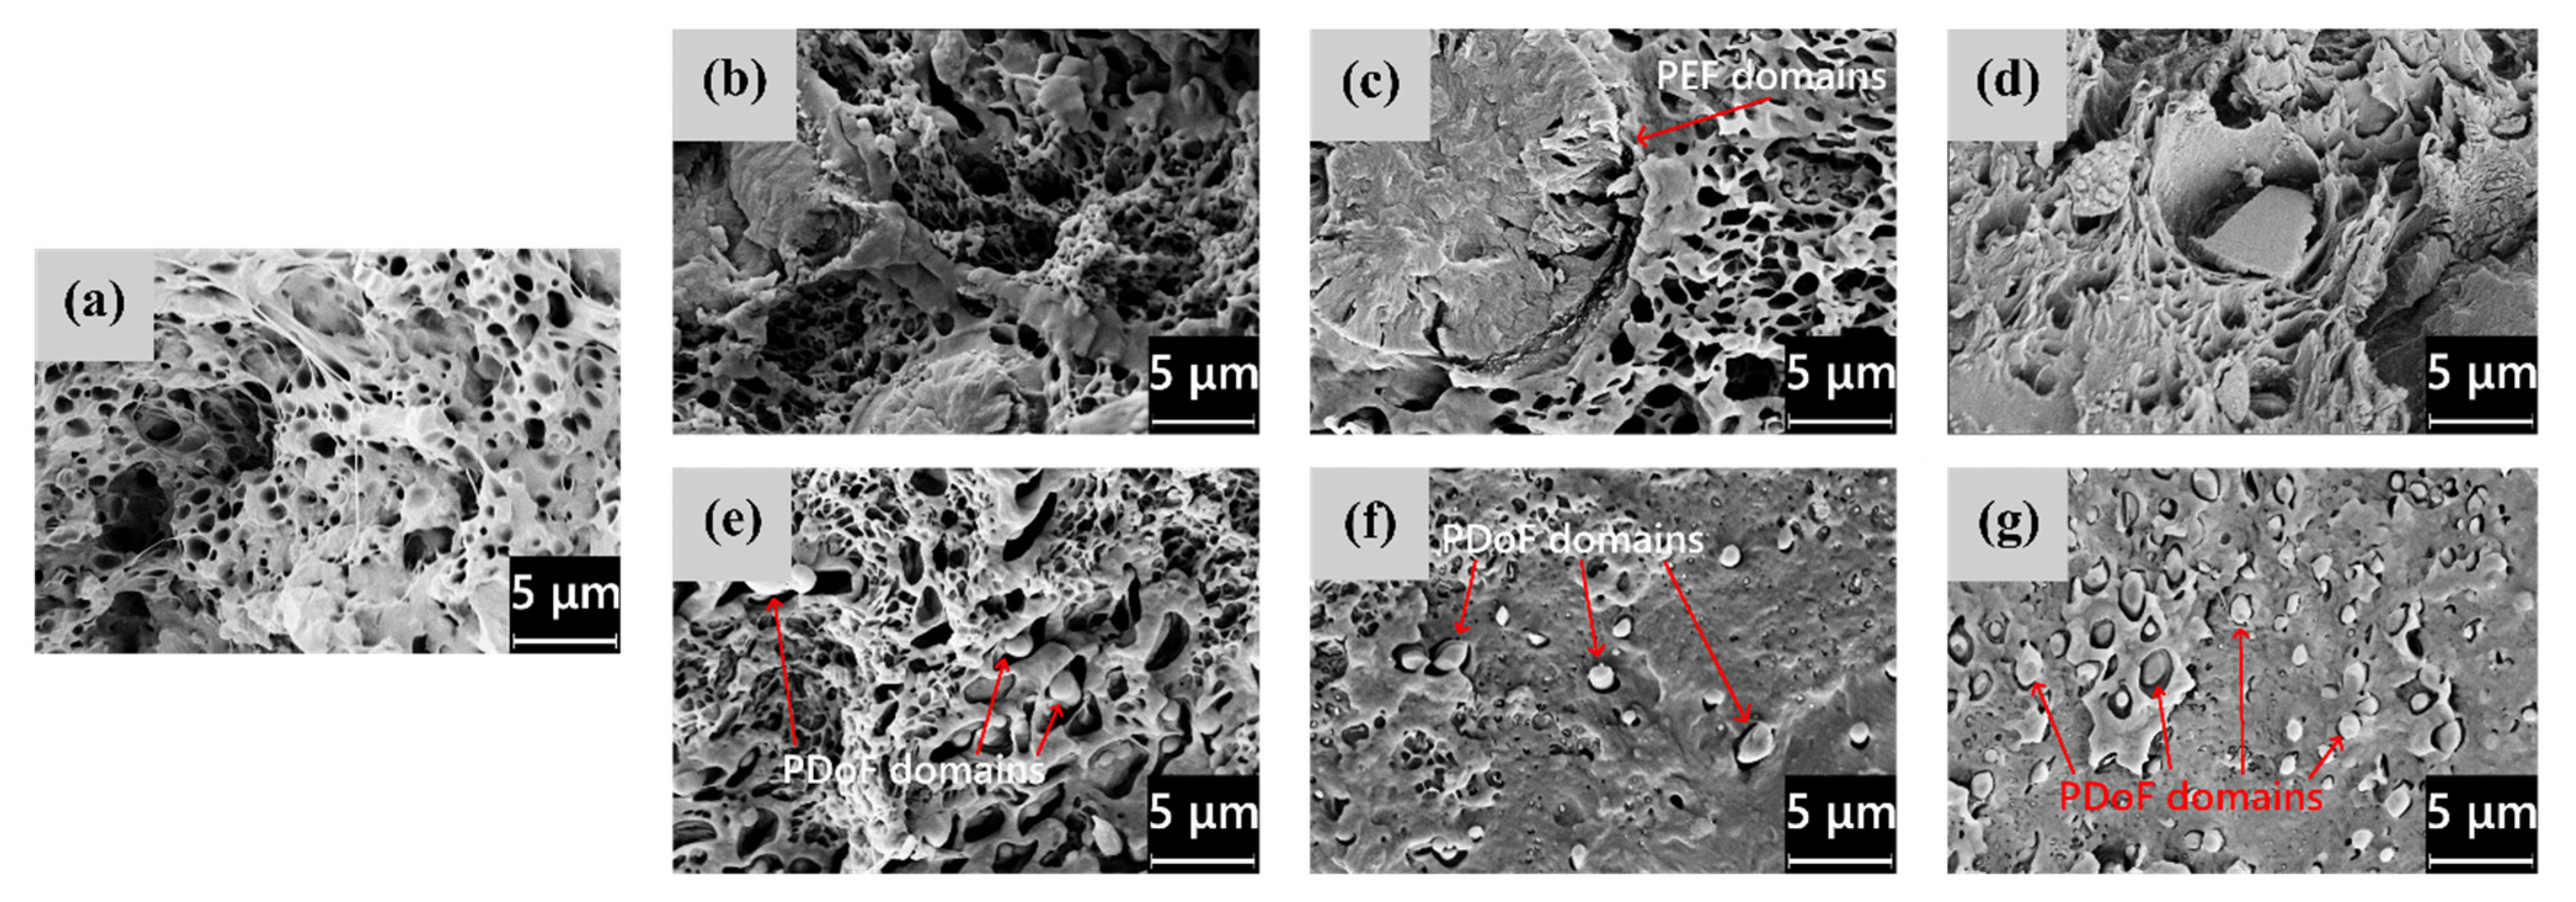
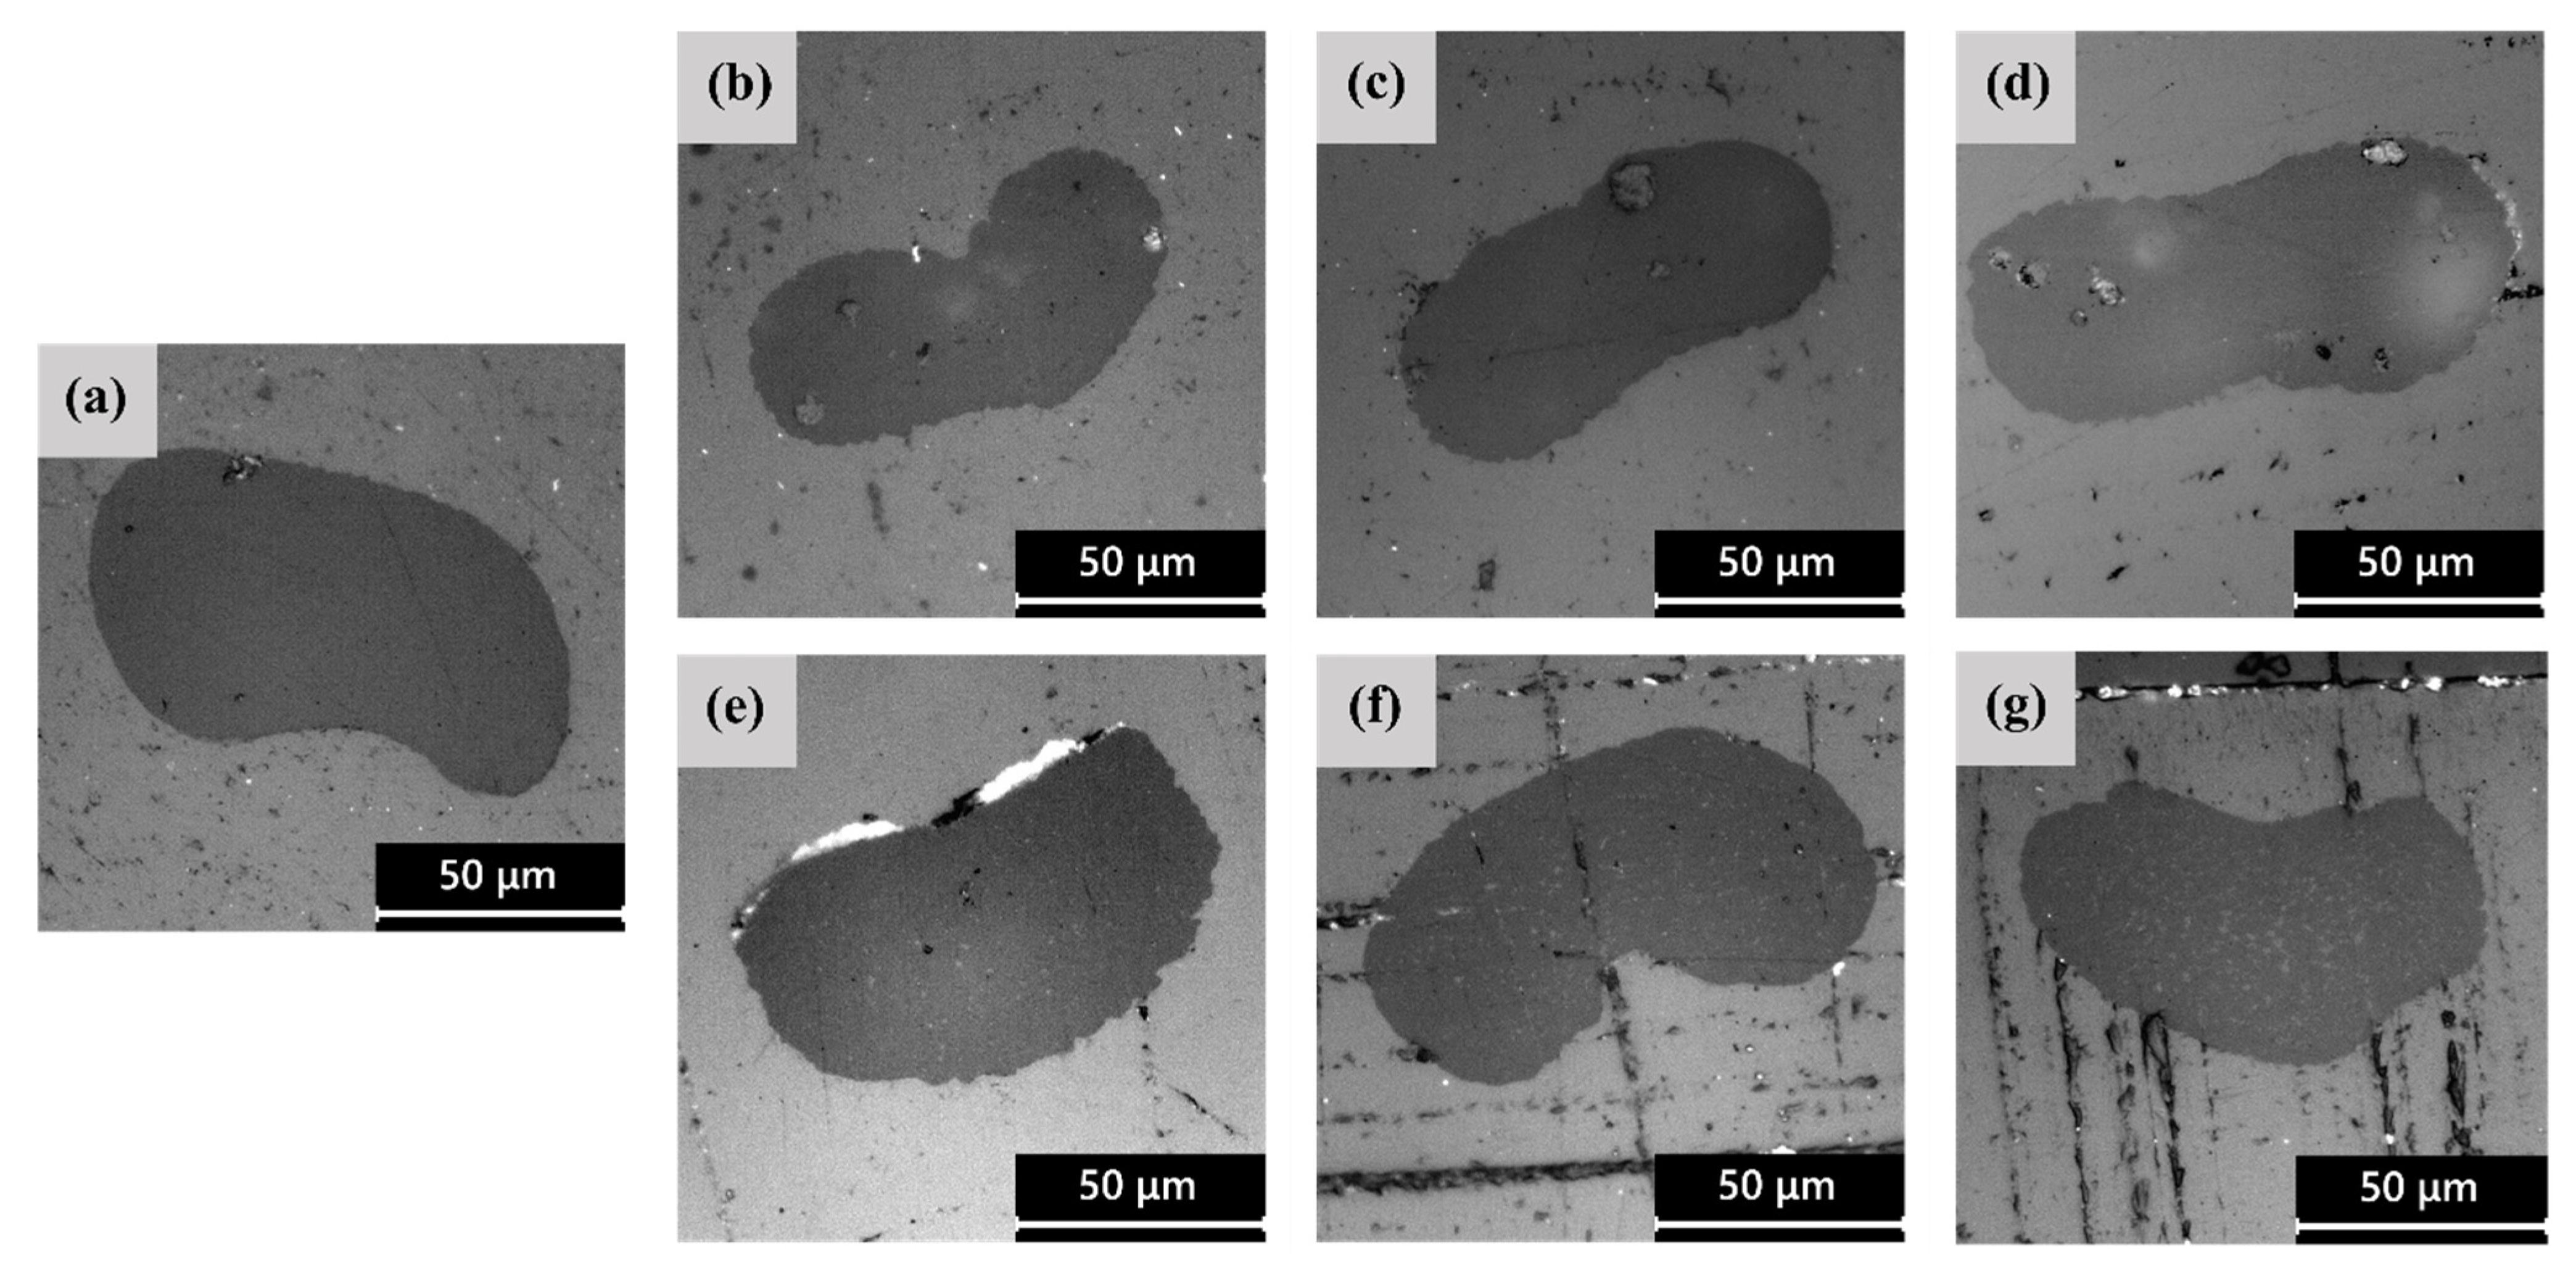
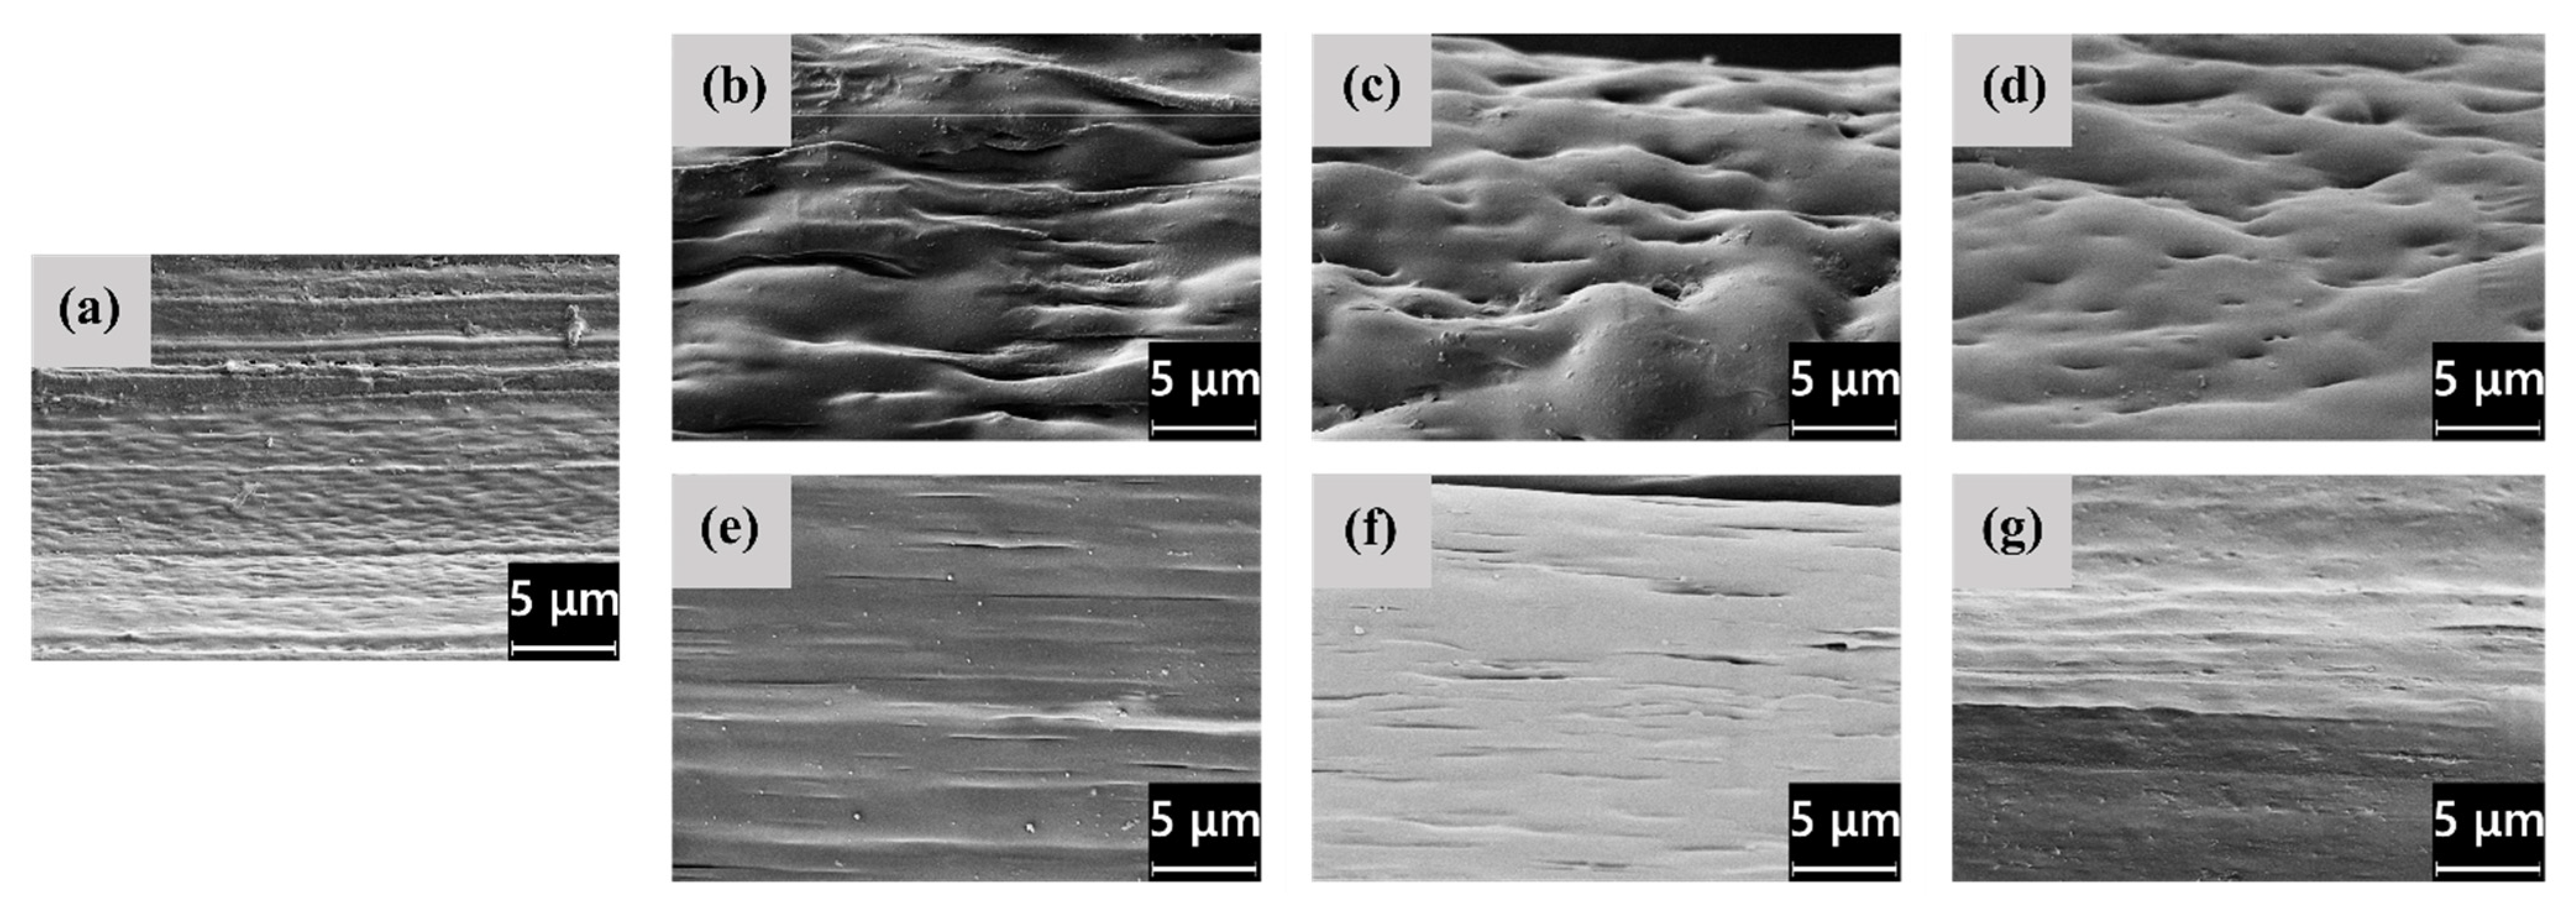
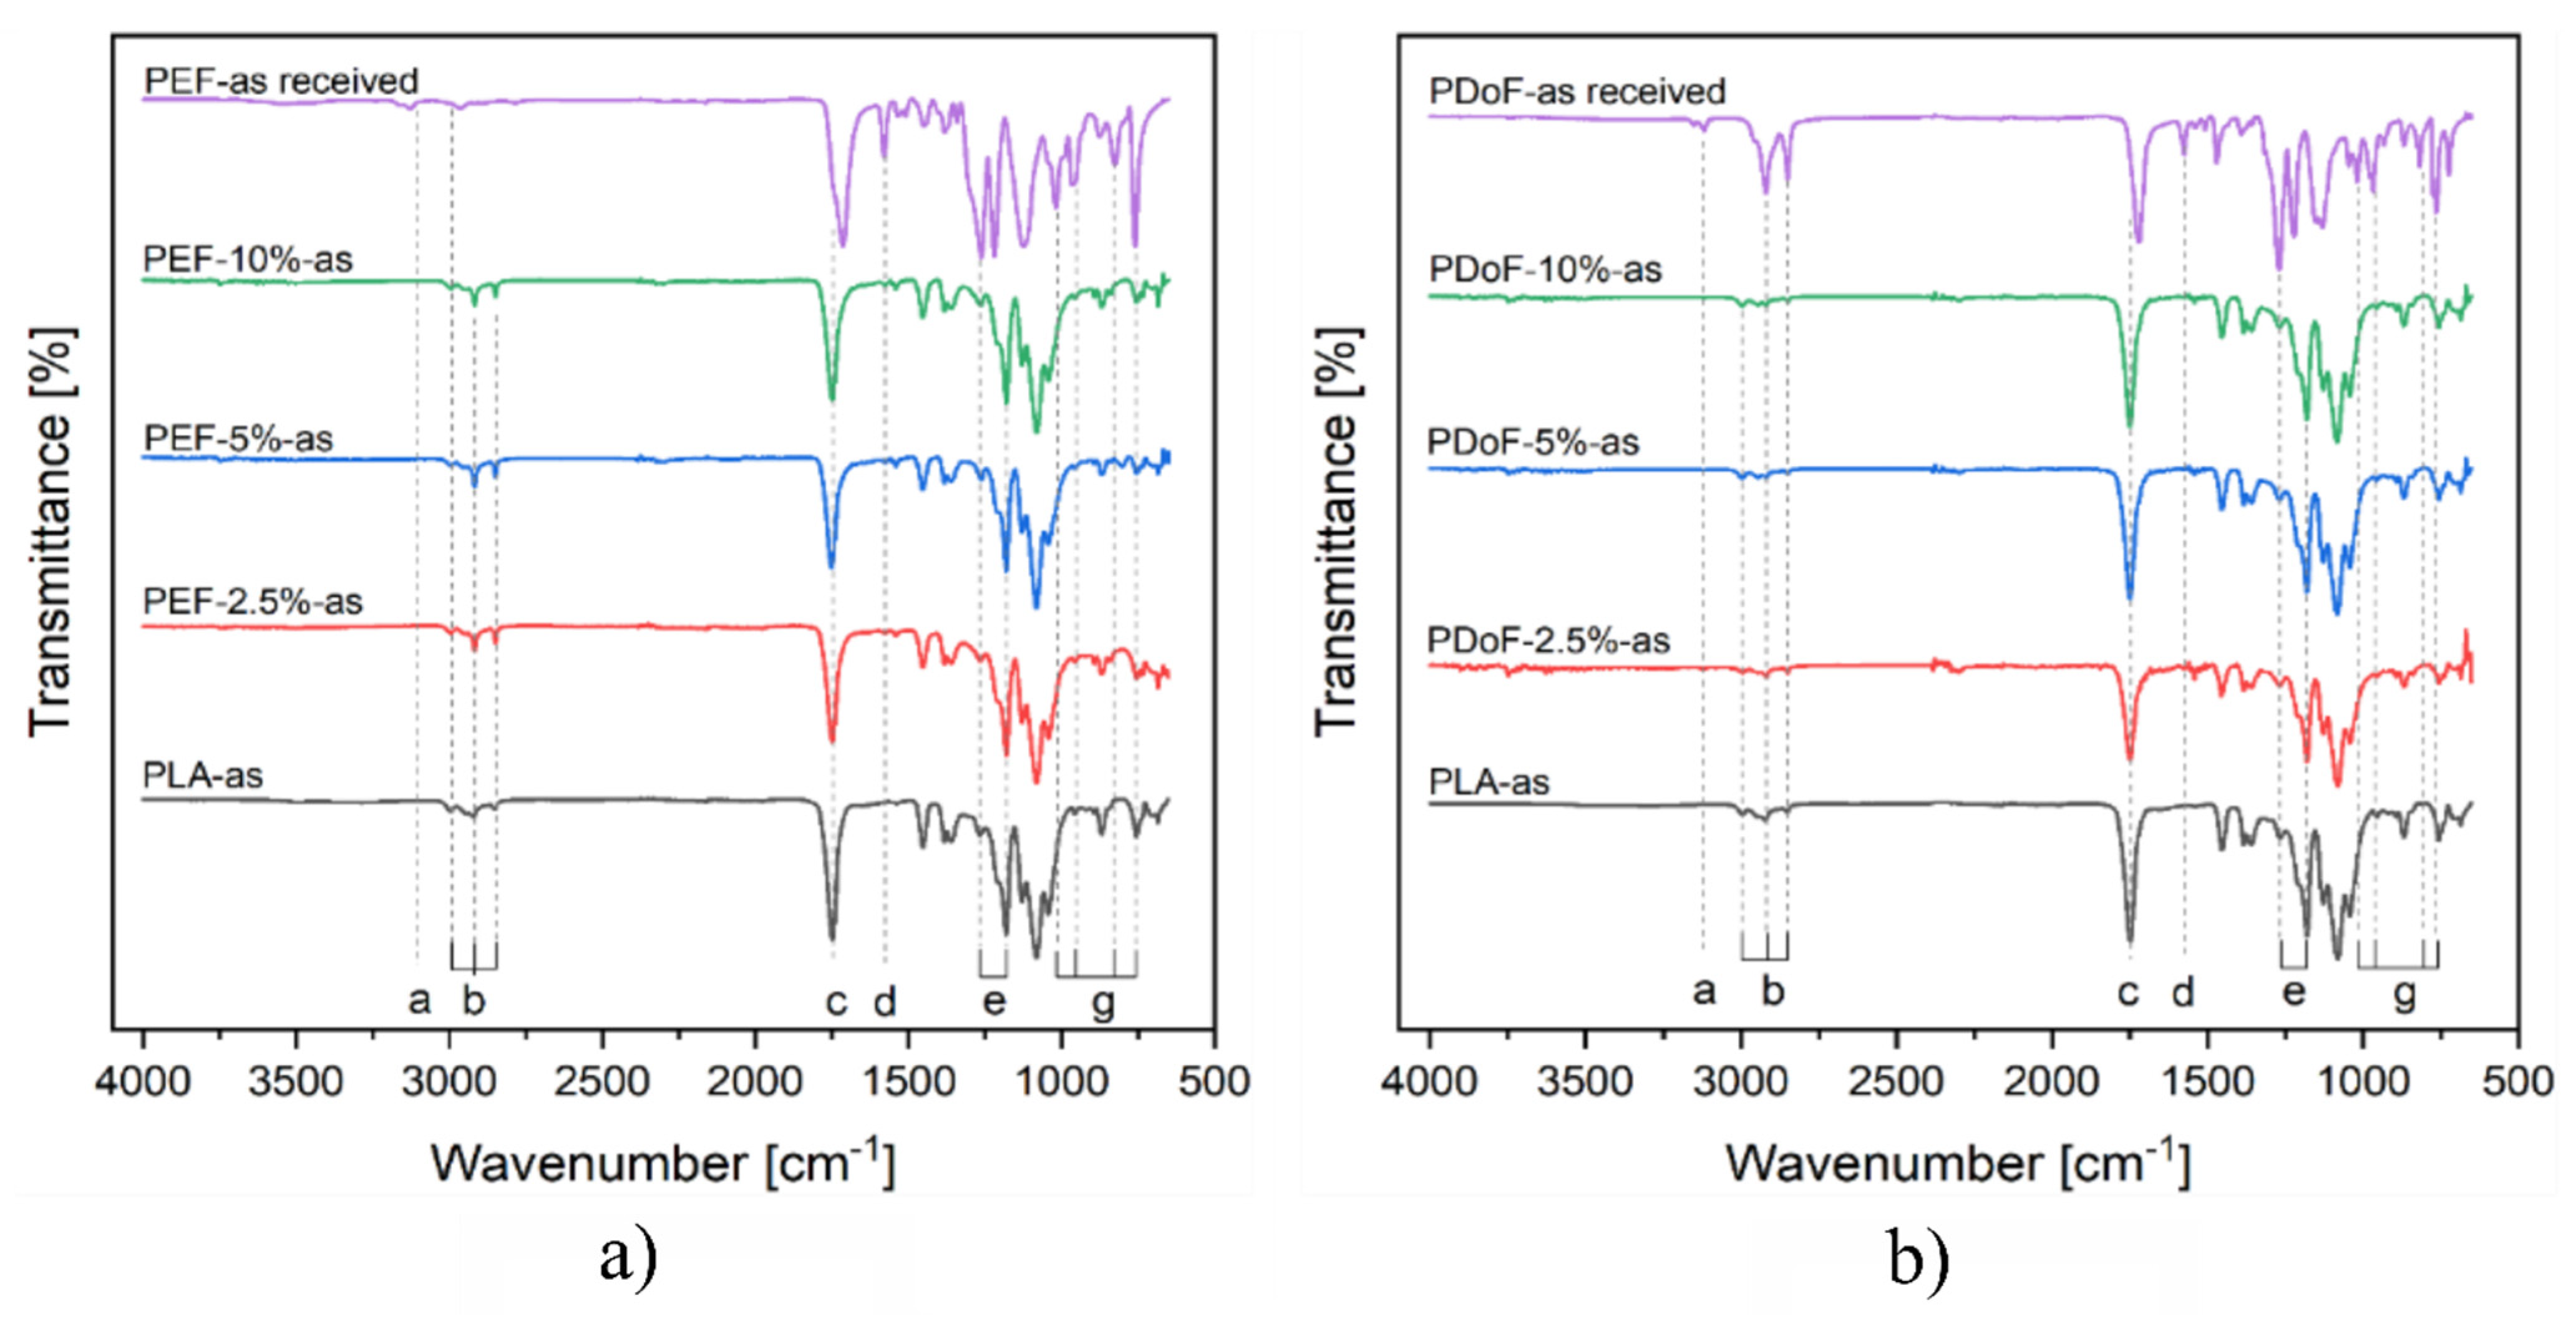
3.1. Microstructural Properties
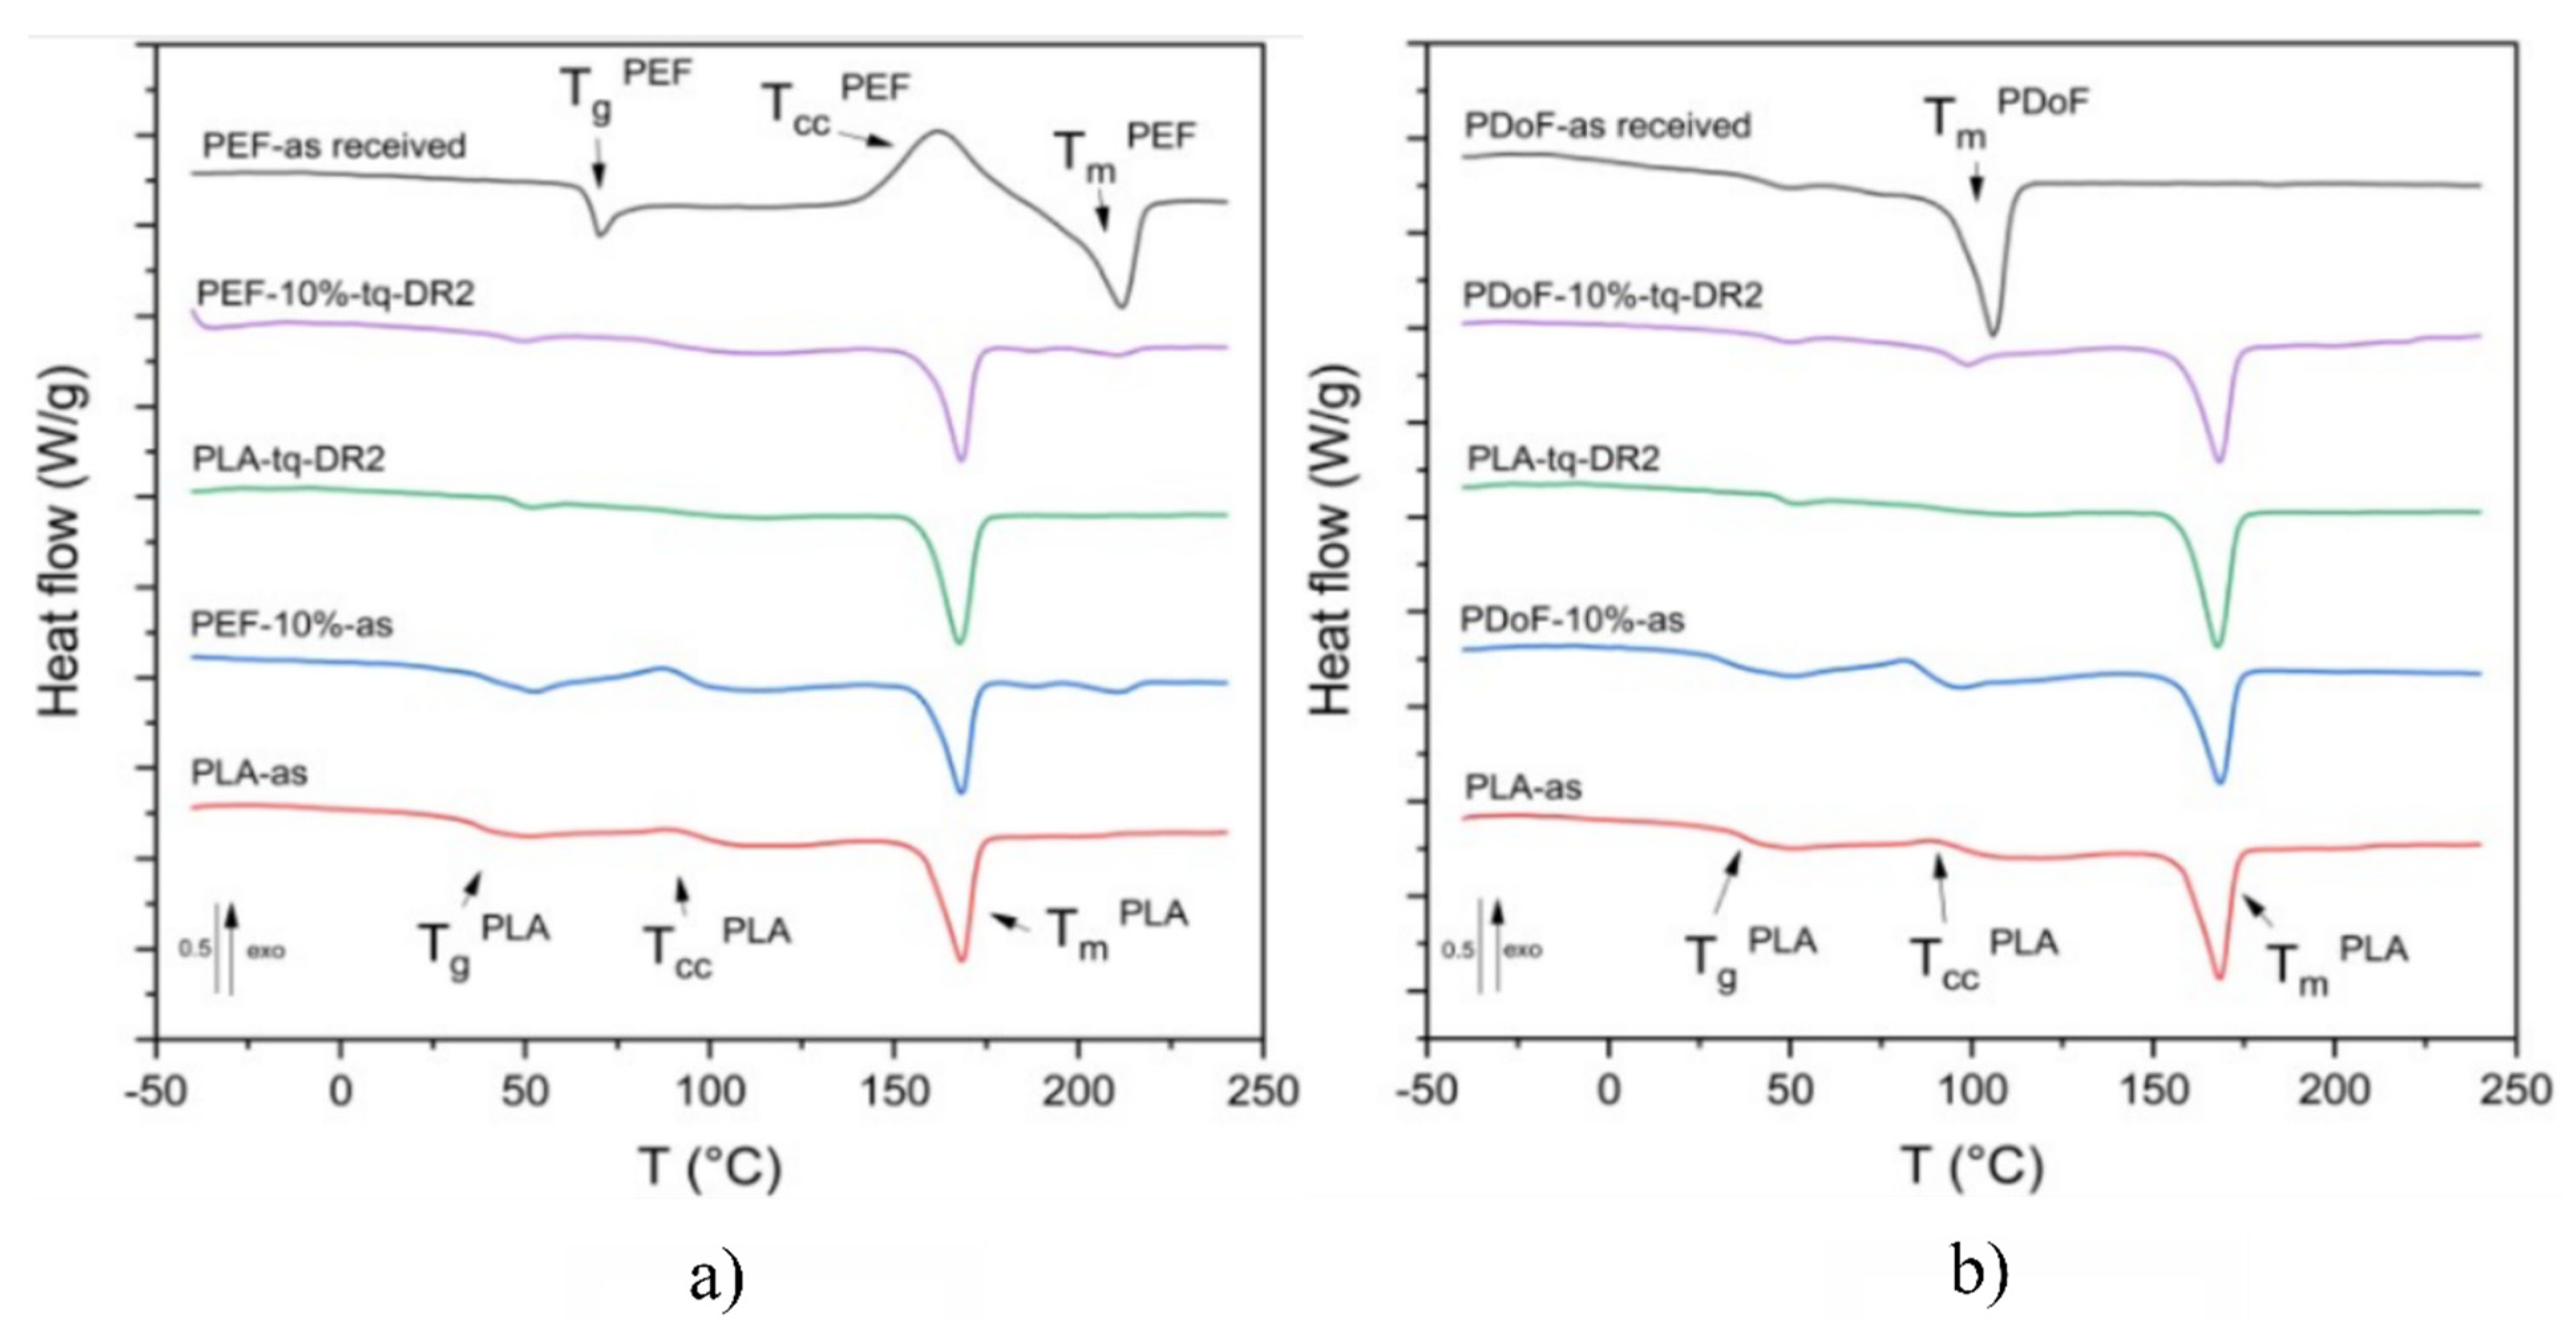
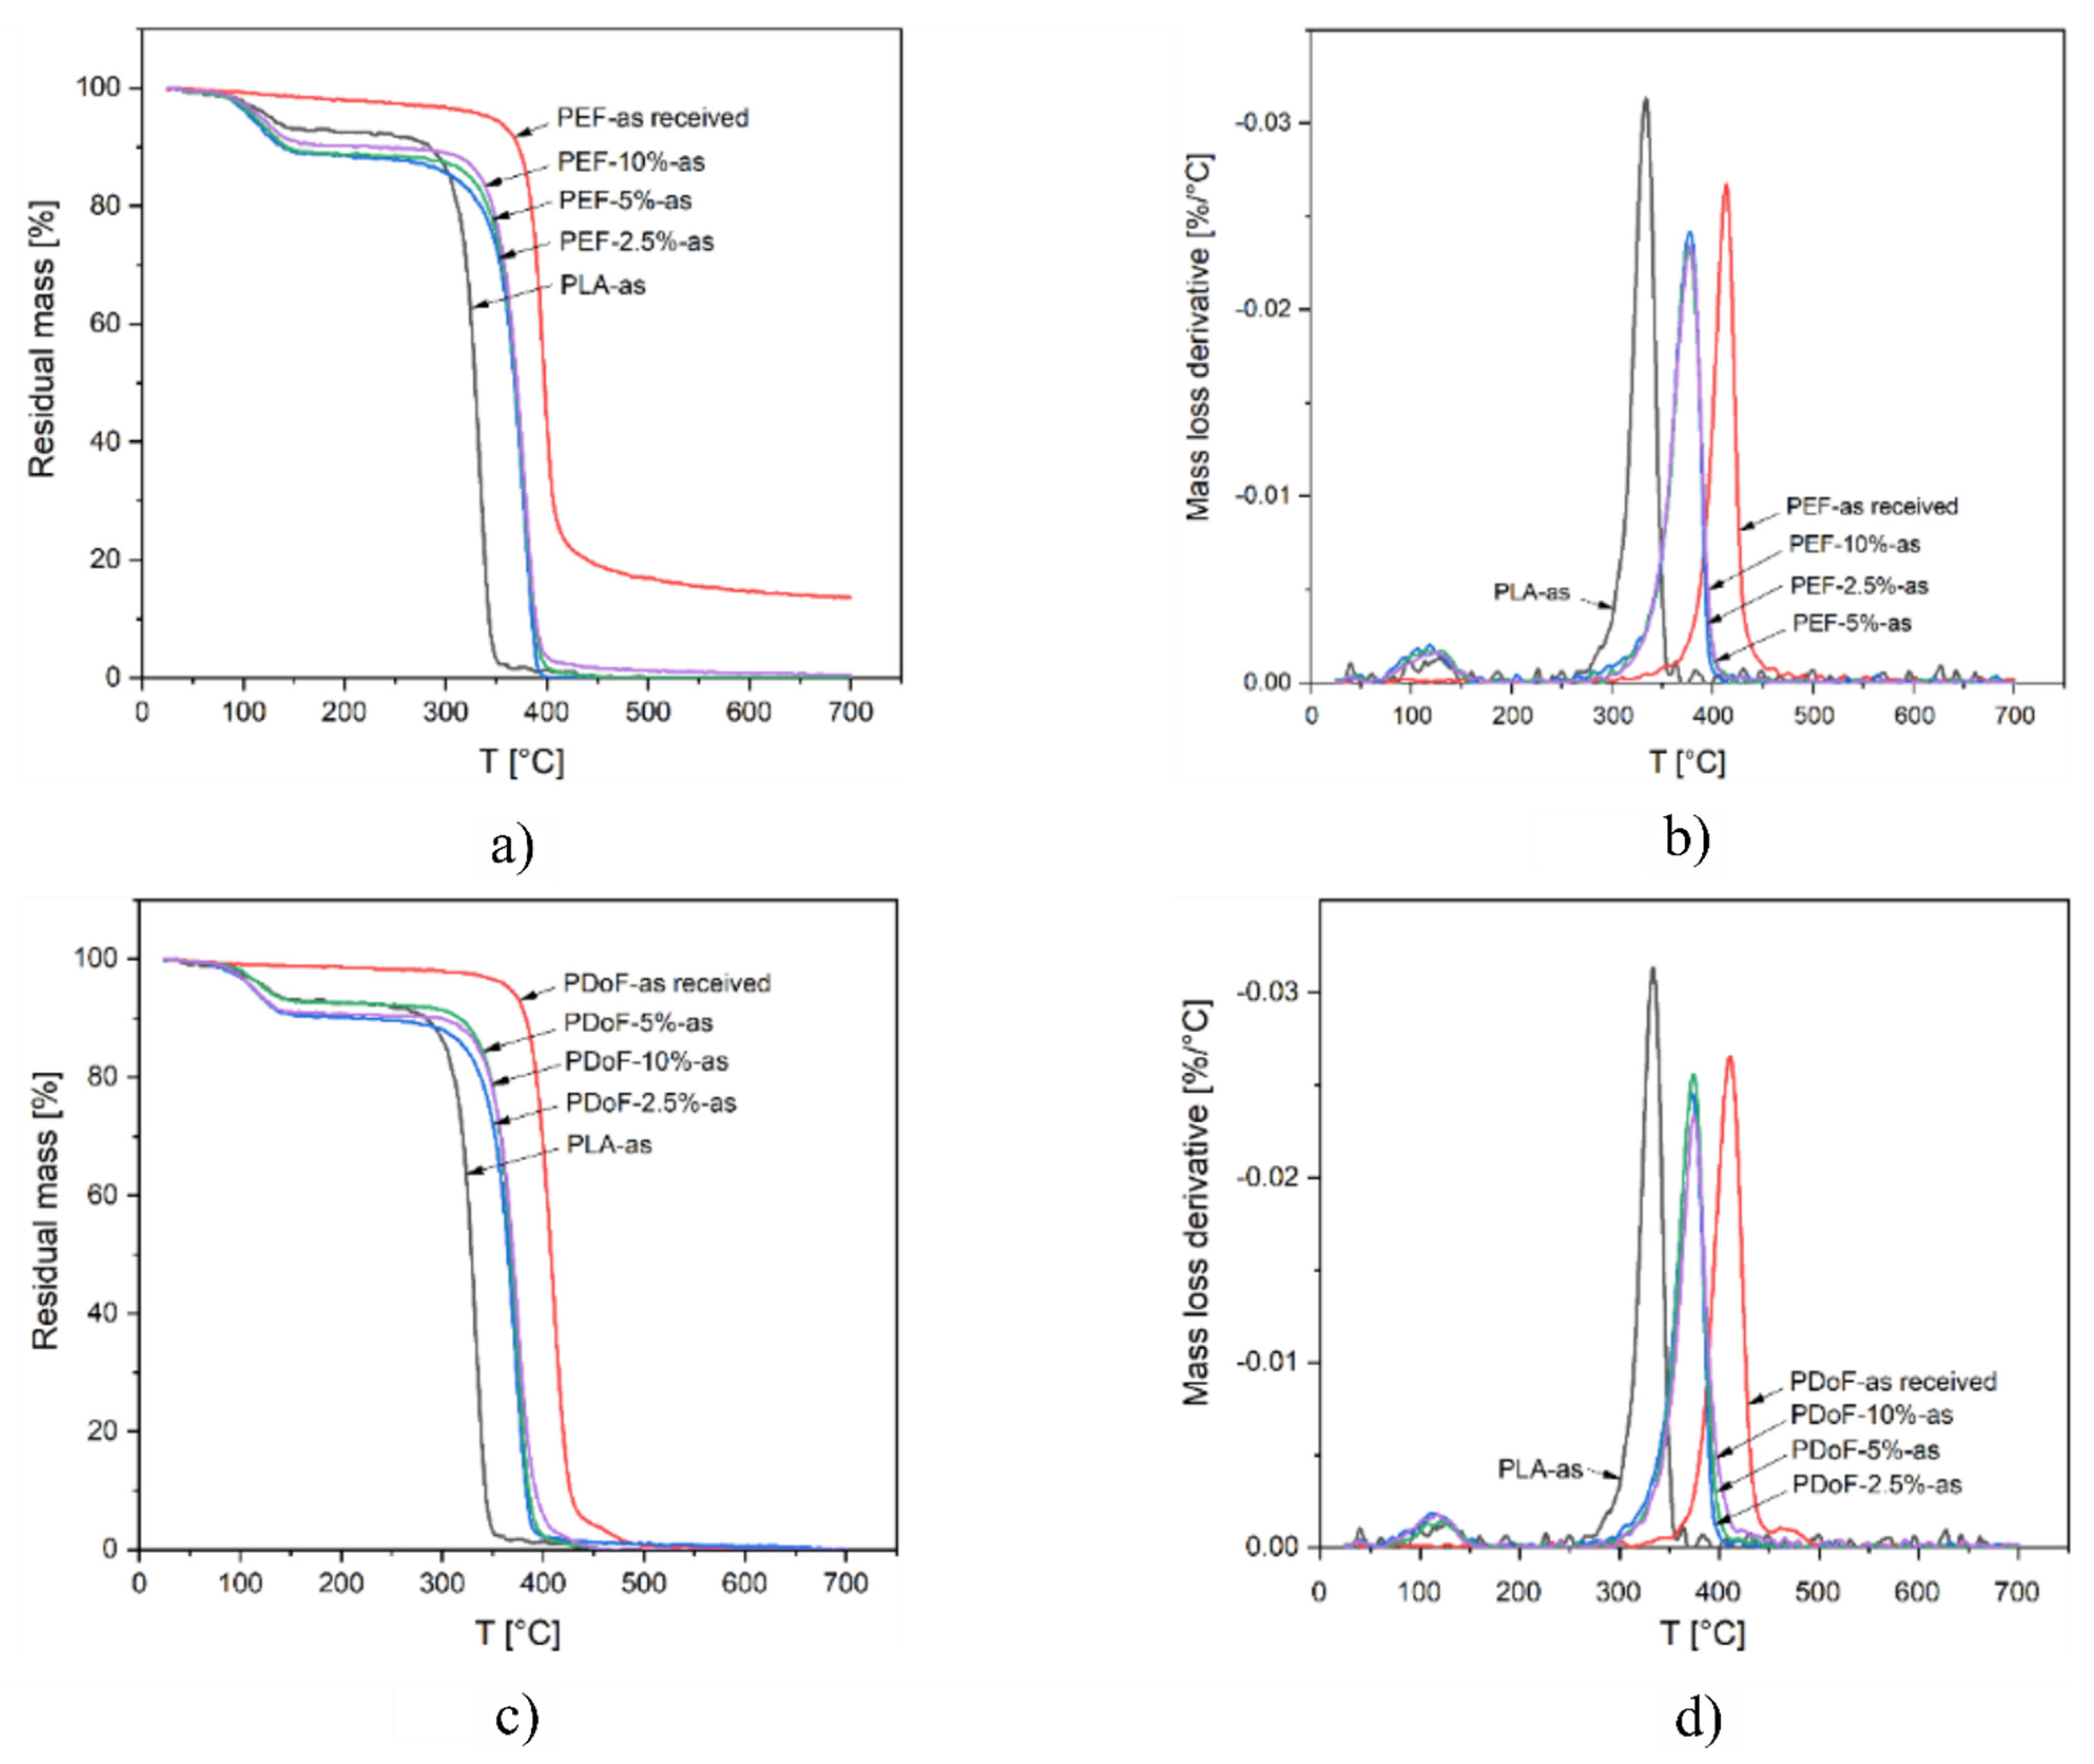
3.2. Thermal Properties
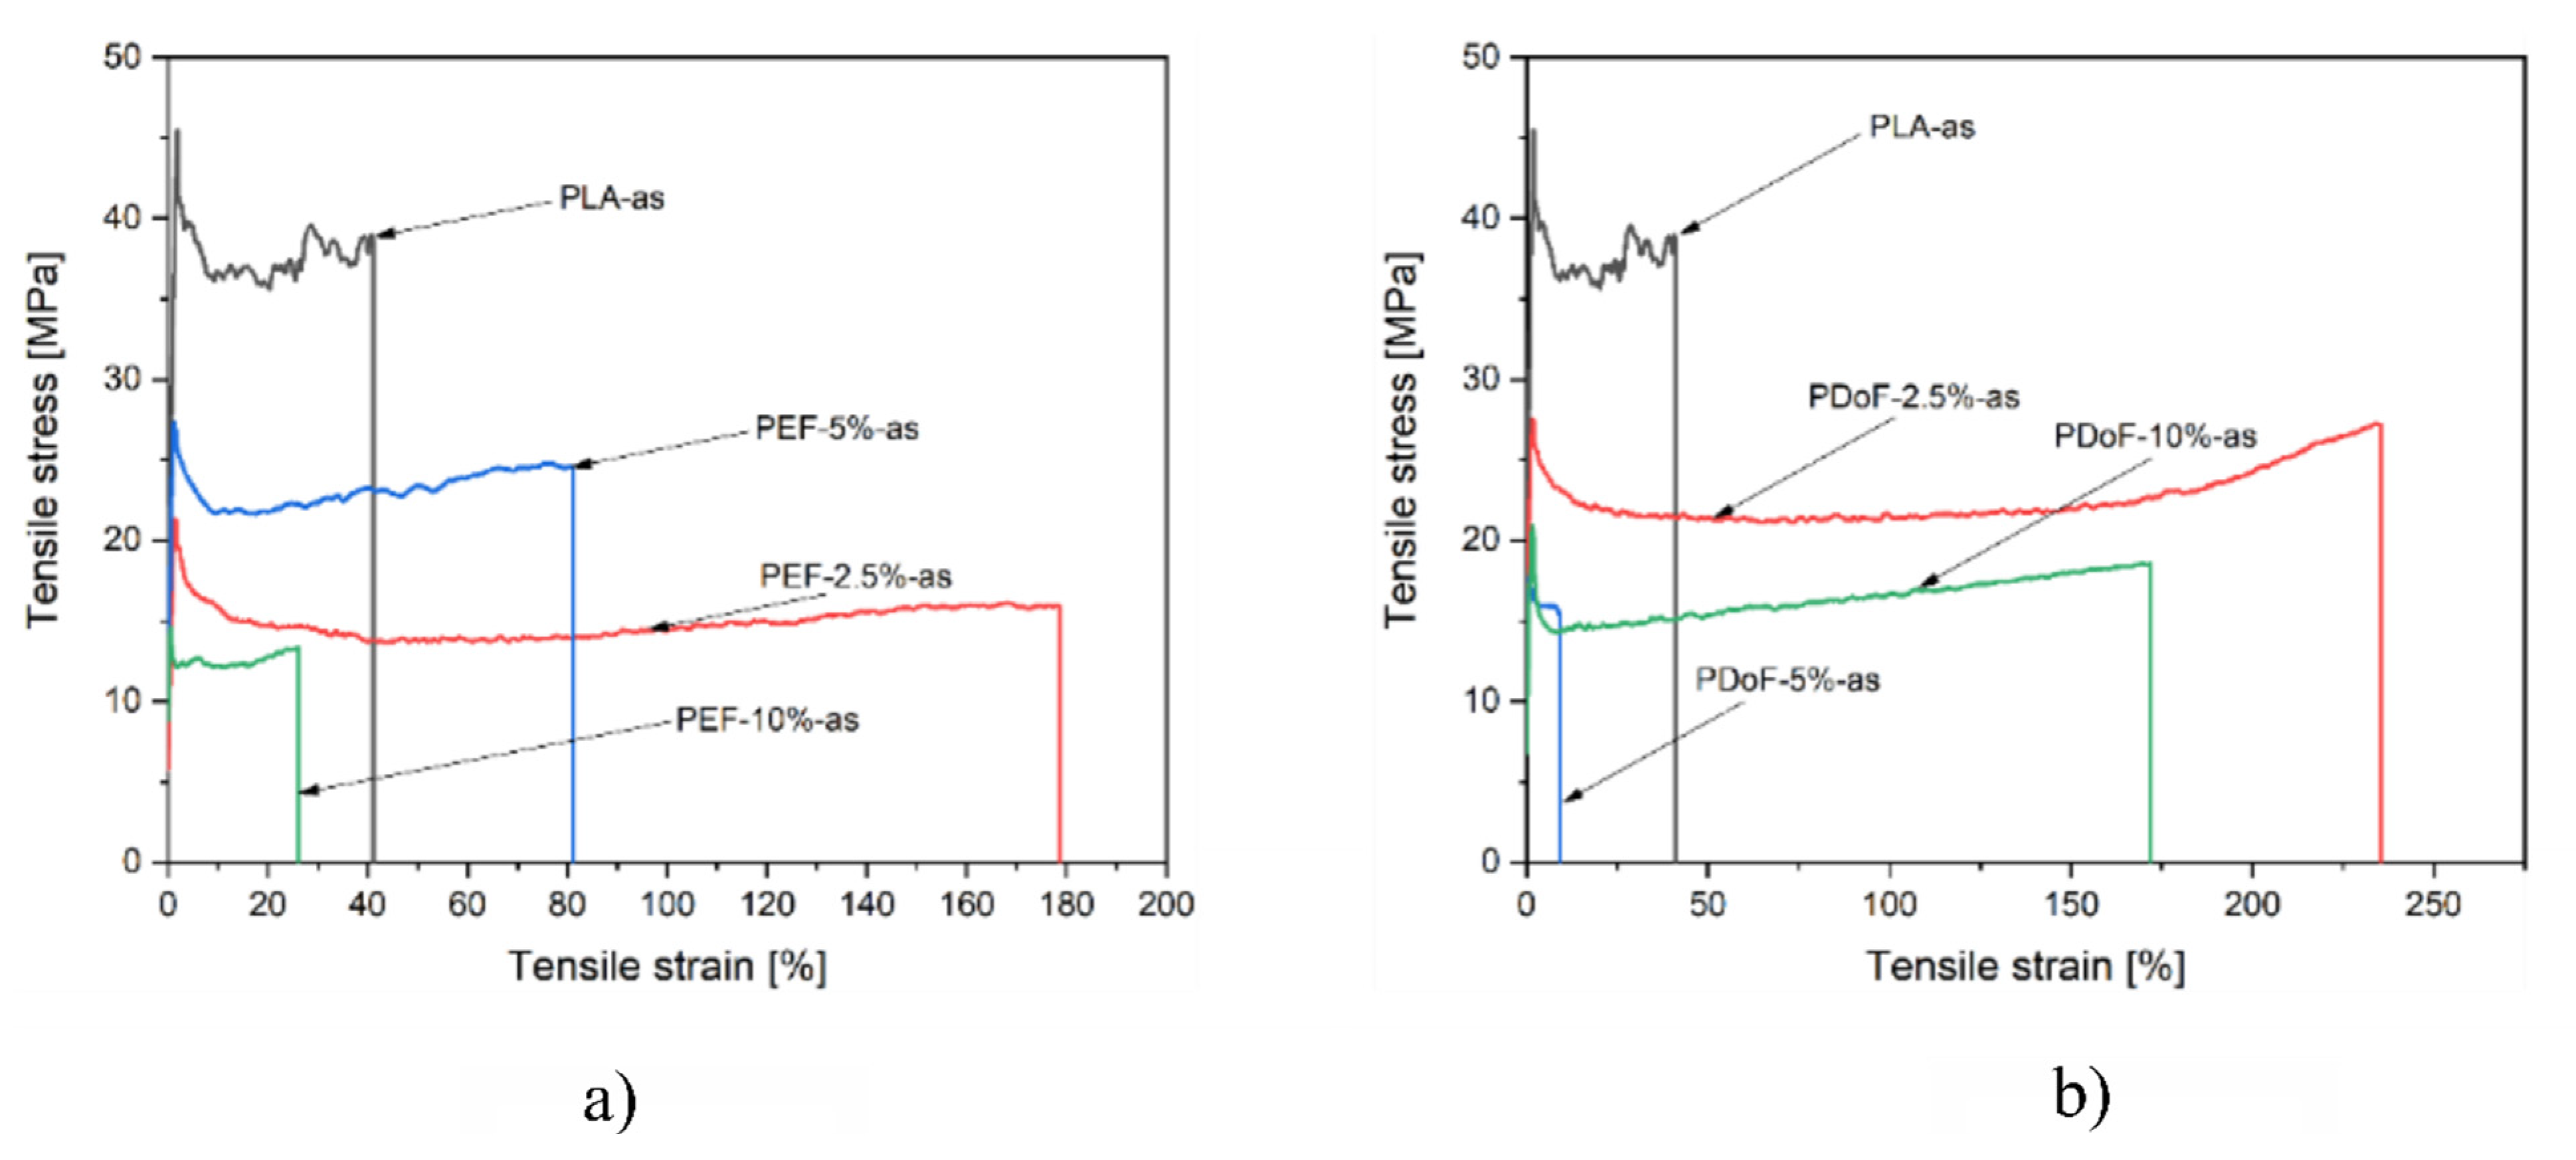
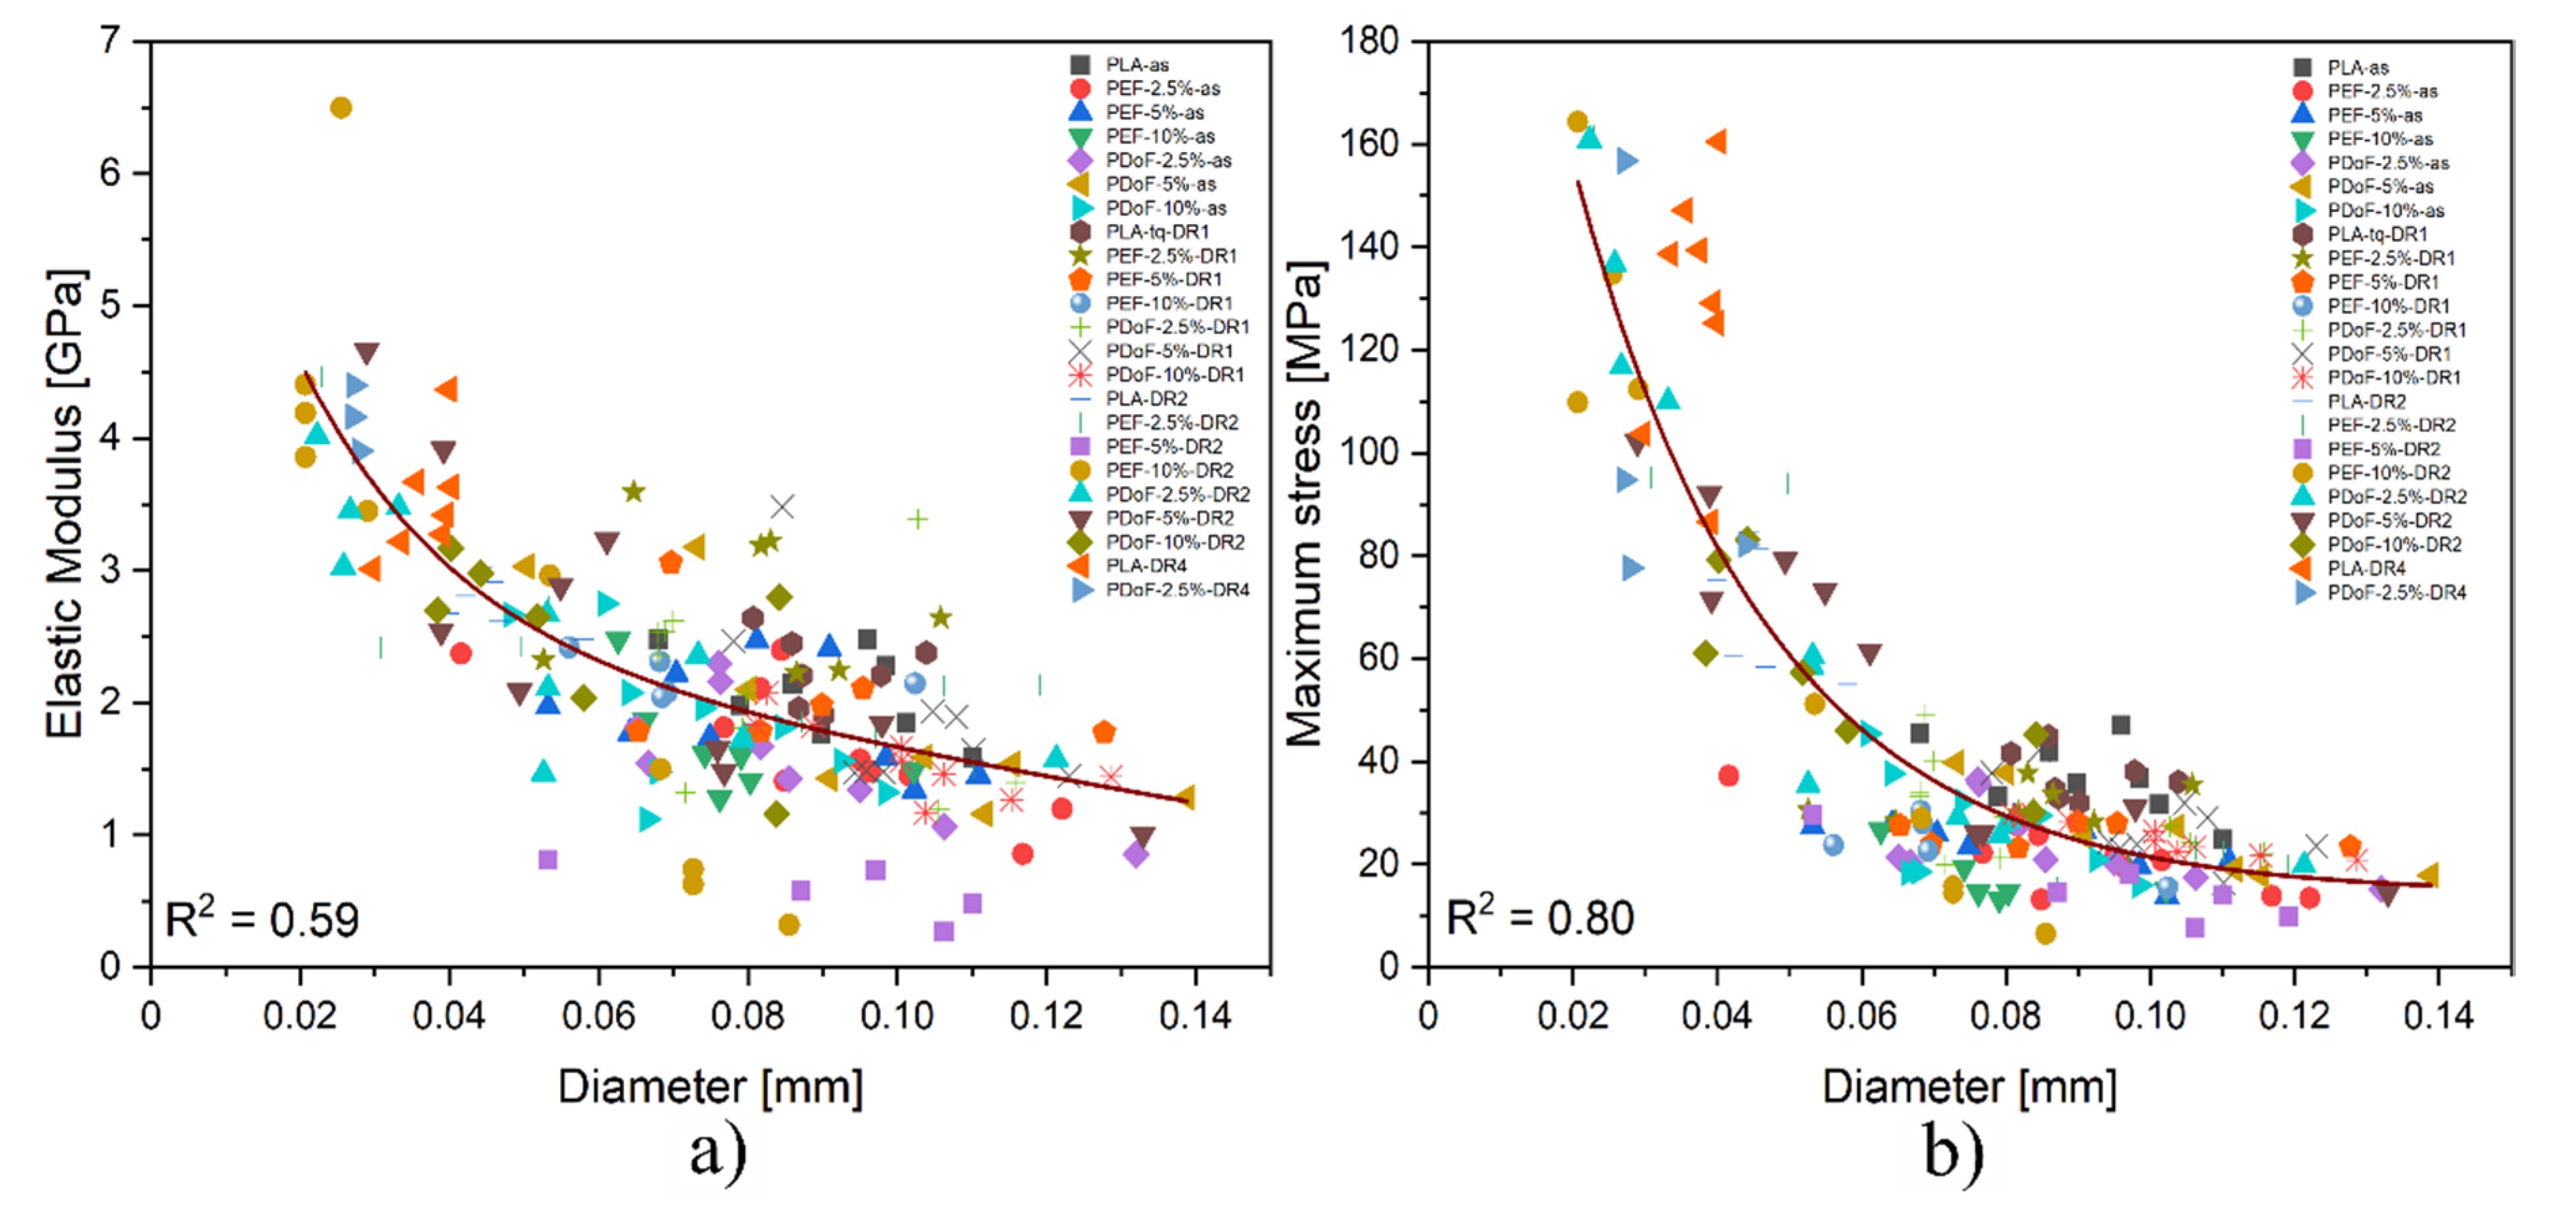
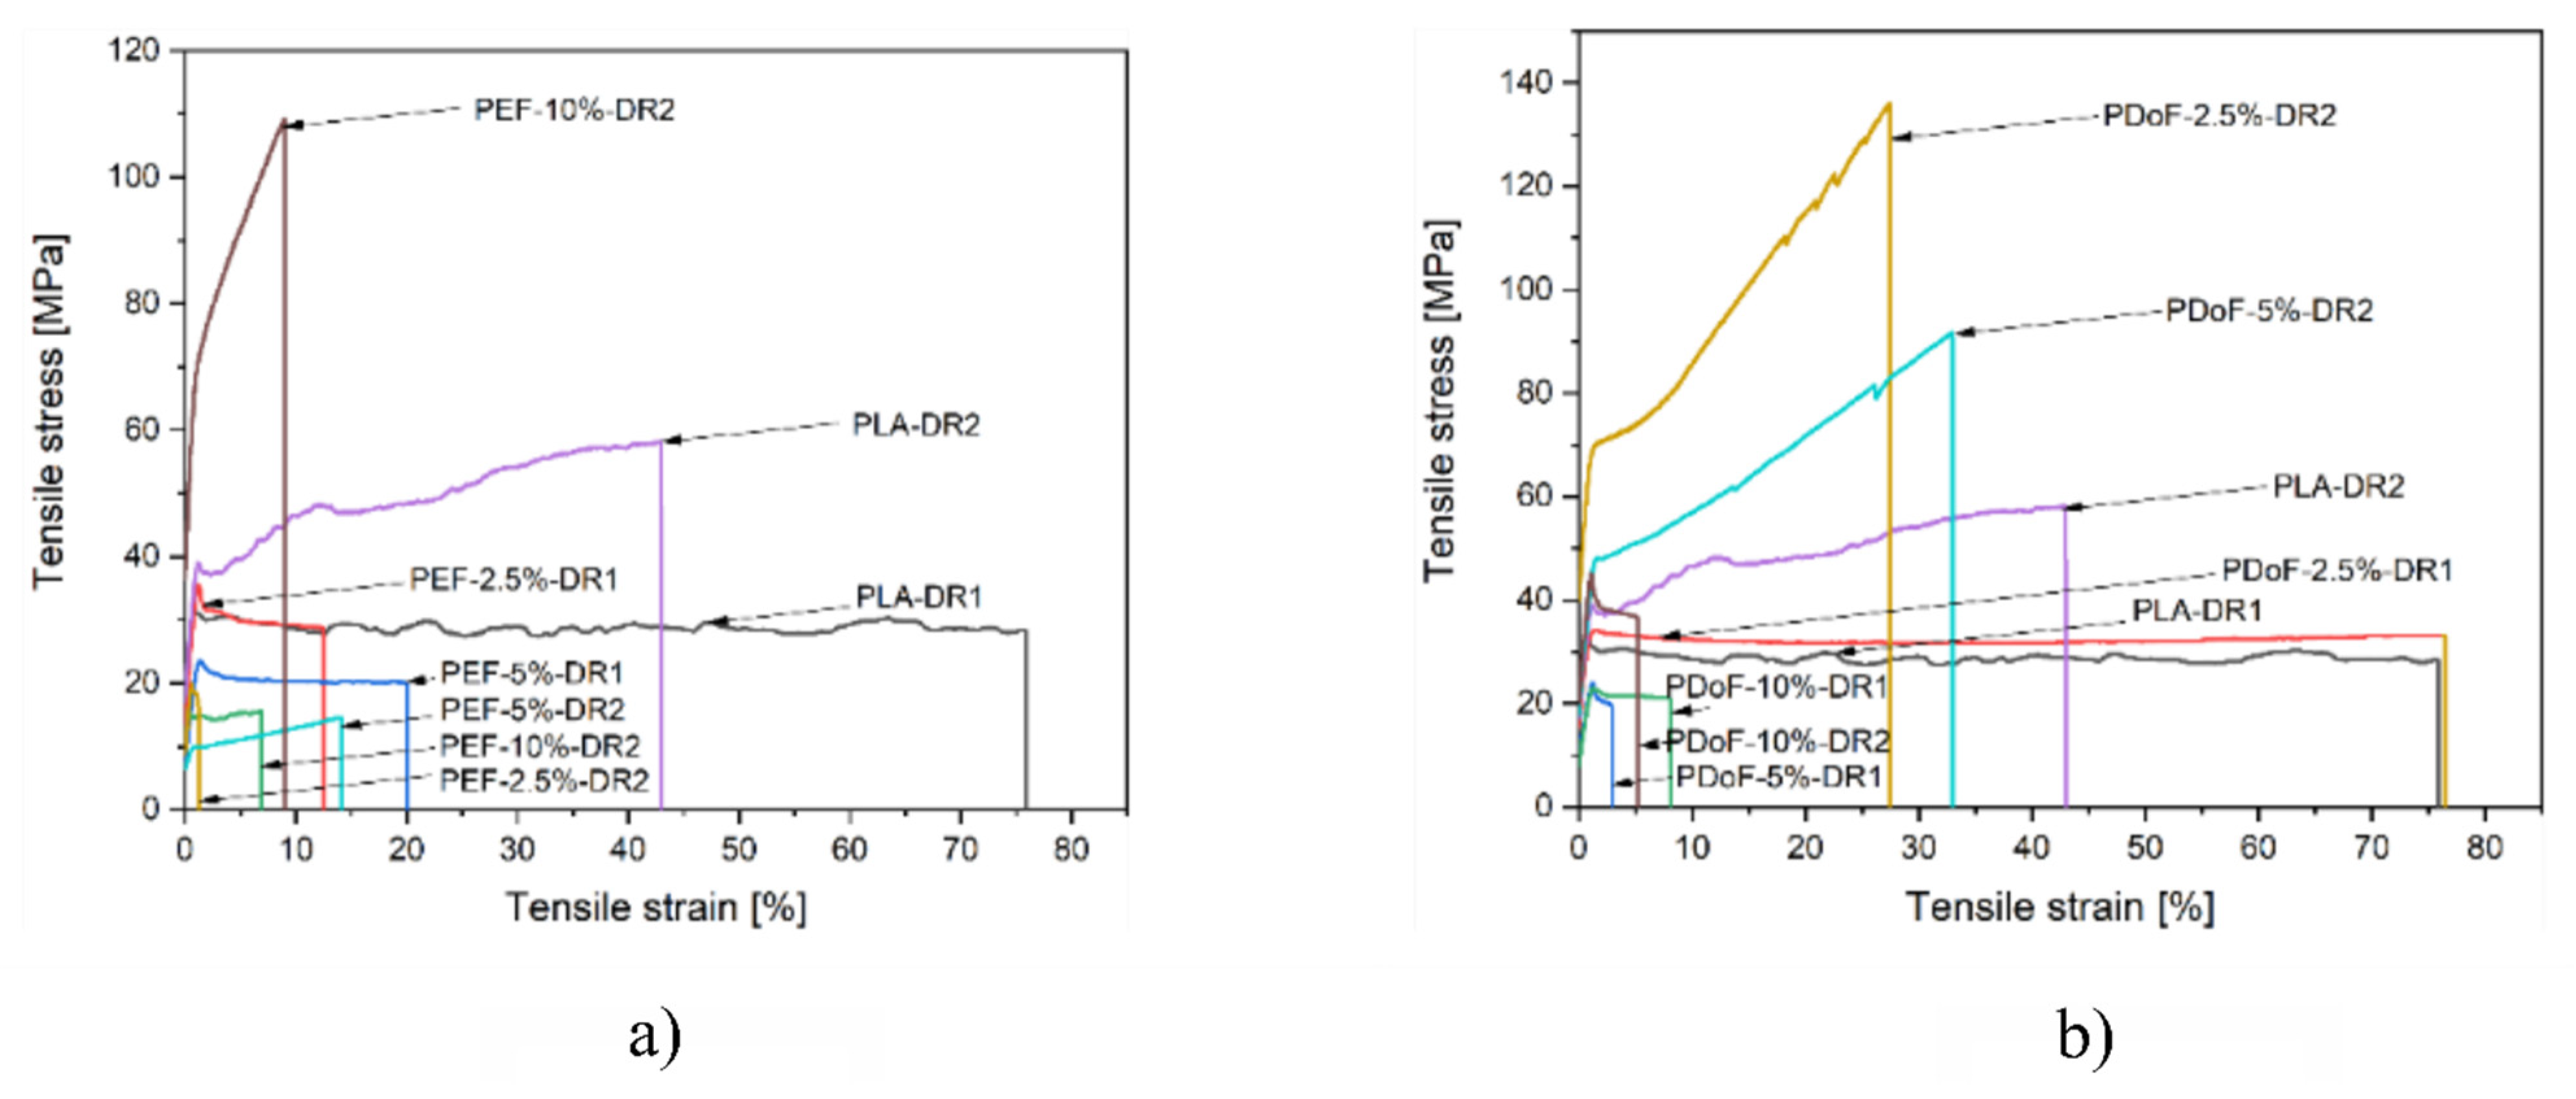
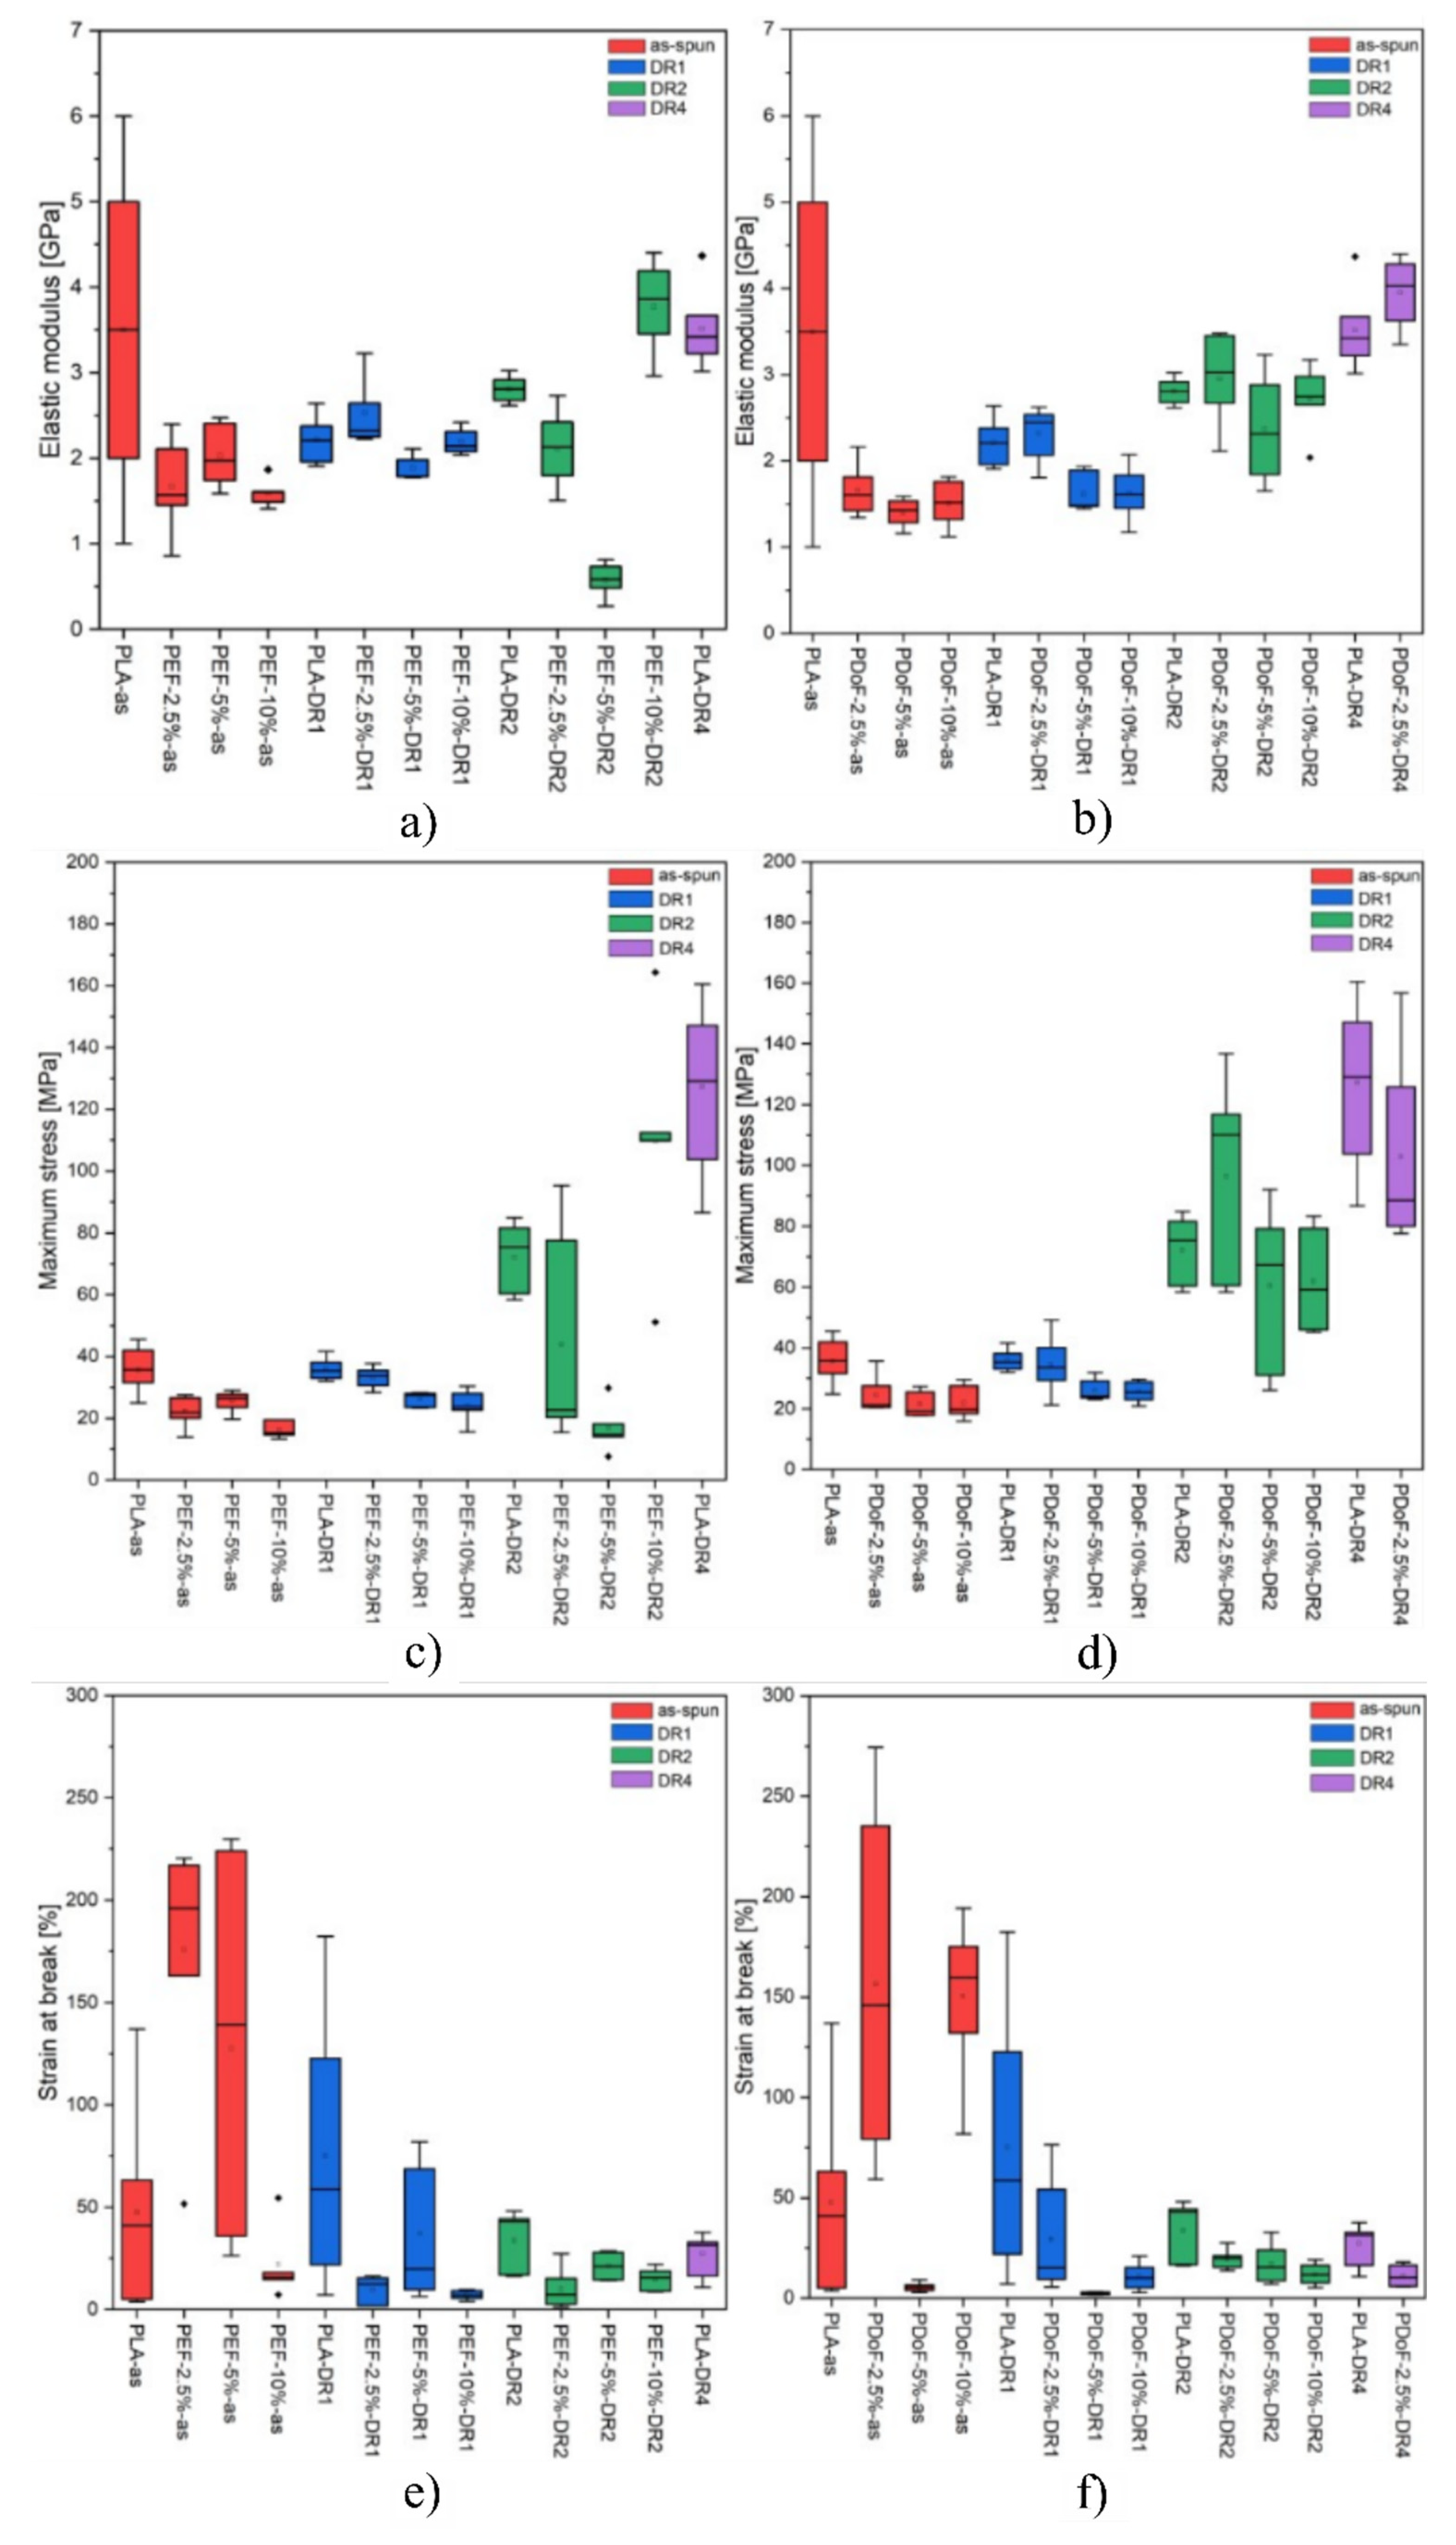
3.3. Mechanical Properties
4. Conclusions
Author Contributions
Funding
Institutional Review Board Statement
Informed Consent Statement
Data Availability Statement
Conflicts of Interest
References
- Rasmussen, S.C. From Parkesine to Celluloid: The Birth of Organic Plastics. Angew. Chem. Int. Ed. 2021, 60, 8012–8016. [Google Scholar] [CrossRef] [PubMed]
- Crespy, D.; Bozonnet, M.; Meier, M. 100 Years of Bakelite, the Material of a 1000 Uses. Angew. Chem. Int. Ed. 2008, 47, 3322–3328. [Google Scholar] [CrossRef] [PubMed]
- Crutzen, P.J. The “Anthropocene”. In Earth System Science in the Anthropocene; Ehlers, E., Krafft, T., Eds.; Springer: Berlin/Heidelberg, Germany, 2006; pp. 13–18. [Google Scholar]
- Philp, J.C.; Bartsev, A.; Ritchie, R.J.; Baucher, M.A.; Guy, K. Bioplastics science from a policy vantage point. New Biotechnol. 2013, 30, 635–646. [Google Scholar] [CrossRef]
- Zalasiewicz, J.; Waters, C.N.; Ivar do Sul, J.A.; Corcoran, P.L.; Barnosky, A.D.; Cearreta, A.; Edgeworth, M.; Gałuszka, A.; Jeandel, C.; Leinfelder, R.; et al. The geological cycle of plastics and their use as a stratigraphic indicator of the Anthropocene. Anthropocene 2016, 13, 4–17. [Google Scholar] [CrossRef] [Green Version]
- Schneiderman, D.K.; Hillmyer, M.A. 50th Anniversary Perspective: There Is a Great Future in Sustainable Polymers. Macromolecules 2017, 50, 3733–3749. [Google Scholar] [CrossRef]
- Hu, H.; Zhang, R.; Shi, L.; Ying, W.B.; Wang, J.; Zhu, J. Modification of Poly(butylene 2,5−furandicarboxylate) with Lactic Acid for Biodegradable Copolyesters with Good Mechanical and Barrier Properties. Ind. Eng. Chem. Res. 2018, 57, 11020–11030. [Google Scholar] [CrossRef]
- Borrelle, S.B.; Rochman, C.M.; Liboiron, M.; Bond, A.L.; Lusher, A.; Bradshaw, H.; Provencher, J.F. Opinion: Why we need an international agreement on marine plastic pollution. Proc. Natl. Acad. Sci. USA 2017, 114, 9994–9997. [Google Scholar] [CrossRef] [Green Version]
- Gandini, A. Polymers from Renewable Resources: A Challenge for the Future of Macromolecular Materials. Macromolecules 2008, 41, 9491–9504. [Google Scholar] [CrossRef]
- Wang, Z.; Ganewatta, M.S.; Tang, C. Sustainable polymers from biomass: Bridging chemistry with materials and processing. Prog. Polym. Sci. 2020, 101, 101197. [Google Scholar] [CrossRef]
- Wang, Z.; Yuan, L.; Tang, C. Sustainable Elastomers from Renewable Biomass. Acc. Chem. Res. 2017, 50, 1762–1773. [Google Scholar] [CrossRef]
- Balla, E.; Daniilidis, V.; Karlioti, G.; Kalamas, T.; Stefanidou, M.; Bikiaris, N.D.; Vlachopoulos, A.; Koumentakou, I.; Bikiaris, D.N. Poly(lactic Acid): A Versatile Biobased Polymer for the Future with Multifunctional Properties—From Monomer Synthesis, Polymerization Techniques and Molecular Weight Increase to PLA Applications. Polymers 2021, 13, 1822. [Google Scholar] [CrossRef] [PubMed]
- Garlotta, D. A Literature Review of Poly(Lactic Acid). J. Polym. Environ. 2001, 9, 63–84. [Google Scholar] [CrossRef]
- Pal, R. Sustainable Value Generation Through Post−retail Initiatives: An Exploratory Study of Slow and Fast Fashion Businesses. In Green Fashion: Volume 1; Muthu, S.S., Gardetti, M.A., Eds.; Springer: Singapore, 2016; pp. 127–158. [Google Scholar]
- Llana−Ruiz−Cabello, M.; Pichardo, S.; Baños, A.; Núñez, C.; Bermúdez, J.M.; Guillamón, E.; Aucejo, S.; Cameán, A.M. Characterisation and evaluation of PLA films containing an extract of Allium spp. to be used in the packaging of ready−to−eat salads under controlled atmospheres. LWT−Food Sci. Technol. 2015, 64, 1354–1361. [Google Scholar] [CrossRef]
- Mangaraj, S.; Mohanty, S.; Swain, S.; Yadav, A. Development and Characterization of Commercial Biodegradable Film from PLA and Corn Starch for Fresh Produce Packaging. J. Packag. Technol. Res. 2019, 3, 127–140. [Google Scholar] [CrossRef]
- Ajioka, M.; Enomoto, K.; Suzuki, K.; Yamaguchi, A. The basic properties of poly(lactic acid) produced by the direct condensation polymerization of lactic acid. J. Environ. Polym. Degrad. 1995, 3, 225–234. [Google Scholar] [CrossRef]
- Qin, Y. Applications of advanced technologies in the development of functional medical textile materials. Med. Textile Mater. 2016, 1, 55–70. [Google Scholar]
- Sánchez−Valdes, S.; Ramos−De Valle, L.F.; Manero, O. Polymer Blends. In Handbook of Polymer Synthesis, Characterization, and Processing; John Wiley & Sons: Hoboken, NJ, USA, 2013; pp. 505–517. [Google Scholar]
- Gandini, A. Furans as offspring of sugars and polysaccharides and progenitors of a family of remarkable polymers: A review of recent progress. Polym. Chem. 2010, 1, 245–251. [Google Scholar] [CrossRef]
- Kohli, K.; Prajapati, R.; Sharma, B.K. Bio−Based Chemicals from Renewable Biomass for Integrated Biorefineries. Energies 2019, 12, 233. [Google Scholar] [CrossRef] [Green Version]
- Perin, D.; Fredi, G.; Rigotti, D.; Soccio, M.; Lotti, N.; Dorigato, A. Sustainable textile fibers of bioderived polylactide/poly(pentamethylene 2,5−furanoate) blends. J. Appl. Polym. Sci. 2022, 139, 51740. [Google Scholar] [CrossRef]
- Poulopoulou, N.; Smyrnioti, D.; Nikolaidis, G.N.; Tsitsimaka, I.; Christodoulou, E.; Bikiaris, D.N.; Charitopoulou, M.A.; Achilias, D.S.; Kapnisti, M.; Papageorgiou, G.Z. Sustainable Plastics from Biomass: Blends of Polyesters Based on 2,5−Furandicarboxylic Acid. Polymers 2020, 12, 225. [Google Scholar] [CrossRef] [Green Version]
- Perin, D.; Rigotti, D.; Fredi, G.; Papageorgiou, G.Z.; Bikiaris, D.N.; Dorigato, A. Innovative Bio−based Poly(Lactic Acid)/Poly(Alkylene Furanoate)s Fiber Blends for Sustainable Textile Applications. J. Polym. Environ. 2021, 29, 3948–3963. [Google Scholar] [CrossRef]
- Gandini, A.; Silvestre, A.J.D.; Neto, C.P.; Sousa, A.F.; Gomes, M. The furan counterpart of poly(ethylene terephthalate): An alternative material based on renewable resources. J. Polym. Sci. Part A Polym. Chem. 2009, 47, 295–298. [Google Scholar] [CrossRef]
- Araujo, C.F.; Nolasco, M.M.; Ribeiro−Claro, P.J.A.; Rudić, S.; Silvestre, A.J.D.; Vaz, P.D.; Sousa, A.F. Inside PEF: Chain Conformation and Dynamics in Crystalline and Amorphous Domains. Macromolecules 2018, 51, 3515–3526. [Google Scholar] [CrossRef]
- Jiang, M.; Liu, Q.; Zhang, Q.; Ye, C.; Zhou, G. A series of furan−aromatic polyesters synthesized via direct esterification method based on renewable resources. J. Polym. Sci. Part A Polym. Chem. 2012, 50, 1026–1036. [Google Scholar] [CrossRef]
- Tsanaktsis, V.; Papageorgiou, G.Z.; Bikiaris, D.N. A facile method to synthesize high−molecular−weight biobased polyesters from 2,5−furandicarboxylic acid and long−chain diols. J. Polym. Sci. Part A Polym. Chem. 2015, 53, 2617–2632. [Google Scholar] [CrossRef]
- Tsanaktsis, V.; Terzopoulou, Z.; Nerantzaki, M.; Papageorgiou, G.Z.; Bikiaris, D.N. New poly(pentylene furanoate) and poly(heptylene furanoate) sustainable polyesters from diols with odd methylene groups. Mater. Lett. 2016, 178, 64–67. [Google Scholar] [CrossRef]
- Papageorgiou, G.Z.; Papageorgiou, D.G.; Terzopoulou, Z.; Bikiaris, D.N. Production of bio−based 2,5−furan dicarboxylate polyesters: Recent progress and critical aspects in their synthesis and thermal properties. Eur. Polym. J. 2016, 83, 202–229. [Google Scholar] [CrossRef]
- Pang, X.; Zhuang, X.; Tang, Z.; Chen, X. Polylactic acid (PLA): Research, development and industrialization. Biotechnol. J. 2010, 5, 1125–1136. [Google Scholar] [CrossRef]
- Rigotti, D.; Fredi, G.; Perin, D.; Bikiaris, D.N.; Pegoretti, A.; Dorigato, A. Statistical Modeling and Optimization of the Drawing Process of Bioderived Polylactide/Poly(dodecylene furanoate) Wet−Spun Fibers. Polymers 2022, 14, 396. [Google Scholar] [CrossRef]
- Maini, L.; Gigli, M.; Gazzano, M.; Lotti, N.; Bikiaris, D.N.; Papageorgiou, G.Z. Structural Investigation of Poly(ethylene furanoate) Polymorphs. Polymers 2018, 10, 296. [Google Scholar] [CrossRef] [Green Version]
- Poulopoulou, N.; Kasmi, N.; Siampani, M.; Terzopoulou, Z.N.; Bikiaris, D.N.; Achilias, D.S.; Papageorgiou, D.G.; Papageorgiou, G.Z. Exploring Next−Generation Engineering Bioplastics: Poly(alkylene furanoate)/Poly(alkylene terephthalate) (PAF/PAT) Blends. Polymers 2019, 11, 556. [Google Scholar] [CrossRef] [PubMed] [Green Version]
- Papageorgiou, D.G.; Guigo, N.; Tsanaktsis, V.; Exarhopoulos, S.; Bikiaris, D.N.; Sbirrazzuoli, N.; Papageorgiou, G.Z. Fast Crystallization and Melting Behavior of a Long−Spaced Aliphatic Furandicarboxylate Biobased Polyester, Poly(dodecylene 2,5−furanoate). Ind. Eng. Chem. Res. 2016, 55, 5315–5326. [Google Scholar] [CrossRef]
- Fredi, G.; Rigotti, D.; Bikiaris, D.N.; Dorigato, A. Tuning thermo−mechanical properties of poly(lactic acid) films through blending with bioderived poly(alkylene furanoate)s with different alkyl chain length for sustainable packaging. Polymer 2021, 218, 123527. [Google Scholar] [CrossRef]
- Sato, S.; Gondo, D.; Wada, T.; Kanehashi, S.; Nagai, K. Effects of various liquid organic solvents on solvent−induced crystallization of amorphous poly(lactic acid) film. J. Appl. Polym. Sci. 2013, 129, 1607–1617. [Google Scholar] [CrossRef]
- Yang, R.H.; Kan, C.W. Effect of heat setting parameters on some properties of PLA knitted fabric. Fibers Polym. 2013, 14, 1347–1353. [Google Scholar] [CrossRef]
- Fredi, G.; Bruenig, H.; Vogel, R.; Scheffler, C. Melt−spun polypropylene filaments containing paraffin microcapsules for multifunctional hybrid yarns and smart thermoregulating thermoplastic composites. Express Polym. Lett. 2019, 13, 1071–1087. [Google Scholar] [CrossRef]
- Bortolotti, M.; Lutterotti, L.; Pepponi, G. Combining XRD and XRF analysis in one Rietveld−like fitting. Powder Diffr. 2017, 32, S225–S230. [Google Scholar] [CrossRef]
- Matthies, S. Standard Functions in the Texture Analysis. Phys. Status Solidi (B) 1980, 101, K111–K115. [Google Scholar] [CrossRef]
- Davachi, S.M.; Kaffashi, B. Preparation and Characterization of Poly L−Lactide/Triclosan Nanoparticles for Specific Antibacterial and Medical Applications. Int. J. Polym. Mater. Polym. Biomater. 2015, 64, 497–508. [Google Scholar] [CrossRef]
- Pakravan, H.R.; Jamshidi, M.; Latif, M.; Pacheco−Torgal, F. Influence of acrylic fibers geometry on the mechanical performance of fiber−cement composites. J. Appl. Polym. Sci. 2012, 125, 3050–3057. [Google Scholar] [CrossRef] [Green Version]
- Halvaei, M.; Jamshidi, M.; Latifi, M. Effect of fiber geometry and tenacity on the mechanical properties of fine aggregates concrete. J. Ind. Text. 2016, 45, 1083–1099. [Google Scholar] [CrossRef]
- Gupta, B.; Revagade, N.; Hilborn, J. Poly(lactic acid) fiber: An overview. Prog. Polym. Sci. 2007, 32, 455–482. [Google Scholar] [CrossRef]
- Liu, W.; Gao, Y.; Liu, X.; Qiu, Y.; Xu, F. Tensile and interfacial properties of dry−jet wet−spun and wet−spun polyacrylonitrile−based carbon fibers at cryogenic condition. J. Eng. Fibers Fabr. 2019, 14. [Google Scholar] [CrossRef] [Green Version]
- Migliaresi, C.; De Lollis, A.; Fambri, L.; Cohn, D. The effect of thermal history on the crystallinity of different molecular weight PLLA biodegradable polymers. Clin. Mater. 1991, 8, 111–118. [Google Scholar] [CrossRef]
- Fredi, G.; Karimi Jafari, M.; Dorigato, A.; Bikiaris, D.N.; Checchetto, R.; Favaro, M.; Brusa, R.S.; Pegoretti, A. Multifunctionality of Reduced Graphene Oxide in Bioderived Polylactide/Poly(Dodecylene Furanoate) Nanocomposite Films. Molecules 2021, 26, 2938. [Google Scholar] [CrossRef] [PubMed]
- Wu, T.-M.; Wu, C.-Y. Biodegradable poly(lactic acid)/chitosan−modified montmorillonite nanocomposites: Preparation and characterization. Polym. Degrad. Stab. 2006, 91, 2198–2204. [Google Scholar] [CrossRef]
- Batakliev, T.; Petrova−Doycheva, I.; Angelov, V.; Georgiev, V.; Ivanov, E.; Kotsilkova, R.; Casa, M.; Cirillo, C.; Adami, R.; Sarno, M.; et al. Effects of Graphene Nanoplatelets and Multiwall Carbon Nanotubes on the Structure and Mechanical Properties of Poly(lactic acid) Composites: A Comparative Study. Appl. Sci. 2019, 9, 469. [Google Scholar] [CrossRef] [Green Version]
- David, E.; Henton, P.G.; Lunt, J.; Randall, J. Polylactic Acid Technology. In Natural Fibers, Biopolymers, and Biocomposites; Amar, K., Mohanty, M.M., Drzal, L.Y., Eds.; CRC Press: Boca Raton, FL, USA, 2005. [Google Scholar]
- Viotto, R.S.; Maia, A.A.D.; Yamaji, F.M.; de Morais, L.C. Thermogravimetric investigation of spent shiitake substrate to solid biofuel. Can. J. Chem. Eng. 2018, 96, 845–854. [Google Scholar] [CrossRef]
- Farrington, D.W.; Lunt, J.; Davies, S.; Blackburn, R.S. 6–Poly(lactic acid) fibers. In Biodegradable and Sustainable Fibres; Blackburn, R.S., Ed.; Woodhead Publishing: Sawston, UK, 2005; pp. 191–220. [Google Scholar]


| PAF Content | As Spun | Draw Ratio 1 | Draw Ratio 2 | Draw Ratio 4 | |
|---|---|---|---|---|---|
| 0 wt % | PLA−as | PLA−DR1 | PLA−DR2 | PLA−DR4 | |
| PEF | 2.5 wt % | PEF−2.5%−as | PEF−2.5%−DR1 | PEF−2.5%−DR2 | PEF−2.5%DR4 |
| 5 wt % | PEF−5%−as | PEF−5%−DR1 | PEF−5%−DR2 | PEF−5%−DR4 | |
| 10 wt % | PEF−10%−as | PEF−10%−DR1 | PEF−10%−DR2 | PEF−10%−DR4 | |
| PDoF | 2.5 wt % | PDoF−2.5%−as | PDoF−2.5%−DR1 | PDoF−2.5%−DR2 | PDoF−2.5%−DR4 |
| 5 wt % | PDoF−5%−as | PDoF−5%−DR1 | PDoF−5%−DR2 | PDoF−5%−DR4 | |
| 10 wt % | PDoF−10%−as | PDoF−10%−DR1 | PDoF−10%−DR2 | PDoF−10%−DR4 |
| Sample | Fiber Diameter (μm) | Circularity |
|---|---|---|
| PLA−as | 113 ± 23 | 0.80 ± 0.07 |
| PEF−2.5%−as | 66 ± 18 | 0.96 ± 0.04 |
| PEF−5%−as | 57 ± 16 | 0.95 ± 0.03 |
| PEF−10%−as | 60 ± 21 | 0.93 ± 0.06 |
| PDoF−2.5%−as | 57 ± 9 | 0.91 ± 0.05 |
| PDoF−5%−as | 92 ± 28 | 0.93 ± 0.04 |
| PDoF−10%−as | 65 ± 10 | 0.91 ± 0.04 |
| PLA−as | PEF−10%−as | PDoF−10%−as | PLA−DR2 | PEF−10%−DR2 | PDoF−10%−DR2 | |
|---|---|---|---|---|---|---|
| Average crystallite size (Å) | 311 | 331 | 322 | 332 | 390 | 368 |
| Preferred orientation (m.r.d) | 2.58 | 1.56 | 1.78 | 2.65 | 1.67 | 1.72 |
| Sample | TgPLA | TgPAF | TccPLA | ΔHccPLA | TmPLA | TmPAF | ΔHmPLA1/2 | ΔHmPAF | χPLA |
|---|---|---|---|---|---|---|---|---|---|
| (°C) | (°C) | (°C) | (J/g) | (°C) | (°C) | (J/g) | (J/g) | (%) | |
| First heating scan | |||||||||
| PLA−as | 37.4 | n.a. | 89.9 | 7.1 | 168.0 | n.a. | 37.7 | n.a. | 32.6 |
| PLA−DR2 | 47.3 | n.a. | 87.4 | 167.9 | n.a. | 34.9 | n.a. | 41.4 | |
| PEF−10%−as | 39.8 | − | 87.4 | 14.0 | 167.9 | 210.9 | 32.4/0.8 | 3.3 | 21.9 |
| PEF−10%−DR2 | 45.3 | − | − | − | 167.9 | 210.8 | 32.3/0.6 | 2.7 | 38.3 |
| PEF−as received | n.a. | 68.7 | 161.9 * | 46.0 * | n.a. | 211.6 | n.a. | 40.5 | n.a. |
| PDoF−10%−as | 31.7 | − | 82.0 | 14.6 | 168.8 | − | 34.3 | − | 23.3 |
| PDoF−10%−DR2 | 44.4 | − | − | − | 167.9 | − | 35.6 | − | 25.0 |
| PDoF−as received | n.a. | − | − | − | n.a. | 105.5 | n.a. | 61.3 | n.a. |
| Second heating scan | |||||||||
| PLA−as | 57.3 | n.a. | 126.2 | 30.8 | 165.3 | n.a. | 31.8 | n.a. | 1.1 |
| PLA−DR2 | 56.1 | n.a. | 121.8 | 32.5 | 165.2 | n.a. | 34.2 | n.a. | 1.8 |
| PEF−10%−as | 57.8 | 77.8 | 129.2 | 30.6 | 166.3 | 209.8 | 30.7 | 2.4 | 0.1 |
| PEF−10%−DR2 | 57.8 | − | 129.3 | 27.9 | 165.7 | 209.5 | 29.8 | 3.3 | 2.2 |
| PEF−as received | n.a. | 75.3 | 170.7 * | 25.7 * | n.a. | 211.8 | n.a. | 25.7 | n.a. |
| PDoF−10%−as | 58.1 | − | 107.6 | 35.5 | 168.4 | − | 35.5 | − | 0.0 |
| PDoF−10%−DR2 | 56.1 | − | 109.2 | 35.1 | 167.8 | − | 35.6 | − | 0.7 |
| PDoF−as received | n.a. | −18.6 | n.a. | n.a. | n.a. | 104.0 | n.a. | 63.2 | n.a. |
| Sample | Δm150 °C [%) | Tonset [°C) | TD [°C) | mfinal [%) |
|---|---|---|---|---|
| PLA−as | 7.0 | 317.9 | 333.5 | 0.00 |
| PEF−2.5%−as | 11.6 | 354.0 | 377.5 | 0.00 |
| PEF−5%−as | 11.1 | 354.8 | 376.2 | 0.00 |
| PEF−10%−as | 9.8 | 352.7 | 378.2 | 0.55 |
| PEF−as received | − | 383.9 | 396.8 | 13.65 |
| PDoF−2.5%−as | 10.2 | 351.1 | 372.3 | 0.05 |
| PDoF−5%−as | 7.3 | 354.9 | 373.8 | 0.00 |
| PDoF−10%−as | 9.3 | 352.7 | 374.0 | 0.00 |
| PDoF−as received | − | 392.3 | 411.0 | 0.10 |
| Sample | Titer (g/km) = (tex) | Tenacity (cN/tex) |
|---|---|---|
| PLA−as | 6.00 | 3.98 ± 0.01 |
| PEF 2.5%−as | 5.06 | 2.54 ± 0.01 |
| PEF 5%−as | 4.94 | 2.57 ± 0.01 |
| PEF 10%−as | 4.59 | 1.76 ± 0.01 |
| PDoF 2.5%−as | 5.29 | 2.61 ± 0.01 |
| PDoF 5%−as | 5.77 | 3.47 ± 0.01 |
| PDoF 10%−as | 6.24 | 1.95 ± 0.01 |
| PLA−DR2 | 2.71 | 4.02 ± 0.01 |
| PEF 10%−DR2 | 1.54 | 4.15 ± 0.01 |
| PDoF 10%−DR2 | 3.00 | 4.41 ± 0.01 |
Publisher’s Note: MDPI stays neutral with regard to jurisdictional claims in published maps and institutional affiliations. |
© 2022 by the authors. Licensee MDPI, Basel, Switzerland. This article is an open access article distributed under the terms and conditions of the Creative Commons Attribution (CC BY) license (https://creativecommons.org/licenses/by/4.0/).
Share and Cite
Fabris, C.; Perin, D.; Fredi, G.; Rigotti, D.; Bortolotti, M.; Pegoretti, A.; Xanthopoulou, E.; Bikiaris, D.N.; Dorigato, A. Improving the Wet-Spinning and Drawing Processes of Poly(lactide)/Poly(ethylene furanoate) and Polylactide/Poly(dodecamethylene furanoate) Fiber Blends. Polymers 2022, 14, 2910. https://doi.org/10.3390/polym14142910
Fabris C, Perin D, Fredi G, Rigotti D, Bortolotti M, Pegoretti A, Xanthopoulou E, Bikiaris DN, Dorigato A. Improving the Wet-Spinning and Drawing Processes of Poly(lactide)/Poly(ethylene furanoate) and Polylactide/Poly(dodecamethylene furanoate) Fiber Blends. Polymers. 2022; 14(14):2910. https://doi.org/10.3390/polym14142910
Chicago/Turabian StyleFabris, Claudia, Davide Perin, Giulia Fredi, Daniele Rigotti, Mauro Bortolotti, Alessandro Pegoretti, Eleftheria Xanthopoulou, Dimitrios N. Bikiaris, and Andrea Dorigato. 2022. "Improving the Wet-Spinning and Drawing Processes of Poly(lactide)/Poly(ethylene furanoate) and Polylactide/Poly(dodecamethylene furanoate) Fiber Blends" Polymers 14, no. 14: 2910. https://doi.org/10.3390/polym14142910
APA StyleFabris, C., Perin, D., Fredi, G., Rigotti, D., Bortolotti, M., Pegoretti, A., Xanthopoulou, E., Bikiaris, D. N., & Dorigato, A. (2022). Improving the Wet-Spinning and Drawing Processes of Poly(lactide)/Poly(ethylene furanoate) and Polylactide/Poly(dodecamethylene furanoate) Fiber Blends. Polymers, 14(14), 2910. https://doi.org/10.3390/polym14142910