
Increasing the Efficiency of a Control System for Detecting the Type and Amount of Oil Product Passing through Pipelines Based on Gamma-Ray Attenuation, Time Domain Feature Extraction, and Artificial Neural Networks

 , , , ,
Abstract
:1. Introduction
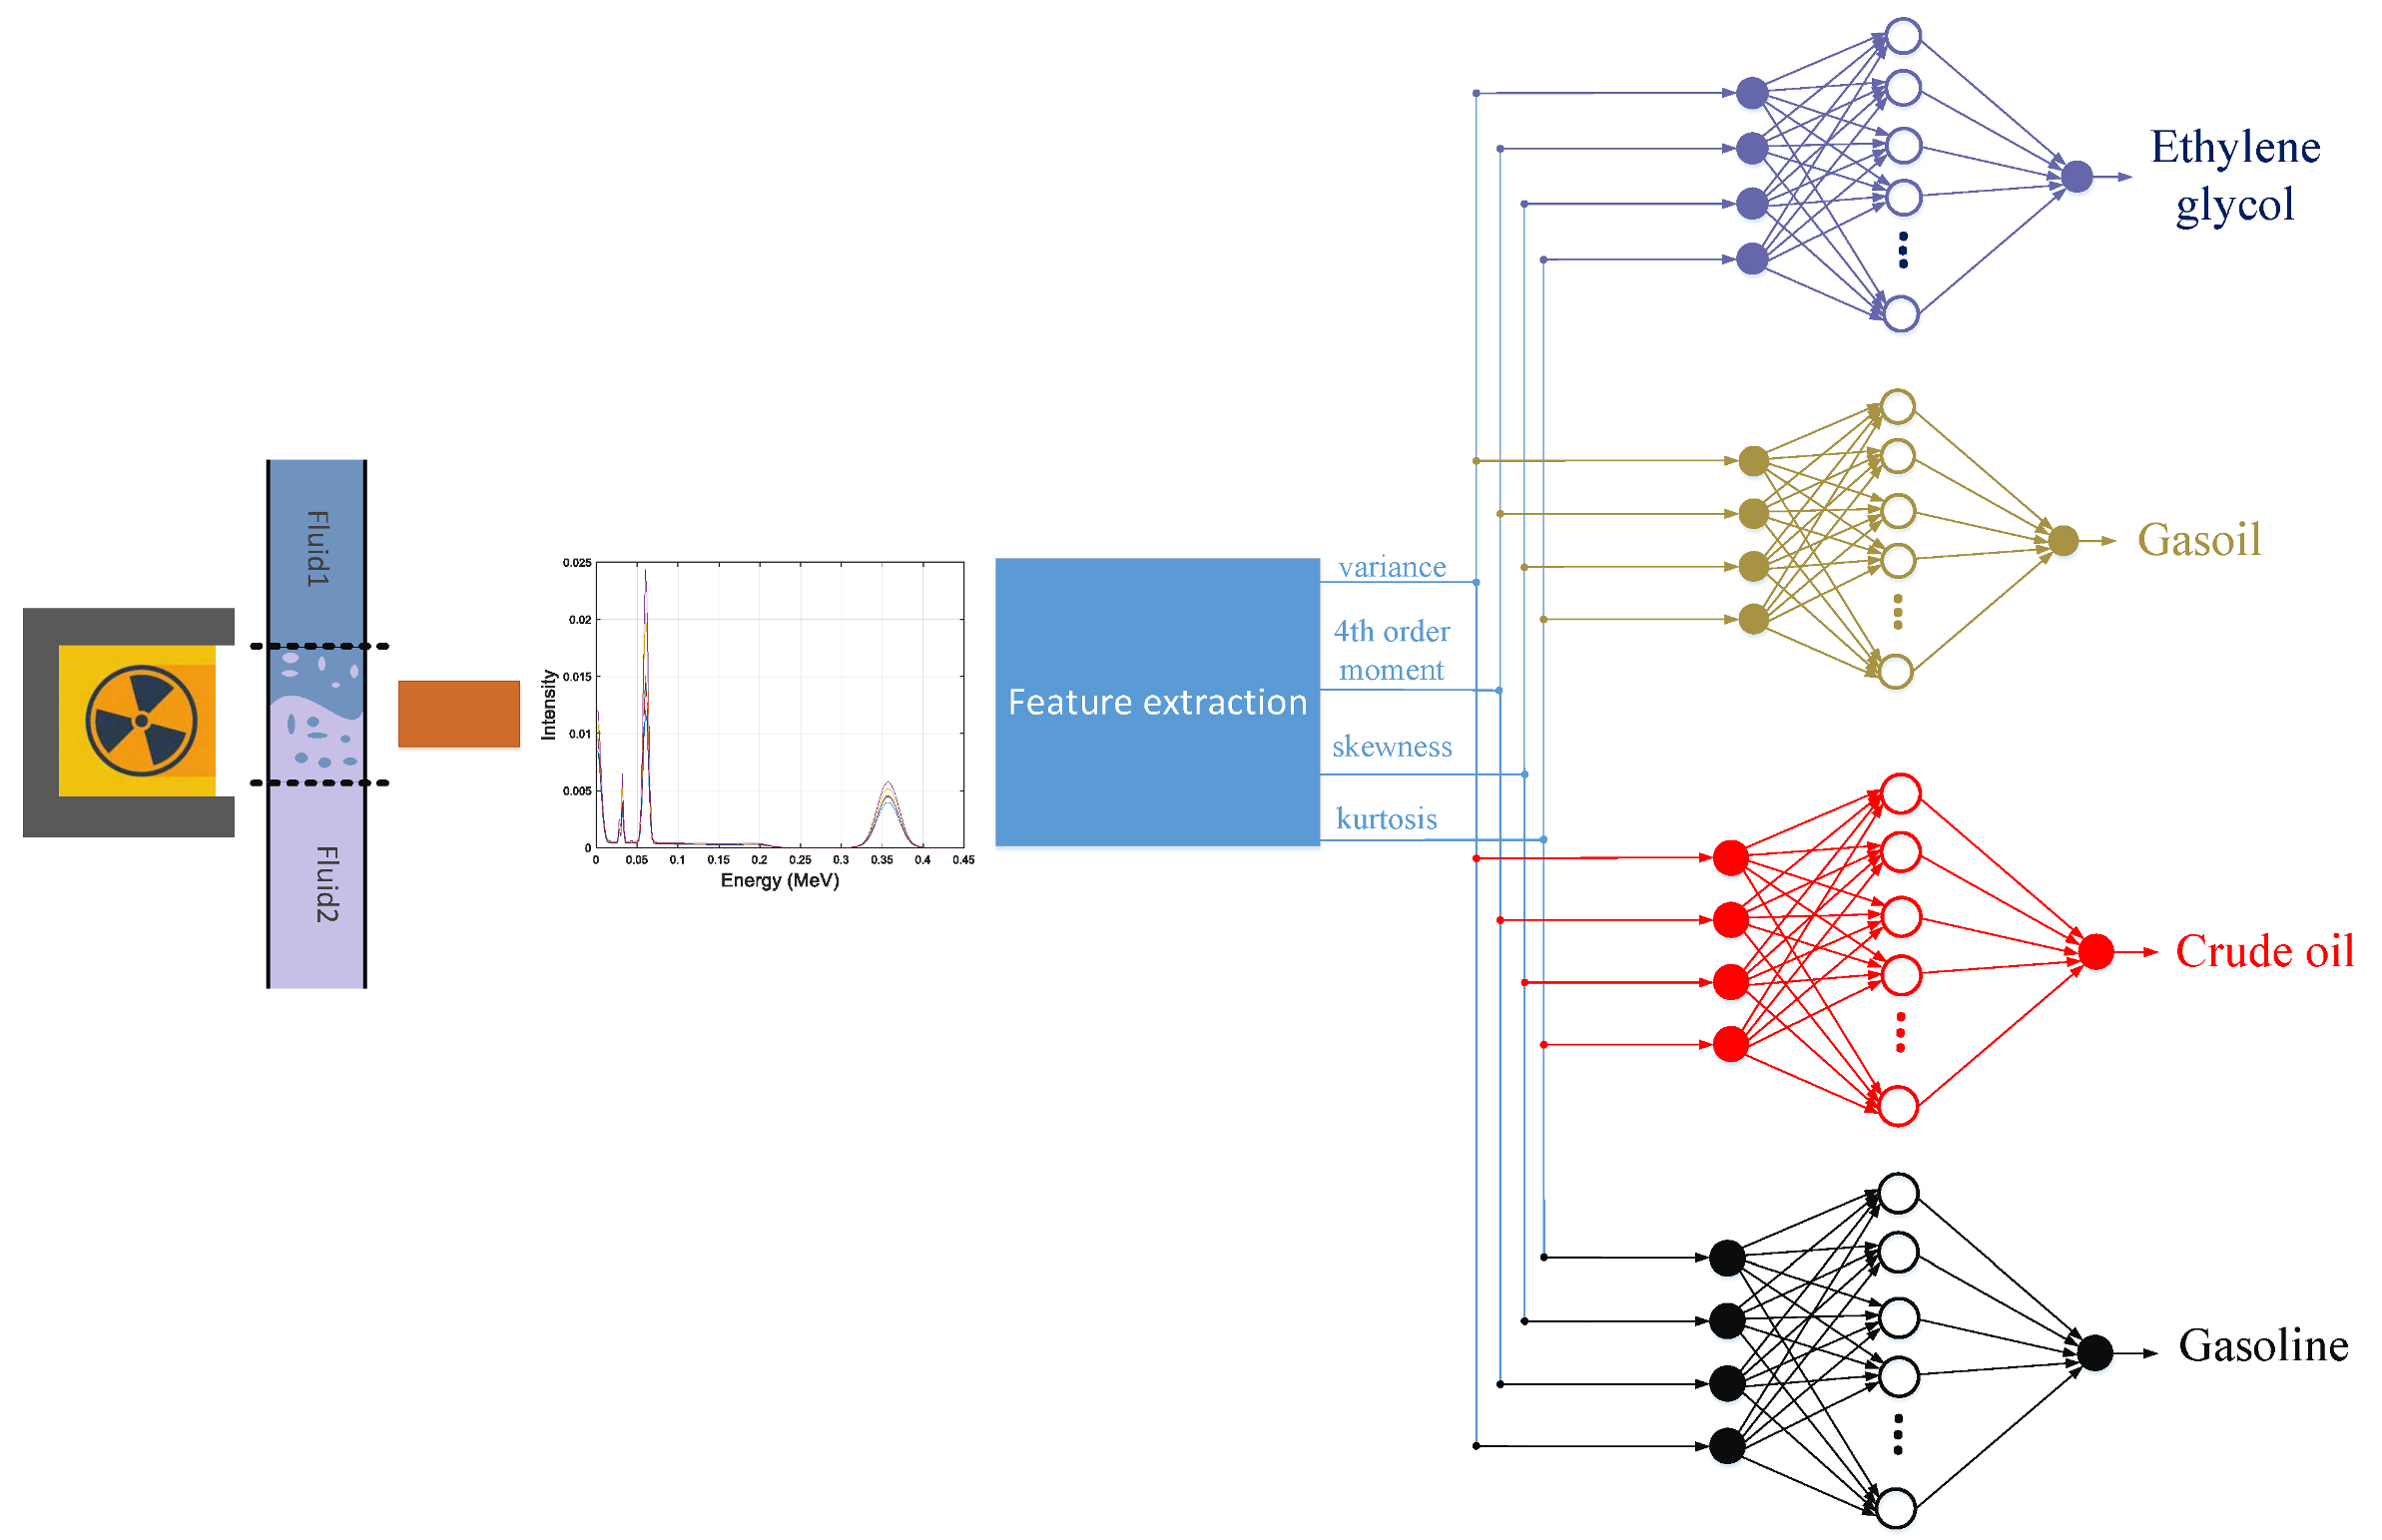
2. Simulation Geometry
3. Characteristic Extraction
- variance:
- fourth order moment:
- skewness:
- kurtosis:
4. Radial Basis Function Neural Network
5. Result and Discussion
6. Conclusions
Author Contributions
Funding
Institutional Review Board Statement
Informed Consent Statement
Data Availability Statement
Conflicts of Interest
References
- Hosseini, S.; Taylan, O.; Abusurrah, M.; Akilan, T.; Nazemi, E.; Eftekhari-Zadeh, E.; Bano, F.; Roshani, G.H. Application of Wavelet Feature Extraction and Artificial Neural Networks for Improving the Performance of Gas–Liquid Two-Phase Flow Meters Used in Oil and Petrochemical Industries. Polymers 2021, 13, 3647. [Google Scholar] [CrossRef] [PubMed]
- Nazemi, E.; Feghhi, S.A.H.; Roshani, G.H.; Peyvandi, R.G.; Setayeshi, S. Precise Void Fraction Measurement in Two-phase Flows Independent of the Flow Regime Using Gamma-ray Attenuation. Nucl. Eng. Technol. 2016, 48, 64–71. [Google Scholar] [CrossRef] [Green Version]
- Roshani, G.; Nazemi, E.; Feghhi, S. Investigation of using 60 Co source and one detector for determining the flow regime and void fraction in gas–liquid two-phase flows. Flow Meas. Instrum. 2016, 50, 73–79. [Google Scholar] [CrossRef]
- Roshani, G.H.; Karami, A.; Nazemi, E.; Shama, F. Volume fraction determination of the annular three-phase flow of gas-oil-water using adaptive neuro-fuzzy inference system. Comput. Appl. Math. 2018, 37, 4321–4341. [Google Scholar] [CrossRef]
- Roshani, M.; Phan, G.; Roshani, G.H.; Hanus, R.; Nazemi, B.; Corniani, E.; Nazemi, E. Combination of X-ray tube and GMDH neural network as a nondestructive and potential technique for measuring characteristics of gas-oil–water three phase flows. Measurement 2021, 168, 108427. [Google Scholar] [CrossRef]
- Roshani, G.H.; Karami, A.; Nazemi, E. An intelligent integrated approach of Jaya optimization algorithm and neu-ro-fuzzy network to model the stratified three-phase flow of gas–oil–water. Comput. Appl. Math. 2019, 38, 5. [Google Scholar] [CrossRef]
- Sattari, M.A.; Roshani, G.H.; Hanus, R. Improving the structure of two-phase flow meter using feature extraction and GMDH neural network. Radiat. Phys. Chem. 2020, 171, 108725. [Google Scholar] [CrossRef]
- Sattari, M.A.; Roshani, G.H.; Hanus, R.; Nazemi, E. Applicability of time-domain feature extraction methods and artificial intelligence in two-phase flow meters based on gamma-ray absorption technique. Measurement 2021, 168, 108474. [Google Scholar] [CrossRef]
- Roshani, M.; Sattari, M.A.; Ali PJ, M.; Roshani, G.H.; Nazemi, B.; Corniani, E.; Nazemi, E. Application of GMDH neural network technique to improve measuring precision of a simplified photon attenuation based two-phase flowmeter. Flow Meas. Instrum. 2020, 75, 101804. [Google Scholar] [CrossRef]
- Alamoudi, M.; Sattari, M.; Balubaid, M.; Eftekhari-Zadeh, E.; Nazemi, E.; Taylan, O.; Kalmoun, E. Application of Gamma Attenuation Technique and Artificial Intelligence to Detect Scale Thickness in Pipelines in Which Two-Phase Flows with Different Flow Regimes and Void Fractions Exist. Symmetry 2021, 13, 1198. [Google Scholar] [CrossRef]
- Roshani, M.; Phan, G.; Faraj, R.H.; Phan, N.H.; Roshani, G.H.; Nazemi, B.; Corniani, E.; Nazemi, E. Proposing a gamma radia-tion based intelligent system for simultaneous analyzing and detecting type and amount of petroleum by-products. Nucl. Eng. Technol. 2021, 53, 1277–1283. [Google Scholar] [CrossRef]
- Basahel, A.; Sattari, M.; Taylan, O.; Nazemi, E. Application of Feature Extraction and Artificial Intelligence Techniques for Increasing the Accuracy of X-ray Radiation Based Two Phase Flow Meter. Mathematics 2021, 9, 1227. [Google Scholar] [CrossRef]
- Taylan, O.; Sattari, M.A.; Essoussi, I.E.; Nazemi, E. Frequency Domain Feature Extraction Investigation to Increase the Accuracy of an Intelligent Nondestructive System for Volume Fraction and Regime Determination of Gas-Water-Oil Three-Phase Flows. Mathematics 2021, 9, 2091. [Google Scholar] [CrossRef]
- Roshani, G.H.; Ali, P.J.M.; Mohammed, S.; Hanus, R.; Abdulkareem, L.; Alanezi, A.A.; Sattari, M.A.; Amiri, S.; Nazemi, E.; Eftekhari-Zadeh, E.; et al. Simula-tion Study of Utilizing X-ray Tube in Monitoring Systems of Liquid Petroleum Products. Processes 2021, 9, 828. [Google Scholar] [CrossRef]
- Balubaid, M.; Sattari, M.A.; Taylan, O.; Bakhsh, A.A.; Nazemi, E. Applications of Discrete Wavelet Transform for Feature Extraction to Increase the Accuracy of Monitoring Systems of Liquid Petroleum Products. Mathematics 2021, 9, 3215. [Google Scholar] [CrossRef]
- Mayet, A.M.; Alizadeh, S.M.; Nurgalieva, K.S.; Hanus, R.; Nazemi, E.; Narozhnyy, I.M. Extraction of Time-Domain Characteristics and Selection of Effective Features Using Correlation Analysis to Increase the Accuracy of Petroleum Fluid Monitoring Systems. Energies 2022, 15, 1986. [Google Scholar] [CrossRef]
- Nazemi, E.; Roshani, G.H.; Feghhi, S.A.H.; Setayeshi, S.; Zadeh, E.E.; Fatehi, A. Optimization of a method for identifying the flow regime and measuring void fraction in a broad beam gamma-ray attenuation technique. Int. J. Hydrogen Energy 2016, 41, 7438–7444. [Google Scholar] [CrossRef]
- Sattari, M.A.; Korani, N.; Hanus, R.; Roshani, G.H.; Nazemi, E. Improving the performance of gamma radiation based two phase flow meters using optimal time characteristics of the detector output signal extraction. J. Nucl. Sci. Technol. 2020, 41, 42–54. [Google Scholar]
- Isaev, A.A.; Aliev, M.M.O.; Drozdov, A.N.; Gorbyleva, Y.A.; Nurgalieva, K.S. Improving the Efficiency of Curved Wells’ Operation by Means of Progressive Cavity Pumps. Energies 2022, 15, 4259. [Google Scholar] [CrossRef]
- Lalbakhsh, A.; Mohamadpour, G.; Roshani, S.; Ami, M.; Roshani, S.; Sayem, A.S.M.; Alibakhshikenari, M.; Koziel, S. Design of a Compact Planar Transmission Line for Miniaturized Rat-Race Coupler With Harmonics Suppression. IEEE Access 2021, 9, 129207–129217. [Google Scholar] [CrossRef]
- Roshani, S.; Roshani, S. A compact coupler design using meandered line compact microstrip resonant cell (MLCMRC) and bended lines. Wirel. Netw. 2021, 27, 677–684. [Google Scholar] [CrossRef]
- Shukla, N.K.; Mayet, A.M.; Vats, A.; Aggarwal, M.; Raja, R.K.; Verma, R.; Muqeet, M.A. High speed integrated RF–VLC data communication system: Performance constraints and capac-ity considerations. Phys. Commun. 2022, 50, 101492. [Google Scholar] [CrossRef]
- Hookari, M.; Roshani, S.; Roshani, S. High-efficiency balanced power amplifier using miniaturized harmonics suppressed coupler. Int. J. RF Microw. Comput.-Aided Eng. 2020, 30, e22252. [Google Scholar] [CrossRef]
- Mayet, A.; Hussain, A.; Hussain, M. Three-terminal nanoelectromechanical switch based on tungsten nitride, an amor-phous metallic material. Nanotechnology 2016, 27, 035202. [Google Scholar] [CrossRef]
- Lotfi, S.; Roshani, S.; Roshani, S.; Gilan, M.S. Wilkinson power divider with band-pass filtering response and harmonics suppression using open and short stubs. Frequenz 2020, 74, 169–176. [Google Scholar] [CrossRef]
- Mayet, A.; Hussain, M. Amorphous WNx Metal For Accelerometers and Gyroscope. In Proceedings of the MRS Fall Meeting, Boston, MA, USA, 30 November–5 December 2014. [Google Scholar]
- Jamshidi, M.; Siahkamari, H.; Roshani, S.; Roshani, S. A compact Gysel power divider design using U-shaped and T-shaped resonators with harmonics suppression. Electromagnetics 2019, 39, 491–504. [Google Scholar] [CrossRef]
- Mayet, A.; Smith, C.E.; Hussain, M.M. Energy reversible switching from amorphous metal based nanoelectromechanical switch. In Proceedings of the Nanotechnology (IEEE-NANO), 2013 13th IEEE Conference, Beijing, China, 5–8 August 2013; pp. 366–369. [Google Scholar]
- Roshani, S.; Roshani, S. Two-section impedance transformer design and modeling for power amplifier applications. Appl. Comput. Electromagn. Soc. J. 2017, 32, 1042–1047. [Google Scholar]
- Khaibullina, K.S.; Sagirova, L.R.; Sandyga, M.S. Substantiation and selection of an inhibitor for preventing the formation of asphalt-resin-paraffin deposits. [Substanciação e seleção de um inibidor para evitar a formação de depósitos de asfalto-resina-parafina]. Period. Tche Quim. 2020, 17, 541–551. [Google Scholar]
- Jamshidi, M.B.; Roshani, S.; Talla, J.; Roshani, S.; Peroutka, Z. Size reduction and performance improvement of a microstrip Wil-kinson power divider using a hybrid design technique. Sci. Rep. 2021, 11, 7773. [Google Scholar] [CrossRef]
- Mayet, A.; Smith, C.; Hussain, M.M.; Smith, C. Amorphous metal based nanoelectromechanical switch. In Proceedings of the 2013 Saudi International Electronics, Communications and Photonics Conference, Riyadh, Saudi Arabia, 27–30 April 2013; pp. 1–5. [Google Scholar] [CrossRef]
- Hookari, M.; Roshani, S.; Roshani, S. Design of a low pass filter using rhombus-shaped resonators with an analytical LC equiv-alent circuit. Turk. J. Electr. Eng. Comput. Sci. 2020, 28, 865–874. [Google Scholar] [CrossRef]
- Khaibullina, K.S.; Korobov, G.Y.; Lekomtsev, A.V. Development of an asphalt-resin-paraffin deposits inhibitor and substantiation of the technological parameters of its injection into the bottom-hole formation zone. [Desenvolvimento de um inibidor de depósito de asfalto-resinaparafina e subscantiação dos parâmetros tecnológicos de sua injeção na zona de formação de furo inferior]. Period. Tche Quim. 2020, 17, 769–781. [Google Scholar]
- Pirasteh, A.; Roshani, S.; Roshani, S. Design of a miniaturized class F power amplifier using capacitor loaded transmission lines. Frequenz 2020, 74, 145–152. [Google Scholar] [CrossRef]
- Tikhomirova, E.A.; Sagirova, L.R.; Khaibullina, K.S. A review on methods of oil saturation modelling using IRAP RMS. IOP Conf. Ser. Earth Environ. Sci. 2019, 378, 012075. [Google Scholar] [CrossRef]
- Roshani, S.; Dehghani, K.; Roshani, S. A lowpass filter design using curved and fountain shaped resonators. Frequenz 2019, 73, 267–272. [Google Scholar] [CrossRef]
- Khaibullina, K. Technology to Remove Asphaltene, Resin and Paraffin Deposits in Wells Using Organic Solvents. In Proceedings of the SPE Annual Technical Conference and Exhibition, Dubai, United Arab Emirates, 26–28 September 2016. [Google Scholar] [CrossRef]
- Roshani, S.; Roshani, S. Design of a compact LPF and a miniaturized Wilkinson power divider using aperiodic stubs with harmonic suppression for wireless applications. Wirel. Netw. 2020, 26, 1493–1501. [Google Scholar] [CrossRef]
- Alanazi, A.K.; Alizadeh, S.M.; Nurgalieva, K.S.; Guerrero, J.W.G.; Abo-Dief, H.M.; Eftekhari-Zadeh, E.; Nazemi, E.; Narozhnyy, I.M. Optimization of X-ray Tube Voltage to Improve the Precision of Two Phase Flow Meters Used in Petroleum Industry. Sustainability 2021, 13, 13622. [Google Scholar] [CrossRef]
- Alanazi, A.K.; Alizadeh, S.M.; Nurgalieva, K.S.; Nesic, S.; Guerrero, J.W.G.; Abo-Dief, H.M.; Eftekhari-Zadeh, E.; Nazemi, E.; Narozhnyy, I.M. Application of Neural Network and Time-Domain Feature Extraction Techniques for Determining Volumetric Percentages and the Type of Two Phase Flow Regimes Independent of Scale Layer Thickness. Appl. Sci. 2022, 12, 1336. [Google Scholar] [CrossRef]
- Mayet, A.M.; Salama, A.S.; Alizadeh, S.M.; Nesic, S.; Guerrero, J.W.G.; Eftekhari-Zadeh, E.; Nazemi, E.; Iliyasu, A.M. Applying Data Mining and Artificial Intelligence Techniques for High Precision Measuring of the Two-Phase Flow’s Characteristics Independent of the Pipe’s Scale Layer. Electronics 2022, 11, 459. [Google Scholar] [CrossRef]
- Lalbakhsh, A.; Afzal, M.U.; Esselle, K.P.; Smith, S.L. Low-Cost Non-Uniform Metallic Lattice for Rectifying Aperture Near-Field of Electromagnetic Bandgap Resonator Antennas. IEEE Trans. Antennas Propag. 2020, 68, 3328–3335. [Google Scholar] [CrossRef]
- Paul, G.S.; Mandal, K.; Lalbakhsh, A. Single-layer ultra-wide stop-band frequency selective surface using interconnected square rings. AEU-Int. J. Electron. Commun. 2021, 132, 153630. [Google Scholar] [CrossRef]
- Lalbakhsh, A.; Afzal, M.U.; Esselle, K.P. Simulation-driven particle swarm optimization of spatial phase shifters. In Proceedings of the 18th IEEE international Conference on Electromagnetics in Advanced Applications (ICEAA), Cairns, Australia, 5–9 September 2016; pp. 428–430. [Google Scholar] [CrossRef]
- Lalbakhsh, A.; Lotfi-Neyestanak, A.A.; Naser-Moghaddasi, M. Microstrip Hairpin Bandpass Filter Using Modified Minkowski Fractal-for Suppression of Second Harmonic. IEICE Trans. Electron. 2012, E95-C, 378–381. [Google Scholar] [CrossRef]
- Hartman, E.J.; Keeler, J.D.; Kowalski, J.M. Layered neural networks with Gaussian hidden units as universal approximators. Neural Comput. 1990, 2, 210–215. [Google Scholar] [CrossRef]
- Yu, B.; He, X. Training radial basis function networks with differential evolution. In Proceedings of the IEEE International Conference on Granular Computing, Atlanta, GA, USA, 10–12 May 2006; pp. 369–372. [Google Scholar] [CrossRef] [Green Version]
- Çolak, A.B. An experimental study on the comparative analysis of the effect of the number of data on the error rates of artificial neural networks. Int. J. Energy Res. 2021, 45, 478–500. [Google Scholar] [CrossRef]
- Çolak, A.B.; Shafiq, A.; Sindhu, T.N. Modeling of Darcy–Forchheimer bioconvective Powell Eyring nanofluid with artificial neural network. Chin. J. Phys. 2022, 77, 2435–2453. [Google Scholar] [CrossRef]
- Shafiq, A.; Çolak, A.B.; Lone, S.A.; Sindhu, T.N.; Muhammad, T. Reliability modeling and analysis of mixture of exponential distributions using artificial neural net-work. Math. Methods Appl. Sci. 2022, 45, 1–21. [Google Scholar] [CrossRef]
- Hosseini, S.; Roshani, G.H.; Setayeshi, S. Precise gamma based two-phase flow meter using frequency feature extraction and only one detector. Flow Meas. Instrum. 2020, 72, 101693. [Google Scholar] [CrossRef]
- Roshani, M.; Ali, P.J.; Roshani, G.H.; Nazemi, B.; Corniani, E.; Phan, N.H.; Tran, H.N.; Nazemi, E. X-ray tube with artificial neural net-work model as a promising alternative for radioisotope source in radiation based two phase flowmeters. Appl. Radia-Tion Isot. 2020, 164, 109255. [Google Scholar] [CrossRef]
- Peyvandi, R.G.; Rad, S.I. Application of artificial neural networks for the prediction of volume fraction using spectra of gamma rays backscattered by three-phase flows. Eur. Phys. J. Plus 2017, 132, 511. [Google Scholar] [CrossRef]
- Roshani Gholam, H.; Ehsan, N.; Farzin, S.; Imani Mohammad, A.; Salar, M. Designing a simple radiometric system to predict void fraction percentage independent of flow pattern using radial basis function. Metrol. Meas. Syst. 2018, 25, 347–358. [Google Scholar]
- Roshani, G.H.; Nazemi, E.; Feghhi, S.A.H.; Setayeshi, S. Flow regime identification and void fraction prediction in two-phase flows based on gamma ray attenuation. Measurement 2015, 62, 25–32. [Google Scholar] [CrossRef]


| Output | Ethylene Glycol | Gasoil | Crude Oil | Gasoline | ||||
|---|---|---|---|---|---|---|---|---|
| Goal of MSE | 0 | 0 | 0 | 0 | ||||
| RBF spread | 3 | 1 | 2 | 2 | ||||
| Number of neurons in hidden layer | 26 | 35 | 24 | 30 | ||||
| Calculated MSE | Train data | Test data | Train data | Test data | Train data | Test data | Train data | Test data |
| 0.42 | 0.39 | 0.29 | 0.37 | 0.44 | 0.30 | 0.11 | 0.46 | |
| Calculated RMSE | 0.65 | 0.62 | 0.53 | 0.60 | 0.67 | 0.55 | 0.33 | 0.68 |
| Ethylene Glycol | Gasoil | Crude Oil | Gasoline | ||||||||||||
|---|---|---|---|---|---|---|---|---|---|---|---|---|---|---|---|
| Train | Test | Train | Test | Train | Test | Train | Test | ||||||||
| Target | Output | Target | Output | Target | Output | Target | Output | Target | Output | Target | Output | Target | Output | Target | Output |
| 0 | −0.0799 | 55 | 55.7664 | 85 | 85.0000 | 0 | 0.2894 | 0 | 0.0222 | 0 | −0.8937 | 0 | −1.1869 | 30 | 30.9895 |
| 0 | 0.5451 | 90 | 89.6545 | 0 | 0.0002 | 5 | 5.3342 | 45 | 45.0002 | 80 | 80.0845 | 15 | 15.0000 | 25 | 25.8423 |
| 50 | 50.4474 | 0 | 0.8107 | 80 | 79.9998 | 0 | 0.9726 | 70 | 70.0003 | 0 | −0.4189 | 0 | 0.0016 | 10 | 10.8828 |
| 0 | −0.4549 | 55 | 54.7951 | 0 | −0.0461 | 0 | 0.9229 | 0 | 0.0012 | 35 | 35.7593 | 85 | 84.9999 | 0 | −0.5858 |
| 0 | −0.1717 | 0 | 0.2951 | 0 | 0.0002 | 60 | 60.6648 | 0 | −0.0001 | 0 | 0.2964 | 0 | 0.0001 | 60 | 60.9125 |
| 15 | 15.0589 | 45 | 44.3924 | 30 | 30.0000 | 70 | 69.1665 | 45 | 45.0013 | 60 | 60.5500 | 0 | 0.0045 | 0 | 0.2852 |
| 0 | 0.0763 | 0 | 1.0496 | 0 | −0.0001 | 0 | 0.9414 | 0 | −0.0001 | 65 | 65.6113 | 0 | −0.0004 | 25 | 25.8621 |
| 85 | 85.3810 | 0 | 1.0521 | 20 | 20.0000 | 0 | −0.0233 | 10 | 10.5947 | 30 | 30.3222 | 0 | 0.0001 | 90 | 90.6989 |
| 35 | 35.4435 | 0 | 0.2638 | 45 | 45.0000 | 0 | 0.0150 | 0 | 0.0011 | 0 | 0.9706 | 5 | 5.2539 | 0 | 0.4766 |
| 0 | −1.0354 | 10 | 10.6388 | 35 | 35.0000 | 0 | 0.5105 | 0 | −0.0382 | 15 | 15.5022 | 0 | 0.0069 | 0 | 0.8508 |
| 0 | 0.3498 | 70 | 71.1897 | 15 | 15.0025 | 90 | 90.2923 | 60 | 59.9990 | 0 | −0.0634 | 0 | −0.0000 | 90 | 90.6827 |
| 100 | 100.021 | 0 | 0.9943 | 95 | 95.0000 | 85 | 85.3037 | 70 | 70.0007 | 0 | 0.3461 | 15 | 14.9922 | 30 | 30.1708 |
| 0 | 0.9045 | 60 | 60.2795 | 45 | 45.0000 | 40 | 40.5852 | 0 | −0.2289 | 40 | 40.2242 | 35 | 34.9999 | 20 | 20.4114 |
| 95 | 95.6545 | 60 | 60.1388 | 0 | −0.0000 | 0 | 0.8348 | 50 | 49.9994 | 0 | 0.0400 | 0 | 0.0077 | 5 | 4.3704 |
| 20 | 20.2404 | 0 | −0.8026 | 0 | −0.2426 | 55 | 55.9411 | 0 | −0.3832 | 0 | 0.2488 | 75 | 75.0001 | 30 | 30.0776 |
| 75 | 75.3576 | 0 | 0.0451 | 0 | 0.0000 | 50 | 50.8200 | 0 | −0.2498 | 35 | 35.2515 | 35 | 35.0650 | 0 | −1.0564 |
| 20 | 20.5529 | 0 | 0.3146 | 20 | 20.0823 | 10 | 10.6899 | 80 | 80.0000 | 0 | 0.0930 | 0 | −0.0028 | 0 | 0.7847 |
| 55 | 55.5412 | 0 | −0.6346 | 0 | 0.0000 | 35 | 35.3375 | 80 | 80.0000 | 20 | 20.7608 | 0 | 0.0004 | 80 | 80.5792 |
| 80 | 80.2990 | 35 | 35.7716 | 65 | 65.0000 | 0 | −0.8344 | 0 | −0.0000 | 0 | 0.7931 | 10 | 9.1463 | 0 | 0.2380 |
| 65 | 65.5295 | 50 | 50.6779 | 95 | 95.0000 | 0 | 0.5560 | 0 | 0.0001 | 0 | 0.9005 | 0 | −0.0000 | 0 | 0.9723 |
| 0 | 0.7638 | 0 | 0.4435 | 0 | 0.0292 | 0 | 0.1305 | 5 | 4.9997 | 95 | 95.2443 | 0 | 0.0004 | 60 | 60.8552 |
| 0 | −0.8924 | 0 | −0.4237 | 25 | 26.4295 | 0 | −0.3993 | 0 | −0.2098 | 65 | 65.4068 | 0 | −0.0006 | 95 | 95.4927 |
| 0 | 0.6232 | 0 | −0.8455 | 0 | 0.0000 | 0 | 0.1989 | 0 | −0.1053 | 15 | 15.1329 | 65 | 64.9998 | 65 | 65.8907 |
| 25 | 24.8888 | 5 | 5.3846 | 0 | −0.0037 | 0 | 0.6041 | 0 | −2.0528 | 10 | 10.3023 | 40 | 39.9988 | 20 | 20.6045 |
| 25 | 25.1076 | 0 | −0.7401 | 0 | 1.0932 | 0 | 0.4331 | 90 | 90.0000 | 0 | 0.3670 | 0 | −0.0886 | 40 | 40.2360 |
| 65 | 64.7951 | 0 | 0.5763 | 30 | 29.7598 | 0 | −0.1917 | 95 | 95.0000 | 55 | 55.9250 | 60 | 59.9999 | 0 | 0.2360 |
| 0 | −0.6268 | 0 | 0.3852 | 55 | 55.0011 | 75 | 75.0616 | 0 | 0.0012 | 15 | 15.1520 | 0 | −0.6505 | 0 | 0.3405 |
| 0 | 0.0490 | 0 | 0.6798 | 0 | 0.0000 | 0 | −0.2948 | 0 | 0.0024 | 45 | 45.6444 | 0 | 0.0059 | 20 | 20.7590 |
| 0 | −0.6229 | 0 | 0.4220 | 0 | 0.0000 | 0 | −0.8617 | 0 | 0.5337 | 30 | 30.5781 | 0 | −0.0005 | 0 | 0.9098 |
| 0 | 0.3576 | 90 | 89.6623 | 90 | 90.0000 | 45 | 45.9891 | 0 | −0.0071 | 90 | 90.9244 | 95 | 95.0000 | 40 | 40.7515 |
| 40 | 39.4357 | 0 | −0.1131 | 0 | 0.0019 | 80 | 80.0983 | 20 | 19.9598 | 0 | 0.6658 | 35 | 35.0000 | 85 | 85.8415 |
| 10 | 10.1857 | 5 | 5.1151 | 75 | 75.0000 | 0 | 1.0005 | 35 | 35.0022 | 0 | 0.6338 | 75 | 75.0000 | 0 | −0.8019 |
| 0 | 0.4982 | 95 | 95.5550 | 0 | −0.5813 | 0 | 0.5604 | 5 | 6.0738 | 0 | 0.9165 | 0 | 0.0495 | 0 | 0.2068 |
| 85 | 84.7521 | 25 | 25.8380 | 0 | 0.0196 | 90 | 90.5783 | 85 | 84.9999 | 25 | 25.1540 | 0 | 0.0006 | 0 | −0.6944 |
| 50 | 49.3888 | 0 | 0.6127 | 100 | 100.000 | 0 | −0.2137 | 85 | 85.0001 | 0 | 0.2235 | 45 | 45.0003 | 95 | 95.0399 |
| 75 | 75.5998 | - | - | 0 | 0.6066 | - | - | 40 | 40.0326 | - | - | 0 | −0.0001 | - | - |
| 40 | 40.3048 | - | - | 0 | 0.0000 | - | - | 75 | 75.0001 | - | - | 0 | −0.0064 | - | - |
| 0 | −0.2791 | - | - | 0 | 0.2134 | - | - | 0 | −0.2452 | - | - | 0 | 0.0021 | - | - |
| 15 | 15.2345 | - | - | 5 | 4.4292 | - | - | 0 | −0.0000 | - | - | 10 | 9.9998 | - | - |
| 0 | 0.0998 | - | - | 0 | 0.4372 | - | - | 0 | −0.0046 | - | - | 65 | 65.0000 | - | - |
| 0 | −0.0330 | - | - | 30 | 29.8013 | - | - | 70 | 69.9999 | - | - | 80 | 79.9997 | - | - |
| 0 | −0.0174 | - | - | 10 | 11.7721 | - | - | 0 | −1.2382 | - | - | 70 | 70.0000 | - | - |
| 0 | −0.7205 | - | - | 50 | 50.0000 | - | - | 50 | 50.0001 | - | - | 0 | 0.6206 | - | - |
| 20 | 19.7326 | - | - | 60 | 60.0000 | - | - | 30 | 29.9999 | - | - | 15 | 14.7291 | - | - |
| 60 | 59.4201 | - | - | 0 | −0.0388 | - | - | 50 | 50.0023 | - | - | 0 | −0.0000 | - | - |
| 0 | −0.0077 | - | - | 0 | −0.0017 | - | - | 0 | −0.3565 | - | - | 0 | −0.7858 | - | - |
| 0 | −0.2518 | - | - | 0 | 1.0294 | - | - | 0 | 0.0142 | - | - | 0 | −0.4207 | - | - |
| 15 | 14.8732 | - | - | 80 | 80.0000 | - | - | 65 | 65.0003 | - | - | 55 | 55.0000 | - | - |
| 0 | −0.9549 | - | - | 5 | 5.8091 | - | - | 0 | −0.0003 | - | - | 0 | −0.0084 | - | - |
| 30 | 29.6232 | - | - | 95 | 95.0000 | - | - | 0 | 2.7451 | - | - | 0 | −0.0025 | - | - |
| 75 | 74.9045 | - | - | 50 | 49.9970 | - | - | 0 | −0.0040 | - | - | 50 | 49.9994 | - | - |
| 0 | 0.9123 | - | - | 15 | 15.0002 | - | - | 75 | 75.0004 | - | - | 85 | 85.0000 | - | - |
| 30 | 29.7462 | - | - | 0 | −0.0003 | - | - | 0 | −0.4358 | - | - | 0 | −0.0002 | - | - |
| 30 | 30.1388 | - | - | 65 | 64.9998 | - | - | 0 | 0.5822 | - | - | 50 | 50.0000 | - | - |
| 80 | 80.0138 | - | - | 25 | 26.5605 | - | - | 95 | 95.0000 | - | - | 0 | −0.0035 | - | - |
| 95 | 94.5685 | - | - | 0 | 0.8941 | - | - | 55 | 55.0000 | - | - | 0 | −0.0004 | - | - |
| 45 | 45.5548 | - | - | 0 | 0.0009 | - | - | 0 | 0.0002 | - | - | 0 | −0.0000 | - | - |
| 0 | −0.4510 | - | - | 0 | 0.0000 | - | - | 25 | 25.2575 | - | - | 0 | 0.5518 | - | - |
| 0 | 0.0060 | - | - | 0 | 0.6777 | - | - | 85 | 85.0000 | - | - | 80 | 80.0000 | - | - |
| 0 | 0.8263 | - | - | 10 | 9.9997 | - | - | 40 | 39.9999 | - | - | 0 | −0.0211 | - | - |
| 35 | 34.8439 | - | - | 0 | −0.3033 | - | - | 0 | 0.0013 | - | - | 90 | 90.0000 | - | - |
| 70 | 70.2326 | - | - | 75 | 75.0000 | - | - | 75 | 75.0000 | - | - | 0 | 0.0001 | - | - |
| 10 | 10.0451 | - | - | 35 | 35.2954 | - | - | 0 | −0.0009 | - | - | 0 | 0.0280 | - | - |
| 0 | −1.0487 | - | - | 40 | 40.0000 | - | - | 0 | −0.0009 | - | - | 0 | 0.0000 | - | - |
| 0 | 0.5138 | - | - | 55 | 55.0000 | - | - | 0 | 0.5212 | - | - | 0 | 0.2641 | - | - |
| 0 | −0.1034 | - | - | 0 | −1.9185 | - | - | 0 | −0.1818 | - | - | 100 | 100.0000 | - | - |
| 0 | −0.0799 | - | - | 40 | 39.7019 | - | - | 25 | 24.9999 | - | - | 50 | 50.0002 | - | - |
| 90 | 89.8810 | - | - | 0 | 0.0017 | - | - | 5 | 4.9890 | - | - | 70 | 70.0000 | - | - |
| 45 | 45.0490 | - | - | 0 | 0.0000 | - | - | 0 | 0.0021 | - | - | 45 | 45.0004 | - | - |
| 85 | 85.1076 | - | - | 60 | 59.9987 | - | - | 100 | 100.0000 | - | - | 0 | 0.0012 | - | - |
| 65 | 65.2951 | - | - | 0 | −0.0000 | - | - | 60 | 59.9999 | - | - | 25 | 24.9994 | - | - |
| 5 | 5.6701 | - | - | 0 | 0.0000 | - | - | 90 | 89.9995 | - | - | 0 | −0.3680 | - | - |
| 0 | −0.3612 | - | - | 20 | 18.2032 | - | - | 0 | −1.3001 | - | - | 5 | 5.0004 | - | - |
| 0 | 0.0724 | - | - | 70 | 70.0000 | - | - | 0 | 0.1209 | - | - | 55 | 55.0008 | - | - |
| 0 | 0.2326 | - | - | 85 | 85.0000 | - | - | 0 | 0.0029 | - | - | 0 | −0.0036 | - | - |
| 0 | −4.2127 | - | - | 0 | −0.0000 | - | - | 10 | 9.9997 | - | - | 0 | 2.0414 | - | - |
| 70 | 69.6701 | - | - | 65 | 65.0000 | - | - | 55 | 55.0000 | - | - | 0 | 0.7757 | - | - |
| 0 | 0.6545 | - | - | 70 | 70.0000 | - | - | 0 | −0.0000 | - | - | 45 | 45.0000 | - | - |
| 0 | −0.2674 | - | - | 0 | 1.3162 | - | - | 20 | 17.2149 | - | - | 75 | 75.0002 | - | - |
| 80 | 80.0920 | - | - | 15 | 13.6166 | - | - | 0 | 0.0003 | - | - | 55 | 55.0004 | - | - |
| 0 | 1.0060 | - | - | 0 | 0.0000 | - | - | 0 | 3.3660 | - | - | 0 | −0.0002 | - | - |
| 0 | 0.2482 | - | - | 25 | 25.0000 | - | - | 0 | −0.0013 | - | - | 0 | 0.0022 | - | - |
| 40 | 39.9279 | - | - | 0 | 0.3553 | - | - | 0 | −0.0004 | - | - | 70 | 70.0000 | - | - |
| Refs. | Extracted Features | Type of Neural Network | Maximum MSE | Maximum RMSE |
|---|---|---|---|---|
| [7] | Time-domain | GMDH | 1.24 | 1.11 |
| [8] | Time-domain | MLP | 0.21 | 0.46 |
| [9] | Lack of feature extraction | GMDH | 7.34 | 2.71 |
| [54] | Frequency-domain | MLP | 0.67 | 0.82 |
| [55] | Lack of feature extraction | MLP | 17.05 | 4.13 |
| [56] | Lack of feature extraction | MLP | 2.56 | 1.6 |
| [current study] | Frequency-domain | RBF | 0.46 | 0.68 |
Publisher’s Note: MDPI stays neutral with regard to jurisdictional claims in published maps and institutional affiliations. |
© 2022 by the authors. Licensee MDPI, Basel, Switzerland. This article is an open access article distributed under the terms and conditions of the Creative Commons Attribution (CC BY) license (https://creativecommons.org/licenses/by/4.0/).
Share and Cite
Mayet, A.M.; Alizadeh, S.M.; Kakarash, Z.A.; Al-Qahtani, A.A.; Alanazi, A.K.; Grimaldo Guerrero, J.W.; Alhashimi, H.H.; Eftekhari-Zadeh, E. Increasing the Efficiency of a Control System for Detecting the Type and Amount of Oil Product Passing through Pipelines Based on Gamma-Ray Attenuation, Time Domain Feature Extraction, and Artificial Neural Networks. Polymers 2022, 14, 2852. https://doi.org/10.3390/polym14142852
Mayet AM, Alizadeh SM, Kakarash ZA, Al-Qahtani AA, Alanazi AK, Grimaldo Guerrero JW, Alhashimi HH, Eftekhari-Zadeh E. Increasing the Efficiency of a Control System for Detecting the Type and Amount of Oil Product Passing through Pipelines Based on Gamma-Ray Attenuation, Time Domain Feature Extraction, and Artificial Neural Networks. Polymers. 2022; 14(14):2852. https://doi.org/10.3390/polym14142852
Chicago/Turabian StyleMayet, Abdulilah Mohammad, Seyed Mehdi Alizadeh, Zana Azeez Kakarash, Ali Awadh Al-Qahtani, Abdullah K. Alanazi, John William Grimaldo Guerrero, Hala H. Alhashimi, and Ehsan Eftekhari-Zadeh. 2022. "Increasing the Efficiency of a Control System for Detecting the Type and Amount of Oil Product Passing through Pipelines Based on Gamma-Ray Attenuation, Time Domain Feature Extraction, and Artificial Neural Networks" Polymers 14, no. 14: 2852. https://doi.org/10.3390/polym14142852
APA StyleMayet, A. M., Alizadeh, S. M., Kakarash, Z. A., Al-Qahtani, A. A., Alanazi, A. K., Grimaldo Guerrero, J. W., Alhashimi, H. H., & Eftekhari-Zadeh, E. (2022). Increasing the Efficiency of a Control System for Detecting the Type and Amount of Oil Product Passing through Pipelines Based on Gamma-Ray Attenuation, Time Domain Feature Extraction, and Artificial Neural Networks. Polymers, 14(14), 2852. https://doi.org/10.3390/polym14142852