
Parameters Influencing Moisture Diffusion in Epoxy-Based Materials during Hygrothermal Ageing—A Review by Statistical Analysis

 , , , and
Abstract
:1. Introduction
- Highlighting material and ageing parameters influencing the diffusion parameters, by box plots and scatter plots;
- The correlation of the different quantitative parameters of the study by PCA;
- The separation of the data into four classified PCAs in order to propose more efficient correlations;
- Evidence of differences between PCA depending on the diffusion model and the type of material (resin or composite);
- Discussion of the limitations of using the diffusion models on epoxy-based materials.
2. Studied Parameters
3. Descriptive Statistics: Study of Dispersion
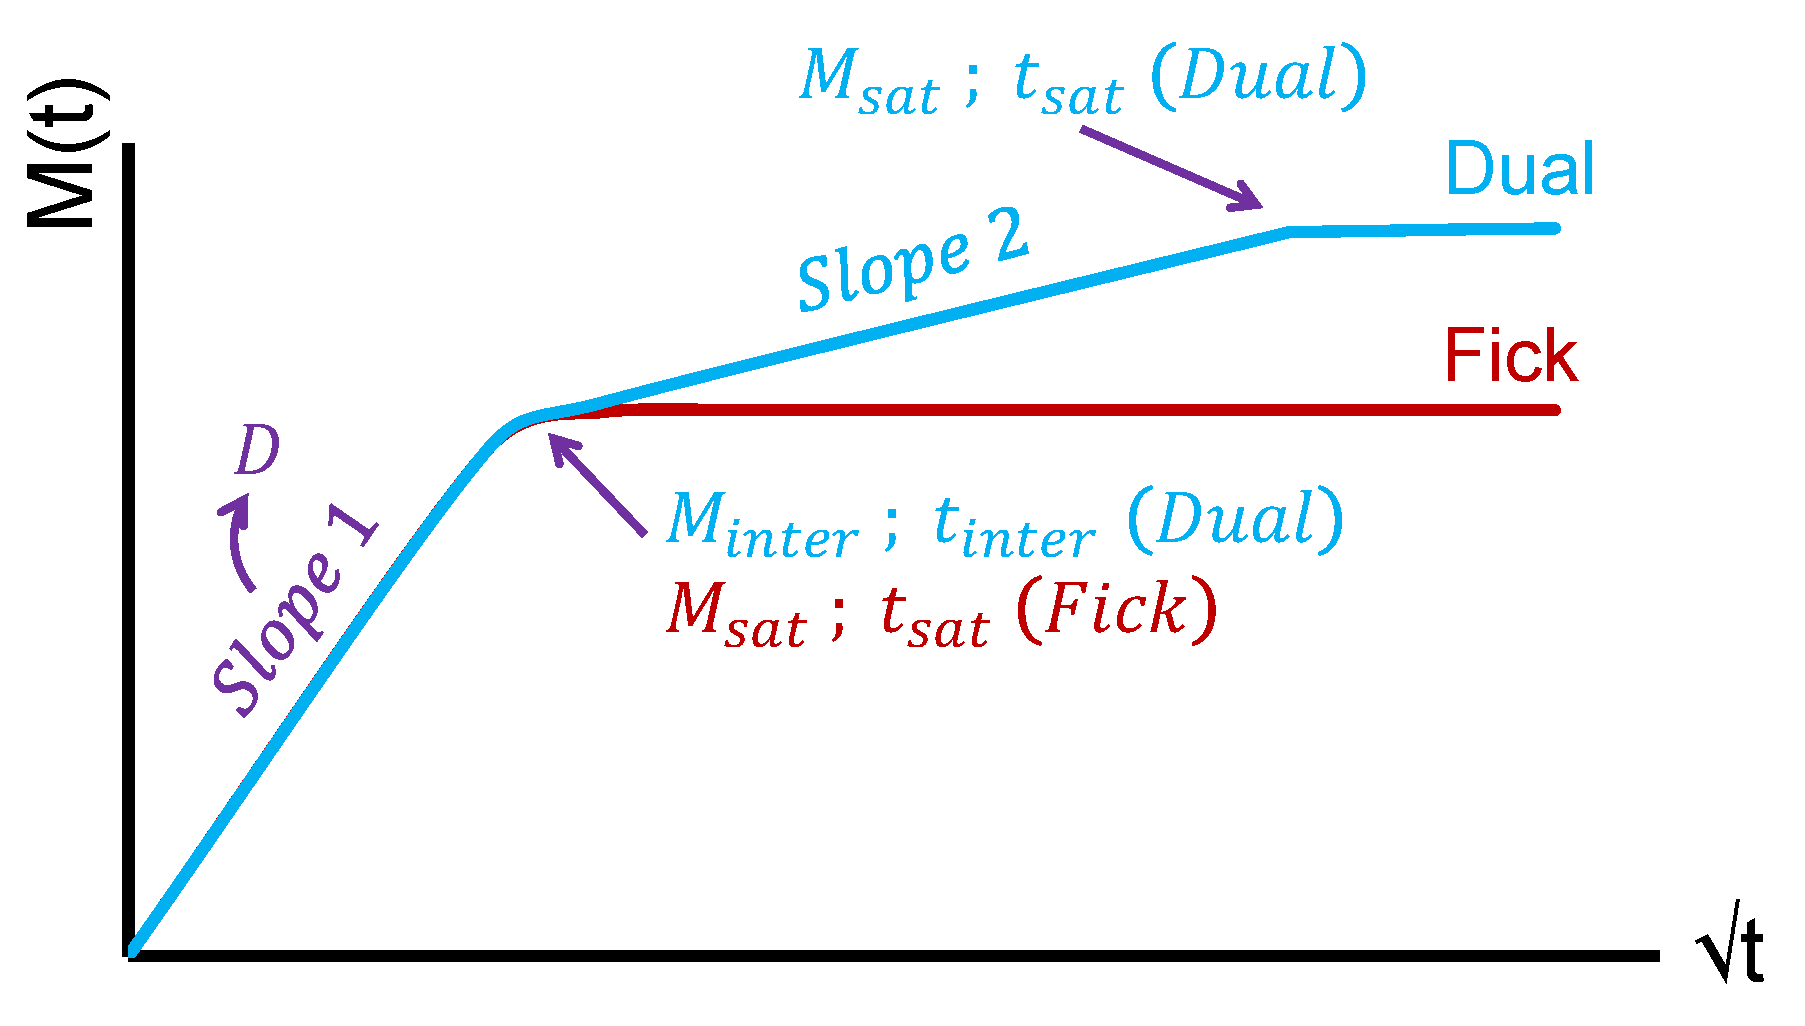
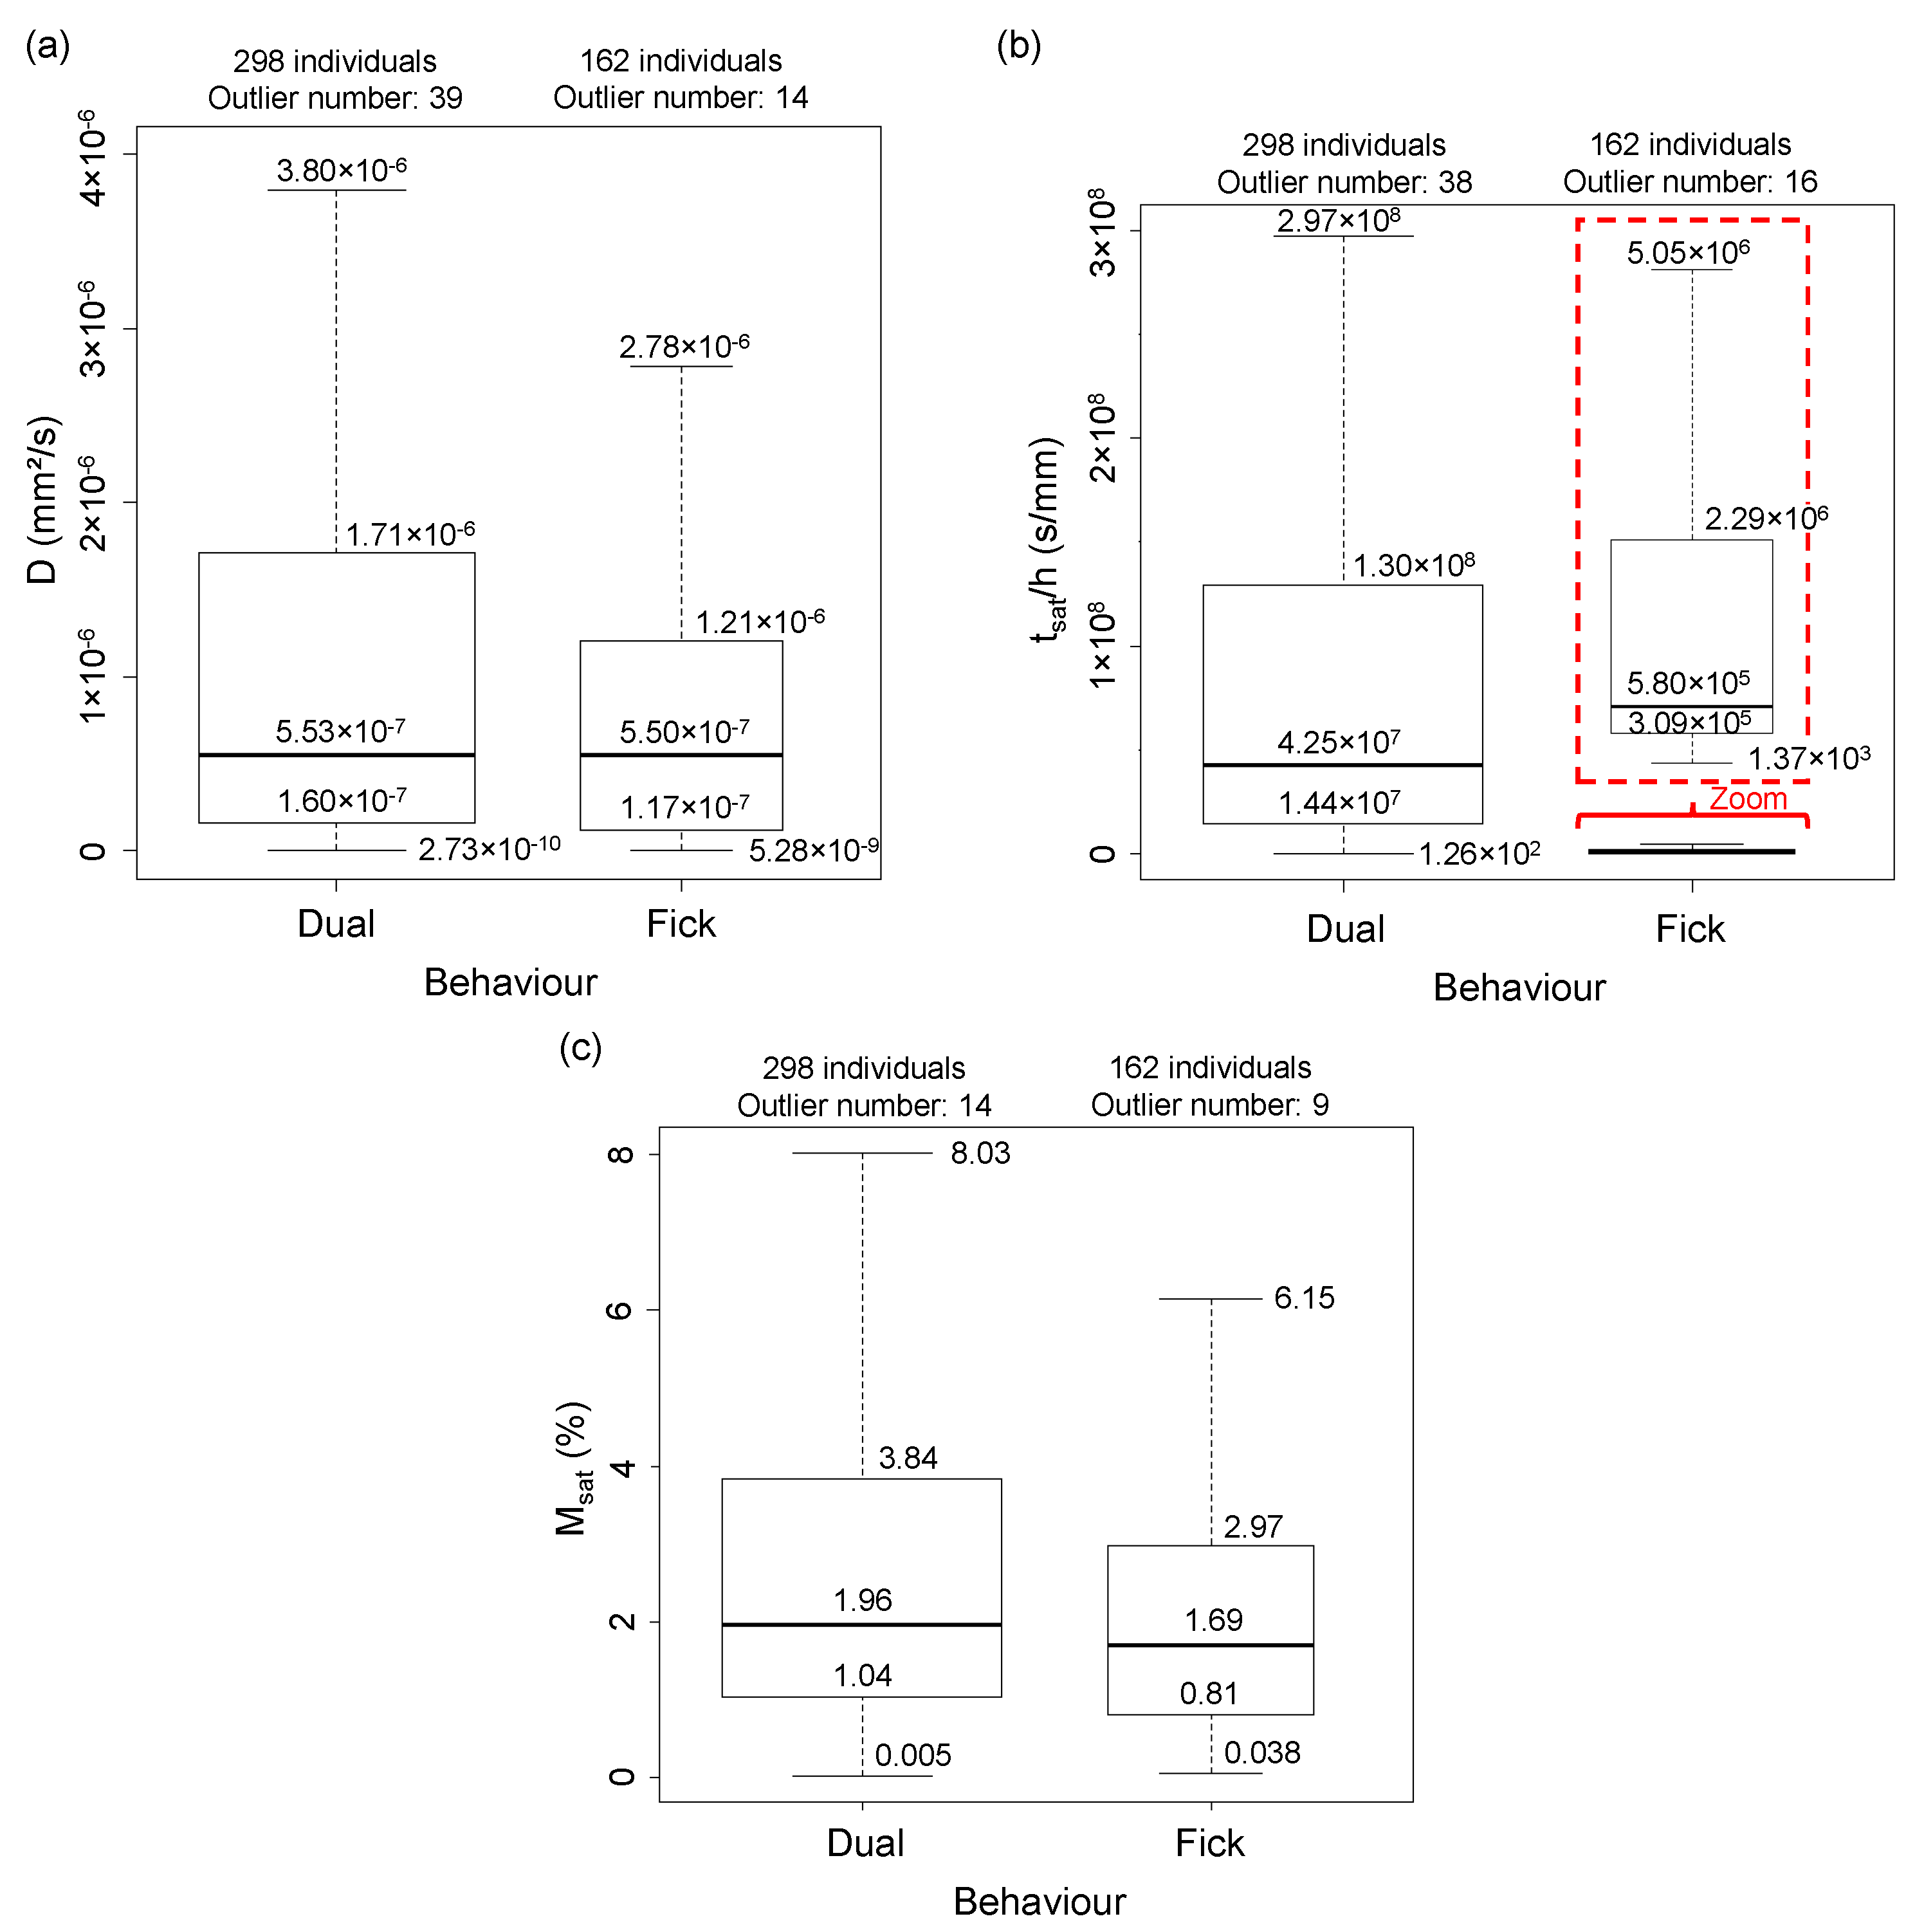
3.1. Diffusion Behaviour
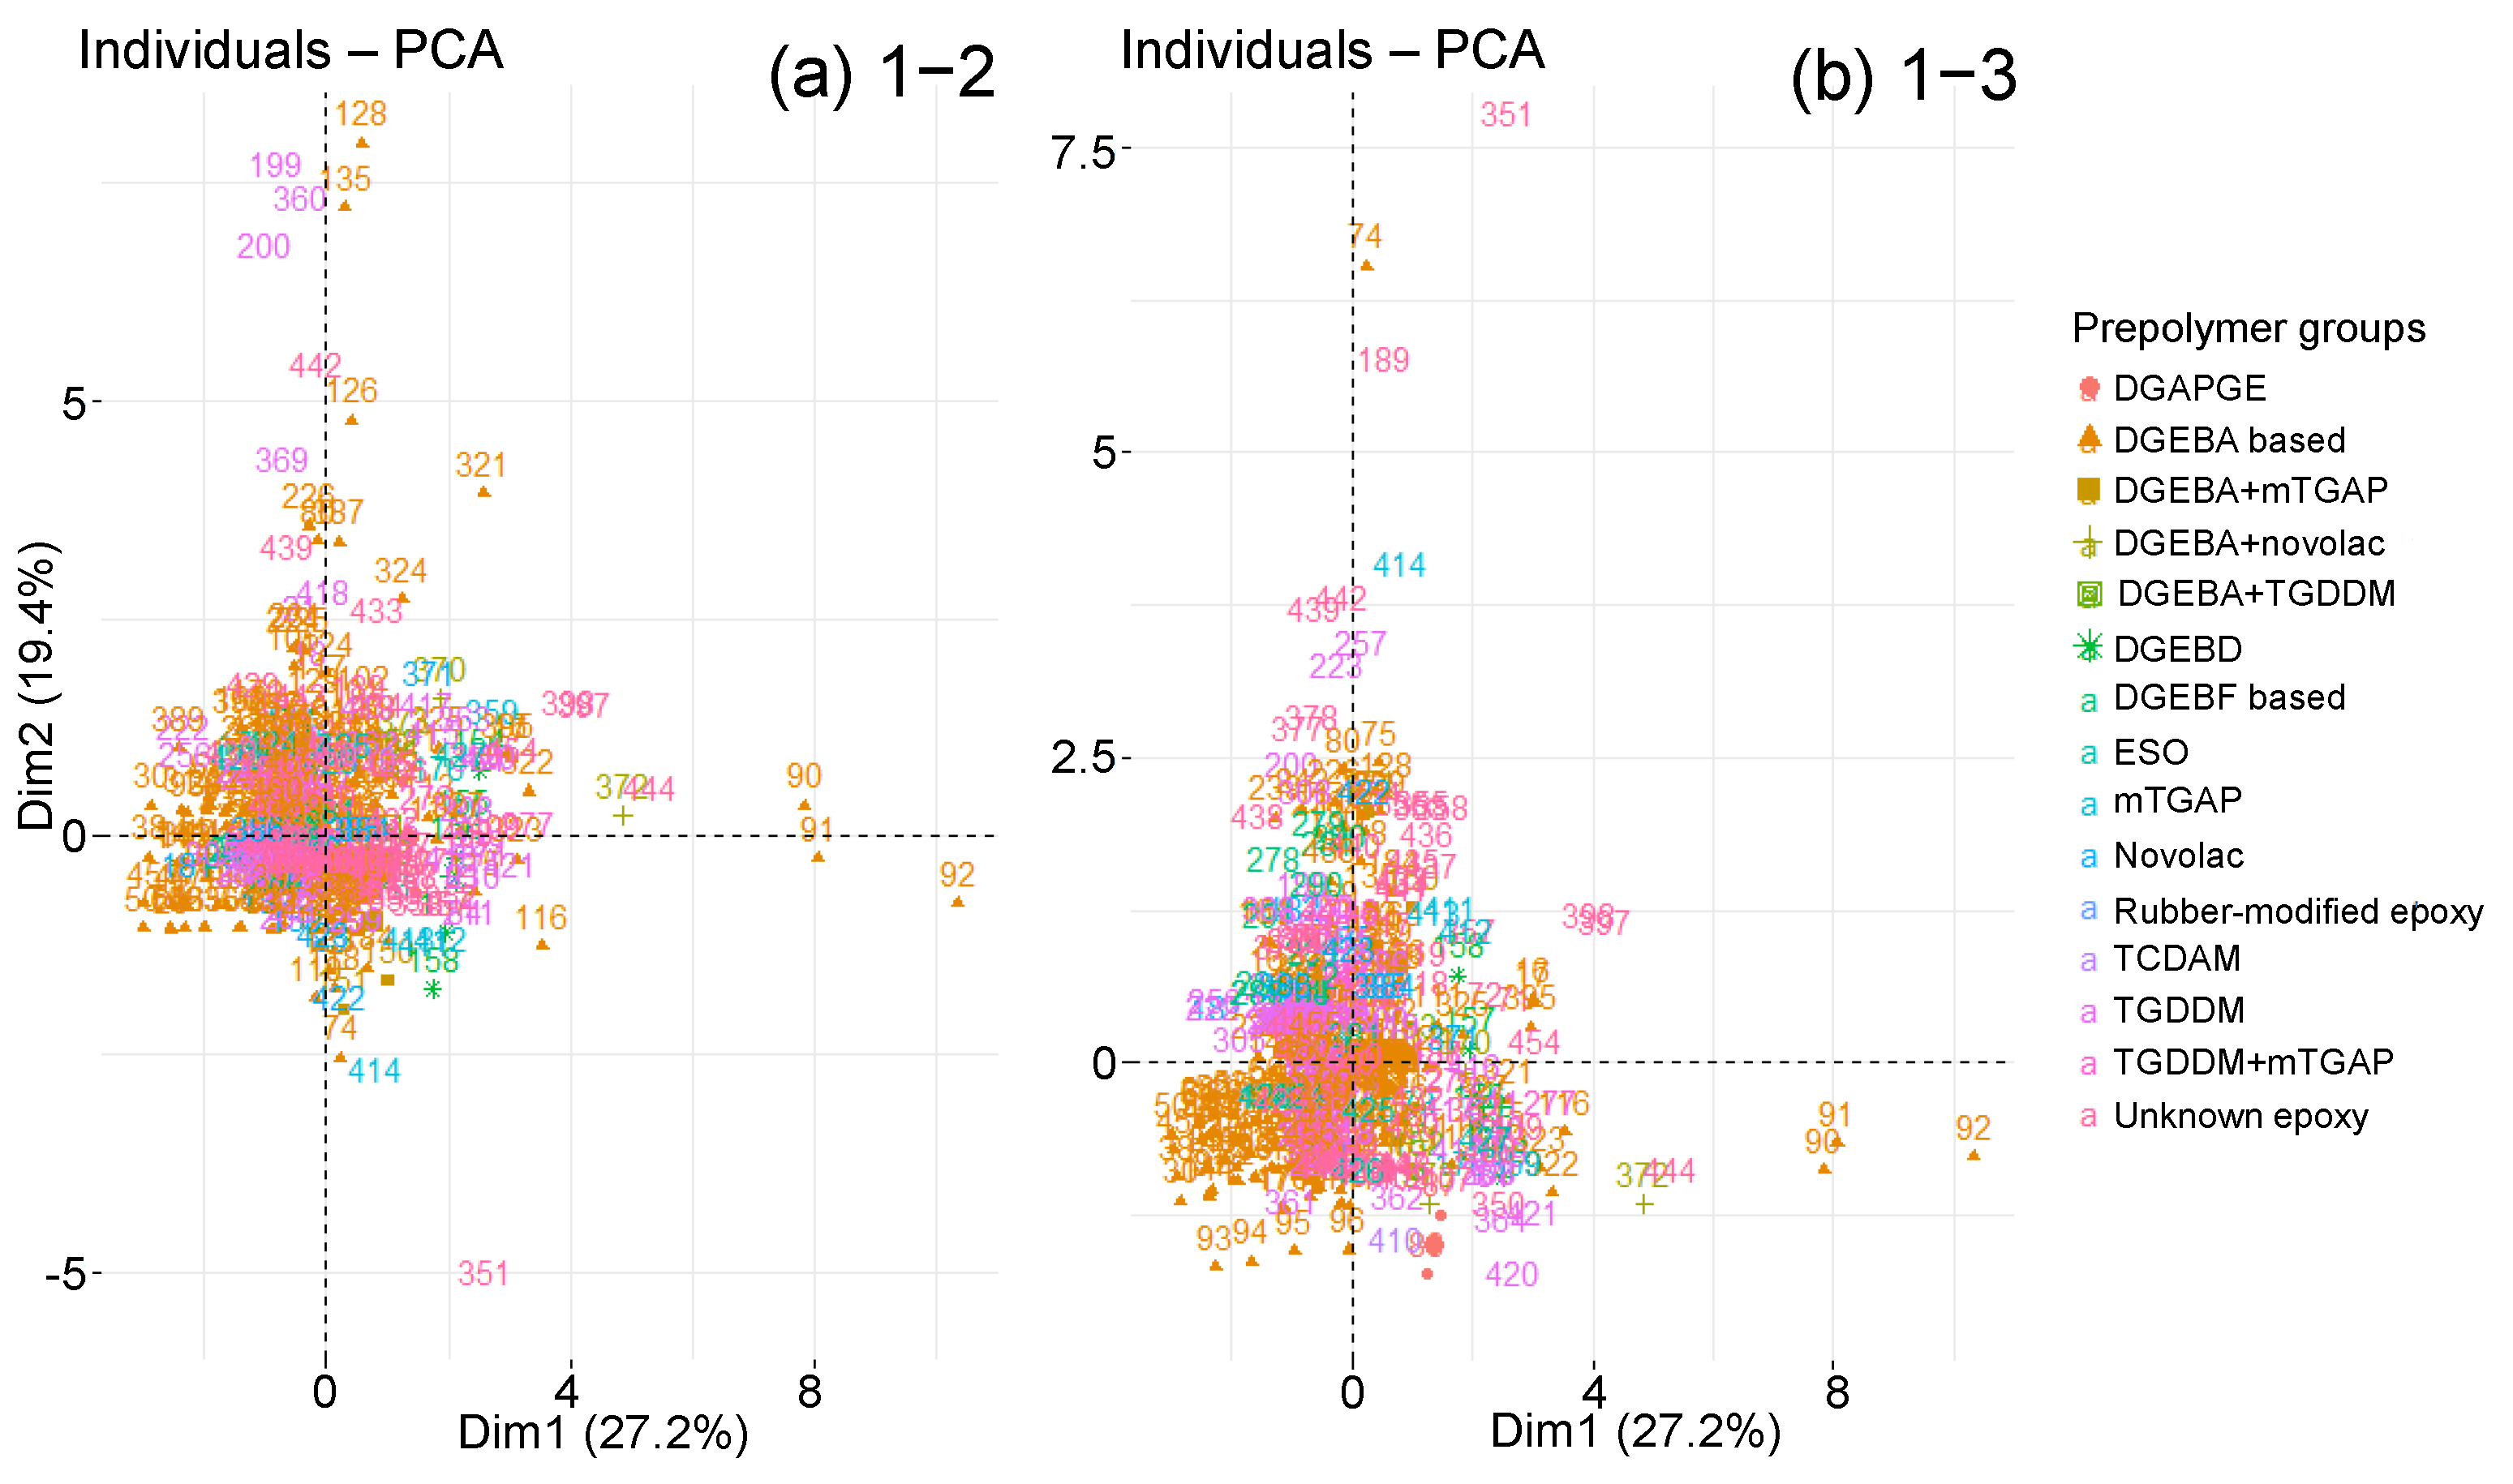
3.2. Epoxy Prepolymer Type
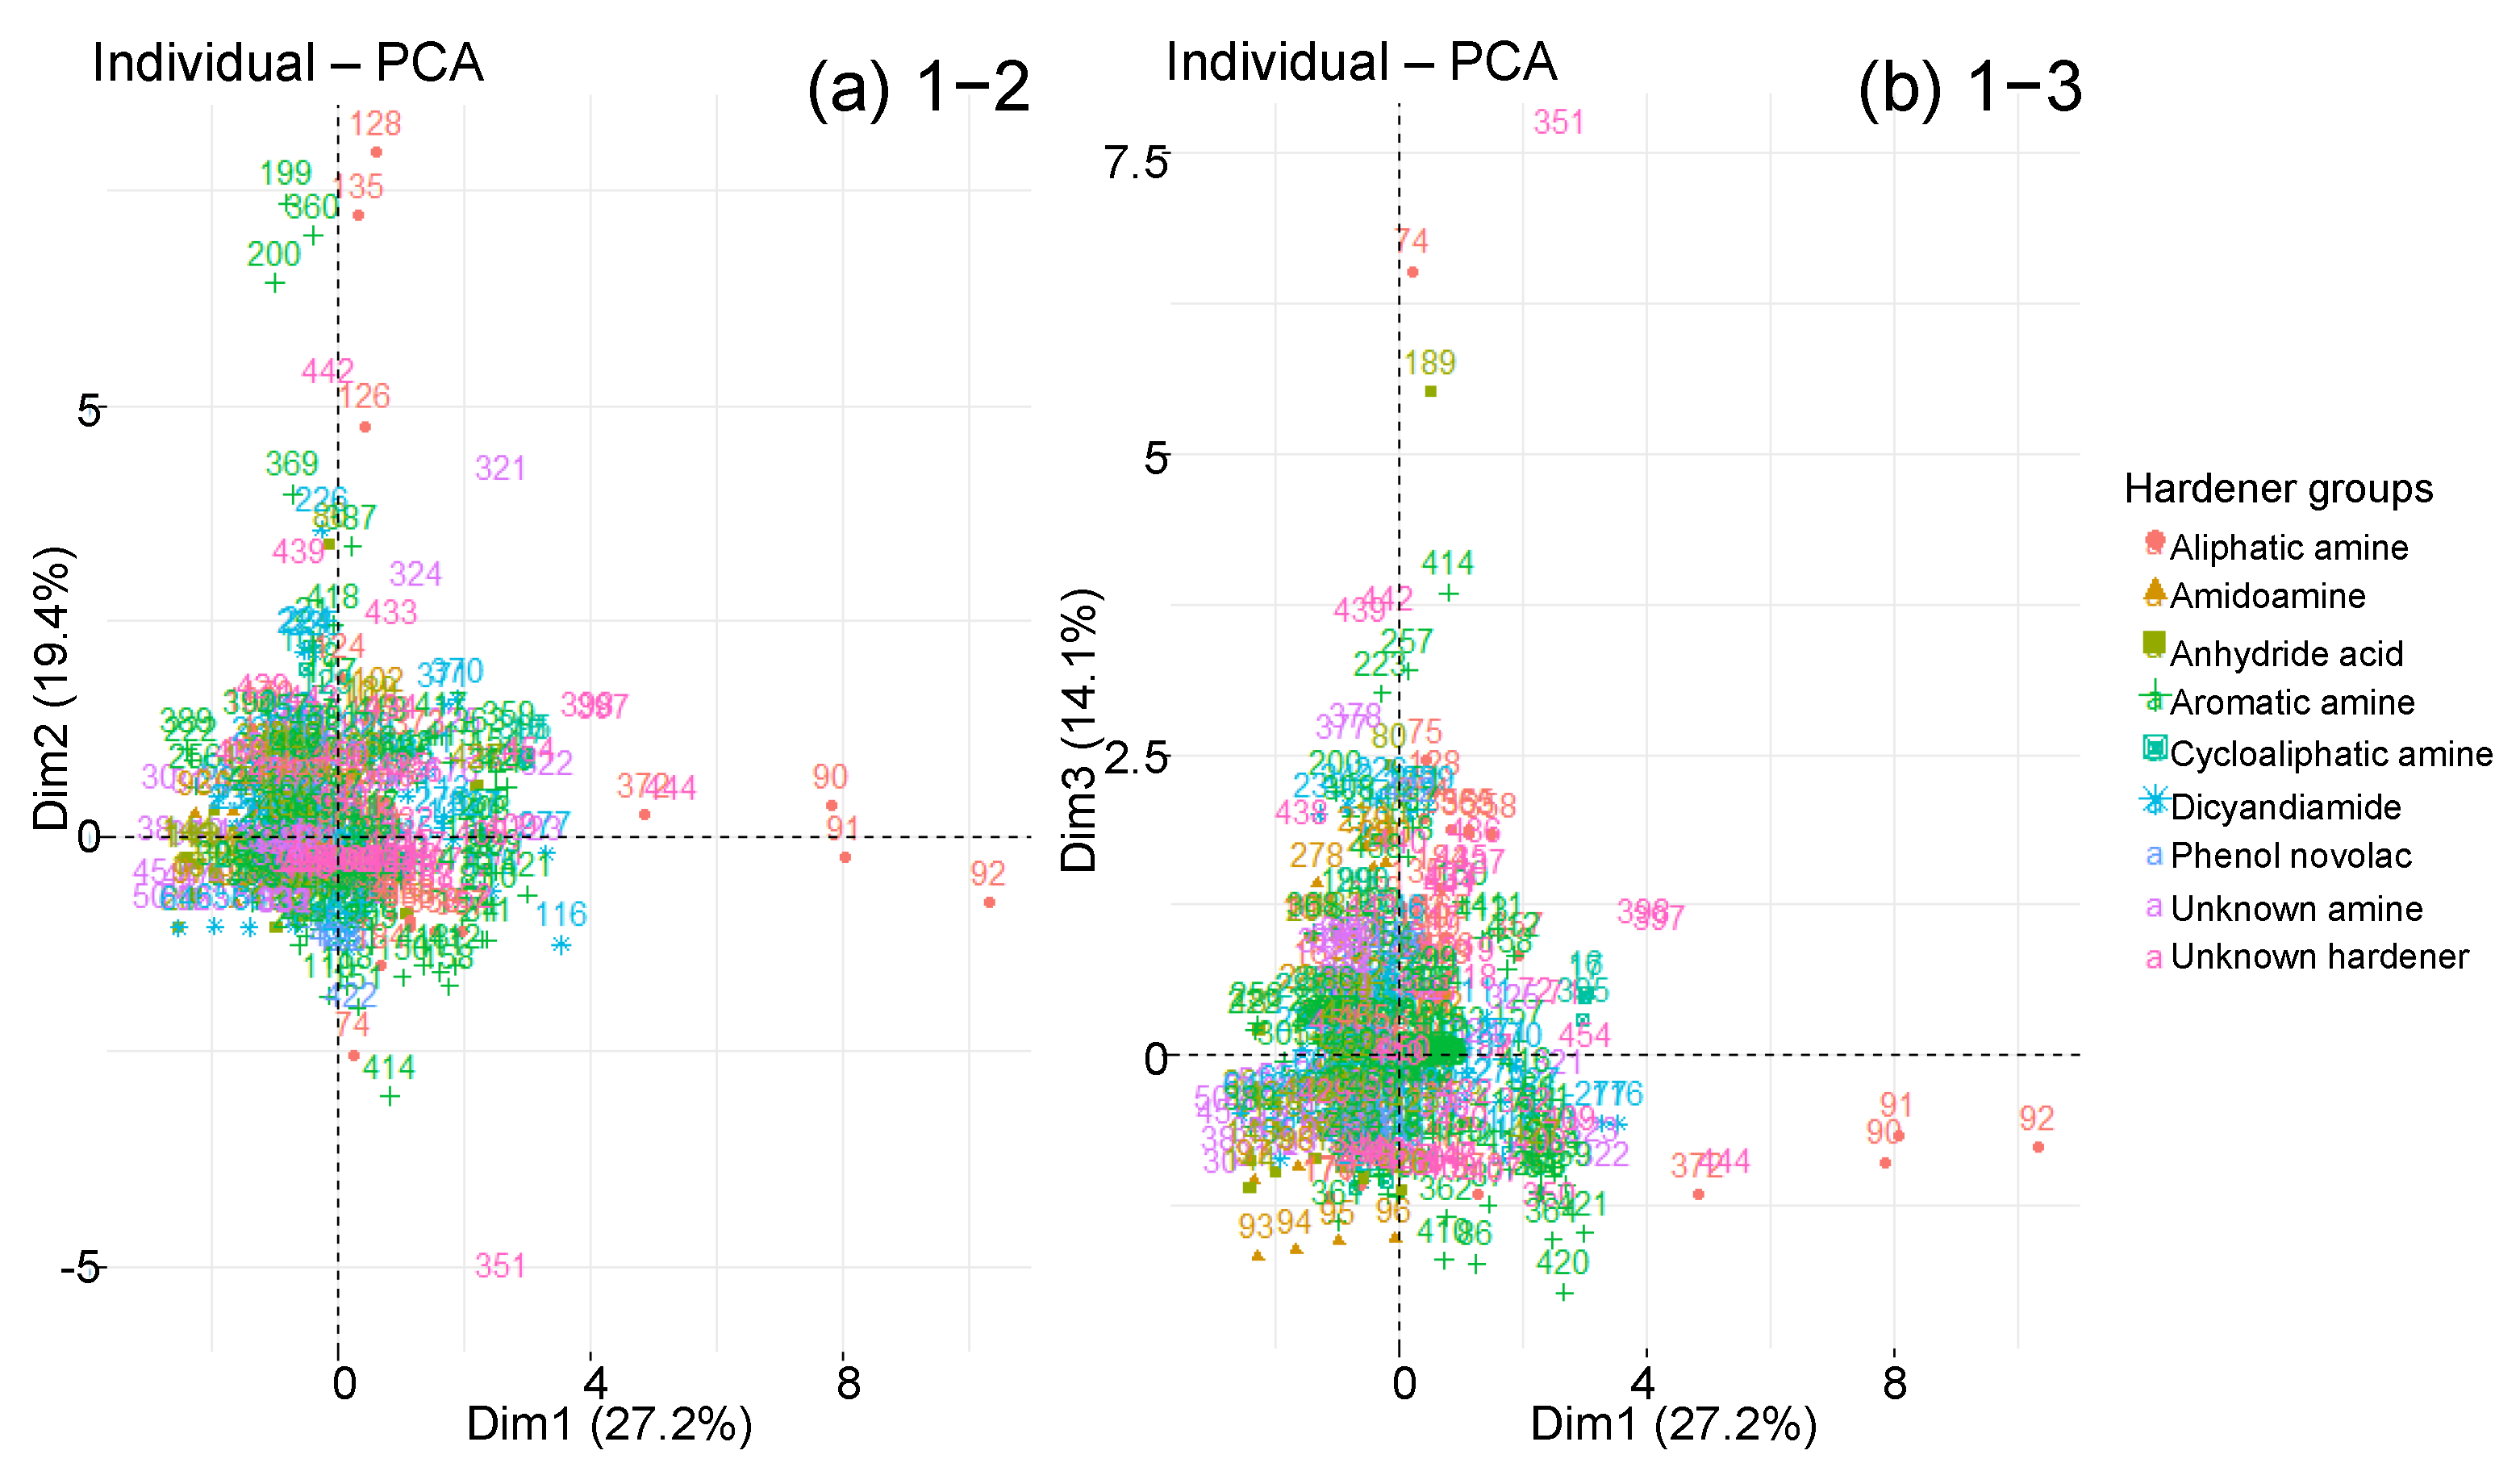
3.3. Hardener Type
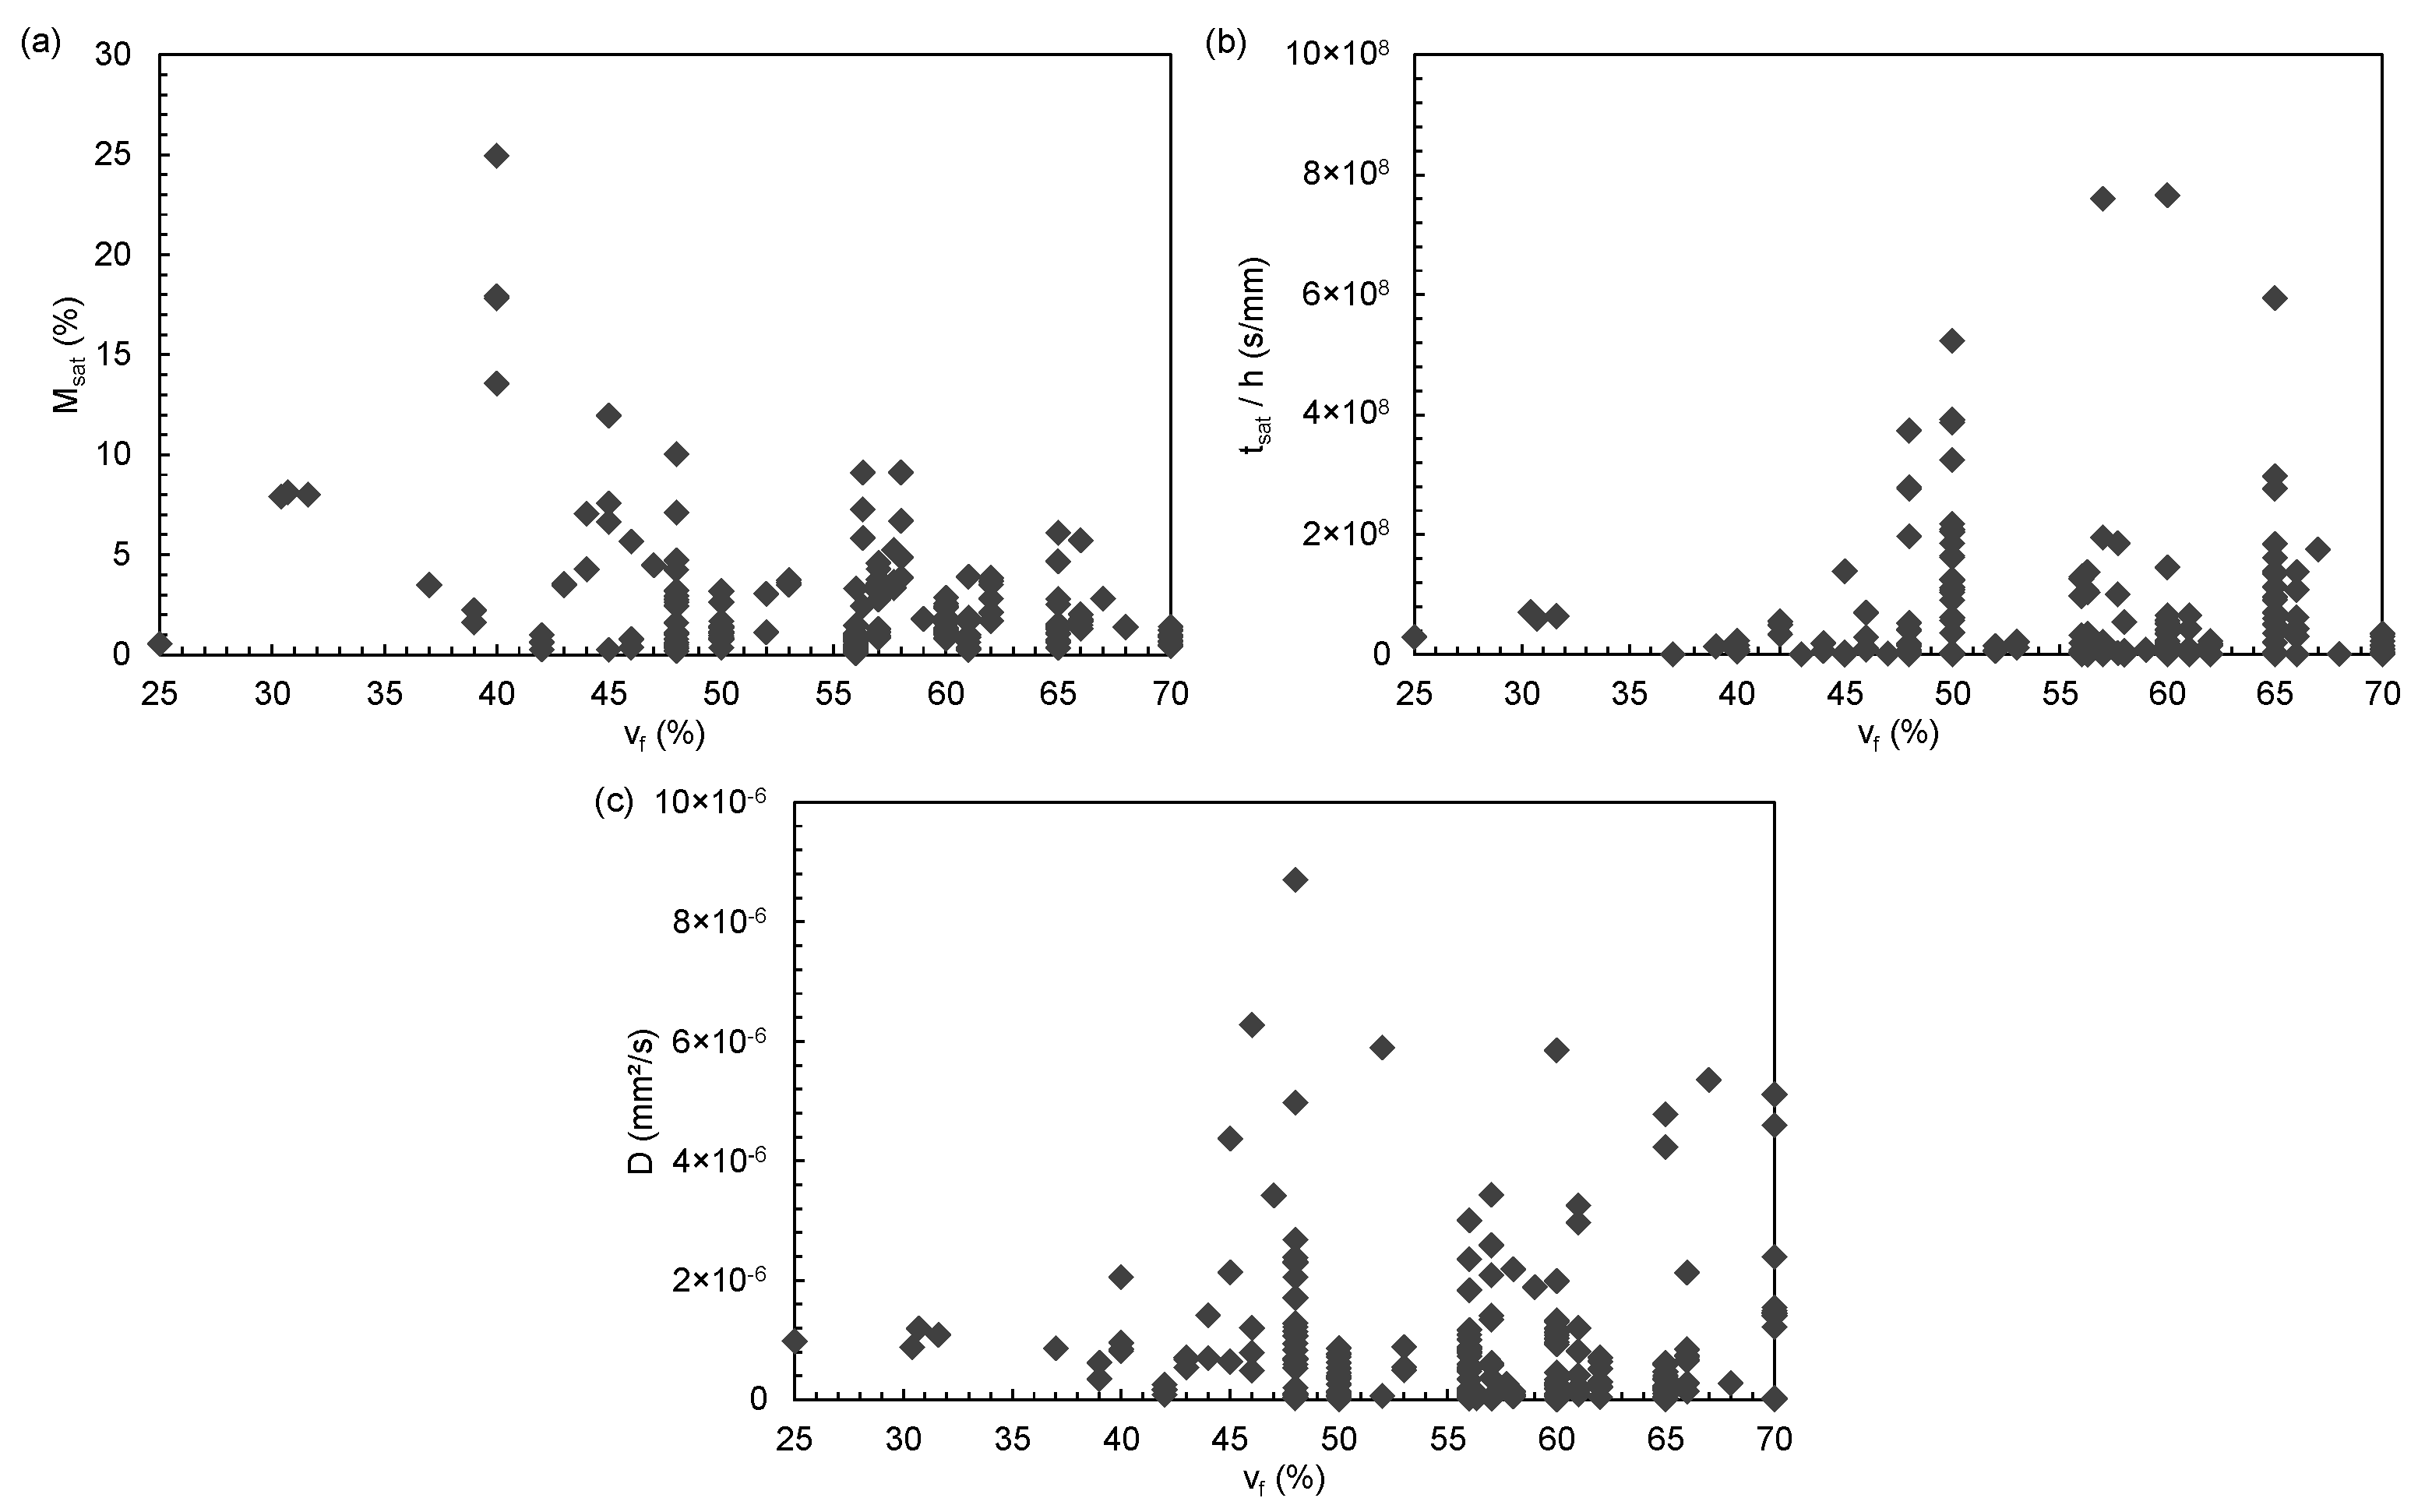
3.4. Fibres Presence
3.5. Manufacturing Process
3.6. Ageing Conditions
3.6.1. Conditioning Environment
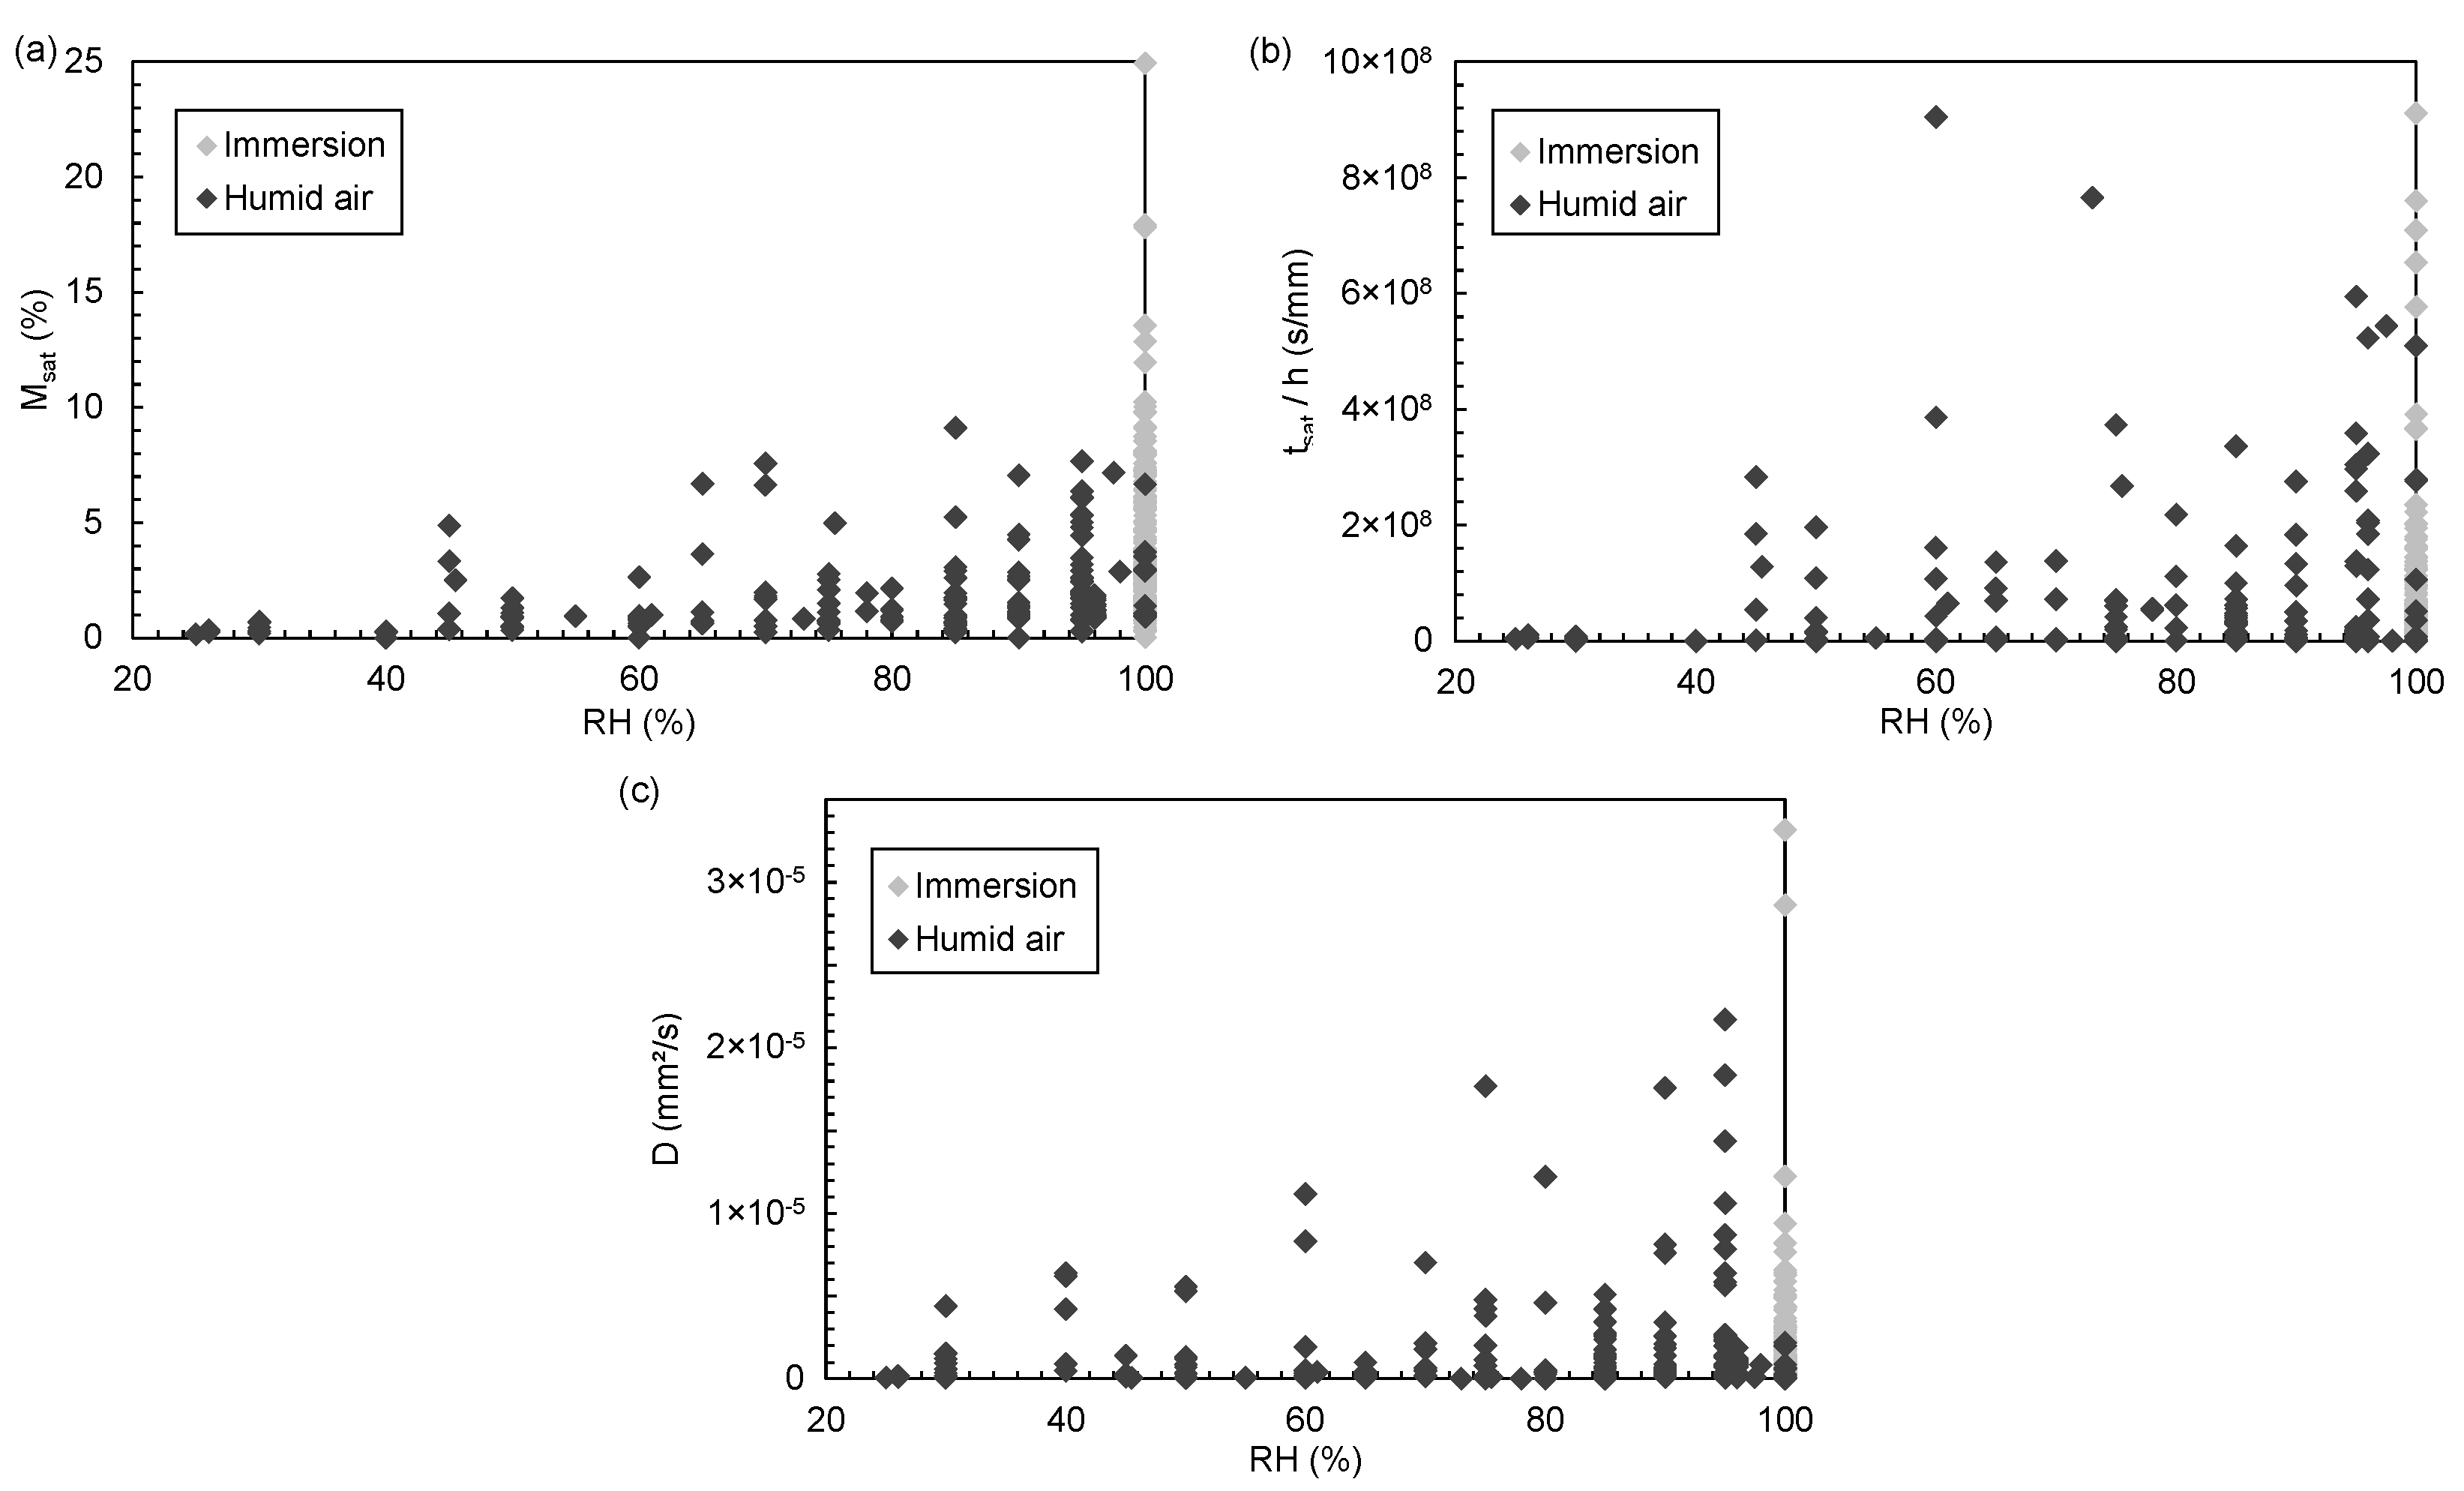
3.6.2. Relative Humidity
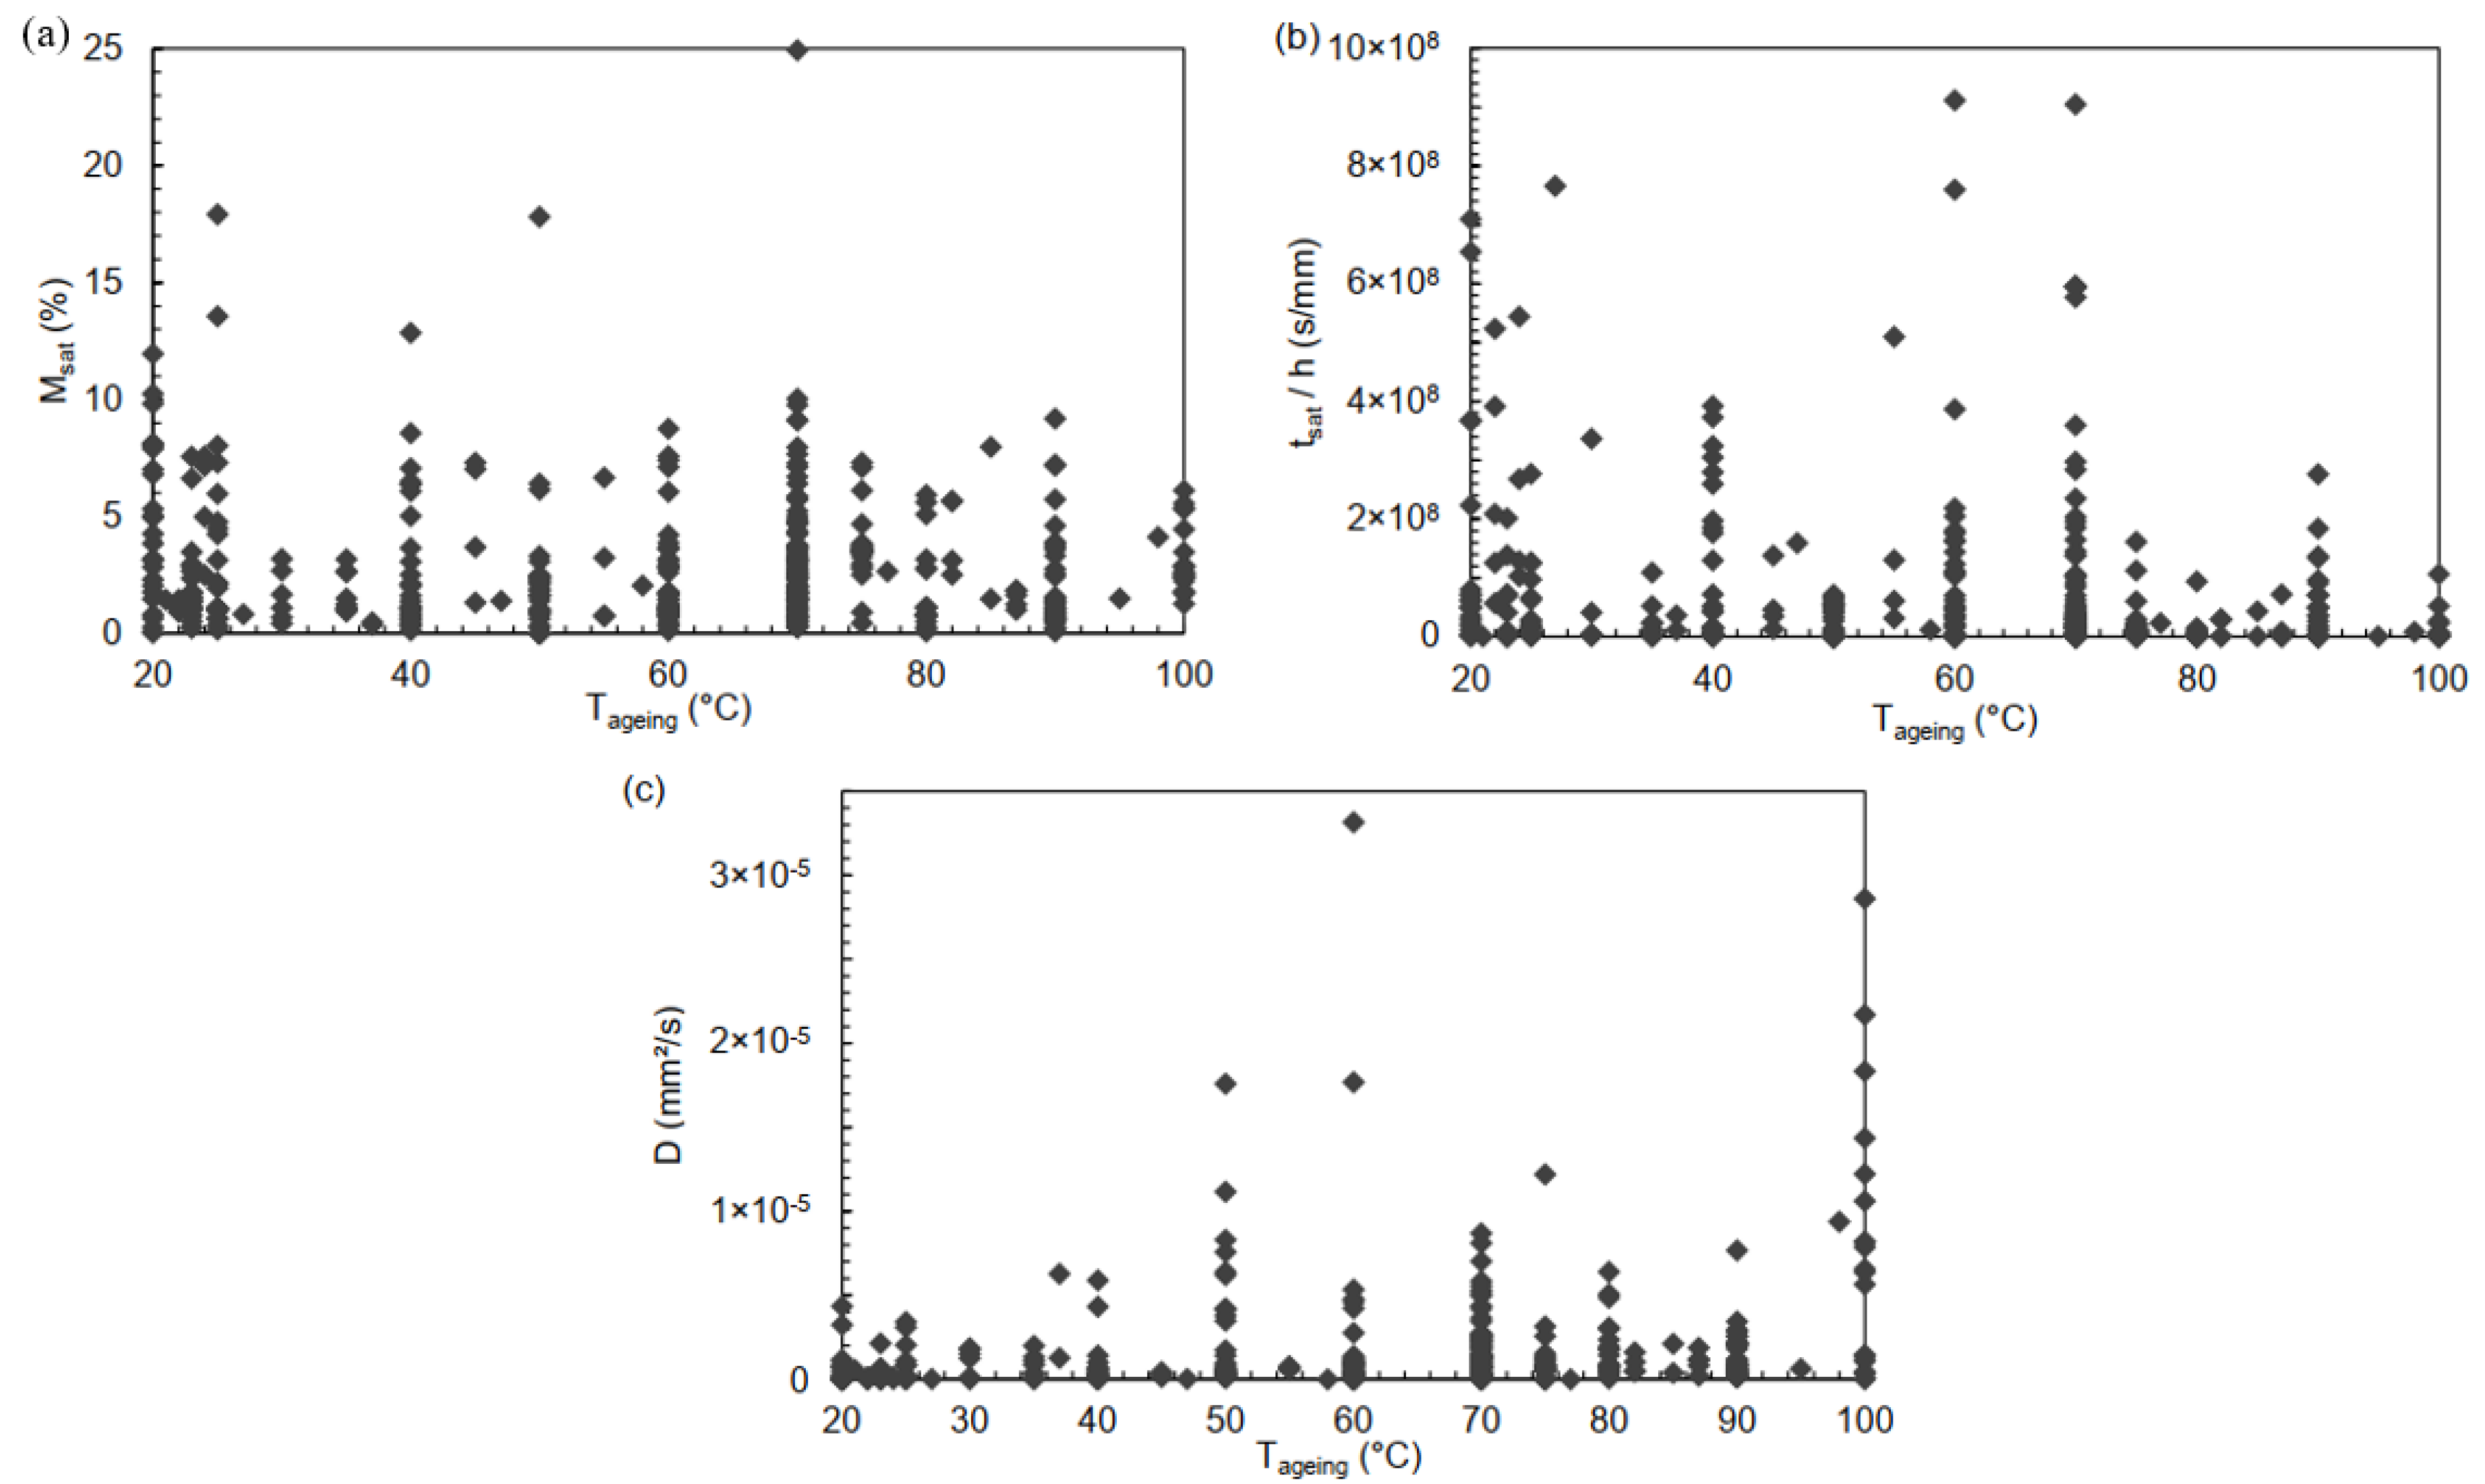
3.6.3. Temperature
4. Principal Component Analysis
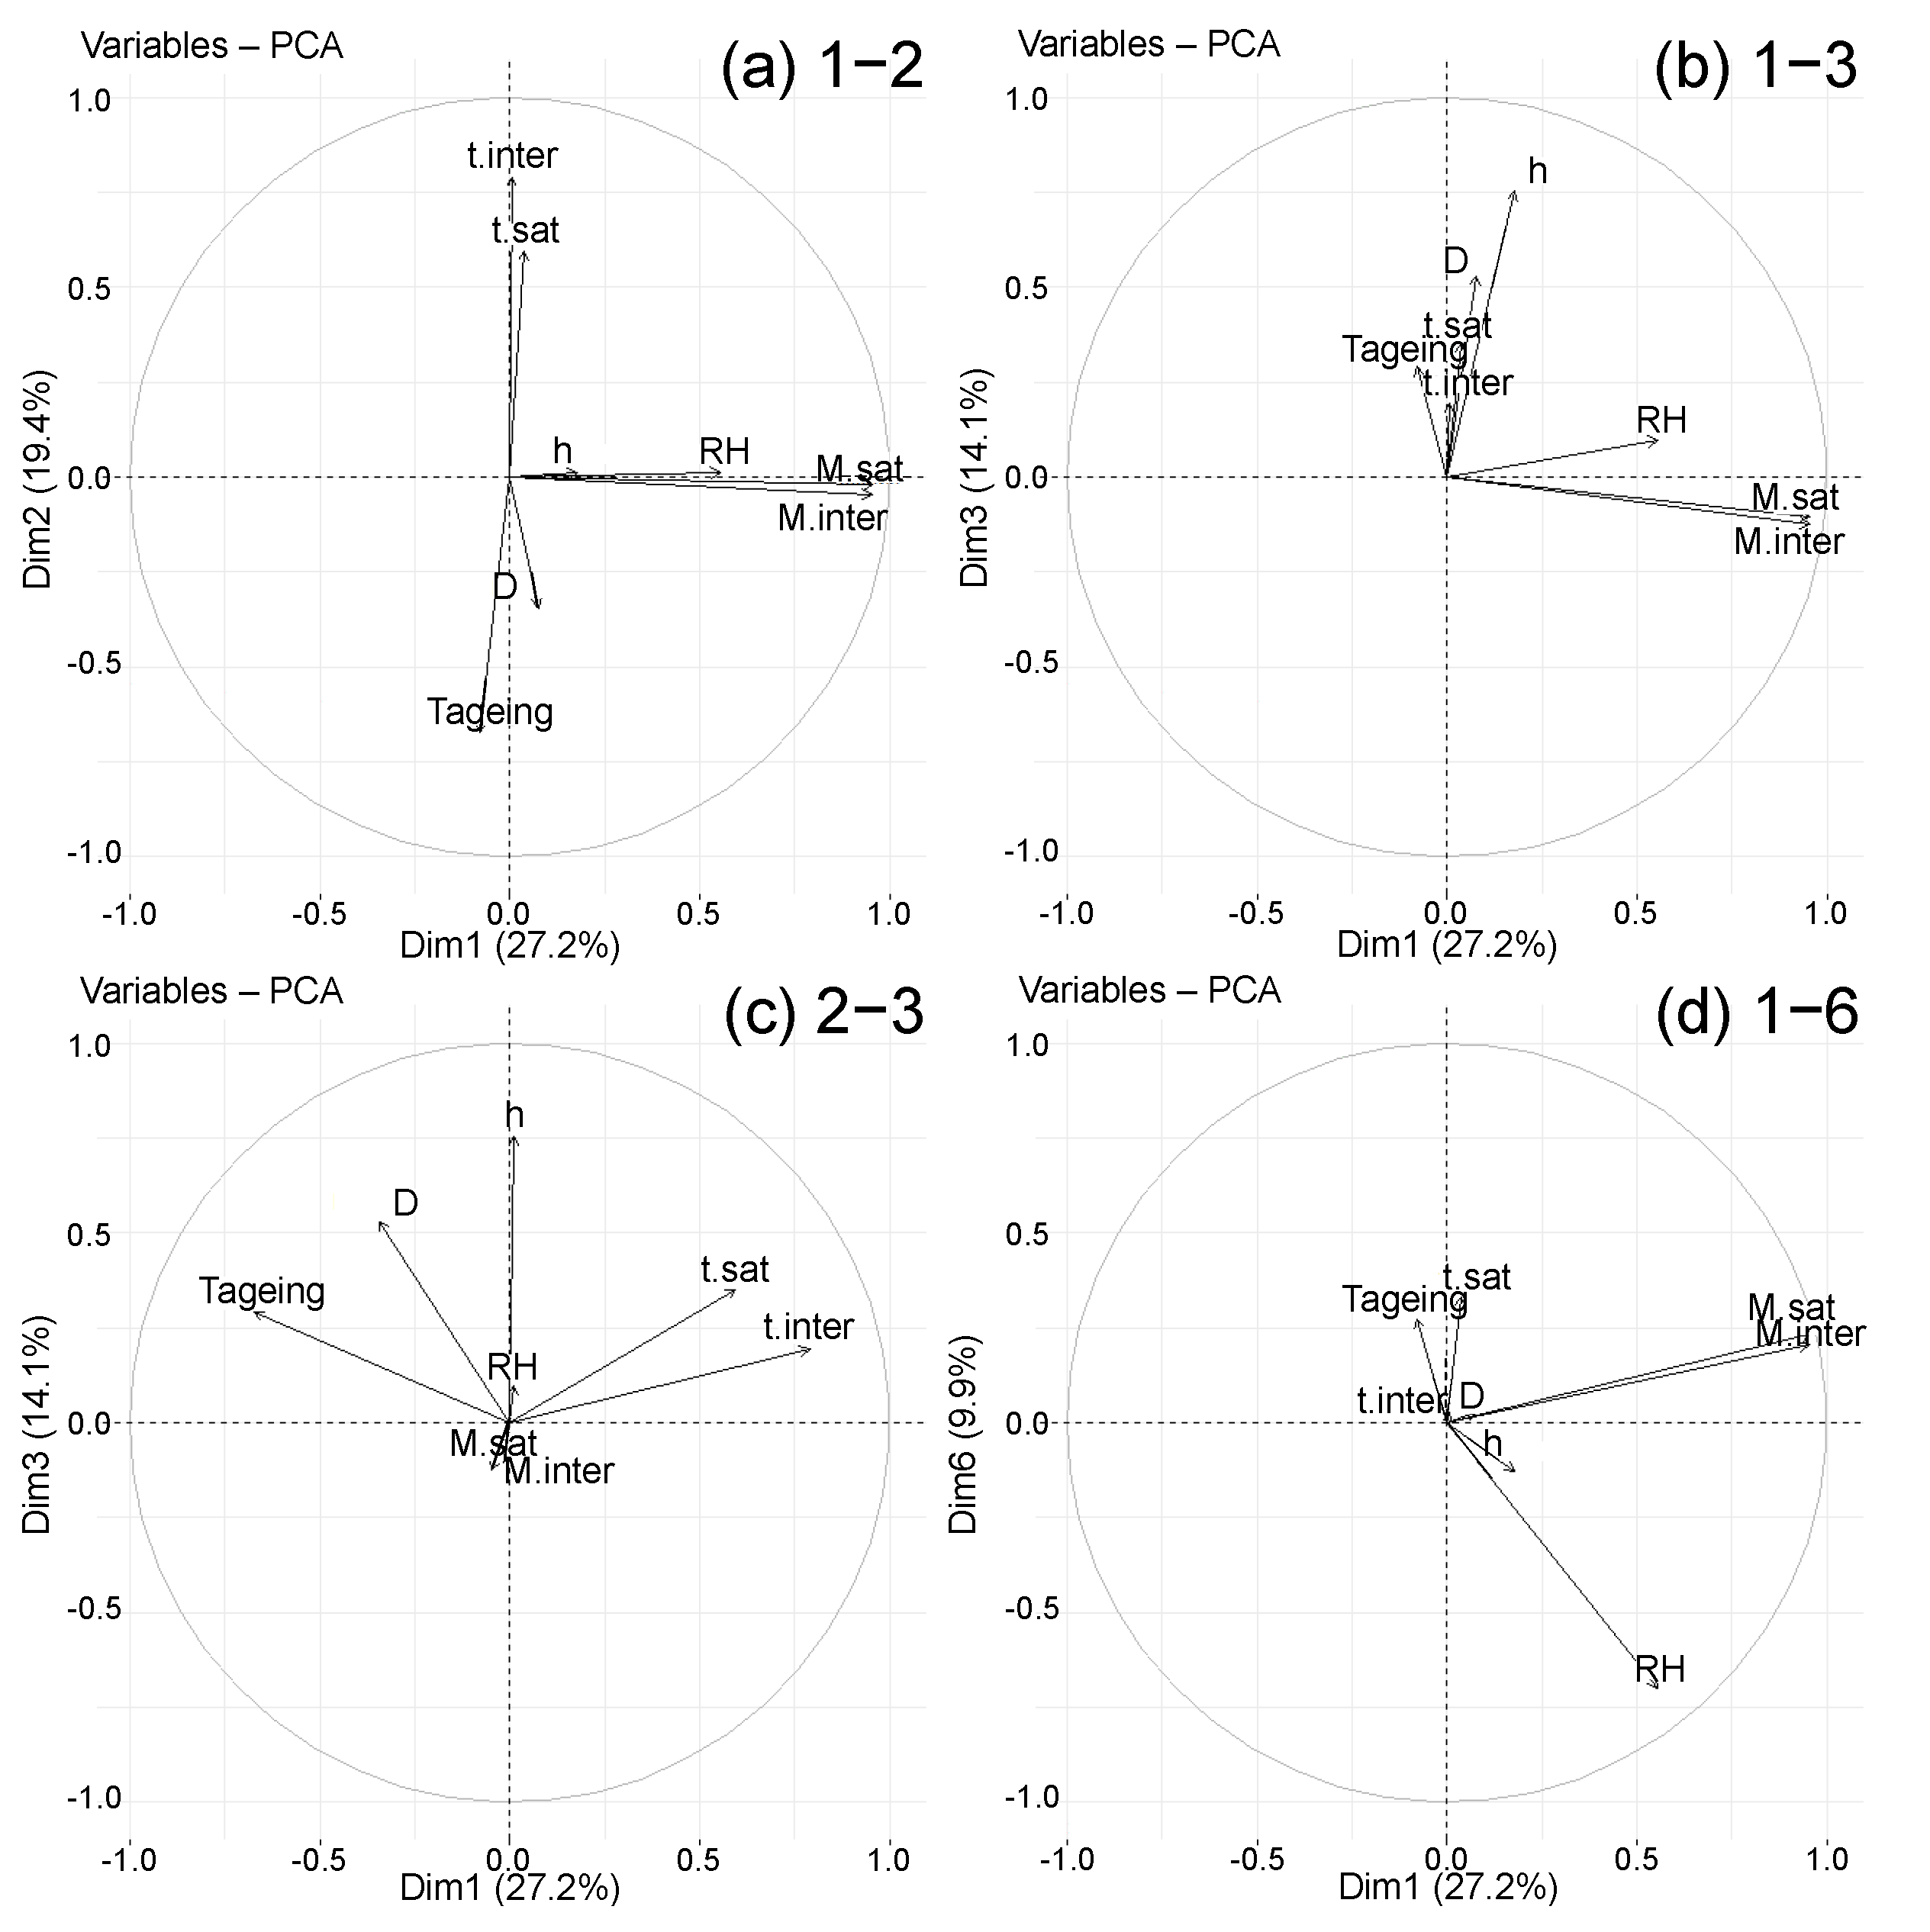
4.1. Principal Component Analysis Introduction
- An acute angle (<90°) between the vectors of individual variables indicates a positive correlation between them;
- A 180° angle between the vectors of individual variables indicates a negative correlation between them;
- Variables whose vectors are orthogonal are not correlated with each other, and are therefore independent.
4.2. Data Standardisation
4.3. Results
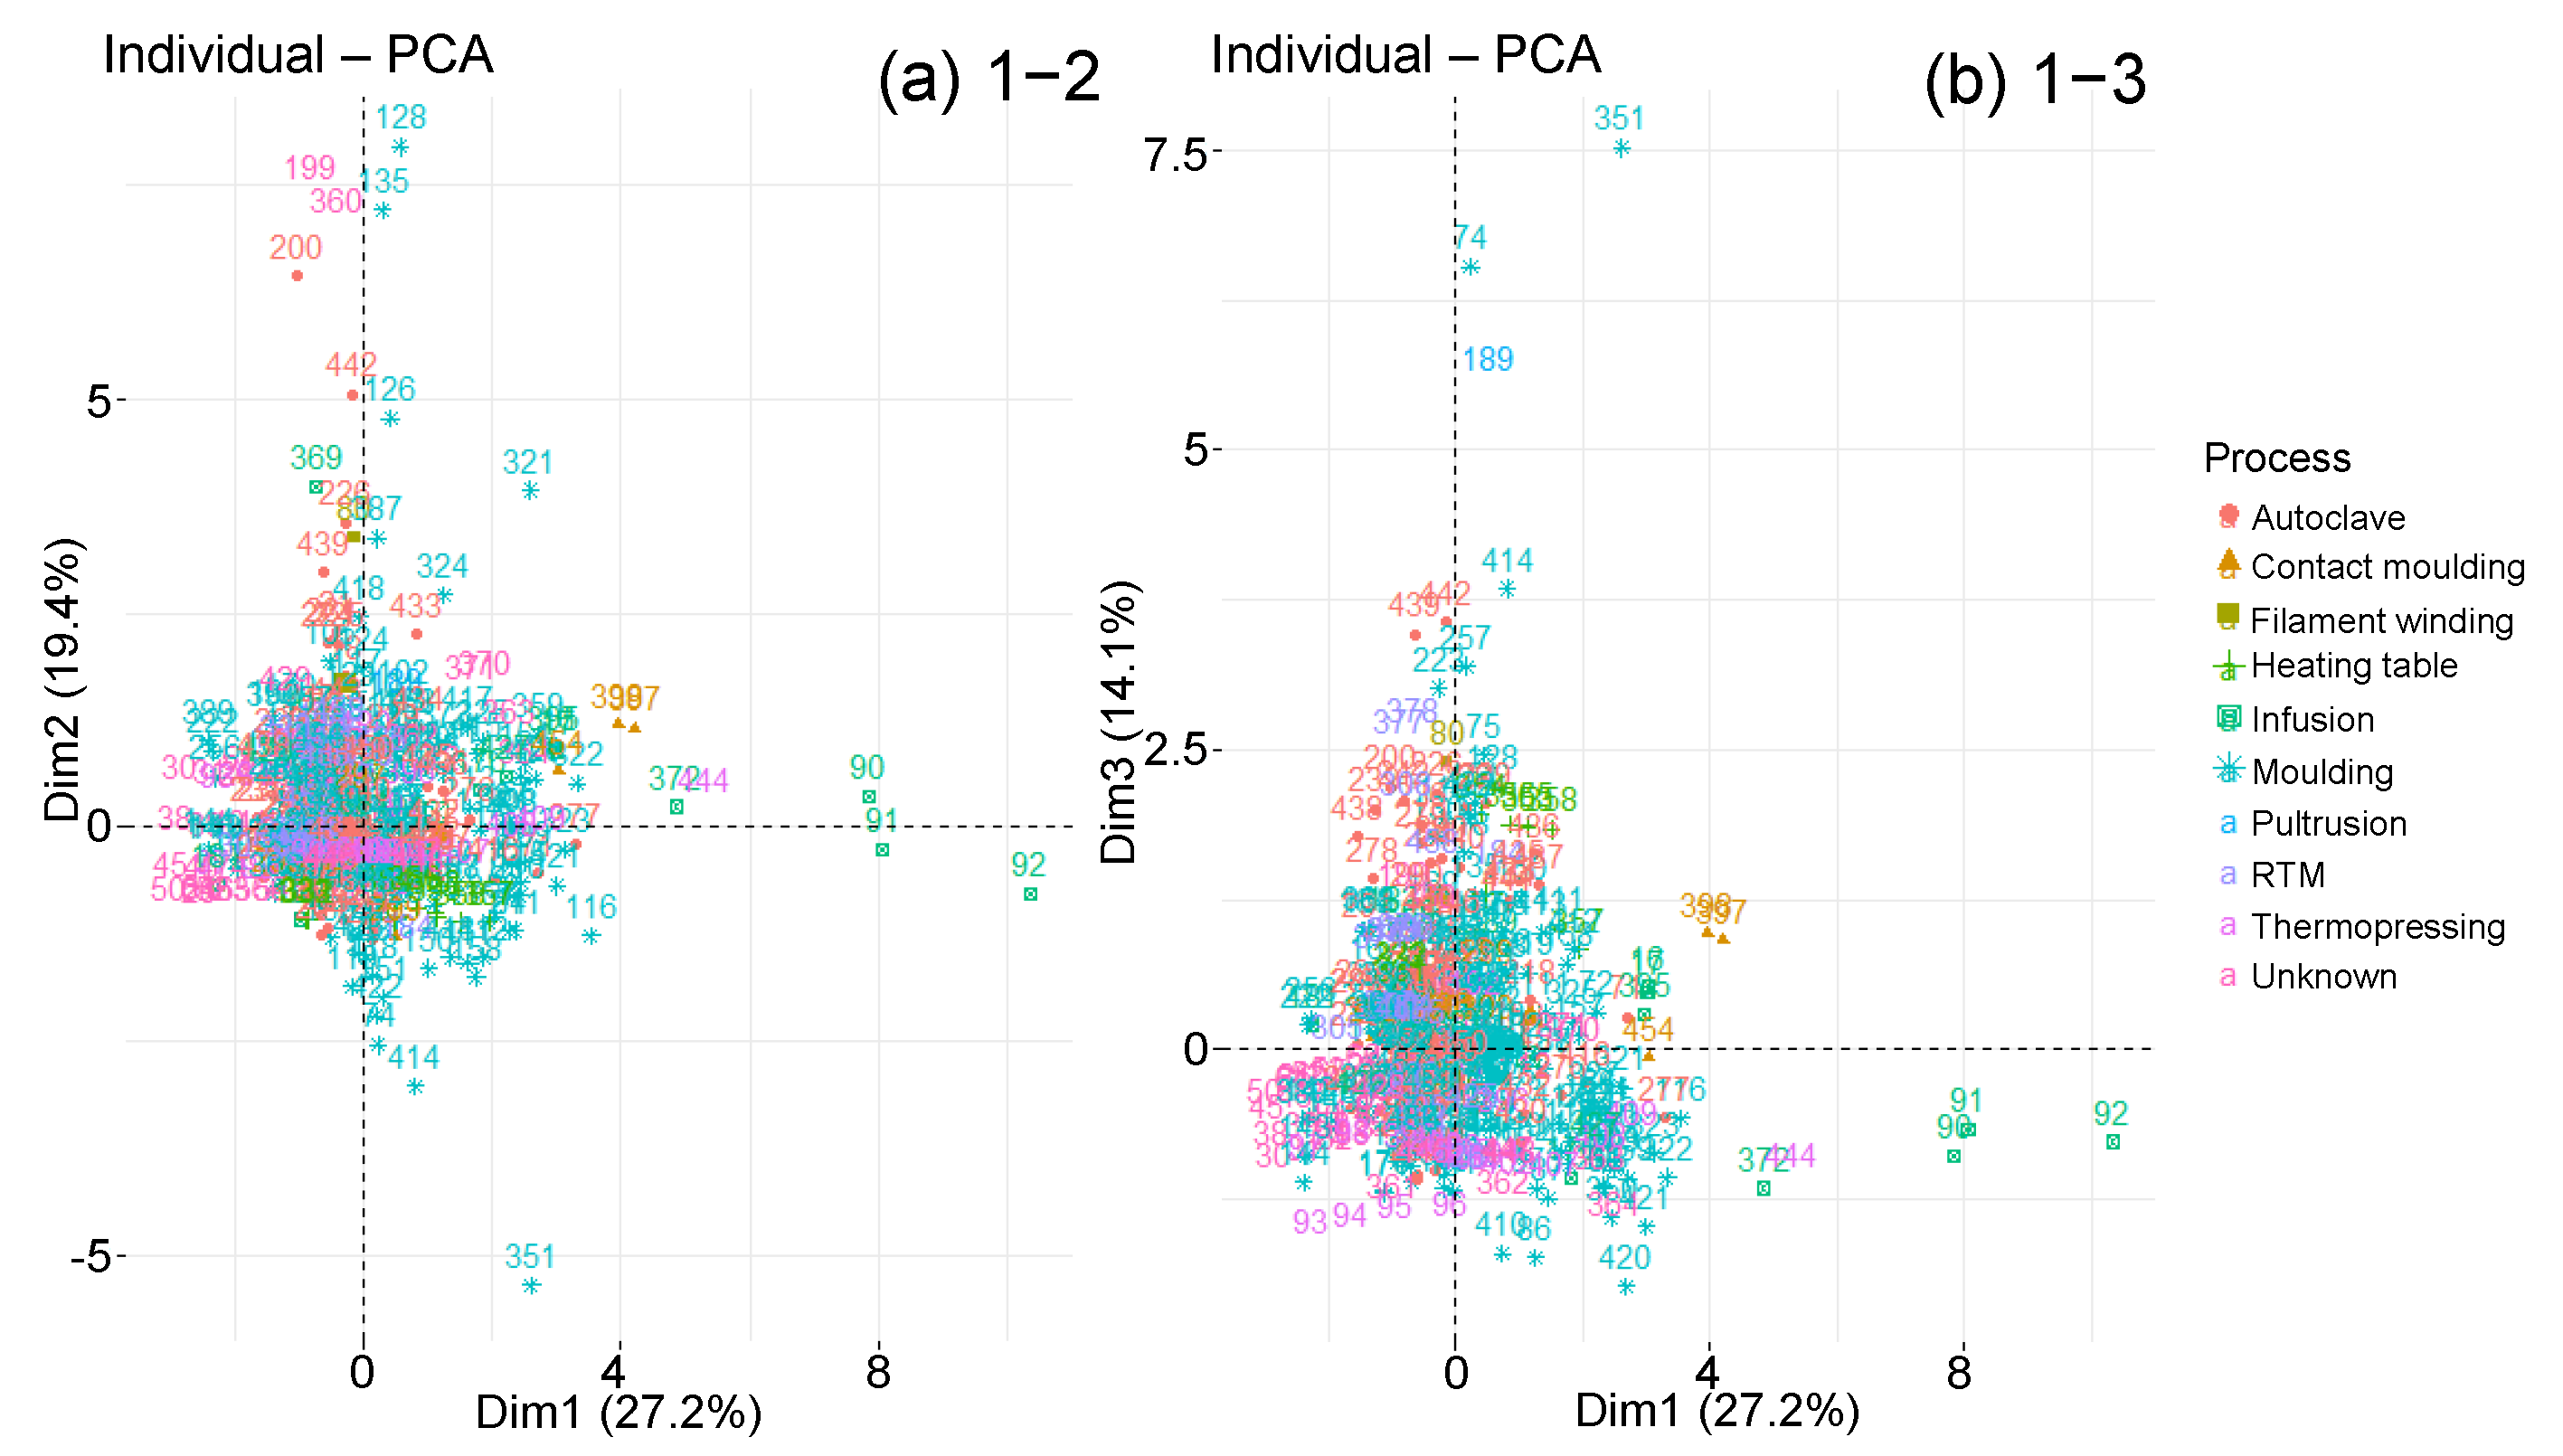
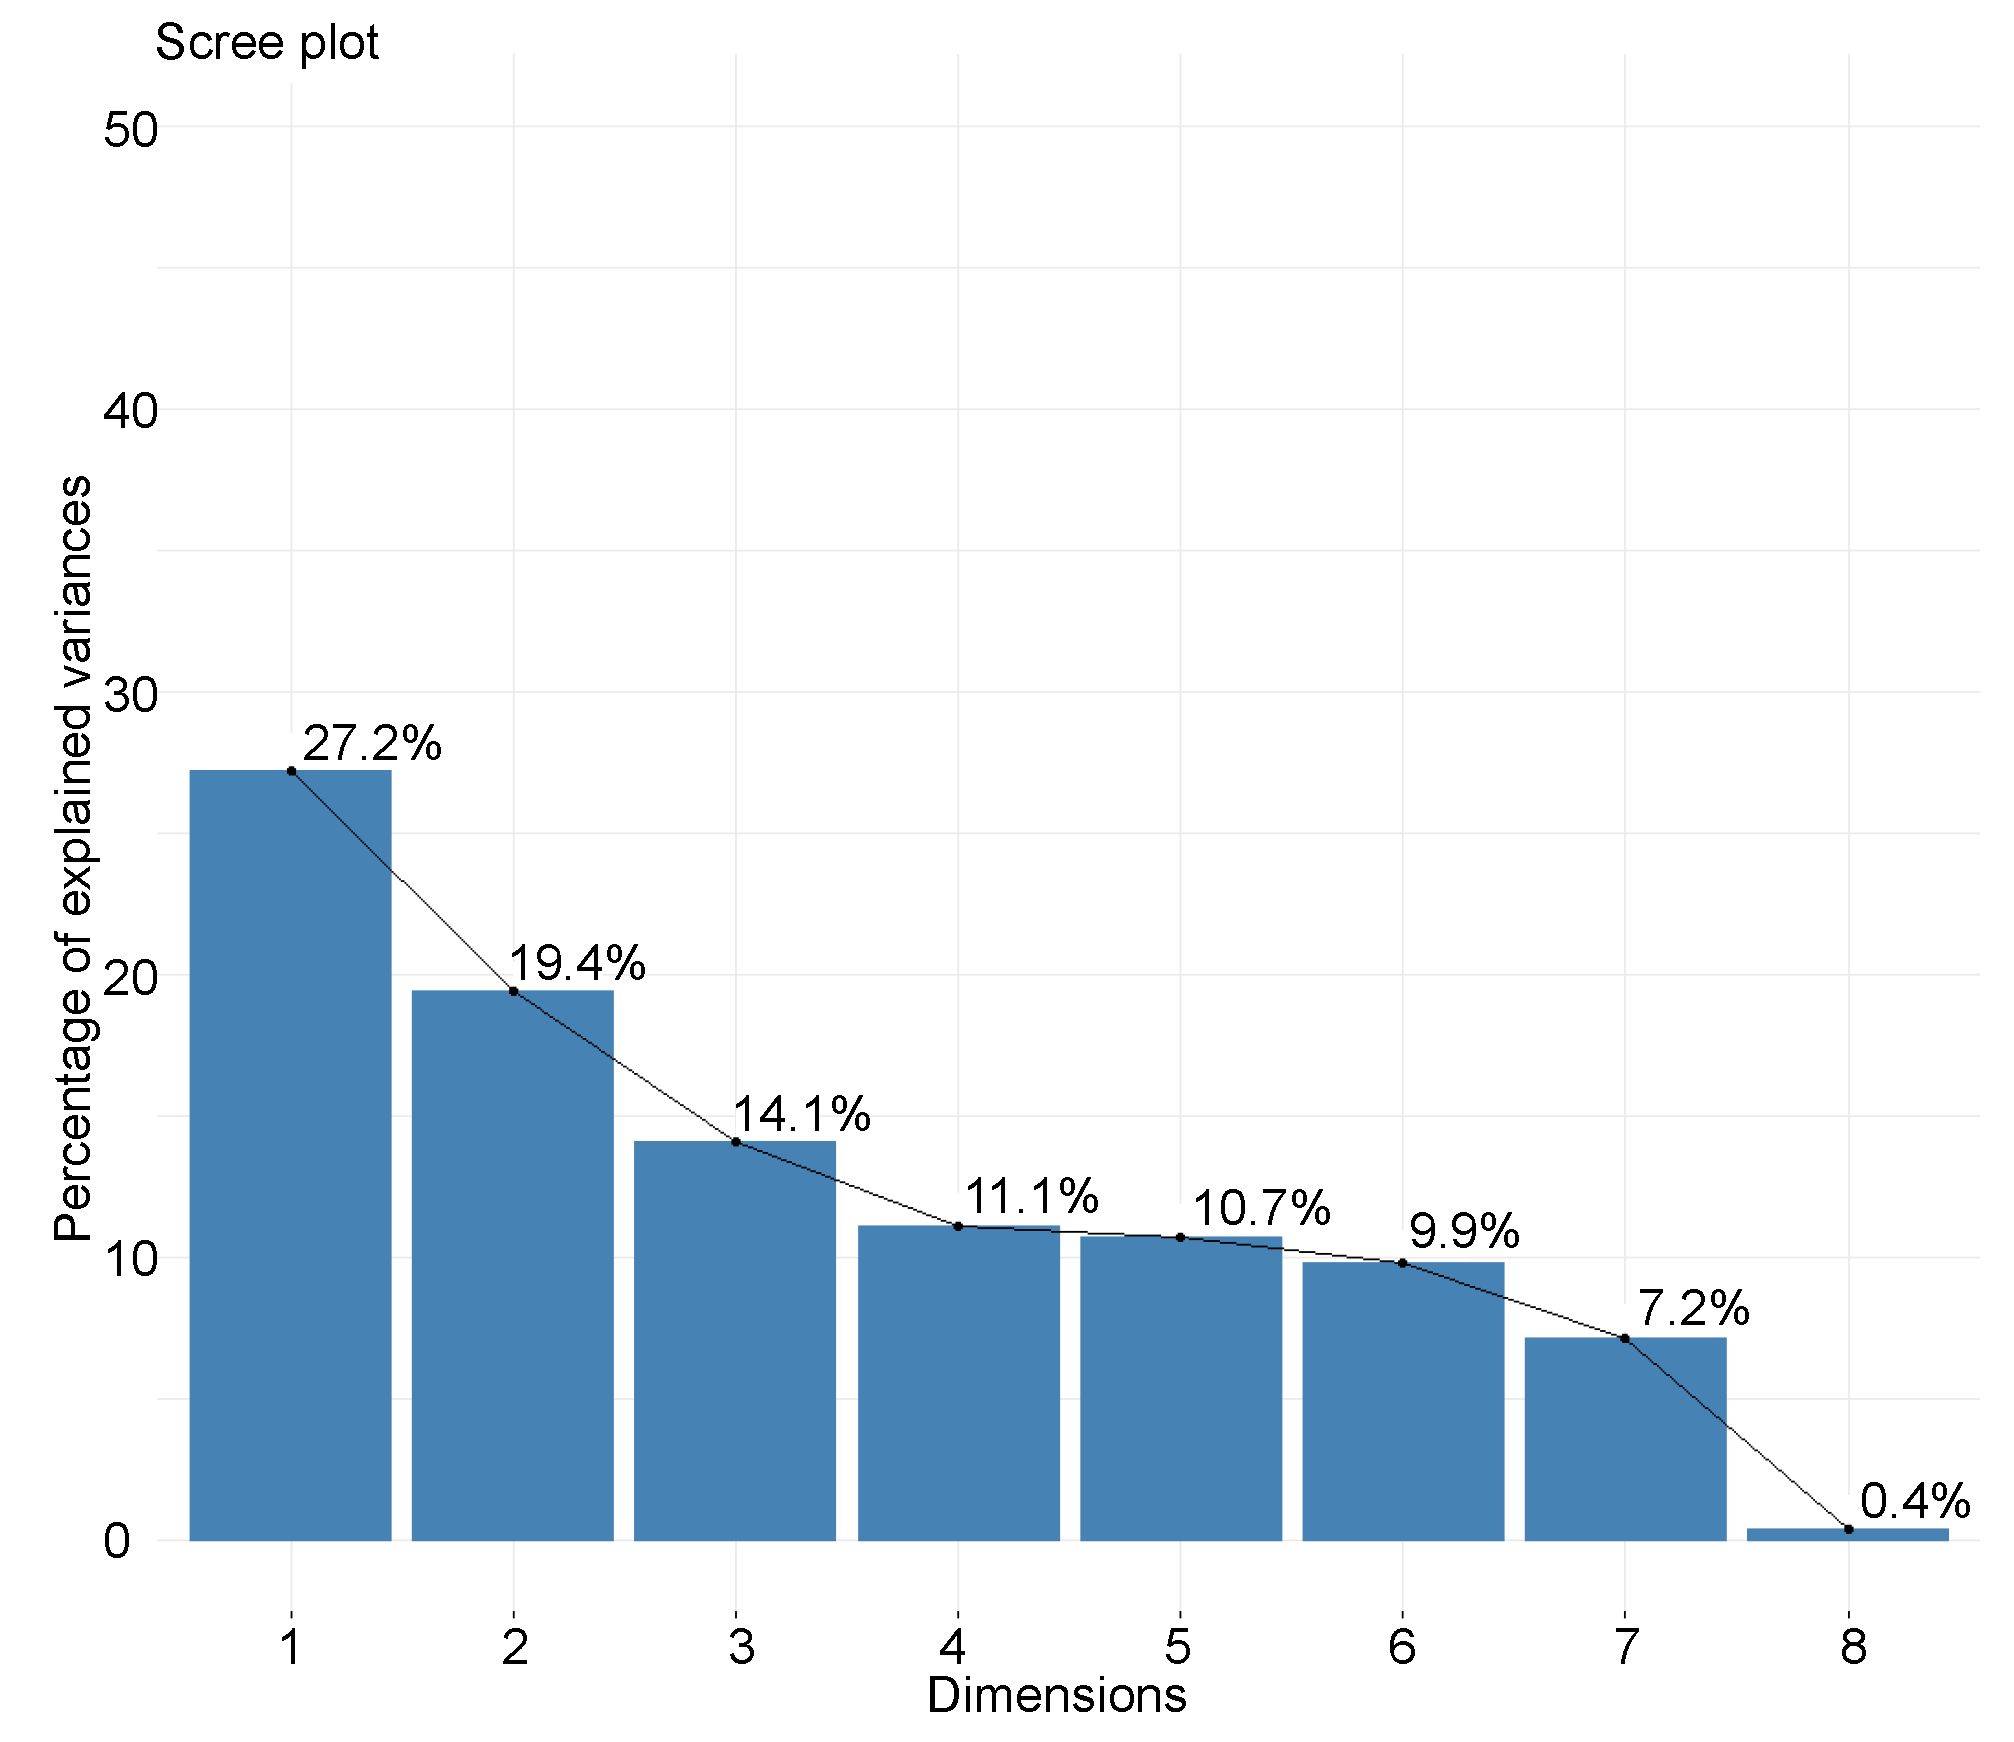
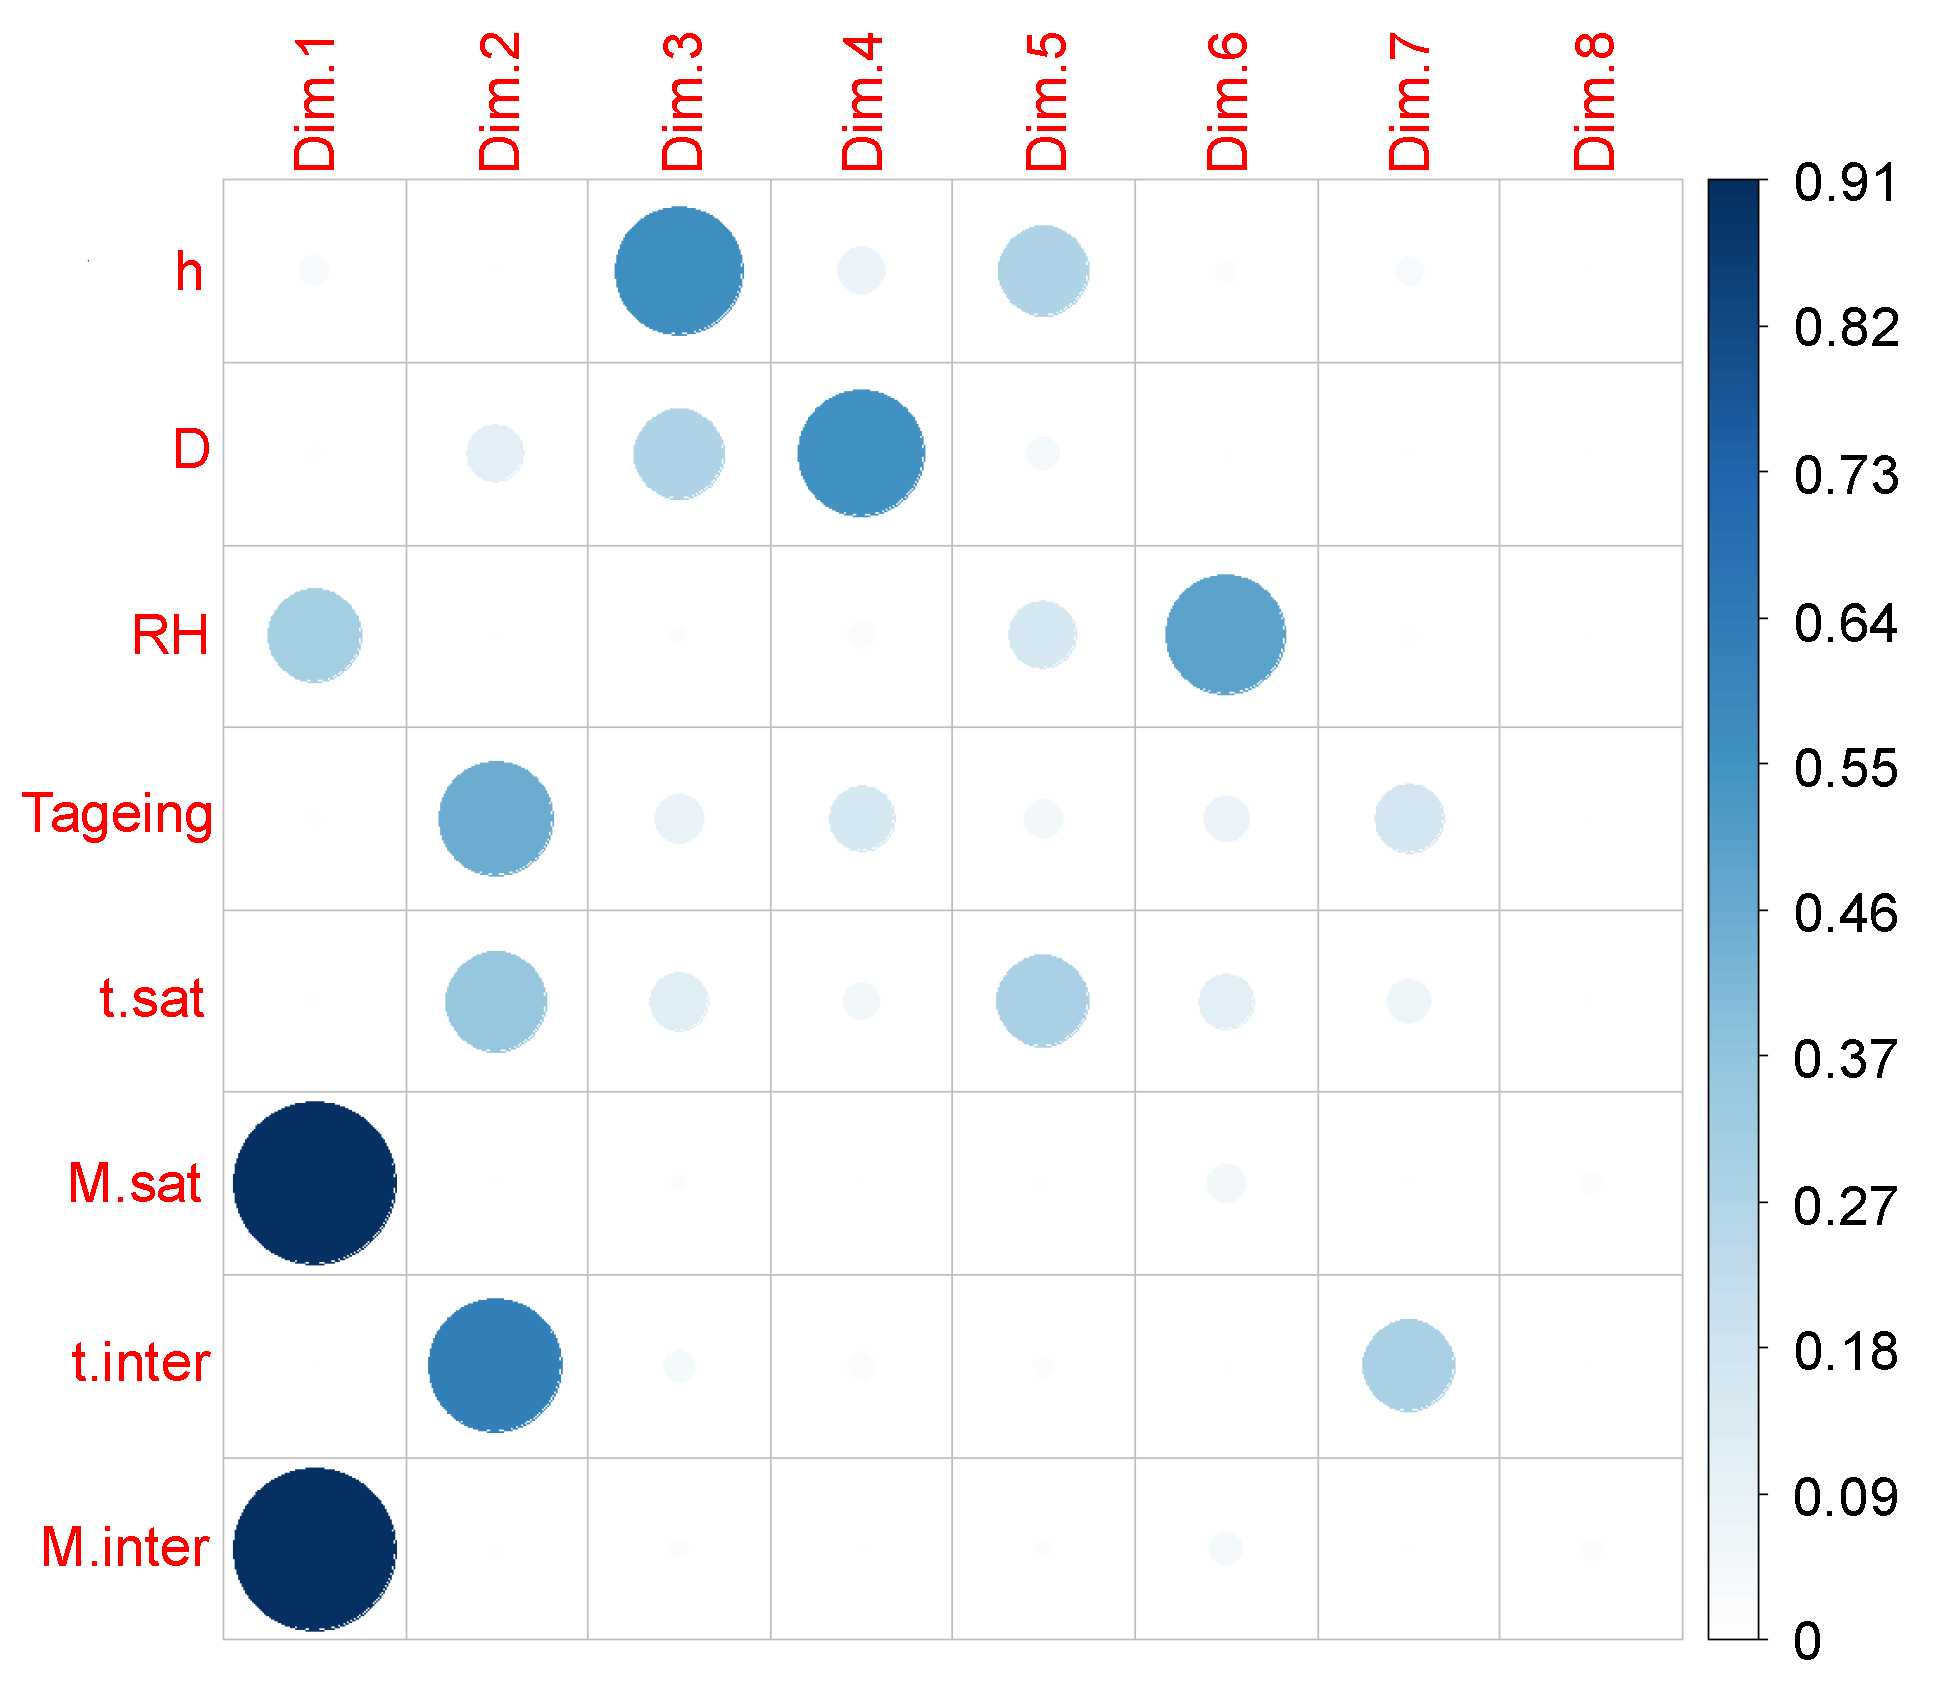
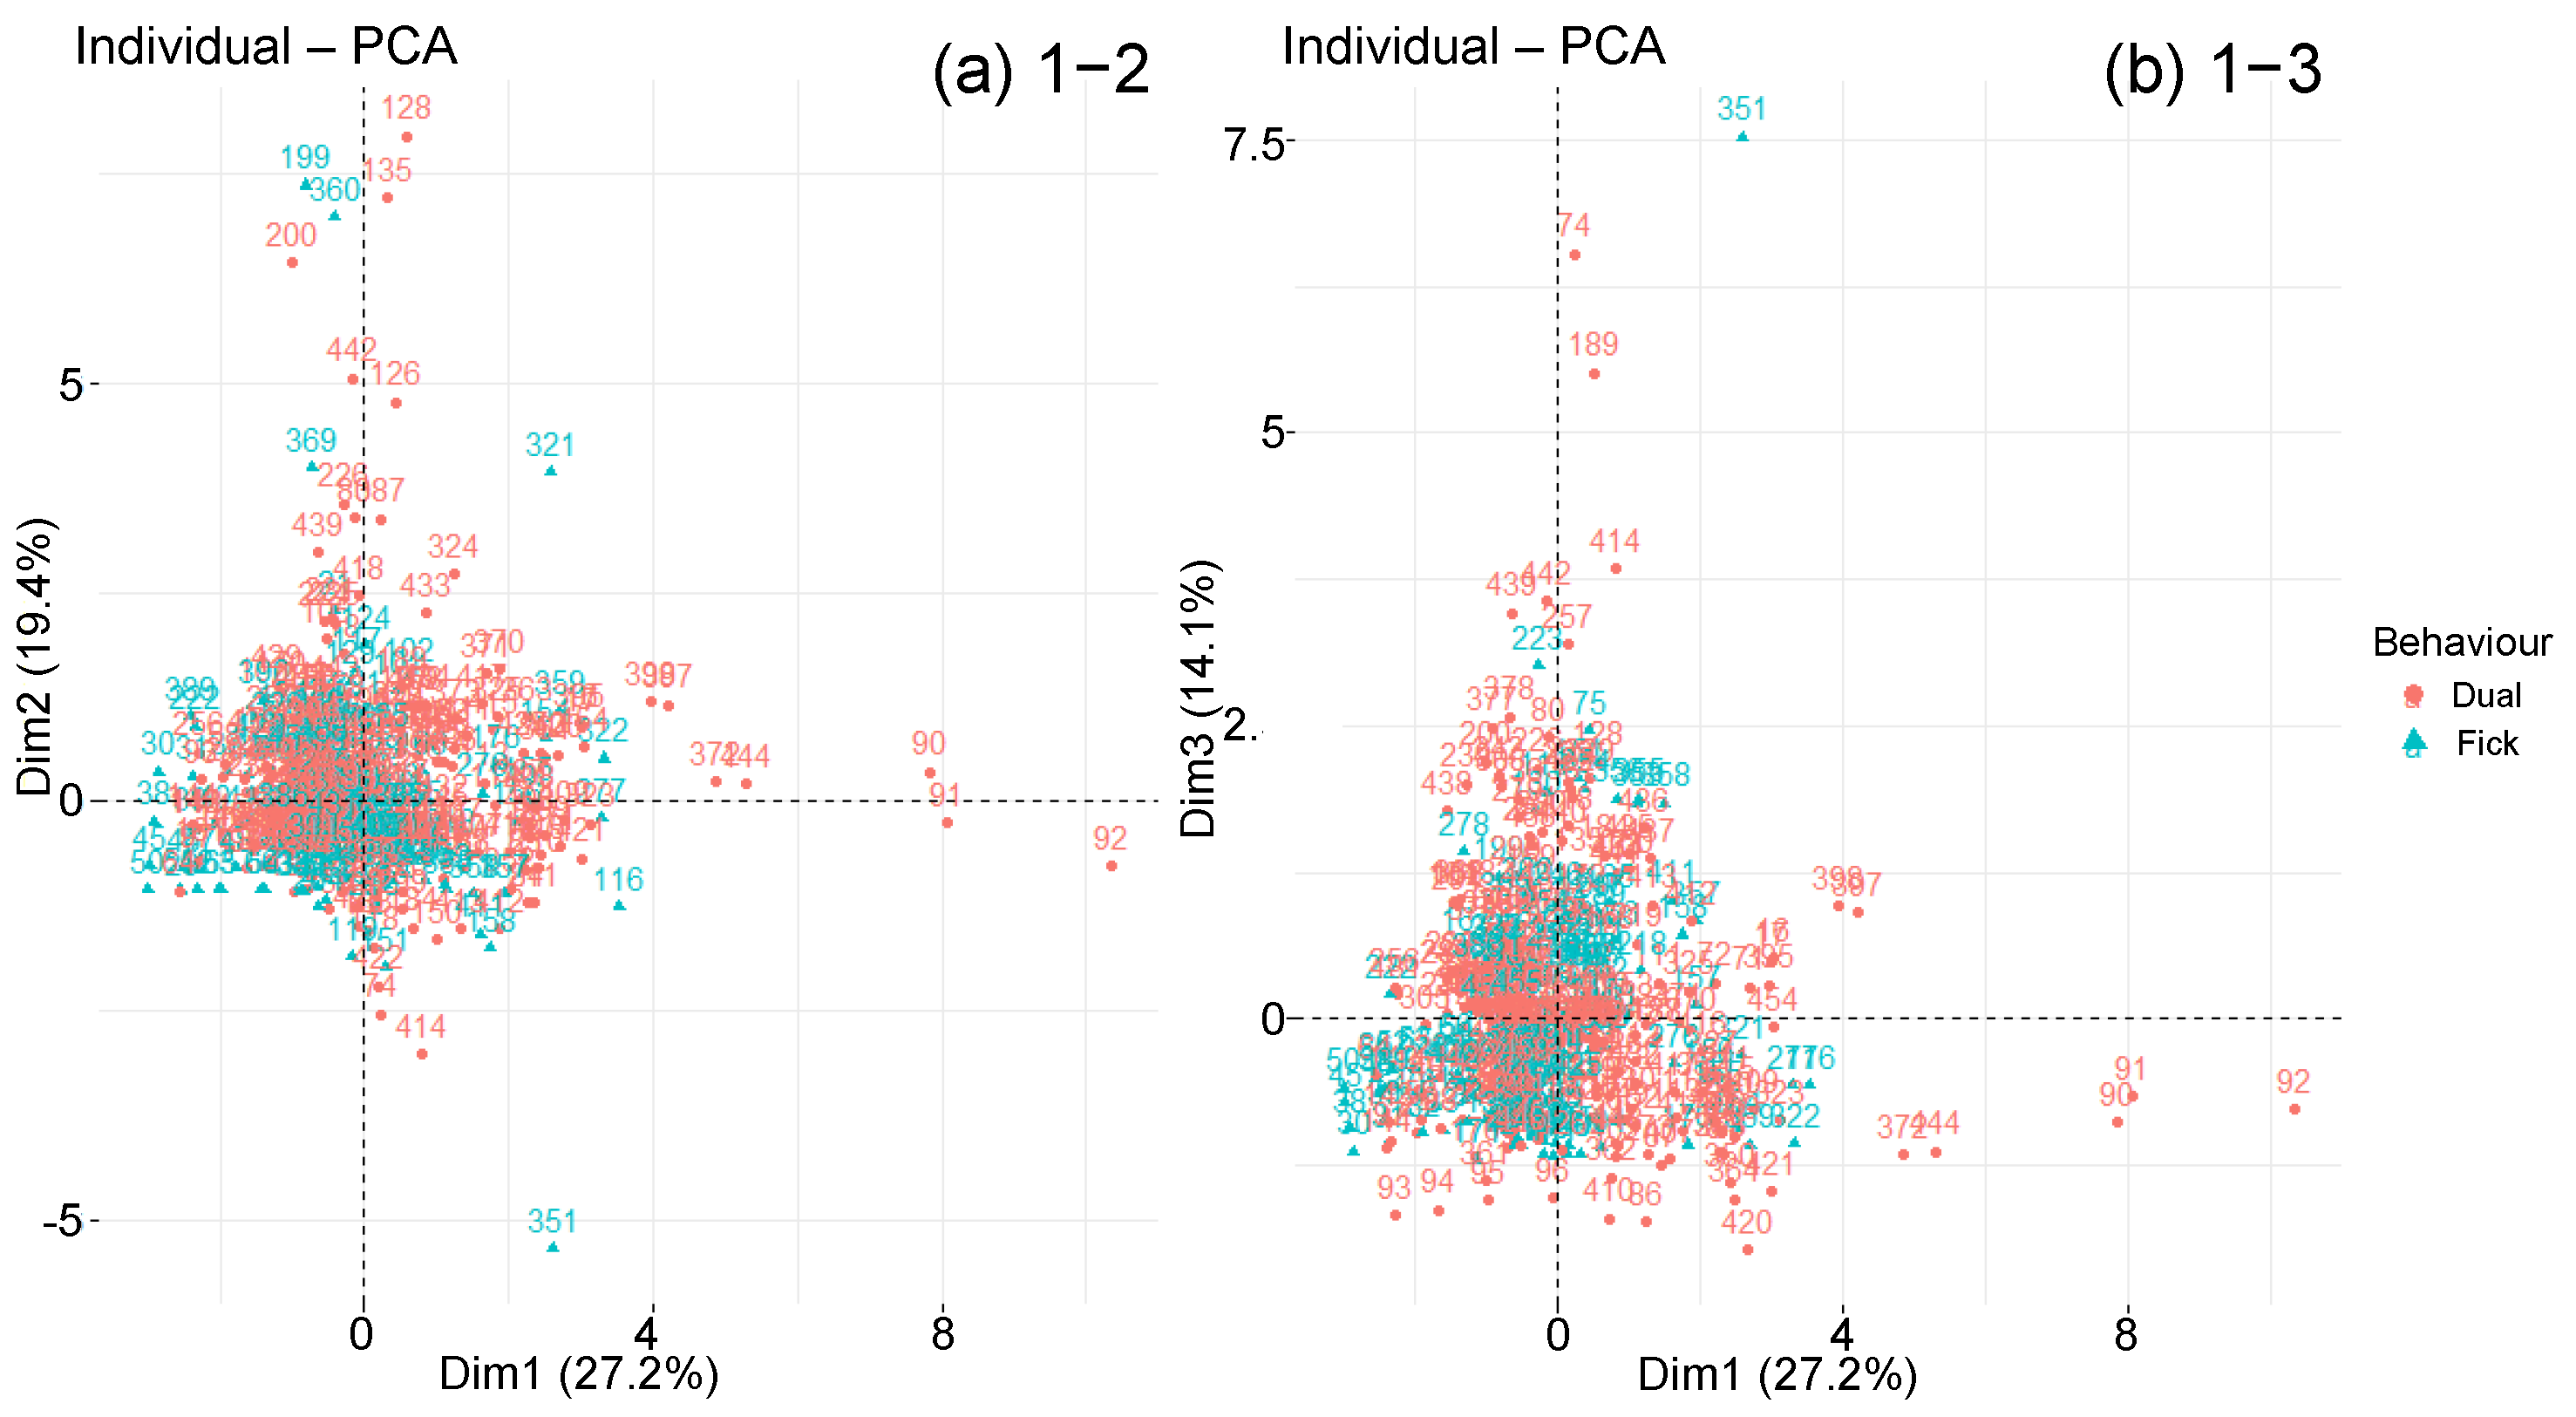
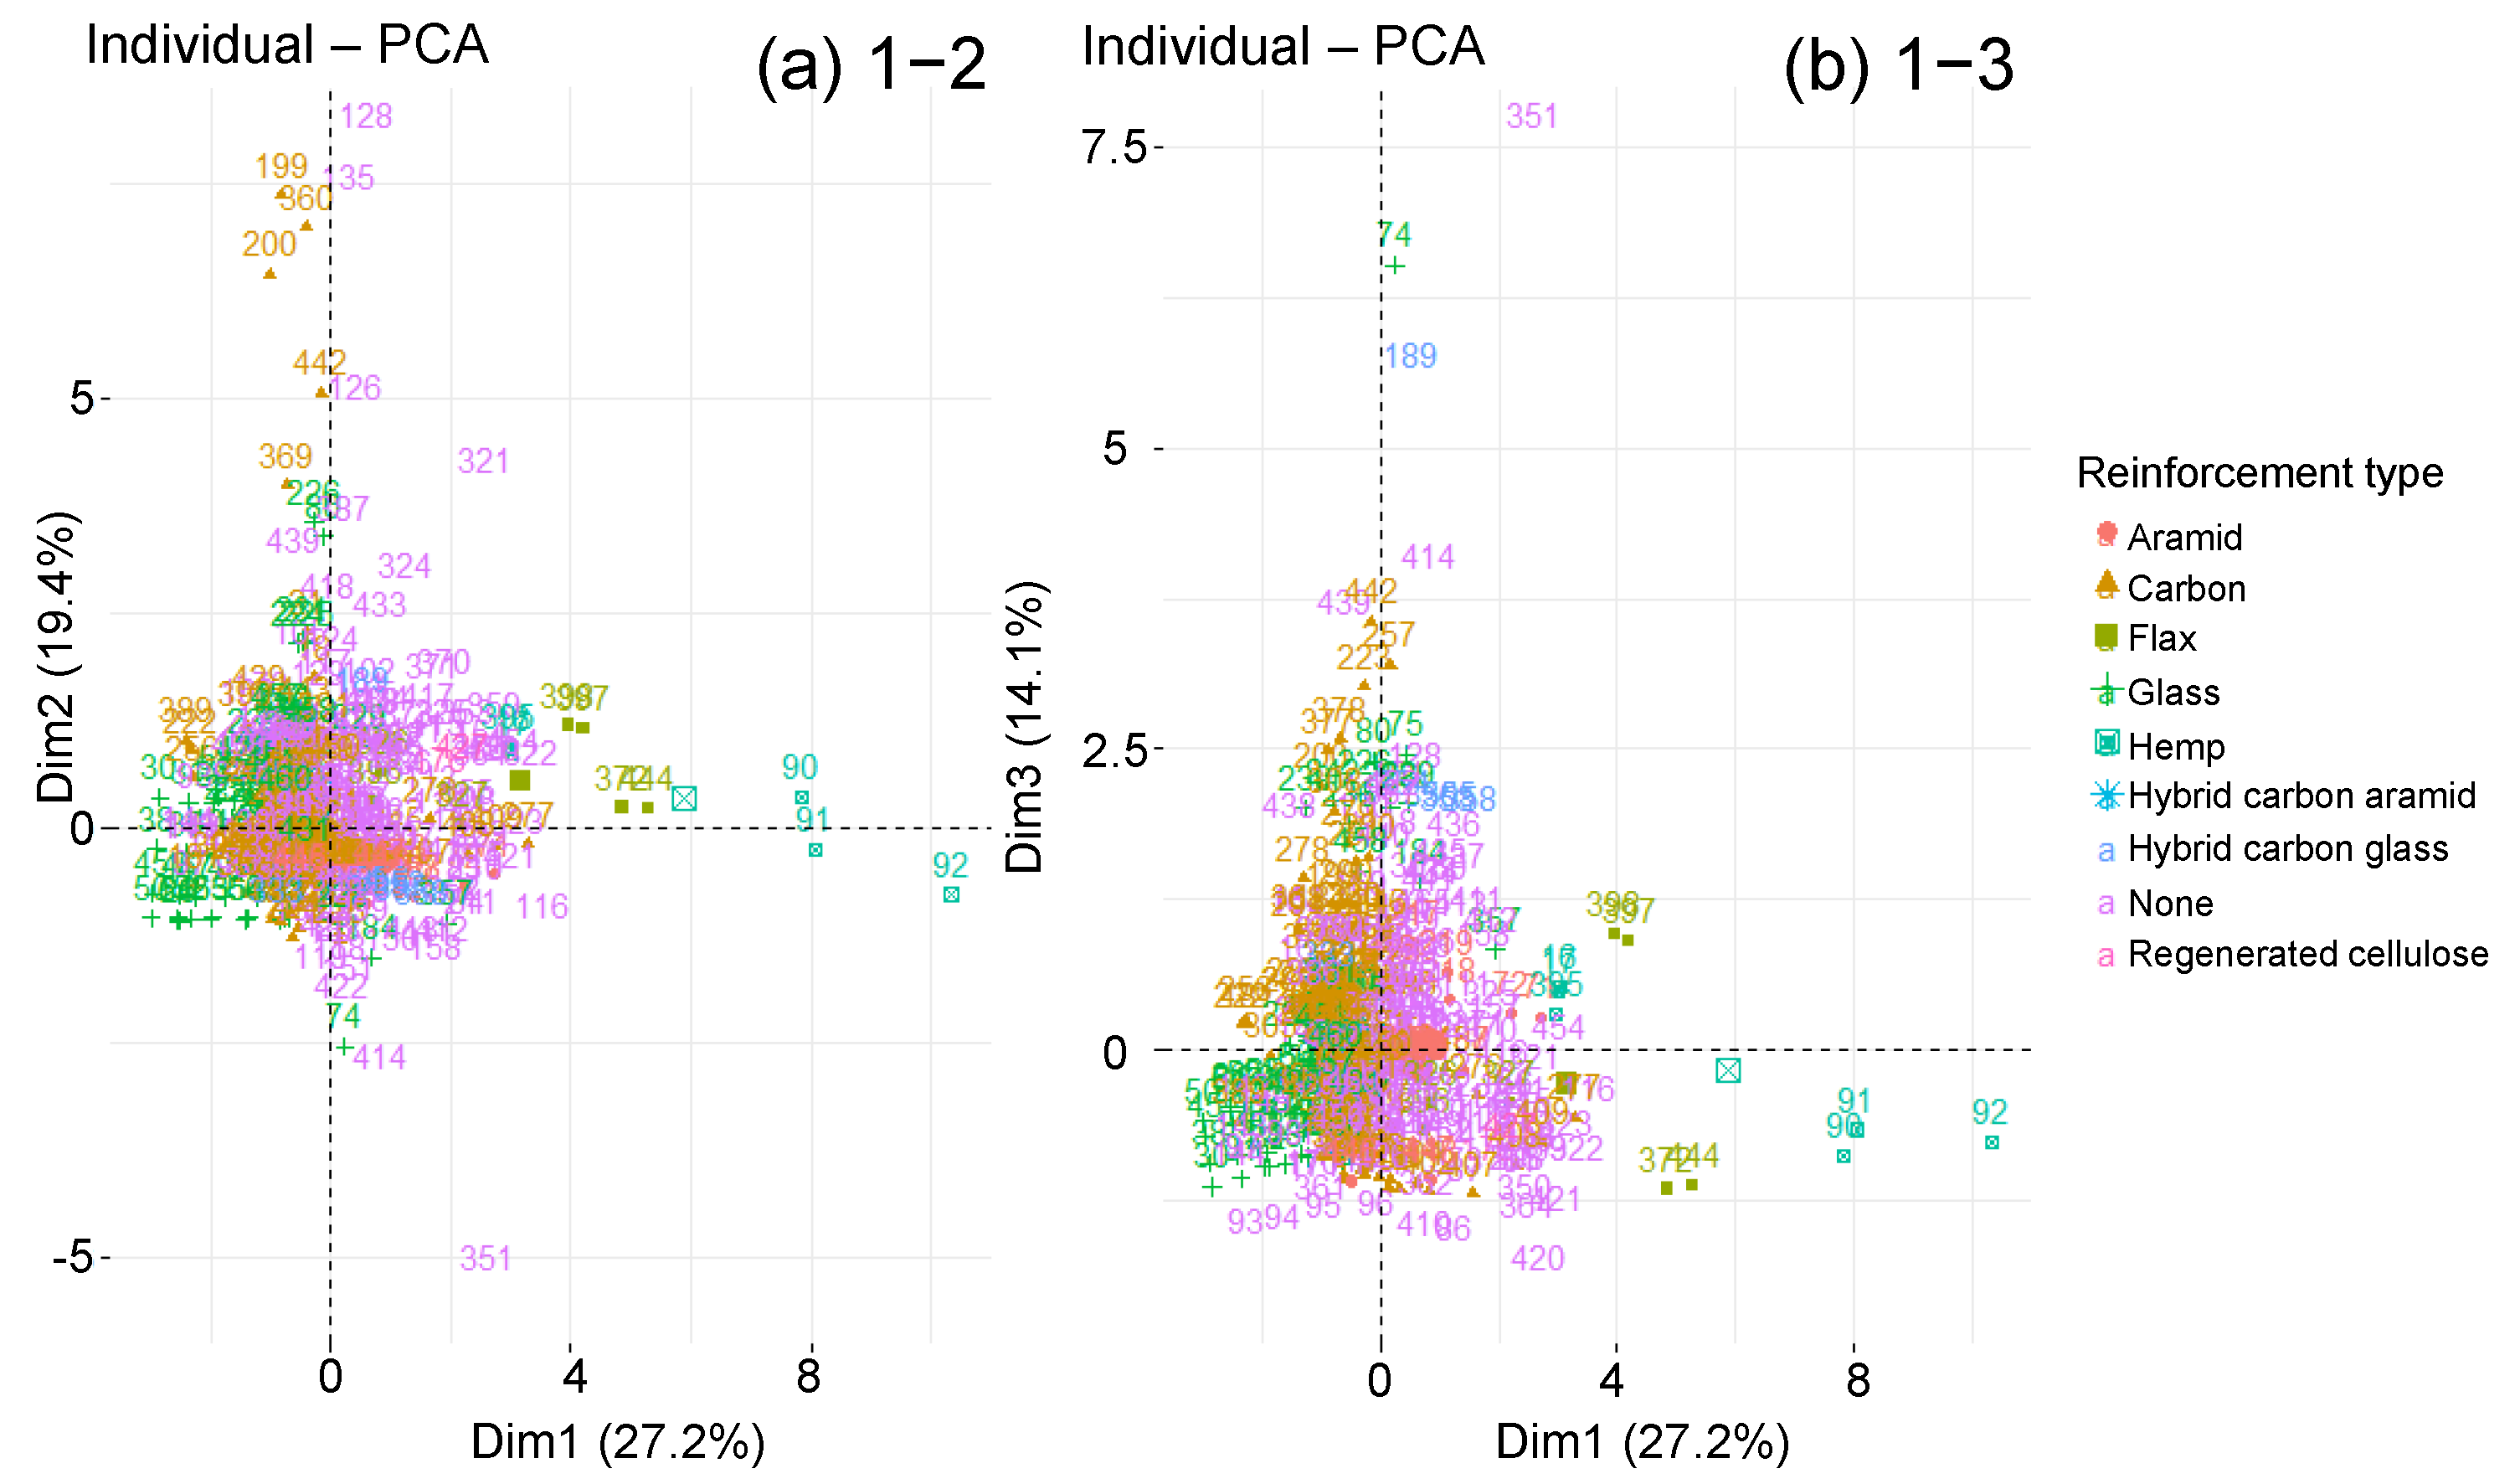
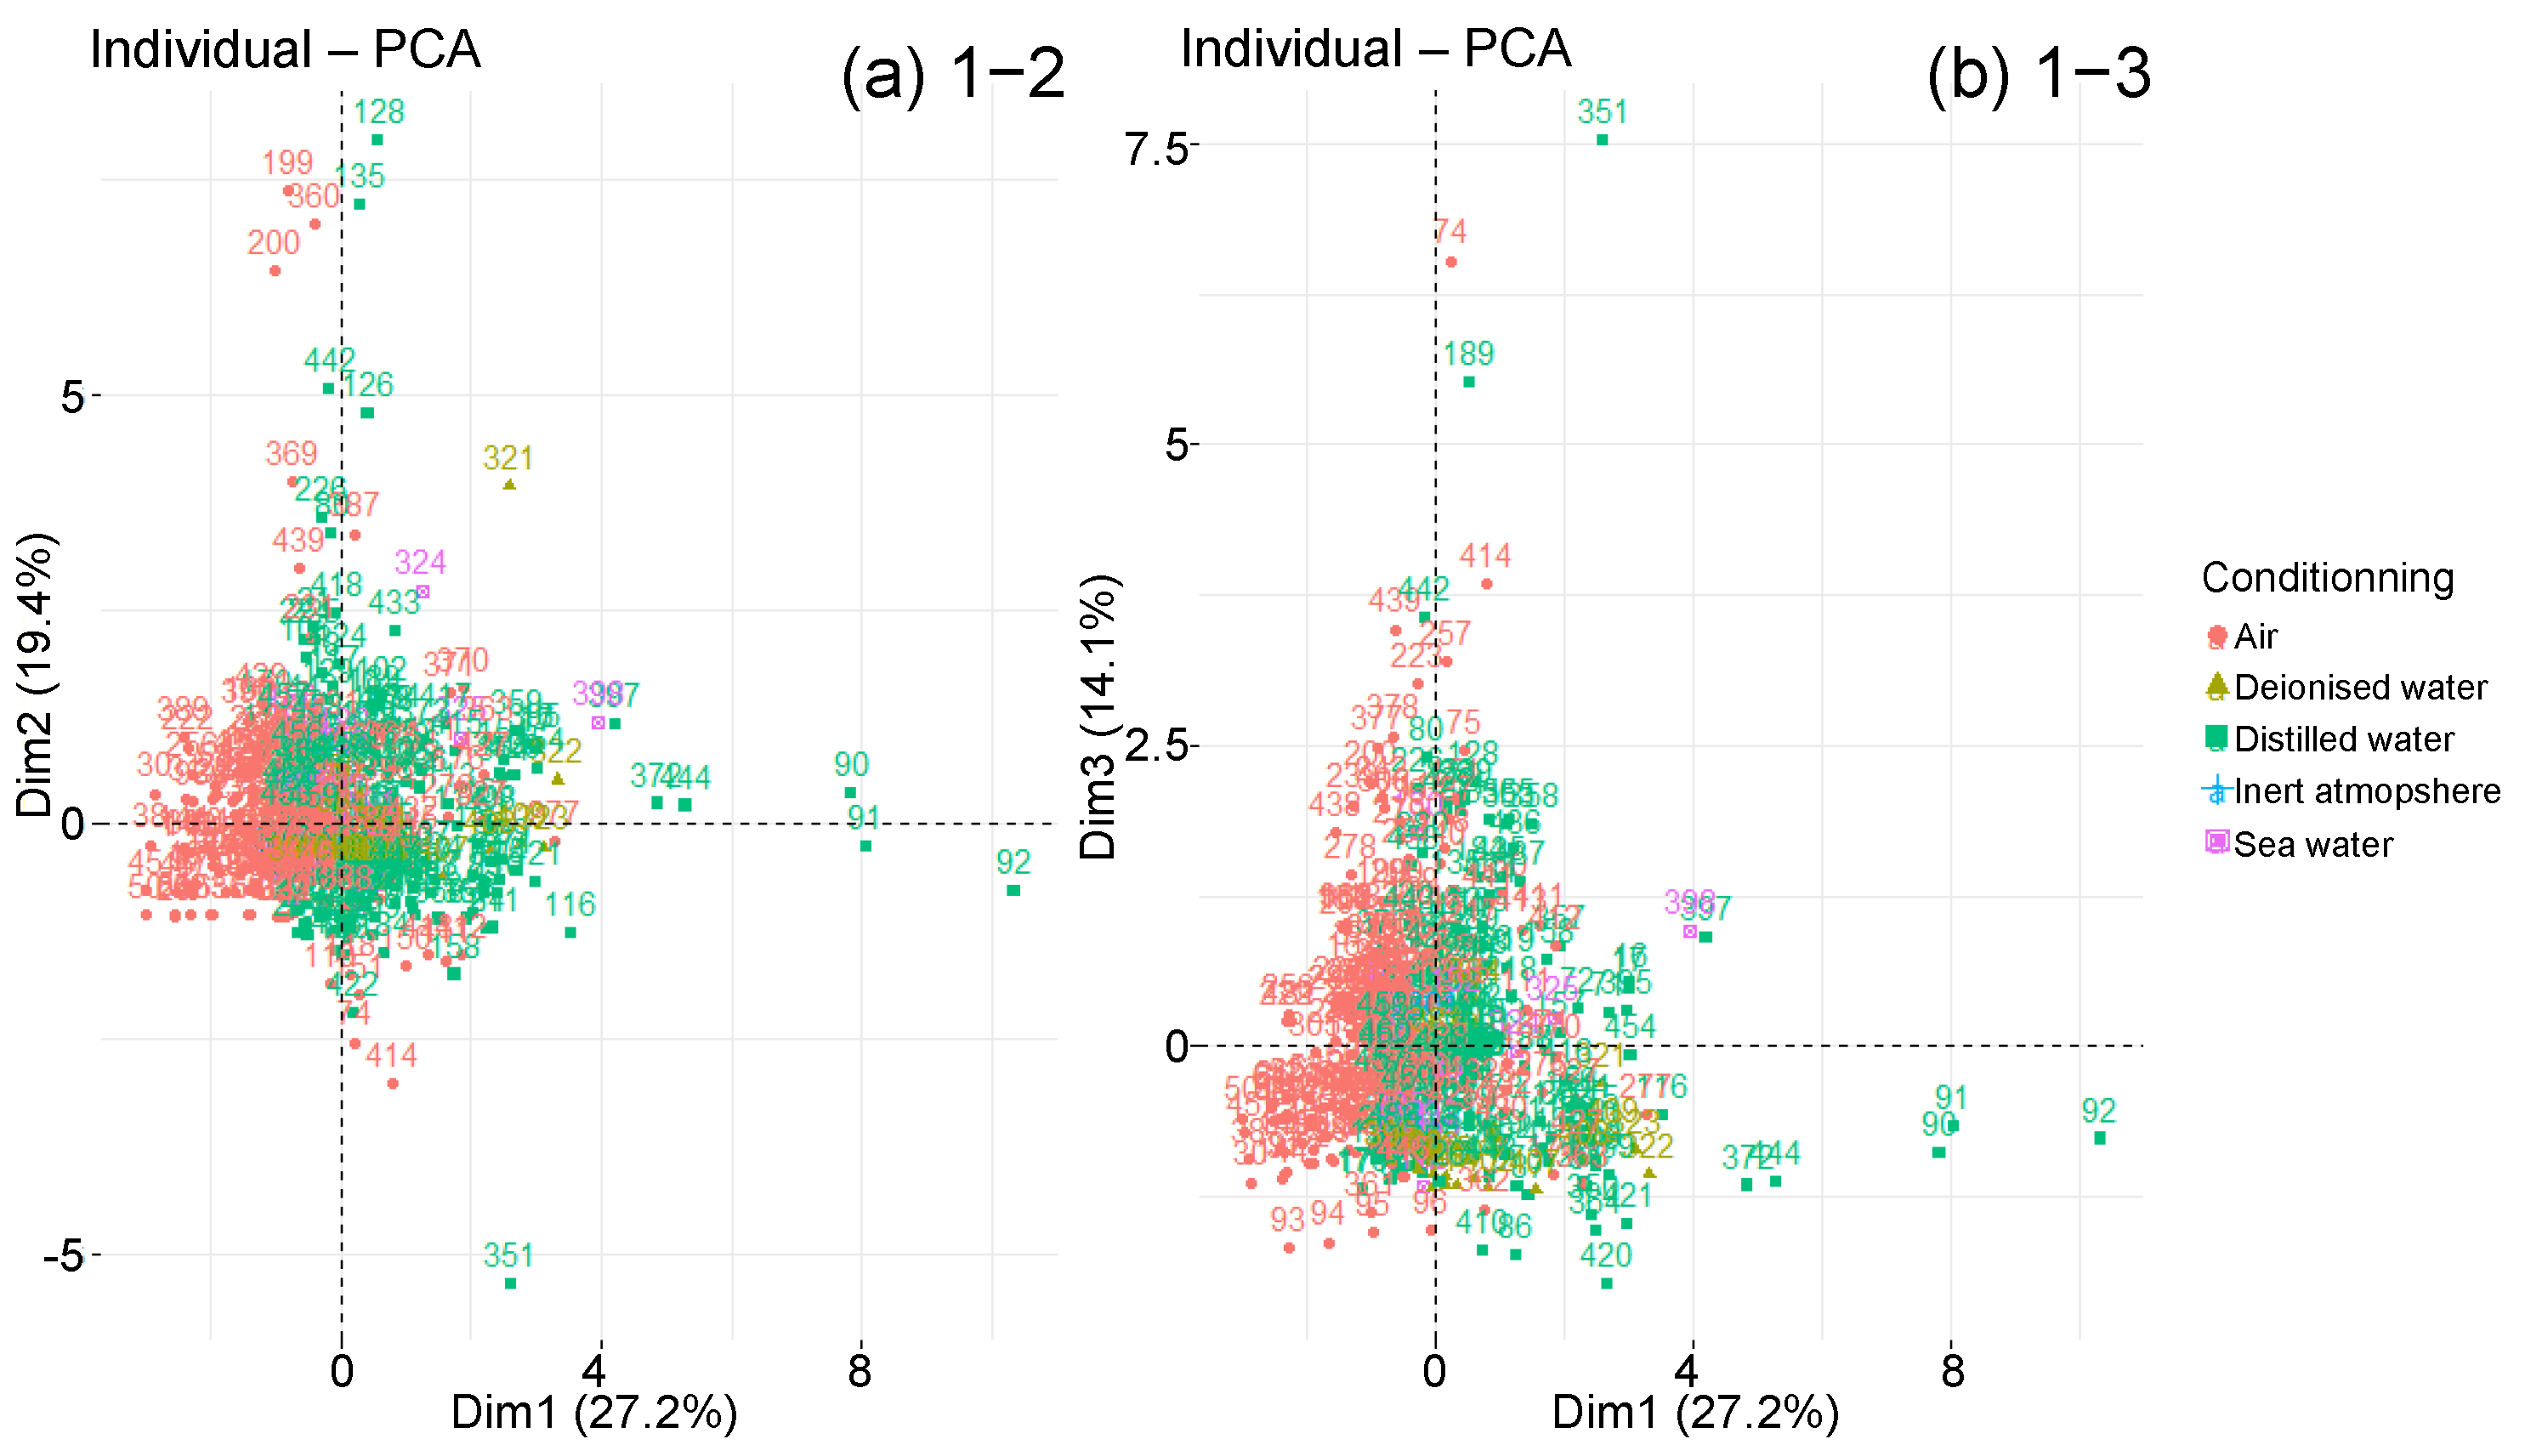
4.3.1. Overview
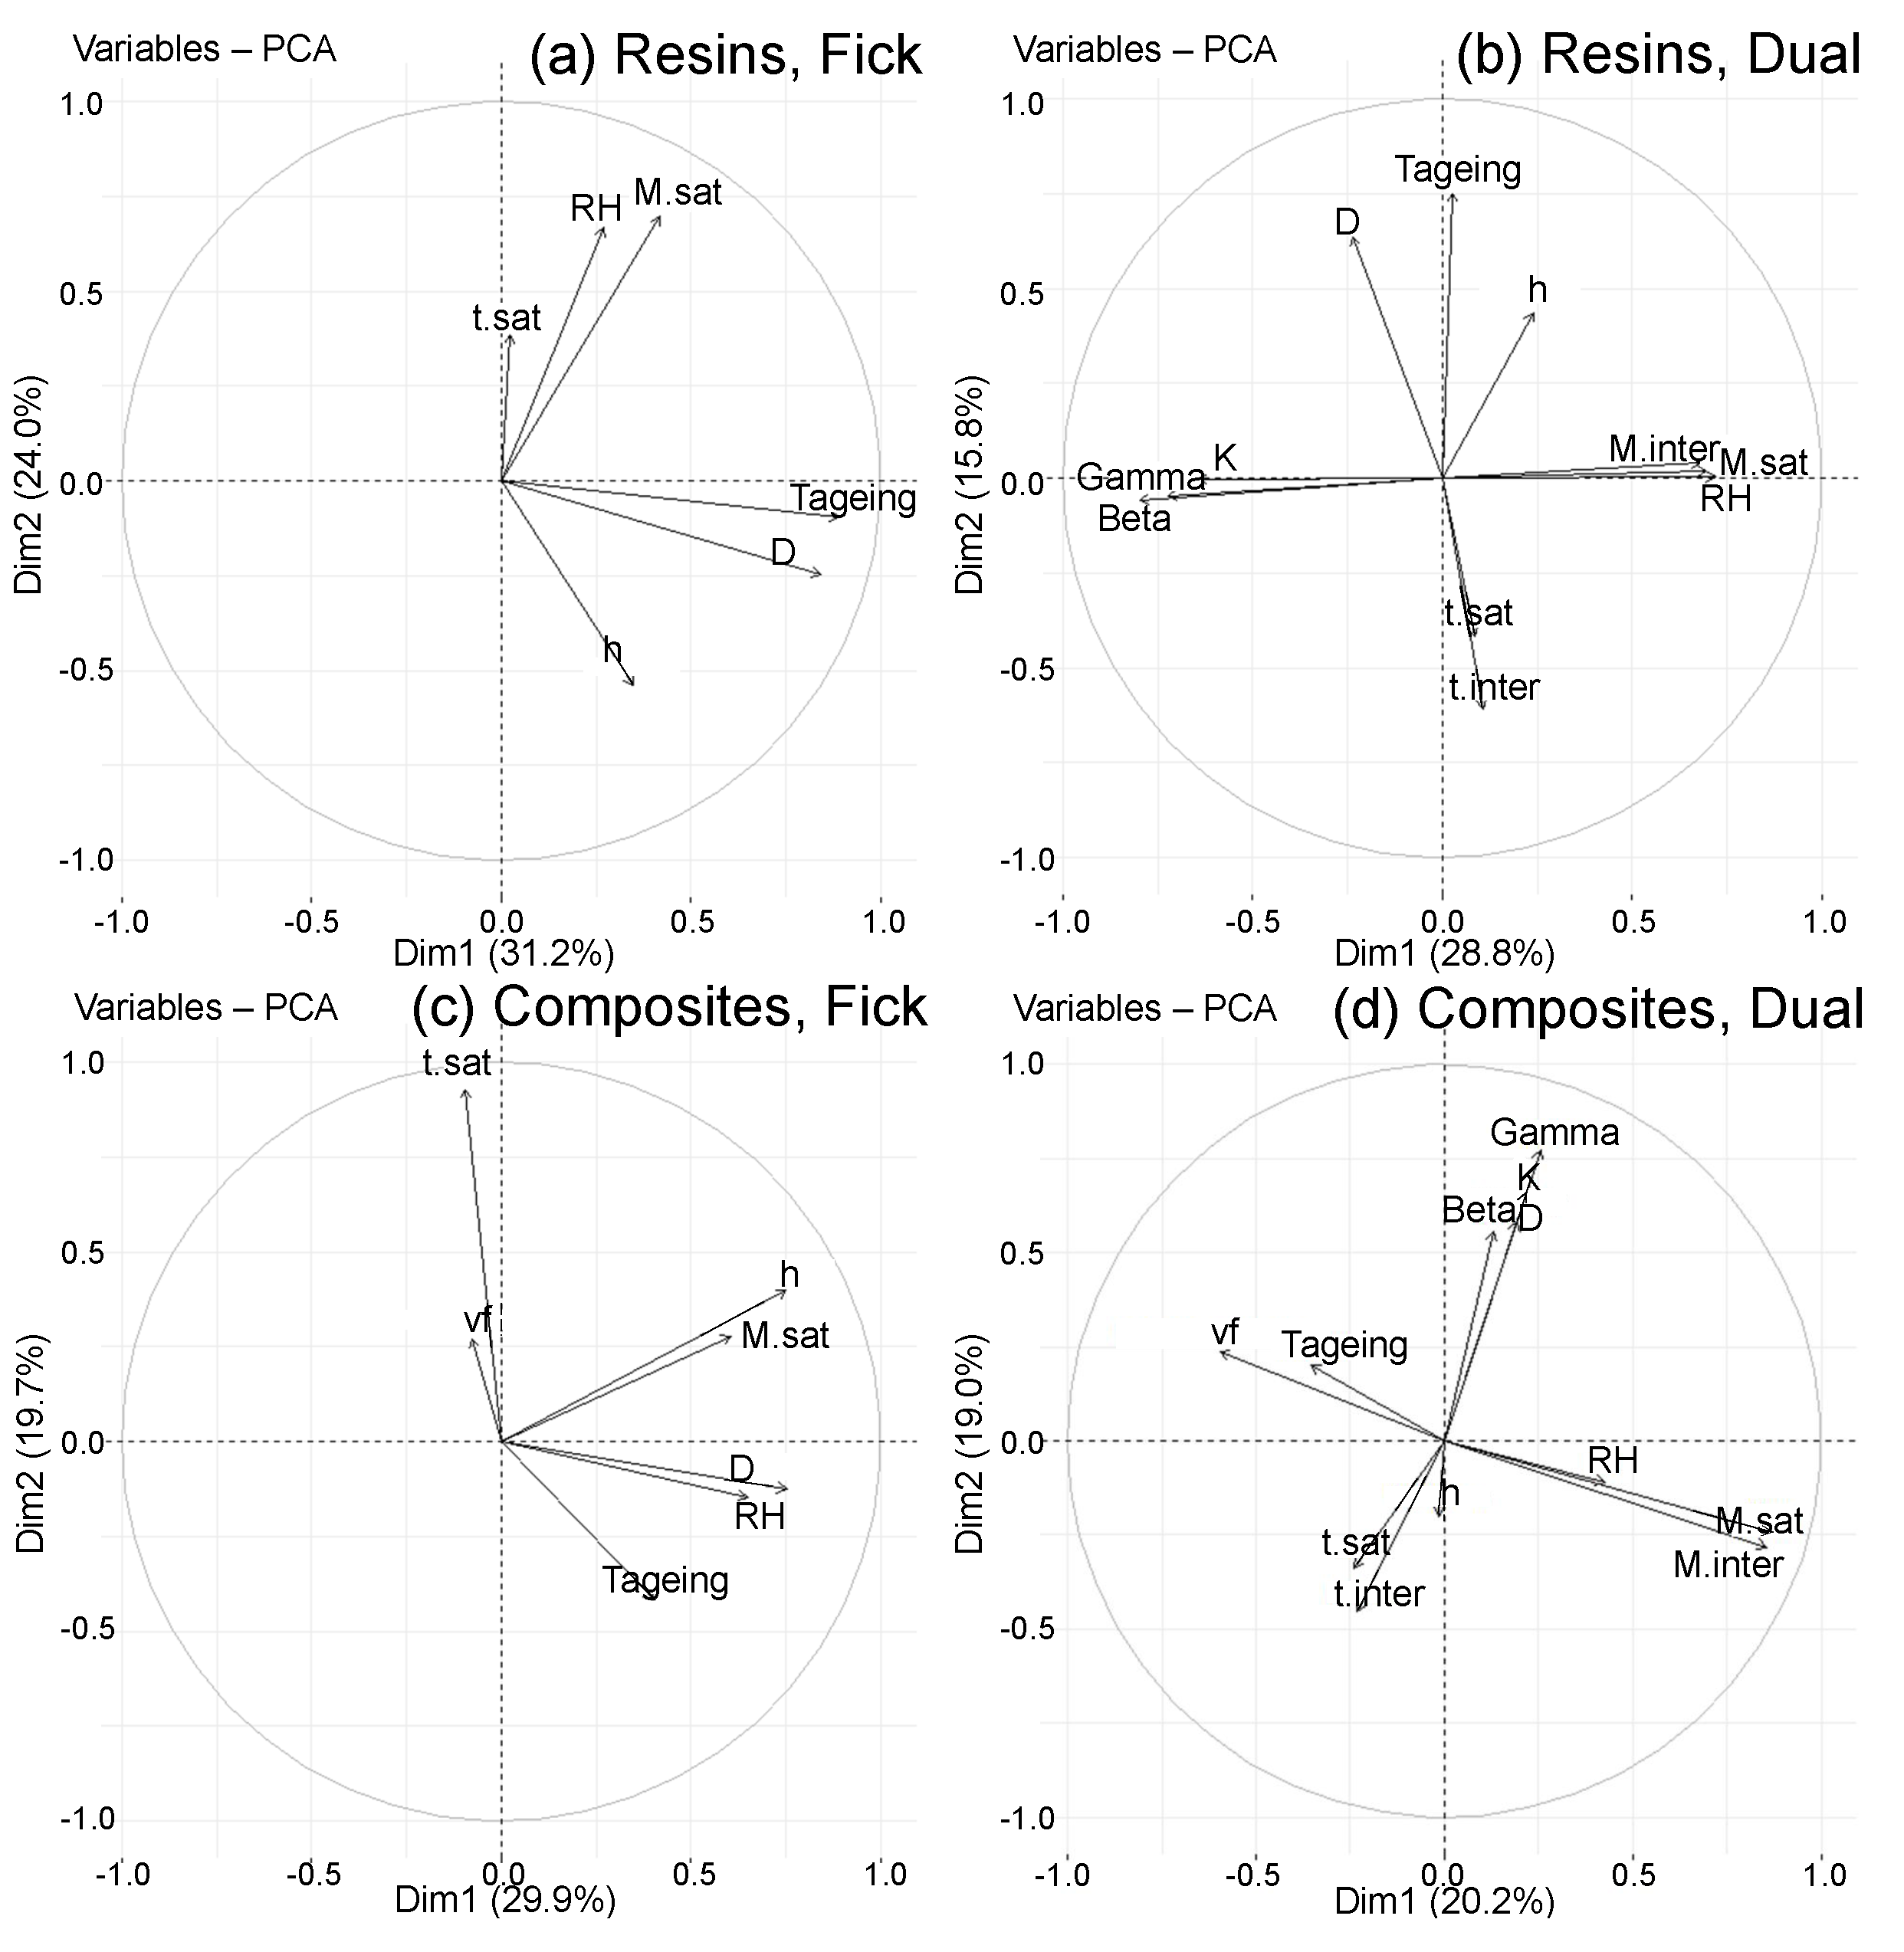
- and are correlated with each other ();
- and are correlated with each other, and are anti-correlated with ,which means they decrease when increases ();
- h and D are correlated with each other ();
4.3.2. Classified PCA
5. Discussion
6. Conclusions
Supplementary Materials
Author Contributions
Funding
Institutional Review Board Statement
Informed Consent Statement
Data Availability Statement
Conflicts of Interest
References
- Henry, L.; Kris, N. Handbook of Epoxy Resins; McGraw-Hill: New York, NY, USA, 1967. [Google Scholar]
- Peters, S.T. (Ed.) Handbook of Composites, 2nd ed.; Springer Science and Business Media: Dordrecht, The Netherlands, 1998. [Google Scholar]
- Jones, C.; Dickson, R.; Adam, T.; Reiter, H.; Harris, B. The environmental fatigue behaviour of reinforced plastics. Proc. R. Soc. Lond. A. Math. Phys. Sci. 1984, 396, 315–338. [Google Scholar]
- Cavasin, M.; Sangermano, M.; Thomson, B.; Giannis, S. Exposure of Glass Fiber Reinforced Polymer Composites in Seawater and the Effect on Their Physical Performance. Materials 2019, 12, 807. [Google Scholar] [CrossRef] [Green Version]
- Tsai, Y.; Bosze, E.; Barjasteh, E.; Nutt, S. Influence of hygrothermal environment on thermal and mechanical properties of carbon fiber/fiberglass hybrid composites. Compos. Sci. Technol. 2009, 69, 432–437. [Google Scholar] [CrossRef]
- Lee, M.C.; Peppas, N.A. Water transport in graphite/epoxy composites. J. Appl. Polym. Sci. 1993, 47, 1349–1359. [Google Scholar] [CrossRef]
- Zhou, J.; Lucas, J. The effects of a water environment on anomalous absorption behavior in graphite/epoxy composites. Compos. Sci. Technol. 1995, 53, 57–64. [Google Scholar] [CrossRef]
- Weitsman, Y. Anomalous fluid sorption in polymeric composites and its relation to fluid-induced damage. Compos. Part A Appl. Sci. Manuf. 2006, 37, 617–623. [Google Scholar] [CrossRef]
- Tsotsis, T. Considerations of failure mechanisms in polymer matrix composites in the design of aerospace structures. In Failure Mechanisms in Polymer Matrix Composites; Elsevier: Amsterdam, The Netherlands, 2012; pp. 227–278. [Google Scholar] [CrossRef]
- Tcharkhtchi, A.; Bronnec, P.; Verdu, J. Water absorption characteristics of diglycidylether of butane diol–3,5-diethyl-2,4-diaminotoluene networks. Polymer 2000, 41, 5777–5785. [Google Scholar] [CrossRef]
- Colin, X.; Verdu, J. Humid Ageing of Organic Matrix Composites. In Durability of Composites in a Marine Environment. Solid Mechanics and Its Applications; Davies, P., Rajapakse, Y.D.S., Eds.; Springer: Dordrecht, The Netherlands, 2014; pp. 47–114. [Google Scholar]
- Deroiné, M.; Le Duigou, A.; Corre, Y.M.; Le Gac, P.Y.; Davies, P.; César, G.; Bruzaud, S. Accelerated ageing of polylactide in aqueous environments: Comparative study between distilled water and seawater. Polym. Degrad. Stabil. 2014, 108, 319–329. [Google Scholar] [CrossRef] [Green Version]
- Boukhoulda, B.; Adda-Bedia, E.; Madani, K. The effect of fiber orientation angle in composite materials on moisture absorption and material degradation after hygrothermal ageing. Compos. Struct. 2006, 74, 406–418. [Google Scholar] [CrossRef]
- Selzer, R.; Friedrich, K. Mechanical properties and failure behaviour of carbon fibre-reinforced polymer composites under the influence of moisture. Compos. Part A Appl. Sci. Manuf. 1997, 28, 595–604. [Google Scholar] [CrossRef]
- De’Nève, B.; Shanahan, M. Water absorption by an epoxy resin and its effect on the mechanical properties and infra-red spectra. Polymer 1993, 34, 5099–5105. [Google Scholar] [CrossRef]
- Ramirez, F.A.; Carlsson, L.A.; Acha, B.A. Evaluation of water degradation of vinylester and epoxy matrix composites by single fiber and composite tests. J. Mater. Sci. 2008, 43, 5230–5242. [Google Scholar] [CrossRef]
- Halpin, J.C. Effects of Environmental Factors on Composite Materials; Technical report AFML-TR-67-423; Air Force Materials Laboratory, Wright-Patterson Air Force Base: Dayton, OH, USA, 1969; p. 45433. [Google Scholar]
- Chen, C. Contribution à la Prise en Compte des Effets de l’Environnement sur la Tolérance aux Dommages d’Impact de Stratifiés Composites. Ph.D. Thesis, Institut Supérieur d’Aéronautique et de l’Espace, Paris, France, 2015. [Google Scholar]
- Popineau, S.; Rondeau-Mouro, C.; Sulpice-Gaillet, C.; Shanahan, M.E. Free/bound water absorption in an epoxy adhesive. Polymer 2005, 46, 10733–10740. [Google Scholar] [CrossRef]
- Fayolle, B.; Verdu, J. Vieillissement Physique des Matériaux Polymères; Techniques de l’Ingénieur: Paris, France, 2005; p. 22. [Google Scholar]
- Grangeat, R. Durabilité des Assemblages Collés en Environnement Humide—Instrumentation par Capteurs à Fibre Optique. Ph.D. Thesis, Université de Nantes, Institut de Recherche en Génie Civil et Mécanique (GeM), Nantes, France, 2019. [Google Scholar]
- Bonniau, P.; Bunsell, A.R. A comparative study of water absorption theories applied to glass epoxy composites. J. Compos. Mater. 1981, 15, 272–293. [Google Scholar] [CrossRef]
- Morel, E.; Bellenger, V.; Verdu, J. Structure-water absorption relationships for amine-cured epoxy resins. Polymer 1985, 26, 1719–1724. [Google Scholar] [CrossRef]
- Wong, K.J. Moisture Absorption Characteristics and Effects on Mechanical Behaviour of Carbon/Epoxy Composite: Application to Bonded Patch Repairs of Composite Structures. Ph.D. Thesis, Université de Bourgogne, Laboratoire DRIVE ISAT, Nevers, France, 2014. [Google Scholar]
- Soles, C.L.; Yee, A.F. A Discussion of the Molecular Mechanisms of Moisture Transport in Epoxy Resins. J. Polym. Sci. Part B Polym. Phys. 2000, 38, 792–802. [Google Scholar] [CrossRef] [Green Version]
- Abdelkader, A.F.; White, J.R. Water absorption in epoxy resins: The effects of the crosslinking agent and curing temperature. J. Appl. Polym. Sci. 2005, 98, 2544–2549. [Google Scholar] [CrossRef]
- Sala, G. Composite degradation due to fluid absorption. Compos. Part B Eng. 2000, 31, 357–373. [Google Scholar] [CrossRef]
- Doğan, A.; Arman, Y. The Effect of Hygrothermal Aging on the Glass and Carbon Reinforced Epoxy Composites for different Stacking Sequences. Mechanics 2018, 24, 19–25. [Google Scholar] [CrossRef] [Green Version]
- Ray, B.C. Temperature effect during humid ageing on interfaces of glass and carbon fibers reinforced epoxy composites. J. Colloid Interface Sci. 2006, 298, 111–117. [Google Scholar] [CrossRef]
- Augl, J.M.; Berger, A.E. The Effect of Moisture on Carbon Fiber Reinforced Epoxy Composites. I. Diffusion; Technical Report 76-7; White Oak Laboratory, Naval Surface Weapons Center: Silver Spring, MA, USA, 1976. [Google Scholar]
- Clark, G.; Saunders, D.; van Blaricum, T.; Richmond, M. Moisture absorption in graphite/epoxy laminates. Compos. Sci. Technol. 1990, 39, 355–375. [Google Scholar] [CrossRef]
- Gupta, V.B.; Drzal, L.T.; Rich, M.J. The physical basis of moisture transport in a cured epoxy resin system. J. Appl. Polym. Sci. 1985, 30, 4467–4493. [Google Scholar] [CrossRef]
- Arnold, C.; Korkees, F.; Alston, S. The long-term water absorption and desorption behaviour of carbon-fibre/epoxy composites. In Proceedings of the ECCM15 Proceedings, ESCM: 15th European Conference on Composite Materials, Venice, Italy, 24–28 June 2012; Volume 15. [Google Scholar]
- Simar, A. Impact du Vieillissement Humide sur le Comportement d’un Composite à Matrice Organique Tissé Fabriqué par Injection RTM: Mise en Evidence d’un Couplage entre Absorption d’Eau et Thermo-Oxydation de la Matrice. Ph.D. Thesis, École Nationale Supérieure de Mécanique et d’Aérotechnique, Institut Prime, Poitiers, France, 2014. [Google Scholar]
- Kondo, K.; Taki, T. Moisture Diffusivity of Unidirectional Composites. J. Compos. Mater. 1982, 16, 82–93. [Google Scholar] [CrossRef]
- Grangeat, R.; Girard, M.; Lupi, C.; Leduc, D.; Jacquemin, F. Measurement of the local water content of an epoxy adhesive by fiber optic sensor based on Fresnel reflection. Mech. Syst. Sign. Process. 2020, 141, 106439. [Google Scholar] [CrossRef]
- Shen, C.H.; Springer, G.S. Moisture absorption and desorption of composite materials. J. Compos. Mater. 1976, 10, 2–20. [Google Scholar] [CrossRef]
- Perreux, D.; Suri, C. A study of the coupling between the phenomena of water absorption and damage in glass/epoxy composite pipes. Compos. Sci. Technol. 1997, 57, 1403–1413. [Google Scholar] [CrossRef]
- Pierron, F.; Poirette, Y.; Vautrin, A. A novel procedure for identification of 3D moisture diffusion parameters on thick composites: Theory, validation and experimental results. J. Compos. Mater. 2002, 36, 2219–2243. [Google Scholar] [CrossRef]
- Zainuddin, S.; Hosur, M.; Zhou, Y.; Kumar, A.; Jeelani, S. Durability studies of montmorillonite clay filled epoxy composites under different environmental conditions. Mater. Sci. Eng. A 2009, 507, 117–123. [Google Scholar] [CrossRef]
- Frank, K.; Childers, C.; Dutta, D.; Gidley, D.; Jackson, M.; Ward, S.; Maskell, R.; Wiggins, J. Fluid uptake behavior of multifunctional epoxy blends. Polymer 2013, 54, 403–410. [Google Scholar] [CrossRef]
- Sugita, Y.; Winkelmann, C.; La Saponara, V. Environmental and chemical degradation of carbon/epoxy lap joints for aerospace applications, and effects on their mechanical performance. Compos. Sci. Technol. 2010, 70, 829–839. [Google Scholar] [CrossRef]
- Gaussens, C. Solutions Adhésives et Durabilité d’une Liaison Structurale d’un Capteur Céramique sur un Roulement Acier. Ph.D. Thesis, Institut National Polytechnique de Toulouse, Laboratoire Génie de Production (INP-ENIT), Tarbes, France, 2010. [Google Scholar]
- Billy, F. Vieillissement et Propriétés Résiduelles de Matériaux Issus du Démantèlement d’Avions en Fin de Vie. Ph.D. Thesis, École nationale Supérieure de Mécanique et d’Aérotechnique, Institut Prime, Poitiers, France, 2013. [Google Scholar]
- Carter, H.G.; Kibler, K.G. Langmuir-Type Model for Anomalous Moisture Diffusion In Composite Resins. J. Compos. Mater. 1978, 12, 118–131. [Google Scholar] [CrossRef]
- Selzer, R.; Friedrich, K. Influence of water up-take on interlaminar fracture properties of carbon fibre-reinforced polymer composites. J. Mater. Sci. 1995, 30, 334–338. [Google Scholar] [CrossRef]
- Zafar, A.; Bertocco, F.; Schjødt-Thomsen, J.; Rauhe, J. Investigation of the long term effects of moisture on carbon fibre and epoxy matrix composites. Compos. Sci.Technol. 2012, 72, 656–666. [Google Scholar] [CrossRef]
- Choi, H.S.; Ahn, K.J. Hygroscopic aspects of epoxy/carbon fiber composite laminates in aircraft environments. Compos. Part A Appl. Sci. Manuf. 2001, 32, 709–720. [Google Scholar] [CrossRef]
- Nguyen, T.H. Vieillissement Artificiel et Vieillissement Naturel en Ambiance Tropicale de Composites Modèles Epoxy/Verre: Approche Nanoscopique de l’Etude des Interphases. Ph.D. Thesis, Université du Sud-Toulon-Var, Laboratoire Matériaux Polymères-Interfaces-Environnement Marin, La Garde, France, 2013. [Google Scholar]
- Zhou, J.; Lucas, J.P. Hygrothermal effects of epoxy resin. Part I: The nature of water in epoxy. Polymer 1999, 40, 5505–5512. [Google Scholar] [CrossRef]
- Barton, S.J.; Pritchard, G. The moisture absorption characteristics of crosslinked vinyl terminated polyethers compared with epoxies. Polym. Adv. Technol. 1994, 5, 245–252. [Google Scholar] [CrossRef]
- Weitsman, Y.J.; Guo, Y.J. A correlation between fluid-induced damage and anomalous fluid sorption in polymeric composites. Compos. Sci. Technol. 2002, 62, 889–908. [Google Scholar] [CrossRef]
- Pérez-Pacheco, E.; Cauich-Cupul, J.I.; Valadez-González, A.; Herrera-Franco, P.J. Effect of moisture absorption on the mechanical behavior of carbon fiber/epoxy matrix composites. J. Mater. Sci. 2013, 48, 1873–1882. [Google Scholar] [CrossRef]
- Dao, B.; Hodgkin, J.H.; Krstina, J.; Mardel, J.; Tian, W. Accelerated aging versus realistic ageing in aerospace composite materials. IV. Hot/wet ageing effects in a low temperature cure epoxycomposite. J. Appl. Polym. Sci. 2007, 106, 4264–4276. [Google Scholar] [CrossRef]
- Dao, B.; Hodgkin, J.; Krstina, J.; Mardel, J.; Tian, W. Accelerated aging versus realistic aging in aerospace composite materials. V. The effects of hot/wet aging in a structural epoxy composite. J. Appl. Polym. Sci. 2010, 115, 901–910. [Google Scholar] [CrossRef]
- Verghese, K.; Haramis, J.; Patel, S.; Senne, J.; Case, S.; Lesko, J. Enviro-mechanical durability of polymer composites. In Proceedings of the Long Term Durability of Structural Materials Workshop, Berkeley, CA, USA, 26–27 October 2001; pp. 121–132. [Google Scholar] [CrossRef]
- Delozanne, J.; Desgardin, N.; Coulaud, M.; Cuvillier, N.; Richaud, E. Failure of epoxies bonded assemblies: Comparison of thermal and humid ageing. J. Adhes. 2018, 1–24. [Google Scholar] [CrossRef]
- Guermazi, N.; Haddar, N.; Elleuch, K.; Ayedi, H. Investigations on the fabrication and the characterization of glass/epoxy, carbon/epoxy and hybrid composites used in the reinforcement and the repair of aeronautic structures. Mater. Des. 2014, 56, 714–724. [Google Scholar] [CrossRef]
- Dexter, H.B.; Baker, D.J. Flight service environmental effects on composite materials and structures. Adv. Perform. Mater. 1994, 1, 51–85. [Google Scholar] [CrossRef]
- Vodicka, R.; Nelson, B.; van der Berg, J.; Chester, R. Long-Term Environmental Durability of F/A-18 Composite Material; Technical Report DSTO-TR-0826; DSTO Aeronautical and Maritime Research Laboratory: Melbourne, Australia, 1999. [Google Scholar]
- McKague, E.; Halkias, J.; Reynolds, J. Moisture in composites: The effect of supersonic service on diffusion. J. Compos. Mater. 1975, 9, 2–9. [Google Scholar] [CrossRef]
- Aktas, L.; Hamidi, Y.; Altan, M.C. Effect of Moisture Absorption on Mechanical Properties of Resin Transfer Molded Composites. In Materials: Processing, Characterization and Modeling of Novel Nano-Engineered and Surface Engineered Materials, Proceedings of the ASME 2002 International Mechanical Engineering Congress and Exposition, New Orleans, LA, USA, 17–22 November 2002; ASME: New York, NY, USA, 2002; Volume 2002, pp. 173–181. [Google Scholar] [CrossRef]
- Sugiman, S.; Salman, S. Hygrothermal effects on tensile and fracture properties of epoxy filled with inorganic fillers having different reactivity to water. J. Adhes. Sci. Technol. 2019, 33, 691–714. [Google Scholar] [CrossRef]
- Bordes, M.; Davies, P.; Cognard, J.Y.; Sohier, L.; Sauvant-Moynot, V.; Galy, J. Prediction of long term strength of adhesively bonded steel/epoxy joints in sea water. Int. J. Adhes. Adhes. 2009, 29, 595–608. [Google Scholar] [CrossRef] [Green Version]
- Loh, W.K.; Crocombe, A.D.; Abdel Wahab, M.M.; Ashcroft, I.A. Modelling anomalous moisture uptake, swelling and thermalcharacteristics of a rubber toughened epoxy adhesive. Int. J. Adhes. Adhes. 2005, 25, 1–12. [Google Scholar] [CrossRef]
- Scida, D.; Aboura, Z.; Benzeggagh, M. The effect of ageing on the damage events in woven-fibre composite materials under different loading conditions. Compos. Sci. Technol. 2002, 62, 551–557. [Google Scholar] [CrossRef]
- Cândido, G.M.; Costa, M.L.; Rezende, M.C.; Almeida, S.F.M. Hygrothermal effects on quasi-isotropic carbon epoxy laminates with machined and molded edges. Compos. Part B Eng. 2008, 39, 490–496. [Google Scholar] [CrossRef]
- Cao, Y.; Qian, X.; Liu, C.; Yang, J.; Xie, K.; Zhang, C. Controllable preparation of a novel epoxy/anhydride system with polyether-Polyester semi-interpenetrating structure and the excellent hydrothermal aging resistance properties. Polym. Degrad. Stabil. 2019, 168, 1–10. [Google Scholar] [CrossRef]
- Wang, M.; Xu, X.; Ji, J.; Yang, Y.; Shen, J.; Ye, M. The hygrothermal aging process and mechanism of the novolac epoxy resin. Compos. Part B Eng. 2016, 107, 1–8. [Google Scholar] [CrossRef]
- Guo, B.; Jia, D.; Fu, W.; Qiu, Q. Hygrothermal stability of dicyanate-novolac epoxy resin blends. Polym. Degrad. Stabil. 2003, 79, 521–528. [Google Scholar] [CrossRef]
- Capiel, G.; Miccio, L.A.; Montemartini, P.E.; Schwartz, G.A. Water diffusion and hydrolysis effect on the structure and dynamics of epoxy-anhydride networks. Polym. Degrad. Stabil. 2017, 143, 57–63. [Google Scholar] [CrossRef]
- El Yagoubi, J.; Lubineau, G.; Roger, F.; Verdu, J. A fully coupled diffusion-reaction scheme for moisture sorption-desorption in an anhydride-cured epoxy resin. Polymer 2012, 53, 5582–5595. [Google Scholar] [CrossRef]
- Bréthous, R.; Colin, X.; Fayolle, B.; Gervais, M. Non-Fickian behavior of water absorption in an epoxy-amidoamine network. In Proceedings of the VIII International Conference on Times of Polymers and Composites, Naples, Italy, 19–23 June 2016; AIP Publishing: Melville, NY, USA, 2016; p. 020070. [Google Scholar] [CrossRef]
- Pupure, L.; Doroudgarian, N.; Joffe, R. Moisture uptake and resulting mechanical response of biobased composites. I. constituents. Polym. Compos. 2013, 35, 1150–1159. [Google Scholar] [CrossRef]
- Verge, P.; Toniazzo, V.; Ruch, D.; Bomfim, J.A. Unconventional plasticization threshold for a biobased bisphenol-A epoxy substitution candidate displaying improved adhesion and water-resistance. Ind. Crops Prod. 2014, 55, 180–186. [Google Scholar] [CrossRef]
- Mannberg, P.; Nyström, B.; Joffe, R. Service life assessment and moisture influence on bio-based thermosetting resins. J. Mater. Sci. 2014, 49, 3687–3693. [Google Scholar] [CrossRef]
- Núñez, L.; Villanueva, M.; Fraga, F.; Núñez, M.R. Influence of Water Absorption on the Mechanical Properties of DGEBA (n=0)/1, 2 DCH Epoxy System. J. Appl. Polym. Sci. 1999, 74, 353–358. [Google Scholar] [CrossRef]
- Apicella, A.; Nicolais, L. Role of processing on the durability of epoxy composites in humid environments. Ind. Eng. Chem. Prod. Res. Dev. 1984, 23, 288–297. [Google Scholar] [CrossRef]
- Suzuki, T.; Oki, Y.; Numajiri, M.; Miura, T.; Kondo, K. Free-volume characteristics and water absorption of novolac epoxy resins investigated by positron annihilation. Polymer 1996, 37, 3025–3030. [Google Scholar] [CrossRef]
- Cadu, T.; Van Schoors, L.; Sicot, O.; Moscardelli, S.; Divet, L.; Fontaine, S. Cyclic hygrothermal ageing of flax fibers’ bundles and unidirectional flax/epoxy composite. Are bio-based reinforced composites so sensitive? Ind. Crops Prod. 2019, 141, 1–12. [Google Scholar] [CrossRef] [Green Version]
- Assarar, M.; Scida, D.; El Mahi, A.; Poilâne, C.; Ayad, R. Influence of water ageing on mechanical properties and damage events of two reinforced composite materials: Flax–fibres and glass–fibres. Mater. Des. 2011, 32, 788–795. [Google Scholar] [CrossRef]
- Newman, R.H. Auto-accelerative water damage in an epoxy composite reinforced with plain-weave flax fabric. Compos. Part A Appl. Sci. Manuf. 2009, 40, 1615–1620. [Google Scholar] [CrossRef]
- Scida, D.; Assarar, M.; Poilâne, C.; Ayad, R. Influence of hygrothermal ageing on the damage mechanisms of flax-fibre reinforced epoxy composite. Compos. Part B Eng. 2013, 48, 51–58. [Google Scholar] [CrossRef]
- Yan, L.; Chouw, N. Effect of water, seawater and alkaline solution ageing on mechanical properties of flax fabric/epoxy composites used for civil engineering applications. Construct. Build. Mater. 2015, 99, 118–127. [Google Scholar] [CrossRef]
- Perrier, A.; Touchard, F.; Chocinski-Arnault, L.; Mellier, D. Quantitative analysis by micro-CT of damage during tensile test in a woven hemp/epoxy composite after water ageing. Compos. Part A Appl. Sci. Manuf. 2017, 102, 18–27. [Google Scholar] [CrossRef]
- Doroudgarian, N.; Pupure, L.; Joffe, R. Moisture uptake and resulting mechanical response of bio-based composites. II. Composites. Polym. Compos. 2015, 36, 1510–1519. [Google Scholar] [CrossRef]
- Islam, M.S. The Influence of Fibre Processing and Treatments on Hemp Fibre/Epoxy and Hemp Fibre/PLA Composites. Ph.D. Thesis, University of Waikato, Hamilton, New Zealand, 2008. [Google Scholar]
- Wan, Y.; Wang, Y.; Huang, Y.; Luo, H.; He, F.; Chen, G. Moisture absorption in a three-dimensional braided carbon/Kevlar/epoxy hybrid composite for orthopaedic usage and its influence on mechanical performance. Compos. Part A Appl. Sci. Manuf. 2006, 37, 1480–1484. [Google Scholar] [CrossRef]
- Aronhime, M.T.; Neumann, S.; Marom, G. The anisotropic diffusion of water in Kevlar-epoxy composites. J. Mater. Sci. 1987, 22, 2435–2446. [Google Scholar] [CrossRef]
- Piasecki, F. Résines Polyépoxydes Nanostructurées aux Propriétés d’Adhésion et à la Tenue au Vieillissement Améliorées. Ph.D. Thesis, Université de Bordeaux-I, Laboratoire de Chimie des Polymères Organiques, Bordeaux, France, 2013. [Google Scholar]
- Akay, M.; Ah Mun, S.K.; Stanley, A. Influence of moisture on the thermal and mechanical properties of autoclaved and oven-cured Kevlar-49/epoxy laminates. Compos. Sci. Technol. 1997, 57, 565–571. [Google Scholar] [CrossRef]
- Hahn, H.T.; Kim, K.S. Hygroscopic Effects in Aramid Fiber/Epoxy Composite. J. Eng. Mater. Technol. 1988, 110, 153–157. [Google Scholar] [CrossRef]
- Sinchuk, Y.; Pannier, Y.; Antoranz-Gonzalez, R.; Gigliotti, M. Analysis of moisture diffusion induced stress in carbon/epoxy 3D textile composite materials with voids by µ-CT based Finite Element Models. Compos. Struct. 2019, 212, 561–570. [Google Scholar] [CrossRef]
- Wan, Y.Z.; Wang, Y.L.; Cheng, G.X.; Han, K.Y. Three-dimensionally braided carbon fiber-epoxy composites, a new type of material for osteosynthesis devices. I. Mechanical properties and moisture absorption behavior. J. Appl. Polym. Sci. 2002, 85, 1031–1039. [Google Scholar] [CrossRef]
- Yuan, Y.; Zhou, C.w. Meso-Scale Modeling to Characterize Moisture Absorption of 3D Woven Composite. Appl. Compos. Mater. 2016, 23, 719–738. [Google Scholar] [CrossRef]
- Abacha, N.; Kubouchi, M.; Sakai, T.; Tsuda, K. Diffusion behavior of water and sulfuric acid in epoxy/organoclay nanocomposites. J. Appl. Polym. Sci. 2009, 112, 1021–1029. [Google Scholar] [CrossRef]
- Dell’Anno, G.; Lees, R. Effect of water immersion on the interlaminar and flexural performance of lowcost liquid resin infused carbon fabric composites. Compos. Part Eng. 2012, 43, 1368–1372. [Google Scholar] [CrossRef] [Green Version]
- Larbi, S.; Bensaada, R.; Bilek, A.; Djebali, S. Hygrothermal ageing effect on mechanical properties of FRP laminates. In Proceedings of the AIP 4th International Congress in Advances in Applied Physics and Materials Science, Fethiye, Turkey, 24–24 April 2015; AIP Publishing: Melville, NY, USA, 2015. [Google Scholar] [CrossRef] [Green Version]
- Collings, T.; Stone, D. Hygrothermal effects in CFC laminates: Damaging effects of temperature, moisture and thermal spiking. Compos. Struct. 1985, 3, 341–378. [Google Scholar] [CrossRef]
- Vanlandingham, M.R.; Eduljee, R.F.; Gillespie, J.W. Moisture diffusion in epoxy systems. J. Appl. Polym. Sci. 1999, 71, 787–798. [Google Scholar] [CrossRef]
- Johncok, P.; Tudgey, G.F. Some Effects of Structure, Composition and Cure on the Water Absorption and Glass Transition Temperature of Amine-cured Epoxies. Br. Polym. J. 1986, 18, 292–302. [Google Scholar] [CrossRef]
- Bellenger, V.; Verdu, J.; Morel, E. Structure-properties relationships for densely cross-linked epoxide-amine systems based on epoxide or amine mixtures. Part 2: Water absorption and diffusion. J. Mater. Sci. 1989, 24, 63–68. [Google Scholar] [CrossRef]
- Xiao, G.; Shanahan, M. Swelling of DGEBA/DDA epoxy resin during hygrothermal ageing. Polymer 1998, 39, 3253–3260. [Google Scholar] [CrossRef]
- Heman, M.B. Contribution à l’Etude des Interphases et de Leur Comportement au Vieillissement Hygrothermique dans les Systèmes à Matrice Thermodurcissable Renforcés de Fibres de Verre. Ph.D. Thesis, Université du Sud-Toulon-Var, Laboratoire Matériaux à Finalités Spécifiques, La Garde, France, 2008. [Google Scholar]
- Xiao, G.; Shanahan, M. Irreversible effects of hygrothermal aging on DGEBA/DDA epoxy resin. J. Appl. Polym. Sci. 1998, 69, 363–369. [Google Scholar] [CrossRef]
- Shirrell, C.D.; Halpin, J. Moisture absorption and desorption in epoxy composite laminates. In Proceedings of the Composite Materials: Testing and Design; Davis West, J., Ed.; ASTM International: West Conshohocken, PA, USA, 1977; pp. 514–528. [Google Scholar]
- Martin, R. Ageing of Composites. Composites Science and Engineering; Woodhead Publishing Series: Cambridge, UK, 2008. [Google Scholar]
- Lefebvre, D.; Dillard, D.; Ward, T. A model for the diffusion of moisture in adhesive joints. Part I: Equations governing diffusion. J. Adhes. 1989, 27, 1–18. [Google Scholar] [CrossRef]
- Crank, J. The Mathematics of Diffusion; Clarendon Press: Oxford, UK, 1975. [Google Scholar]
- Weitsman, Y.J. Diffusion models. In Fluid Effects in Polymers and Polymeric Composites; Springer: New York, NY, USA, 2012; pp. 69–94. [Google Scholar] [CrossRef]
- Placette, M.D.; Fan, X. A Dual Stage Model of Anomalous Moisture Diffusion and Desorption in Epoxy Mold Compounds. In Proceedings of the 12th International Conference on Thermal, Mechanical and Multiphysics Simulation and Experiments in Micro-Electronics and Micro-Systems EuroSimE, Linz, Austria, 18–20 April 2011; IEEE: Linz, Autriche, 2011; pp. 1–8. [Google Scholar]
- Alston, S.; Korkees, F.; Arnold, C. Finite element modelling of moisture uptake in carbone fibre/epoxy composites: A multi-scale approach. In Proceedings of the ECCM15 Proceedings; ESCM: 15th European Conference on Composite Materials, Venice, Italy, 24–28 June 2012. [Google Scholar]
- Gurtin, M.E.; Yatomi, C. On a Model for Two Phase Diffusion in Composite Materials. J. Compos. Mater. 1978, 13, 126–130. [Google Scholar] [CrossRef]
- Chambers, J.M.; Cleveland, W.S.; Kleiner, B.; Tukey, P.A. Graphical Methods for Data Analysis; Chapman and Hall/CRC: Boca Raton, FL, USA, 2018. [Google Scholar]
- Ugarte, M.D.; Militino, A.F.; Arnholt, A.T. Probability and Statistics with R; CRC Press: Boca Raton, FL, USA, 2008. [Google Scholar]
- Cornillon, P.A.; Husson, F.; Jégou, N.; Matzner-Lober, E.; Josse, J.; Guyader, A.; Rouvière, L.; Kloareg, J. Statistiques avec R; Pratique de la Statistique; Presses Universitaires de Rennes: Paris, France, 2012. [Google Scholar]
- Van Krevelen, D.W. Properties of Polymers: Their Correlation with Chemical Structure Their Numerical Estimation and Prediction from Additive Group Contributions, 4th ed.; Elsevier: Amsterdam, The Netherlands, 2009. [Google Scholar]
- Verdu, J. Action de l’Eau sur les Plastiques; Techniques de l’Ingénieur: Paris, France, 2000; pp. 1–11. [Google Scholar]
- Morel, E.; Bellenger, V.; Verdu, J. Relations Structure-Hydrophilie des Réticultats Epoxyde-Amine; Pluralis Ed: Paris, France, 1984; pp. 597–614. [Google Scholar]
- McKague, E.L.; Reynolds, J.D.; Halkias, J.E. Swelling and glass transition relations for epoxy matrix material in humid environments. J. Appl. Polym. Sci. 1978, 22, 1643–1654. [Google Scholar] [CrossRef]
- Cotugno, S.; Larobina, D.; Mensitieri, G.; Musto, P.; Ragosta, G. A novel spectroscopic approach to investigate transport processes in polymers: The case of water-epoxy system. Polymer 2001, 42, 6431–6438. [Google Scholar] [CrossRef]
- Karad, S.K.; Jones, F.R. Mechanisms of moisture absorption by cyanate ester modified epoxy resin matrices: The clustering of water molecules. Polymer 2005, 46, 2732–2738. [Google Scholar] [CrossRef]
- Fuller, R.T.; Fornes, R.E.; Memory, J.D. NMR study of water absorbed by epoxy resin. J. Appl. Polym. Sci. 1979, 23, 1871–1874. [Google Scholar] [CrossRef]
- Pascault, J.P.; Sautereau, H.; Verdu, J.; Williams, R.J.J. Thermosetting Polymers; Marcel Dekker: New York, Ny, USA, 2002. [Google Scholar]
- Bouvet, G. Relations Entre Microstructure et Propriétés Physico-Chimiques et Mécaniques de Revêtements Epoxy Modèles. Ph.D. Thesis, Université de La Rochelle, Laboratoire des Sciences de l’Ingénieur pour l’Environnement, Paris, France, 2014. [Google Scholar]
- Apicella, A.; Nicolais, L.; de Cataldis, C. Characterization of the morphological fine structure of commercial thermosetting resins through hygrothermal experiments. Adv. Polym. Sci. 2005, 66, 189–207. [Google Scholar]
- Bellenger, V.; Decelle, J.; Huet, N. Ageing of a carbon epoxy composite for aeronautic applications. Compos. Part Eng. 2005, 36, 189–194. [Google Scholar] [CrossRef]
- Alam, P.; Robert, C.; Ó Brádaigh, C.M. Tidal turbine blade composites—A review on the effects of hygrothermal aging on the properties of CFRP. Compos. Part Eng. 2018, 149, 248–259. [Google Scholar] [CrossRef]
- Adamson, M.J. Thermal expansion and swelling of cured epoxy resin used in graphite/epoxy composite materials. J. Mater. Sci. 1980, 15, 1736–1745. [Google Scholar] [CrossRef]
- Al-Maharma, A.Y.; Al-Huniti, N. Critical review of the parameters affecting the effectiveness of moisture absorption treatments used for natural composites. J. Compos. Sci. 2019, 3, 27. [Google Scholar] [CrossRef] [Green Version]
- Azwa, Z.; Yousif, B.; Manalo, A.; Karunasena, W. A review on the degradability of polymeric composites based on natural fibres. Mater. Des. 2013, 47, 424–442. [Google Scholar] [CrossRef] [Green Version]
- Hamid, M.R.Y.; Ab Ghani, M.H.; Ahmad, S. Effect of antioxidants and fire retardants as mineral fillers on the physical and mechanical properties of high loading hybrid biocomposites reinforced with rice husks and sawdust. Ind. Crop. Prod. 2012, 40, 96–102. [Google Scholar] [CrossRef]
- Xie, Y.; Hill, C.A.; Xiao, Z.; Militz, H.; Mai, C. Silane coupling agents used for natural fiber/polymer composites: A review. Compos. Part Appl. Sci. Manuf. 2010, 41, 806–819. [Google Scholar] [CrossRef]
- Tang, X.; Whitcomb, J.D.; Li, Y.; Sue, H.J. Micromechanics modeling of moisture diffusion in woven composites. Compos. Sci. Technol. 2005, 65, 817–826. [Google Scholar] [CrossRef]
- Almudaihesh, F.; Holford, K.; Pullin, R.; Eaton, M. The influence of water absorption on unidirectional and 2D woven CFRP composites and their mechanical performance. Compos. Part Eng. 2020, 182, 107626. [Google Scholar] [CrossRef]
- Wan, Y.; Wang, Y.; Huang, Y.; He, B.; Han, K. Hygrothermal aging behaviour of VARTMed three-dimensional braided carbon-epoxy composites under external stresses. Compos. Part Appl. Sci. Manuf. 2005, 36, 1102–1109. [Google Scholar] [CrossRef]
- Gollins, K.; Chiu, J.; Delale, F.; Liaw, B.; Gursel, A. Comparison of Manufacturing Techniques Subject to High Speed Impact. In Proceedings of the ASME International Mechanical Engineering Congress and Exposition, Montreal, QC, Canada, 14–20 November 2014; Volume 46583, p. V009T12A019. [Google Scholar]
- Bhatt, A.T.; Gohil, P.P.; Chaudhary, V. Primary manufacturing processes for fiber reinforced composites: History, development & future research trends. In Proceedings of the IOP Conference Series: Materials Science and Engineering; IOP Publishing: Bristol, UK, 2018; Volume 330, p. 012107. [Google Scholar]
- Park, S.Y.; Choi, C.H.; Choi, W.J.; Hwang, S.S. A Comparison of the Properties of Carbon Fiber Epoxy Composites Produced by Non-autoclave with Vacuum Bag Only Prepreg and Autoclave Process. Appl. Compos. Mater. 2019, 26, 187–204. [Google Scholar] [CrossRef]
- Wolter, N.; Beber, V.C.; Yokan, C.M.; Storz, C.; Mayer, B.; Koschek, K. The effects of manufacturing processes on the physical and mechanical properties of basalt fibre reinforced polybenzoxazine. Compos. Commun. 2021, 24, 100646. [Google Scholar] [CrossRef]
- Hopfenberg, H.; Stannett, V. The diffusion and sorption of gases and vapours in glassy polymers. In The Physics of Glassy Polymers; Springer: Berlin/Heidelberg, Germany, 1973; pp. 504–547. [Google Scholar]
- Barrer, R.M.; Barrie, J.A.; Slater, J. Sorption and diffusion in ethyl cellulose. Part III. Comparison between ethyl cellulose and rubber. J. Polym. Sci. 1958, 27, 177–197. [Google Scholar] [CrossRef]
- Flory, P.J. Principles of Polymer Chemistry; Cornell University Press: Cornell, UK, 1953. [Google Scholar]
- Fick, A. Über diffusion. Ann. Phys. Hig. Poggendroff 1855, 170, 59–86. [Google Scholar] [CrossRef]
- Obeid, H. Durabilité de Composites à Matrice Thermoplastique Sous Chargement hygromécanique: Etude Multi-Physique et Multiéchelle des Relations Microstructure-Propriétés—états Mécaniques. Ph.D. Thesis, Université Bretagne-Loire, Institut de Recherche en Génie Civil et Mécanique (GeM), Nantes, France, 2016. [Google Scholar]
- Loos, A.C.; Springer, G.S. Moisture Absorption of Graphite-Epoxy Composites Immersed in Liquids and in Humid Air. J. Compos. Mater. 1979, 13, 131–147. [Google Scholar] [CrossRef]
- Zeng, W.; Du, Y.; Xue, Y.; Frisch, H.L. Solubility parameters. In Physical Properties of Polymers Handbook, 2nd ed.; Mark, J.E., Ed.; Springer: New York, NY, USA, 2006; pp. 289–305. [Google Scholar]
- Charlas, M. Étude et Durabilité de Solutions de Packaging Polymère de Module d’Electronique de Puissance à Application Aéronautique. Ph.D. Thesis, Université de Pau et des Pays de l’Adour, Institut des Sciences Analytiques et de Physico-Chimie pour l’Environnement et les Matériaux, Pau, France, 2009. [Google Scholar]
- Hansen, C.M. Hansen Solubility Parameters: A User’s Handbook, 2nd ed.; CRC Press: Boca Raton, FL, USA, 2007. [Google Scholar]
- Jolliffe, I.T. Principal Component Analysis; Springer: New York, NY, USA, 1986. [Google Scholar]
- Meglen, R.R. Examining large databases: A chemometric approach using principal component analysis. J. Chemom. 1991, 5, 163–179. [Google Scholar] [CrossRef]
- Jolliffe, I.T.; Cadima, J. Principal component analysis: A review and recent developments. Philos. Trans. R. Soc. Math. Phys. Eng. Sci. 2016, 374, 1–16. [Google Scholar] [CrossRef] [PubMed]
- Villar Montoya, M. Procédé de Soudage Laser de Polymères Haute Performance: Etablissement des Relations entre les Paramètres du Procédé, la Structure et la Morphologie du Polymère et les Propriétés Mécaniques de l’Assemblage. Ph.D. Thesis, Institut National Polytechnique de Toulouse, Laboratoire Génie de Production (INP-ENIT), Paris, France, 2018. [Google Scholar]
- Husson, F.; Lê, S.; Pagès, J. Exploratory Multivariate Analysis by Example Using R. Computer Science & Data Analysis; Chapman Hall/CRC Press: Boca Raton, FL, USA, 2011. [Google Scholar]
- Lê, S.; Josse, J.; Husson, F. FactoMineR: An R Package for Multivariate Analysis. J. Stat. Softw. 2008, 25, 1–18. [Google Scholar] [CrossRef] [Green Version]
- Dunteman, G.H. Principal Components Analysis; Sage Publications: Thousand Oaks, CA, USA, 1989; p. 69. [Google Scholar]
- Kassambara, A. Practical Guide To Principal Component Methods in R; Vol. Multivariate Analysis II, Statistical Tools for High-throughput Data Analysis (STHDA); Sage Publications: Thousand Oaks, CA, USA, 2017. [Google Scholar]
- Peres-Neto, P.R.; Jackson, D.A.; Somers, K.M. How many principal components? Stopping rules for determining the number of non-trivial axes revisited. Comput. Stat. Data Anal. 2005, 49, 974–997. [Google Scholar] [CrossRef]
- Simar, A.; Gigliotti, M.; Grandidier, J.C.; Ammar-Khodja, I. Decoupling of water and oxygen diffusion phenomena in order to prove the occurrence of thermo-oxidation during hygrothermal aging of thermosetting resins for RTM composite applications. J. Mater. Sci. 2018, 53, 11855–11872. [Google Scholar] [CrossRef]
- Farrar, N.R.; Ashbee, K.H.G. Destruction of epoxy resins and of glass-fibre-reinforced epoxy resins by diffused water. J. Phys. Appl. Phys. 1978, 11, 1009–1015. [Google Scholar] [CrossRef]
- Fedors, R.F. Osmotic effects in water absorption by polymers. Polymer 1980, 21, 207–212. [Google Scholar] [CrossRef]
- Gautier, L.; Mortaigne, B.; Bellenger, V.; Verdu, J. Osmotic cracking nucleation in hydrothermal-aged polyester matrix. Polymer 2000, 41, 2481–2490. [Google Scholar] [CrossRef]
- Colin, X.; Verdu, J.; Rabaud, B. Stabilizer Thickness Profiles in Polyethylene Pipes Transporting Drinking Water Disinfected by Bleach. Polym. Eng. Sci. 2011, 51, 1539–1549. [Google Scholar] [CrossRef]
- Moisan, J.Y. Diffusion des additifs du polyéthylène I: Influence de la nature du diffusant. Eur. Polym. J. 1980, 16, 979–987. [Google Scholar] [CrossRef]
- Abdessalem, A.; Tamboura, S.; Fitoussi, J.; Ben Daly, H.; Tcharkhtchi, A. Bi-phasic water diffusion in sheet molding compound composite. J. Appl. Polym. Sci. 2020, 137, 1–12. [Google Scholar] [CrossRef]
- Berthé, V.; Ferry, L.; Bénézet, J.; Bergeret, A. Ageing of different biodegradable polyesters blends mechanical and hygrothermal behavior. Polym. Degrad. Stab. 2010, 95, 262–269. [Google Scholar] [CrossRef]
- Gillet, C.; Nassiet, V.; Poncin-Epaillard, F.; Hassoune-Rhabbour, B.; Tchalla, T. Chemical behaviour of water absorption in a carbon/epoxy 3D woven composite. In Macromolecular Symposia, Proceedings of the10th International Conference on Times of Polymers and Composites, Ischia, Italy, 30 April 2022; Wiley Online Library: Hoboken, NJ, USA, 2022. [Google Scholar]
- Gillet, C.; Hassoune-Rhabbour, B.; Poncin-Epaillard, F.; Tchalla, T.; Nassiet, V. Contributions of atmospheric plasma treatment on a hygrothermal aged carbon/epoxy 3D woven composite material. Polym. Degrad. Stab. 2022, 202, 110023. [Google Scholar] [CrossRef]
- Guloglu, G.E.; Hamidi, Y.K.; Altan, M.C. Fast recovery of non-fickian moisture absorption parameters for polymers and polymer composites. Polym. Eng. Sci. 2017, 57, 921–931. [Google Scholar] [CrossRef]
- Cocaud, J.; Célino, A.; Fréour, S.; Jacquemin, F. What about the relevance of the diffusion parameters identified in the case of incomplete Fickian and non-Fickian kinetics? J. Compos. Mater. 2019, 53, 1555–1565. [Google Scholar] [CrossRef]


| Material Parameters | Ageing Parameters | Diffusion Parameters | |
|---|---|---|---|
| Qualitative | Prepolymer type | Conditioning | Diffusion behaviour |
| Hardener type | |||
| Reinforcement type | |||
| Fibre architecture | |||
| Process | |||
| Quantitative | D | ||
| h | |||
| Name (Individuals Number) | (s/mm ) | D (mm/s ) | |
|---|---|---|---|
| DGEBA based (217) | 1.61 | 0.80 | 5.23 |
| DGEBA + mTGAP (3) | 4.44 | 0.16 | 106 |
| DGEBA + novolac (3) | 6.37 | 22.30 | 0.50 |
| DGEBA + TGDDM (2) | 4.31 | 4.96 | 13.00 |
| DGEBD (5) | 6.15 | 0.02 | 17.40 |
| DGEBF based (15) | 1.05 | 7.02 | 3.49 |
| ESO (11) | 1.75 | 0.18 | 4.67 |
| mTGAP (7) | 5.35 | 0.16 | 56.61 |
| Novolac (11) | 2.26 | 0.36 | 15.50 |
| Rubber-modified epoxy (2) | 3.08 | 8.02 | 0.47 |
| TCDAM (1) | 3.84 | 8.02 | 0.47 |
| TGDDM (80) | 1.50 | 2.26 | 4.36 |
| TGDDM + mTGAP (14) | 2.02 | 1.71 | 6.62 |
| Unknown epoxy (89) | 2.64 | 1.69 | 9.07 |
| Name (Individuals Number) | (s/mm ) | D (mm/s ) | |
|---|---|---|---|
| Aliphatic amine (51) | 2.61 | 1.23 | 8.51 |
| Aromatic amine (139) | 2.63 | 1.62 | 5.79 |
| Cycloaliphatic amine (14) | 1.81 | 4.32 | 3.15 |
| Amidoamine (16) | 1.47 | 0.44 | 9.18 |
| Dicyandiamide (61) | 1.59 | 5.24 | 3.46 |
| Anhydride acid (42) | 1.01 | 0.87 | 4.42 |
| Phenol Novolac (9) | 2.10 | 0.36 | 5.56 |
| Unknown amine (71) | 0.79 | 0.28 | 7.33 |
| Unknown hardener (57) | 3.20 | 2.92 | 8.57 |
| Name (Individuals Number) | (s/mm ) | D (mm/s ) | |
|---|---|---|---|
| Aramid (30) | 3.54 | 1.16 | 6.90 |
| Carbon (127) | 1.39 | 1.53 | 3.64 |
| Flax (7) | 9.82 | 0.60 | 14.20 |
| Glass (88) | 0.80 | 0.69 | 3.63 |
| Hemp (6) | 13.0 | 4.14 | 9.18 |
| Hybrid carbon aramid (1) | 1.62 | 1.30 | 3.52 |
| Hybrid carbon glass (7) | 3.33 | 0.04 | 25.92 |
| Regenerated cellulose (2) | 7.10 | 6.98 | 13.91 |
| None (192) | 2.87 | 1.59 | 6.54 |
| Name (Individuals Number) | (s/mm ) | D (mm/s ) | |
|---|---|---|---|
| UD (93) | 1.50 | 1.73 | 3.49 |
| 2D (94) | 0.95 | 1.51 | 3.99 |
| Balanced (47) | 1.80 | 0.12 | 8.68 |
| 3D (5) | 0.99 | 1.30 | 6.25 |
| Long Fibre mat (4) | 17.87 | 1.88 | 9.05 |
| Unknown (2) | 2.64 | 3.21 | 4.69 |
| Name (Individuals Number) | (s/mm ) | D (mm/s ) | |
|---|---|---|---|
| Autoclave (98) | 1.52 | 6.36 | 3.48 |
| Contact moulding (9) | 3.41 | 2.07 | 36.60 |
| Filament winding (2) | 2.28 | 66.20 | 5.52 |
| Heating table (9) | 3.33 | 0.03 | 21.9 |
| Infusion (28) | 1.81 | 1.48 | 8.65 |
| Moulding (195) | 2.81 | 1.13 | 7.00 |
| Pultrusion (1) | 2.80 | 17.5 | 53.5 |
| RTM (31) | 0.89 | 0.89 | 7.90 |
| Thermopressing (24) | 2.70 | 2.86 | 9.48 |
| Unknown (63) | 0.94 | 0.32 | 1.71 |
| Name (Individuals Number) | (s/mm ) | D (mm/s ) | |
|---|---|---|---|
| Humid air (215) | 1.08 | 0.57 | 5.90 |
| Inert atmosphere (2) | 2.03 | 3.88 | 24.4 |
| Deionised water (20) | 3.09 | 0.89 | 0.95 |
| Distilled water (203) | 3.12 | 1.99 | 5.79 |
| Sea water (20) | 1.43 | 2.77 | 3.50 |
| Material Parameters | Ageing Parameters | Diffusion Parameters |
|---|---|---|
| Prepolymer type | Conditioning | D |
| Hardener type | ||
| Reinforcement type | ||
| h | ||
| Process | ||
| Dimension | Eigenvalue | Variance | Cumulative Variance |
|---|---|---|---|
| Dim 1 | 2.18 | 27.19 | 27.19 |
| Dim 2 | 1.55 | 19.39 | 46.58 |
| Dim 3 | 1.13 | 14.09 | 60.68 |
| Dim 4 | 0.88 | 11.10 | 71.78 |
| Dim 5 | 0.86 | 10.73 | 82.52 |
| Dim 6 | 0.79 | 9.84 | 92.37 |
| Dim 7 | 0.58 | 7.19 | 99.56 |
| Dim 8 | 0.03 | 0.43 | 100.00 |
| All | Resins, Fick | Composites, Fick | Resins, Dual | Composites, Dual | |
|---|---|---|---|---|---|
| Individual number | 448 | 56 | 98 | 147 | 147 |
| Initial variables number | 8 | 6 | 7 | 11 | 12 |
| Individual variance of each initial variable | |||||
| Min. number of PC for an overview | 6 () | 4 () | 4 () | 5 () | 6 () |
| Material Parameters | Ageing Parameters | Diffusion Parameters |
|---|---|---|
| Prepolymer type | Conditioning | D |
| Hardener type | ||
| Reinforcement type | ||
| Architecture | ||
| Fibre orientation | ||
| h | ||
| Process | K |
Publisher’s Note: MDPI stays neutral with regard to jurisdictional claims in published maps and institutional affiliations. |
© 2022 by the authors. Licensee MDPI, Basel, Switzerland. This article is an open access article distributed under the terms and conditions of the Creative Commons Attribution (CC BY) license (https://creativecommons.org/licenses/by/4.0/).
Share and Cite
Gillet, C.; Tamssaouet, F.; Hassoune-Rhabbour, B.; Tchalla, T.; Nassiet, V. Parameters Influencing Moisture Diffusion in Epoxy-Based Materials during Hygrothermal Ageing—A Review by Statistical Analysis. Polymers 2022, 14, 2832. https://doi.org/10.3390/polym14142832
Gillet C, Tamssaouet F, Hassoune-Rhabbour B, Tchalla T, Nassiet V. Parameters Influencing Moisture Diffusion in Epoxy-Based Materials during Hygrothermal Ageing—A Review by Statistical Analysis. Polymers. 2022; 14(14):2832. https://doi.org/10.3390/polym14142832
Chicago/Turabian StyleGillet, Camille, Ferhat Tamssaouet, Bouchra Hassoune-Rhabbour, Tatiana Tchalla, and Valérie Nassiet. 2022. "Parameters Influencing Moisture Diffusion in Epoxy-Based Materials during Hygrothermal Ageing—A Review by Statistical Analysis" Polymers 14, no. 14: 2832. https://doi.org/10.3390/polym14142832
APA StyleGillet, C., Tamssaouet, F., Hassoune-Rhabbour, B., Tchalla, T., & Nassiet, V. (2022). Parameters Influencing Moisture Diffusion in Epoxy-Based Materials during Hygrothermal Ageing—A Review by Statistical Analysis. Polymers, 14(14), 2832. https://doi.org/10.3390/polym14142832