
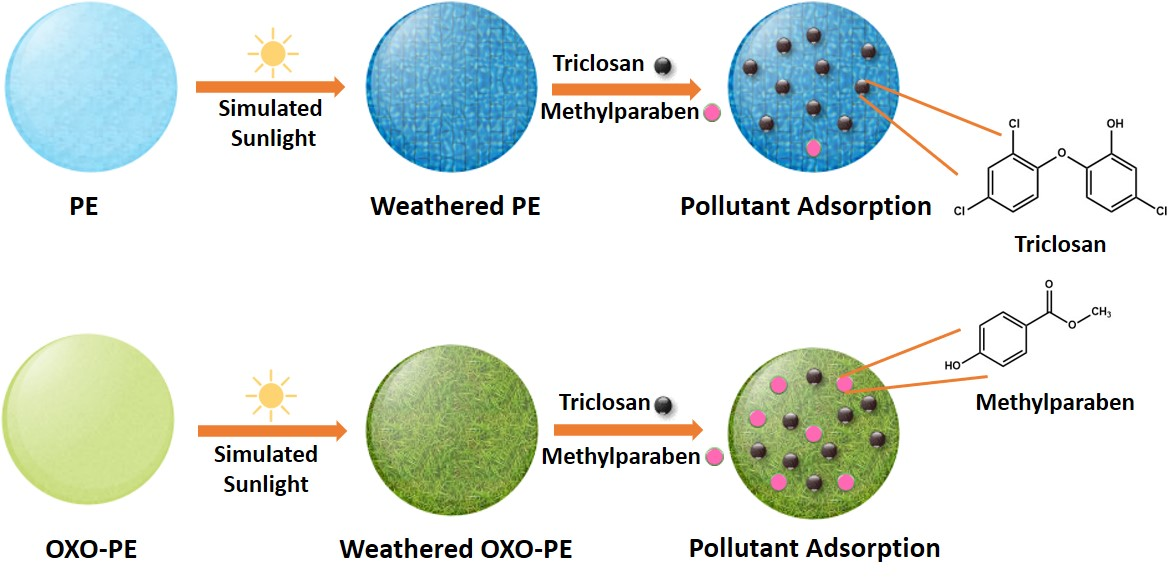
Synergistic Adsorption of Organic Pollutants on Weathered Polyethylene Microplastics


Abstract
:
1. Introduction
2. Materials and Methods
2.1. Chemicals and Materials
2.2. Accelerated Aging
2.3. Degradation Monitoring
2.3.1. FTIR Spectroscopy
2.3.2. CI Determination
2.3.3. Contact Angle Determination
2.4. Thermogravimetric Analysis
2.5. Morphological Analysis
2.6. Pollutant Adsorption on Substrates
2.7. Desorption of Pollutants from Substrates
2.8. Determination of the Concentration of Adsorbed pollutants Using Gas Chromatography with a Flame-Ionization Detector
3. Results and Discussions
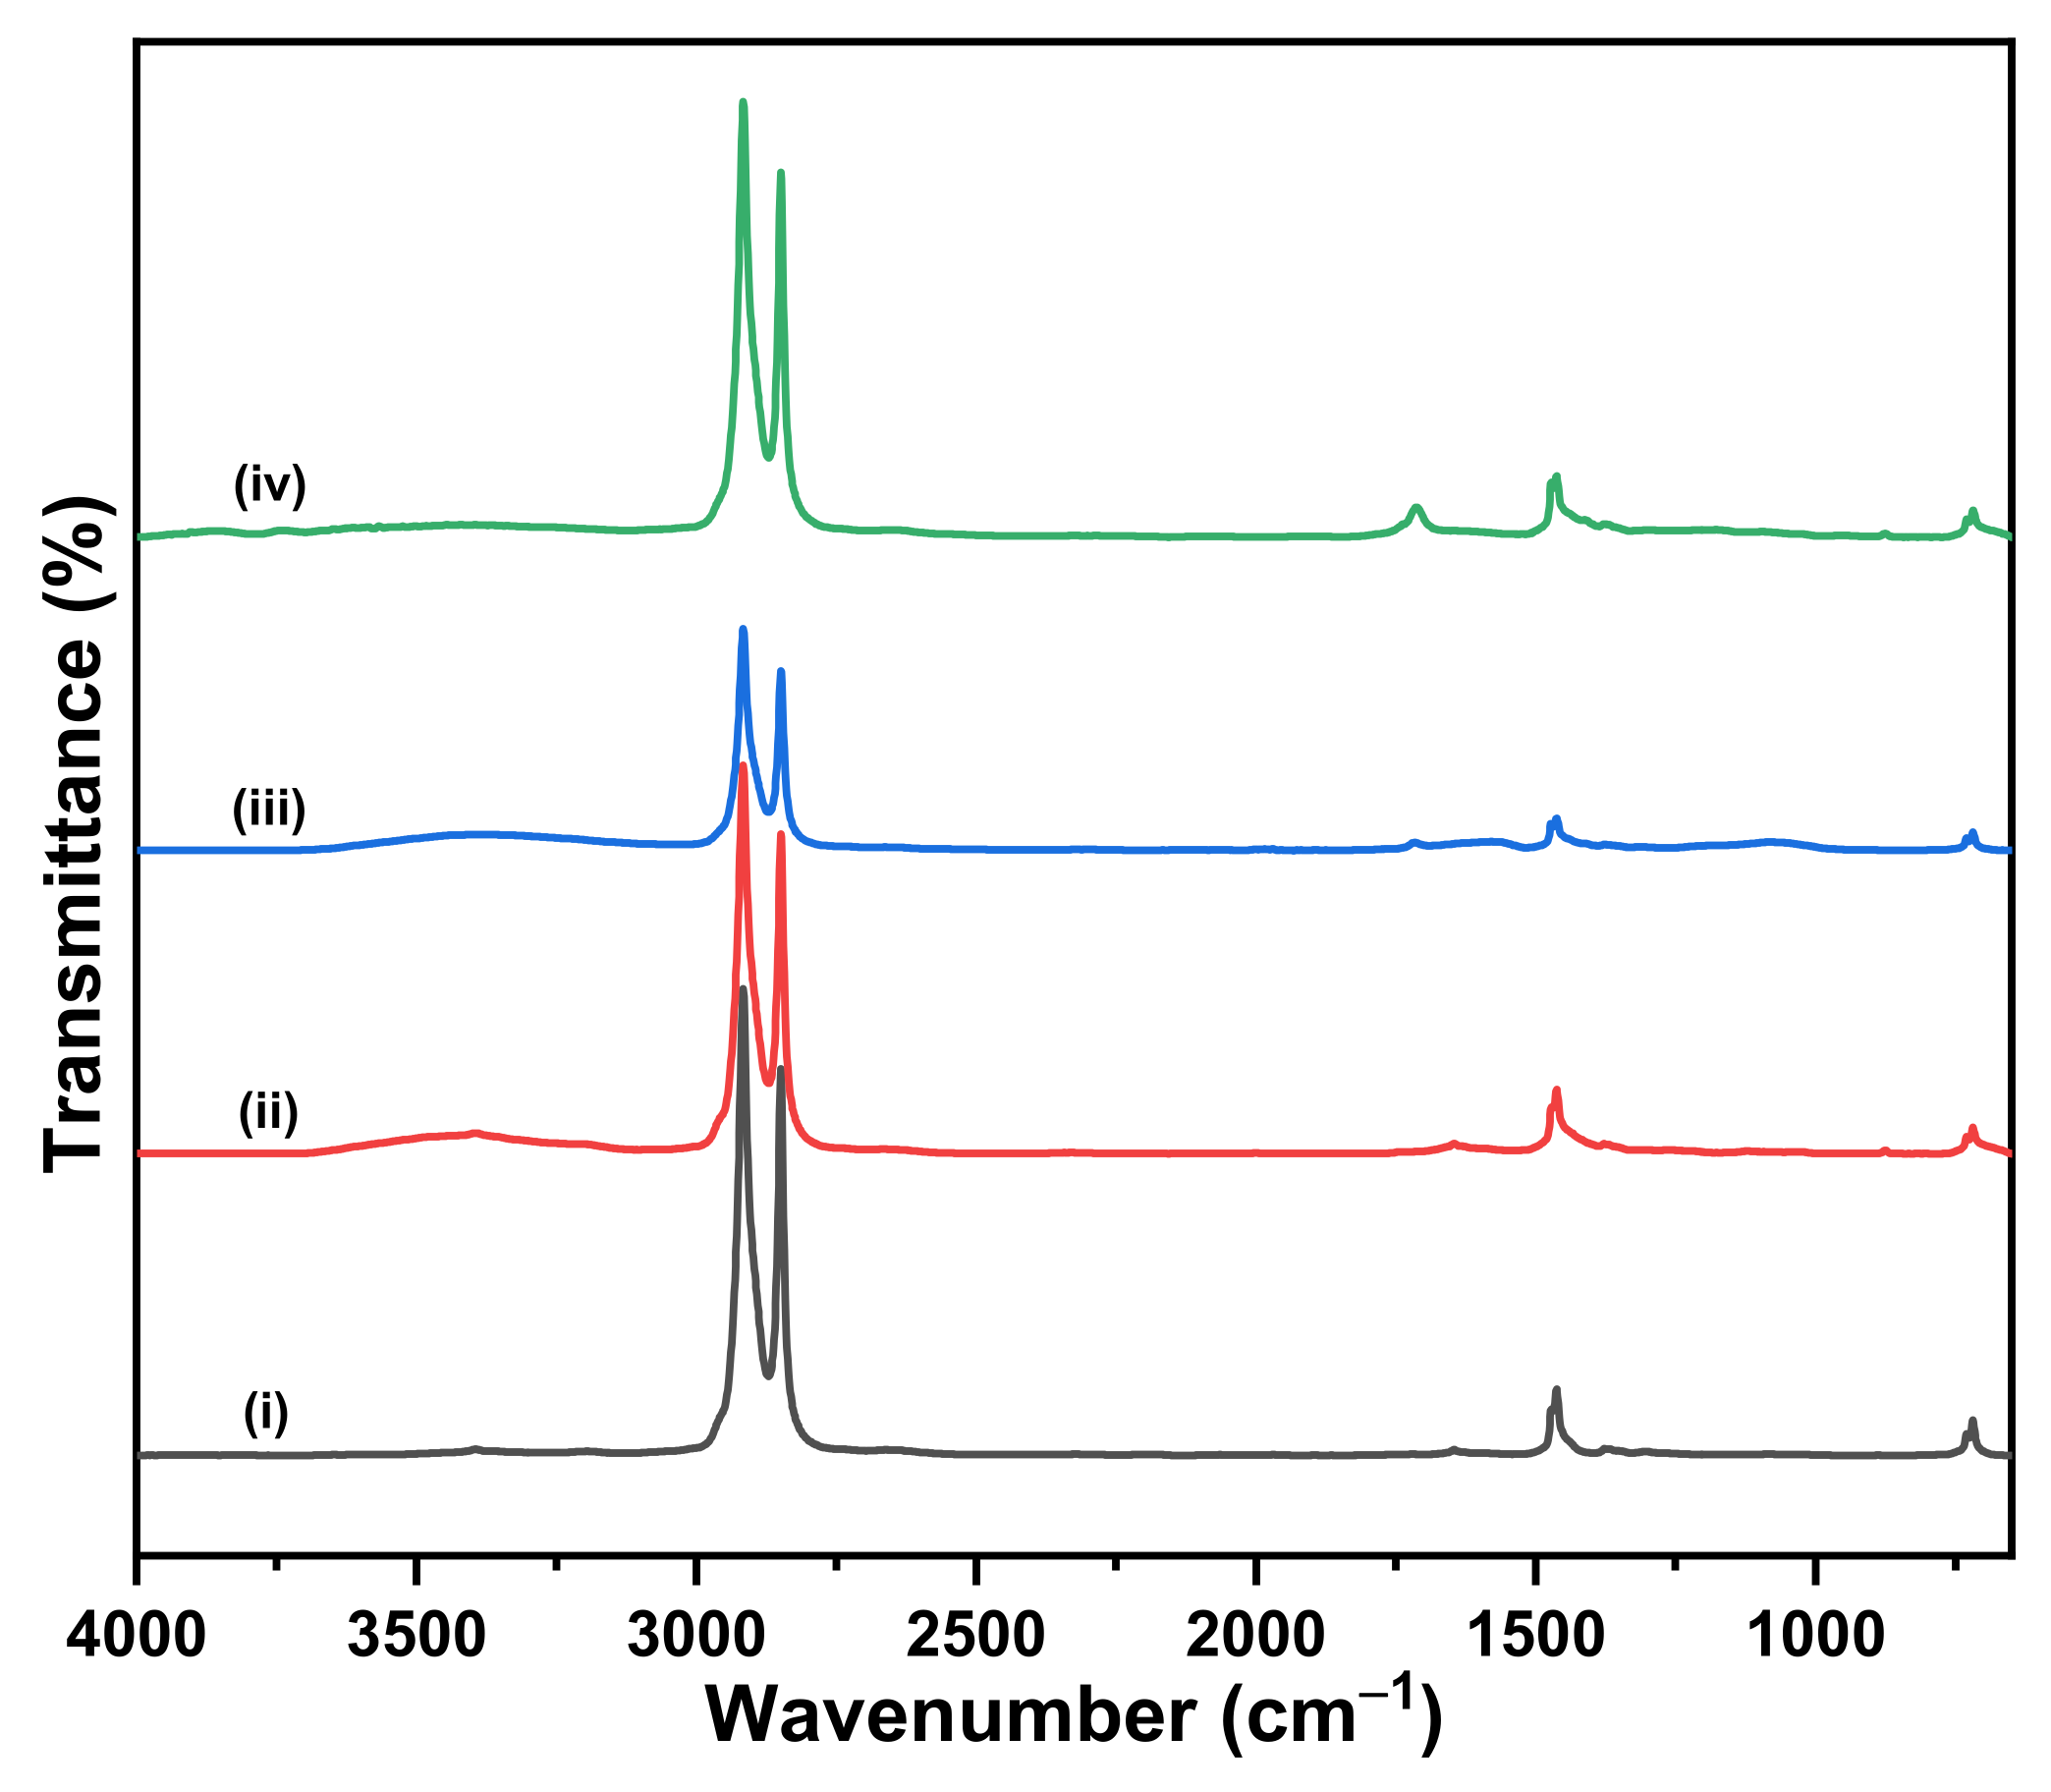
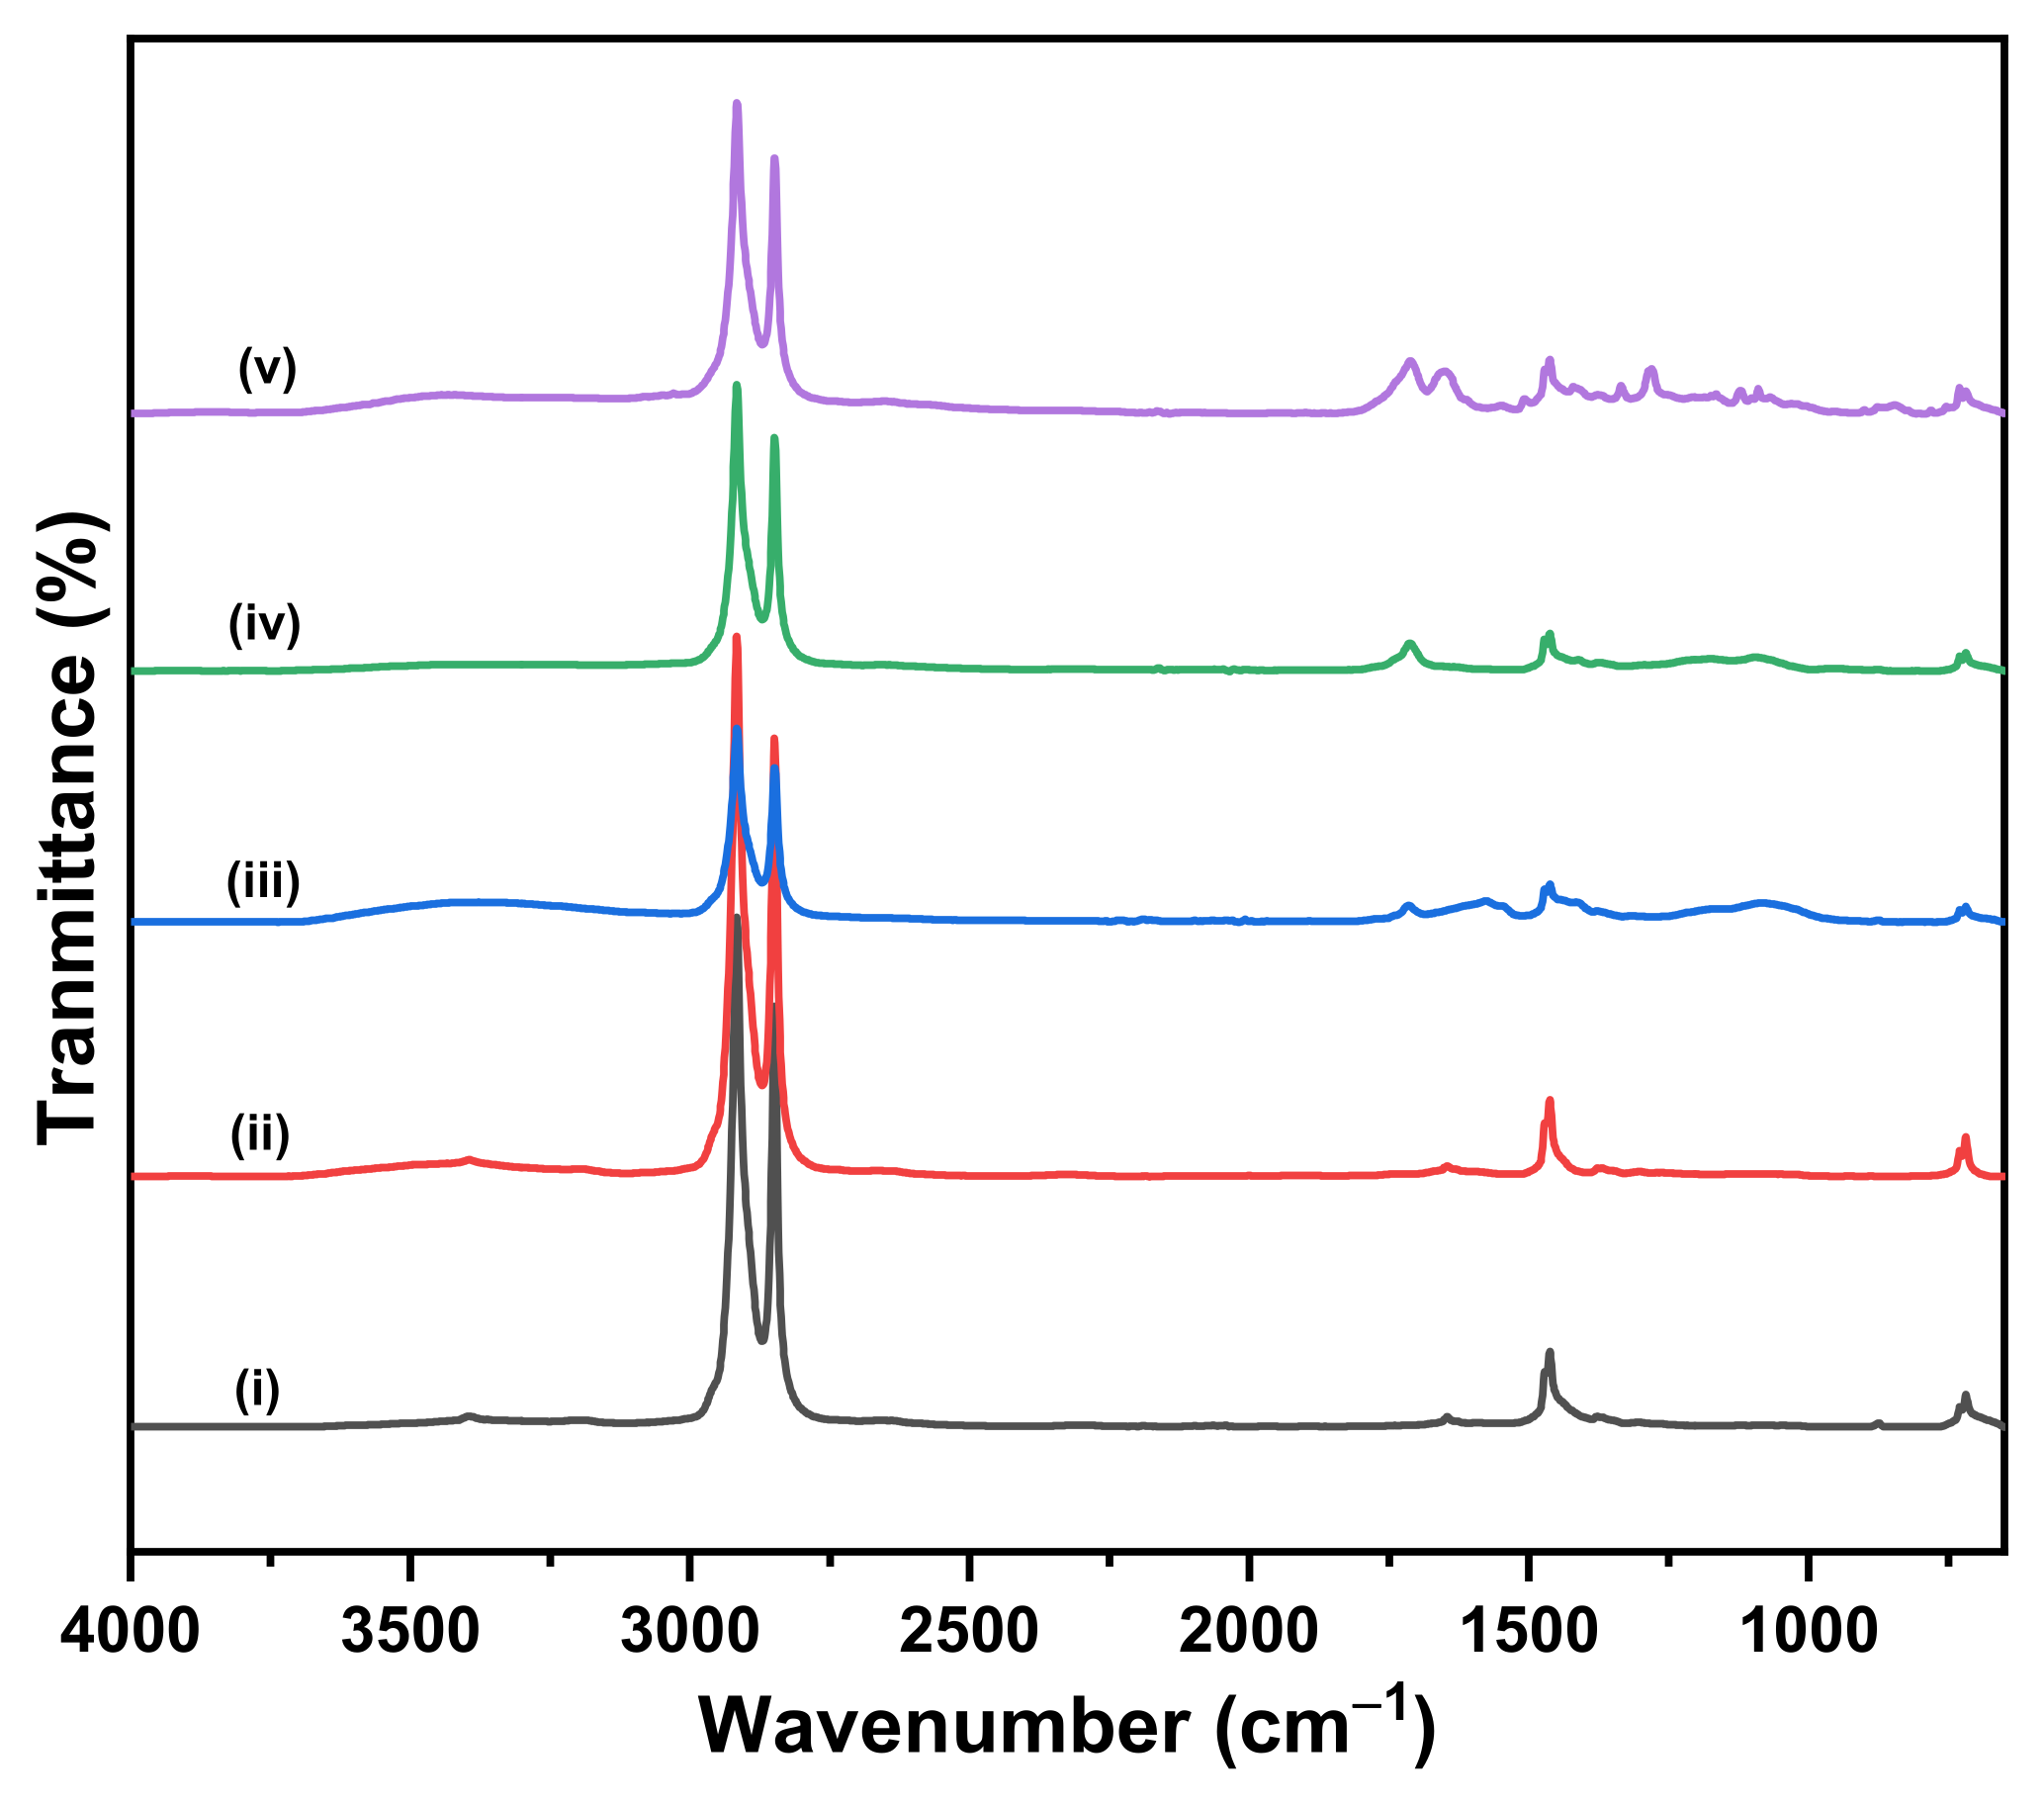
3.1. FTIR Spectroscopy
3.2. Carbonyl Index
3.3. Contact Angle
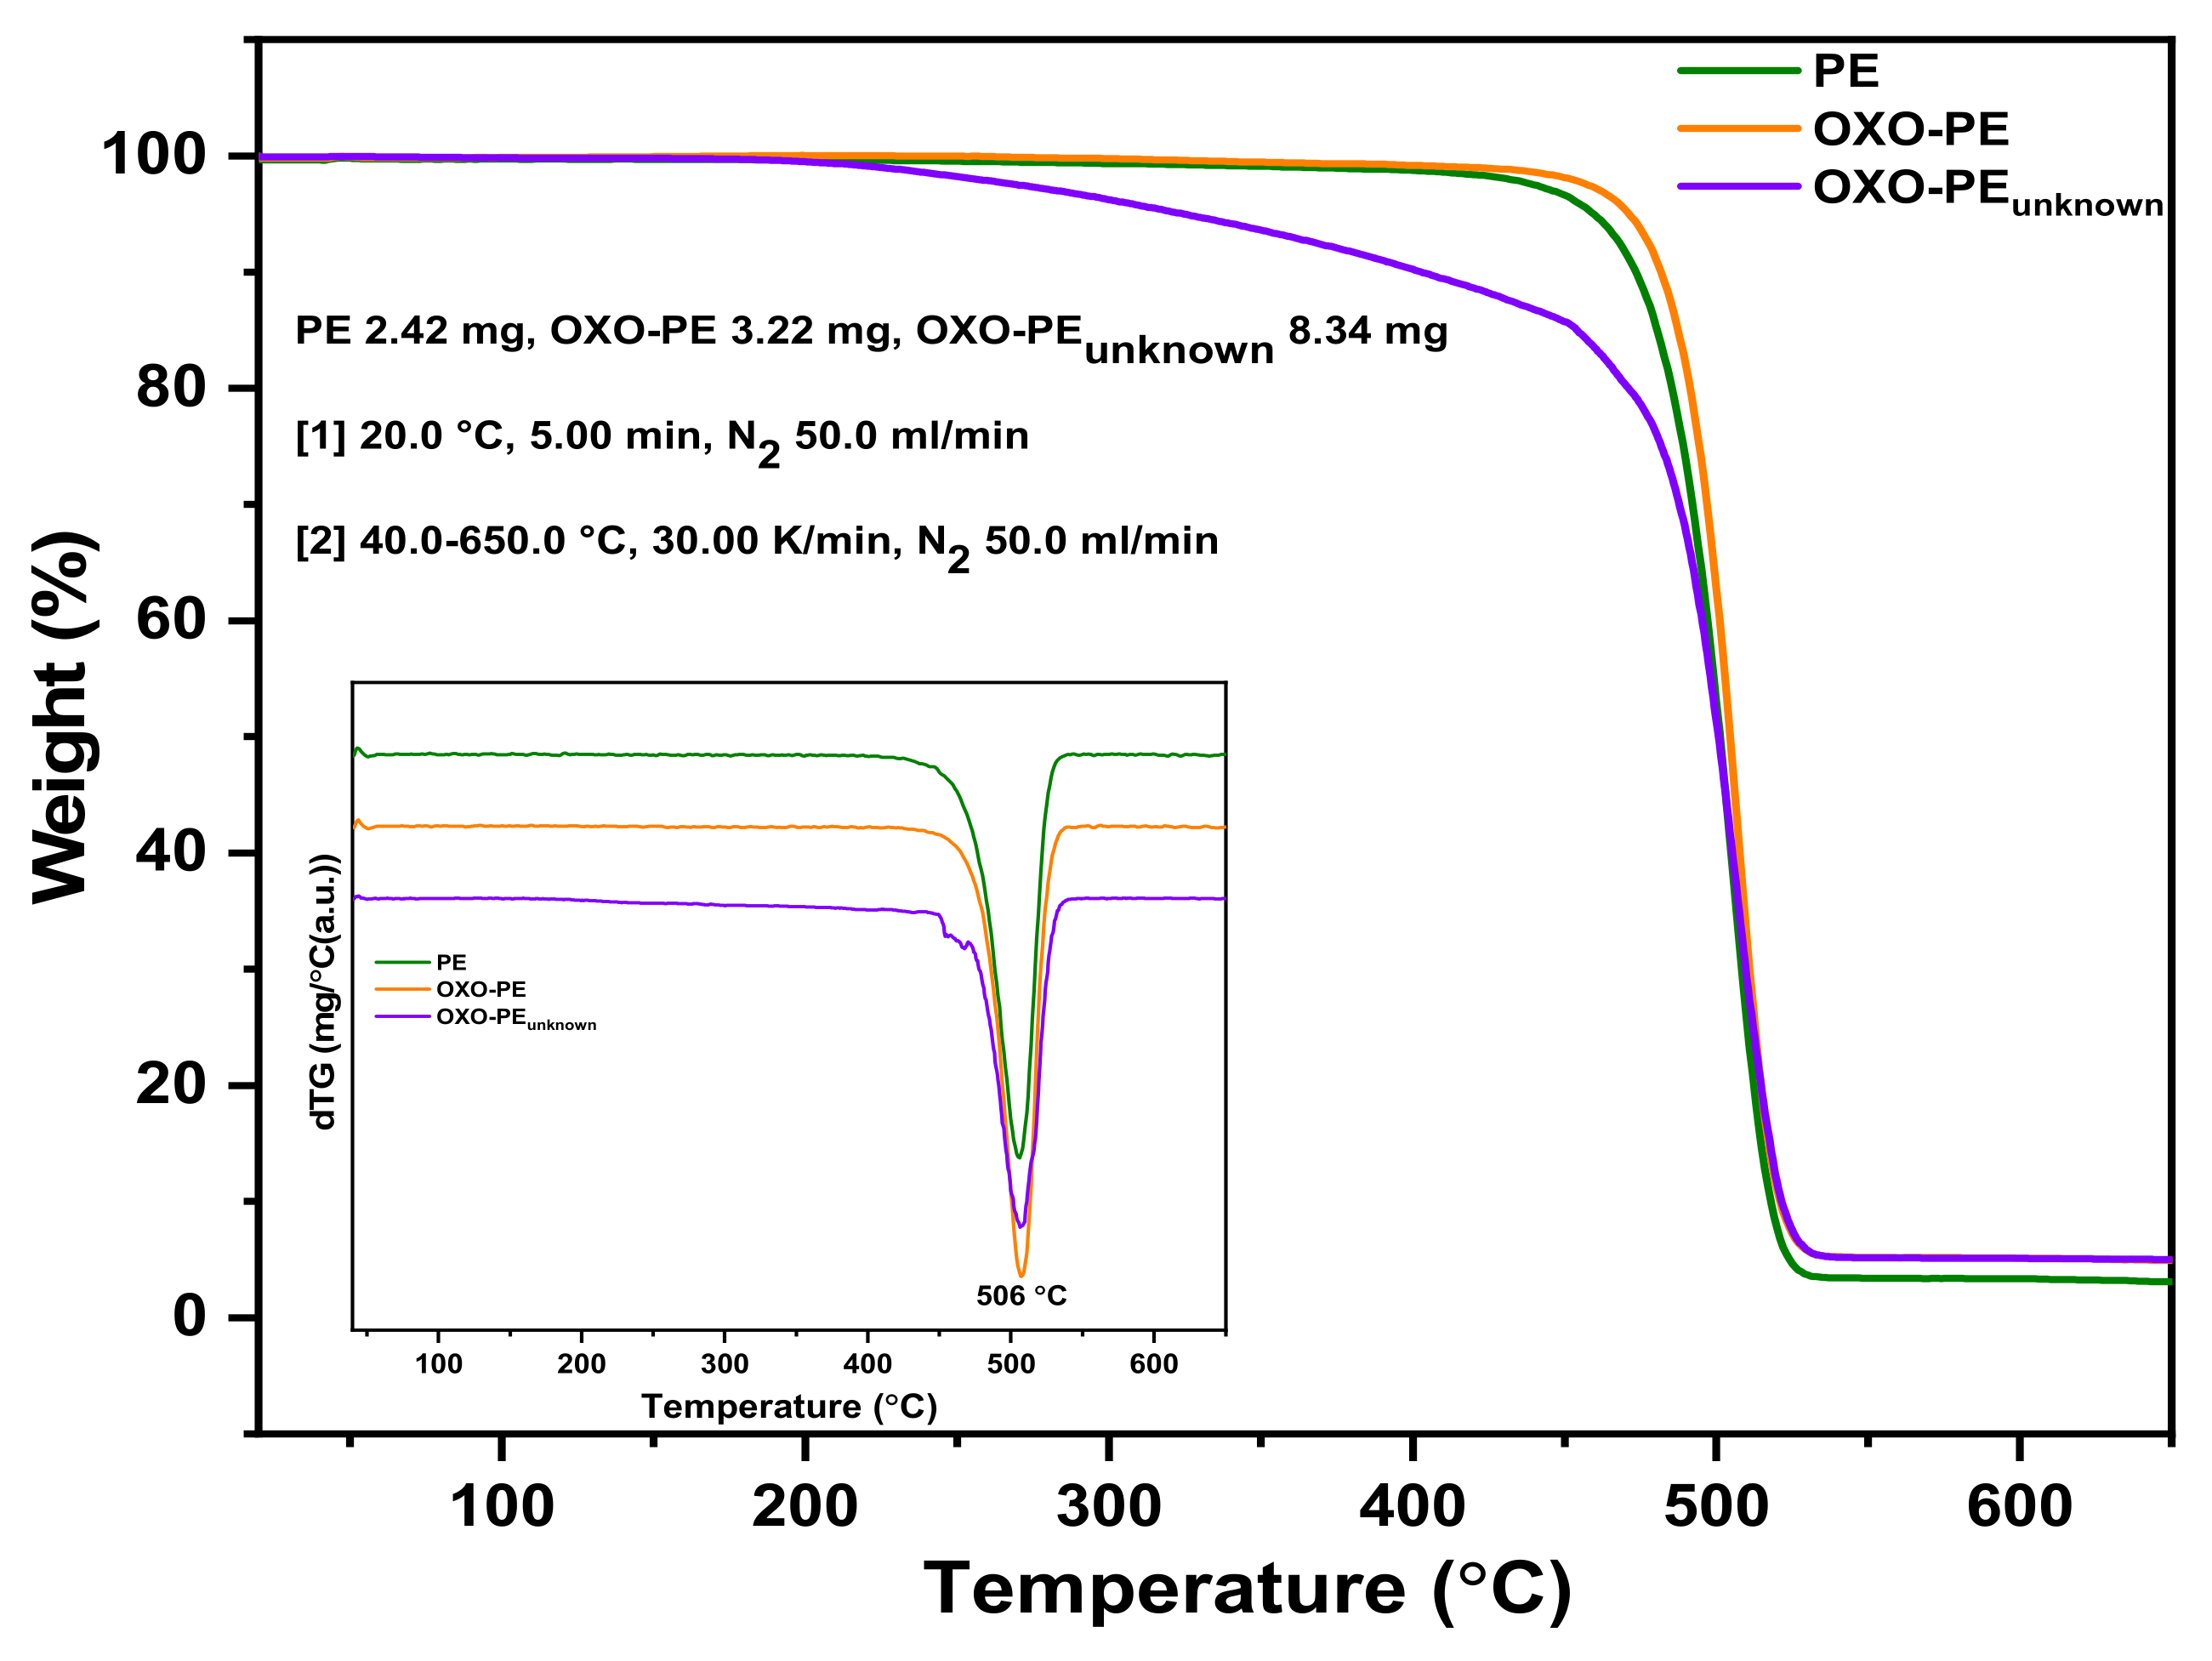
3.4. Thermogravimetric Analysis
3.5. Morphological Analysis
3.6. Determination of the Concentration of Adsorbed Pollutants
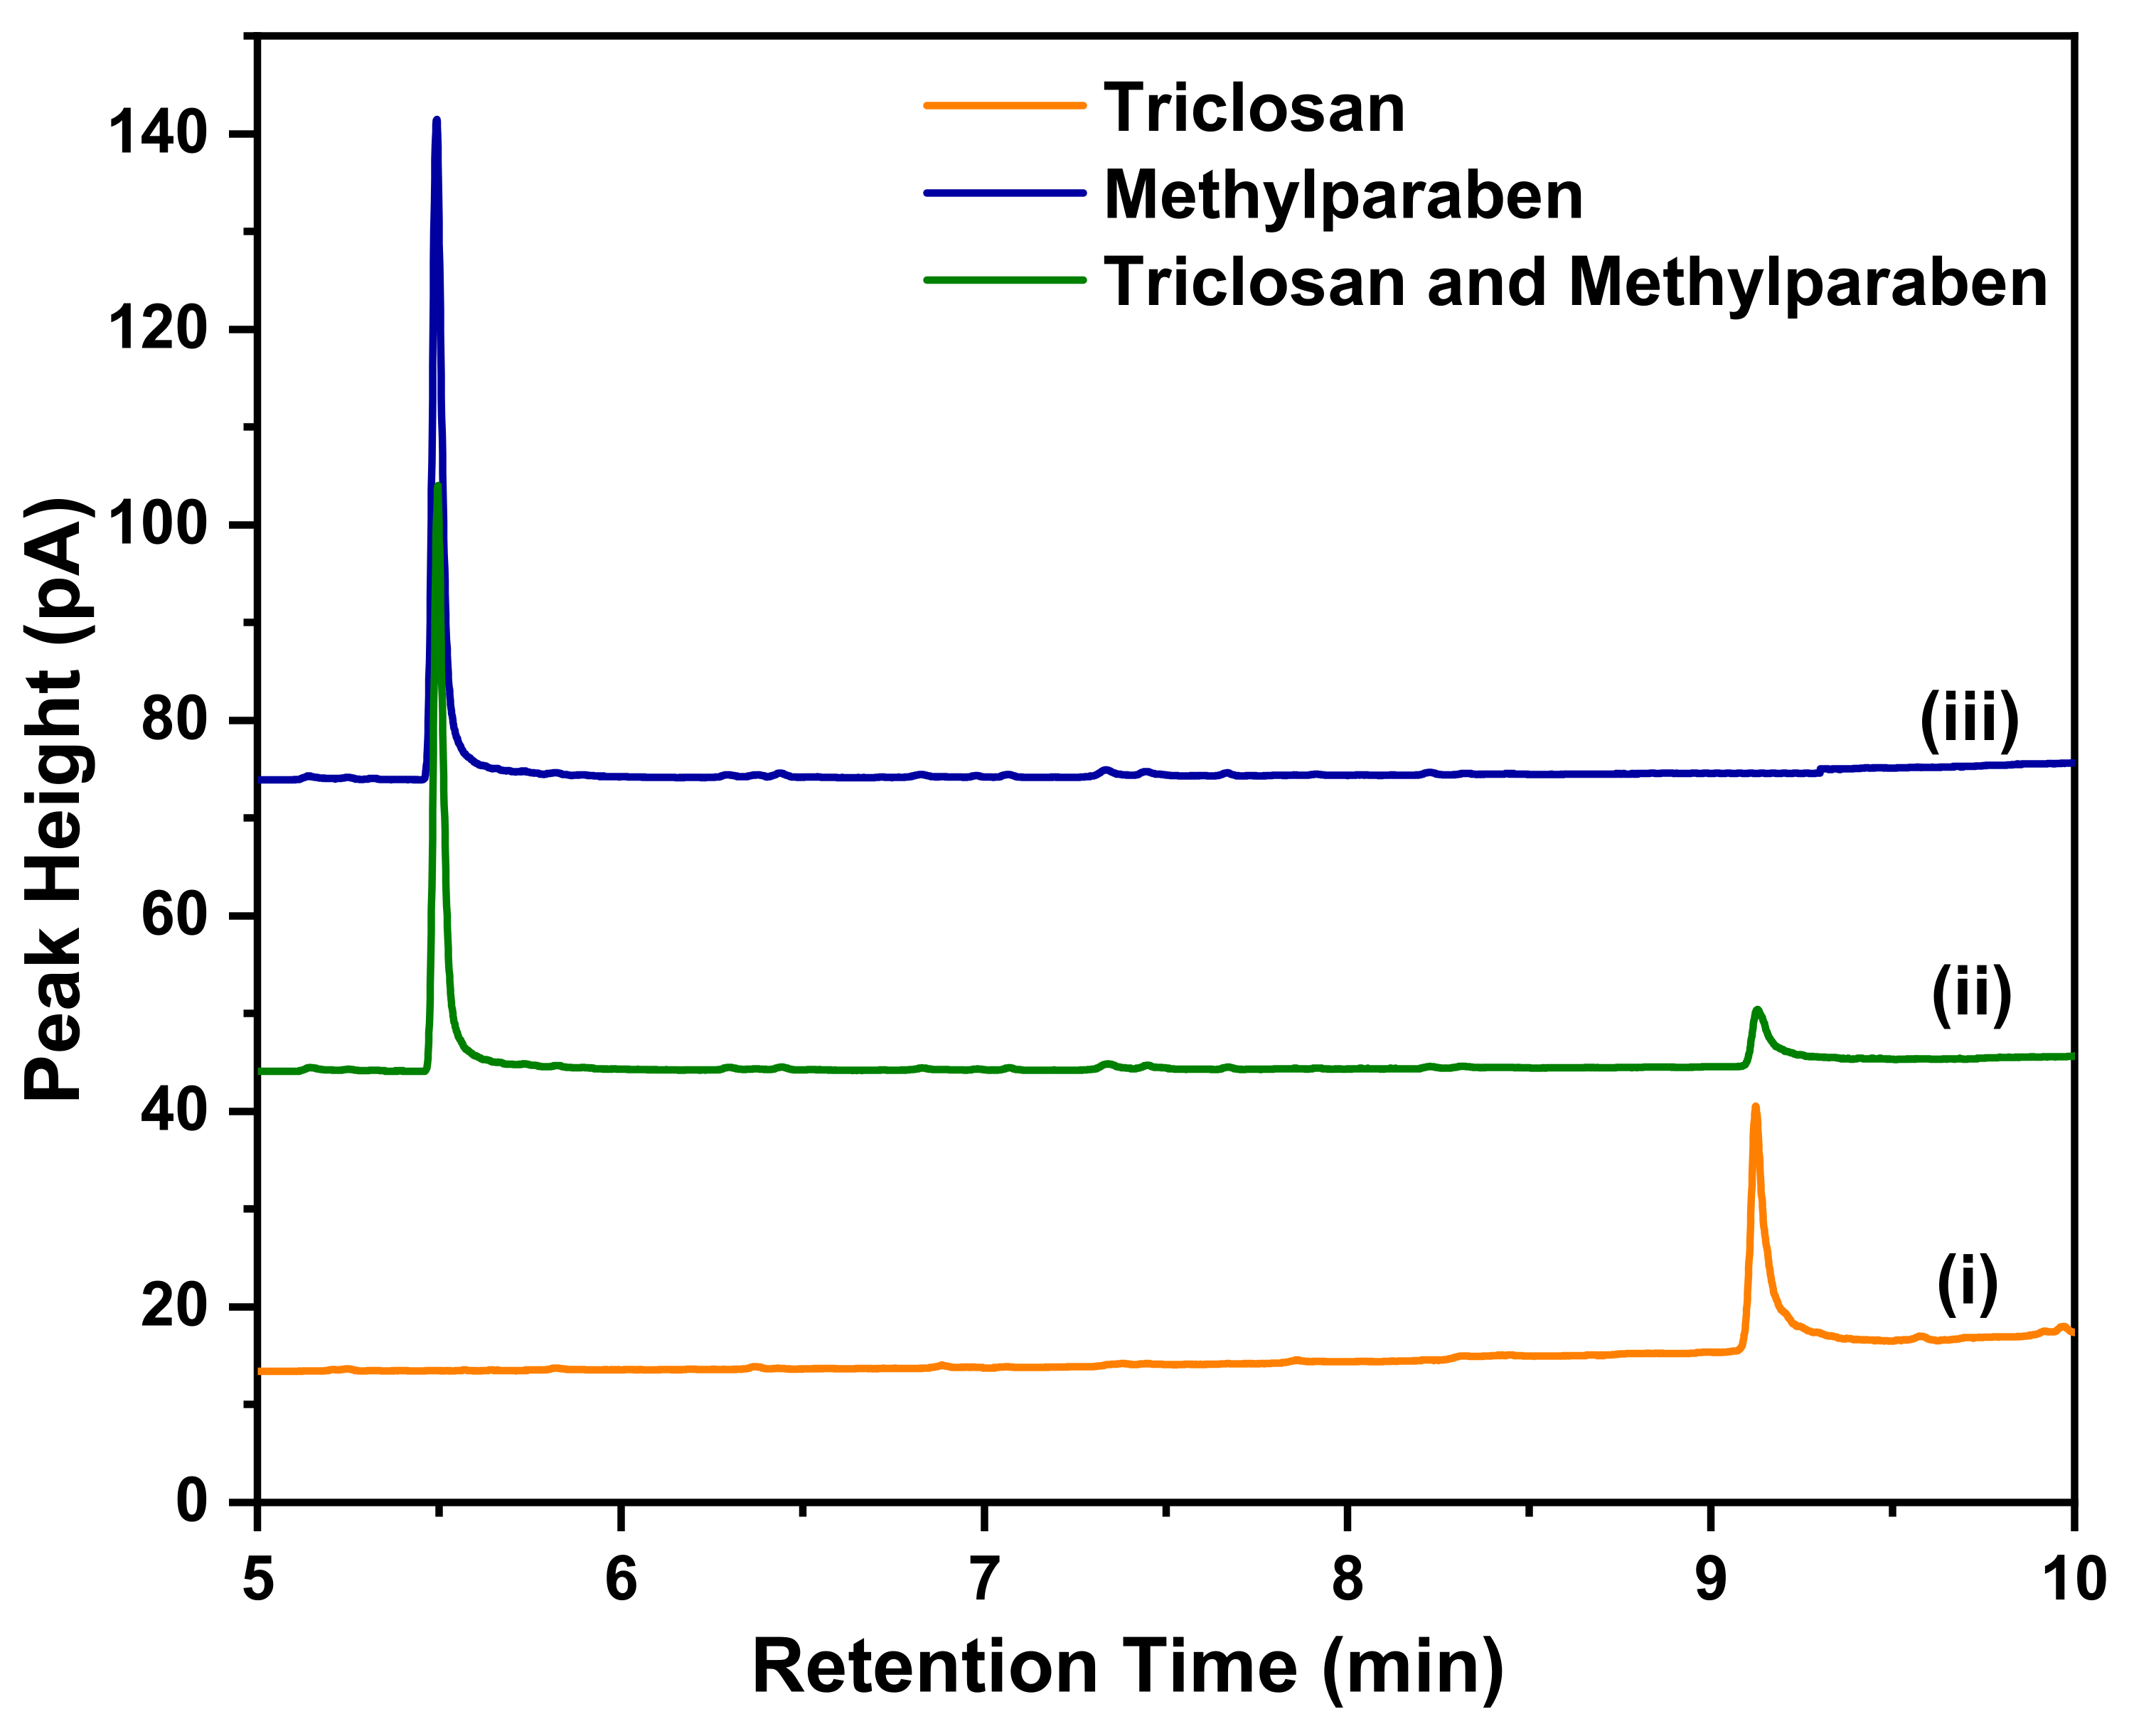
3.6.1. Calibration Curves
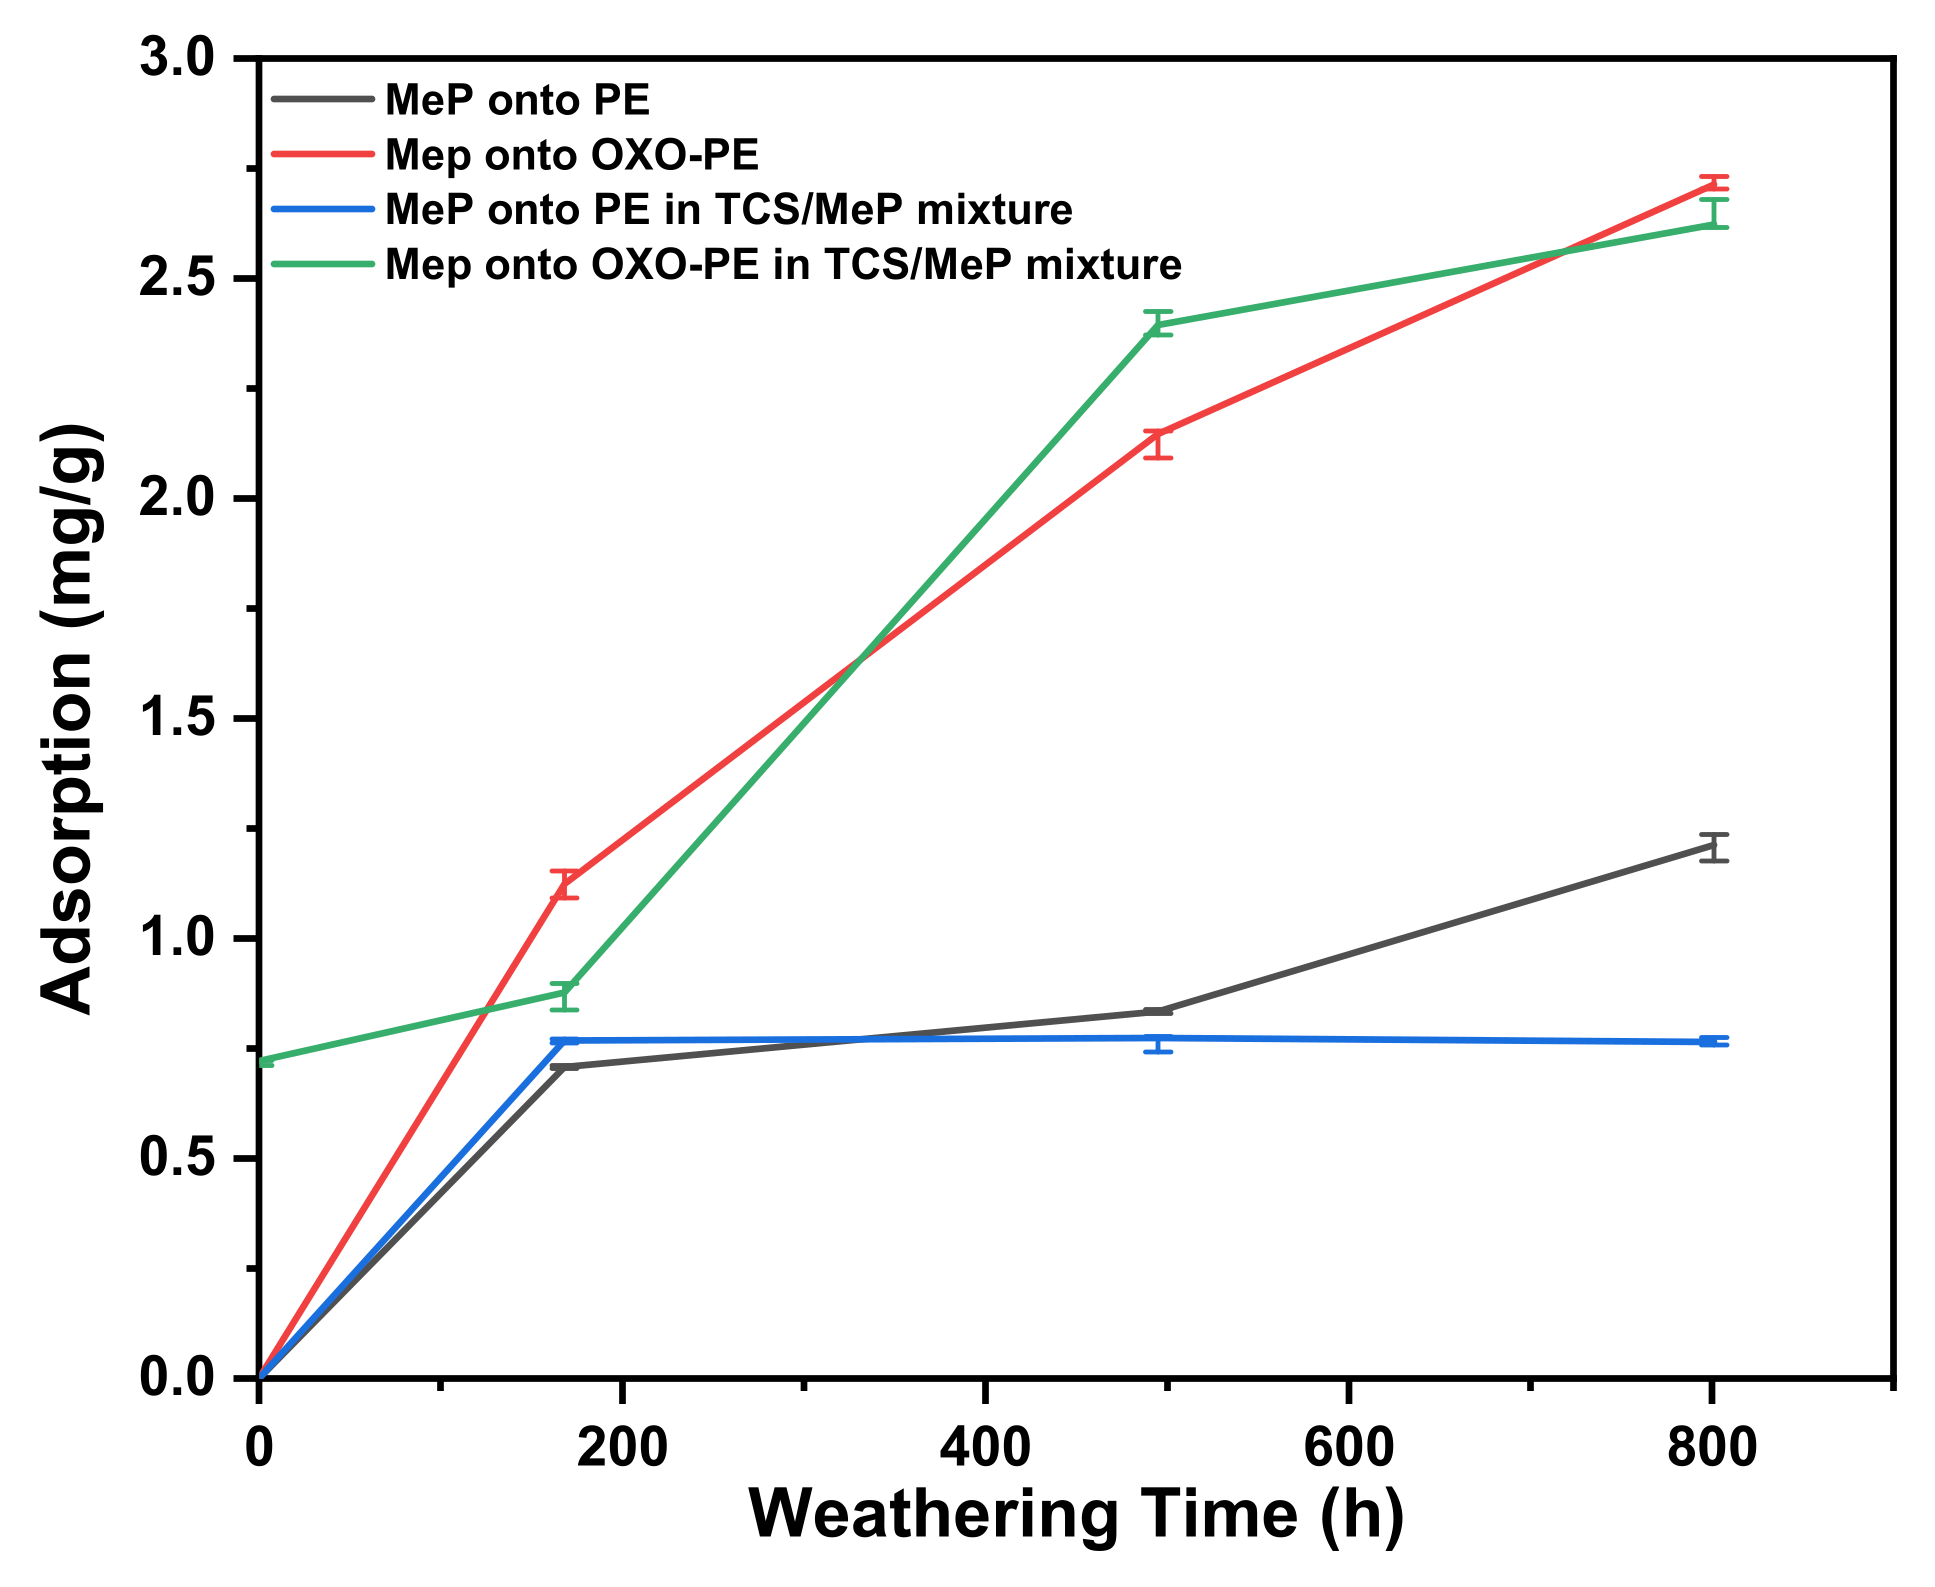
3.6.2. Methylparaben
3.6.3. Triclosan
3.6.4. Adsorbed Pollutants onto OXO-PEunknown
4. Conclusions
Supplementary Materials
Author Contributions
Funding
Institutional Review Board Statement
Informed Consent Statement
Data Availability Statement
Conflicts of Interest
References
- Vázquez-Morillas, A.; Beltrán-Villavicencio, M.; Alvarez-Zeferino, J.C.; Osada-Velázquez, M.H.; Moreno, A.; Martínez, L.; Yañez, J.M. Biodegradation and Ecotoxicity of Polyethylene Films Containing Pro-Oxidant Additive. J. Polym. Environ. 2016, 24, 221–229. [Google Scholar] [CrossRef]
- Andrady, A.L. The Plastic in Microplastics: A Review. Mar. Pollut. Bull. 2017, 119, 12–22. [Google Scholar] [CrossRef] [PubMed]
- Wright, S.L.; Thompson, R.C.; Galloway, T.S. The Physical Impacts of Microplastics on Marine Organisms: A Review. Environ. Pollut. 2013, 178, 483–492. [Google Scholar] [CrossRef] [PubMed]
- Rocha-Santos, T.; Duarte, A.C. A Critical Overview of the Analytical Approaches to the Occurrence, the Fate and the Behavior of Microplastics in the Environment. TrAC—Trends Anal. Chem. 2015, 65, 47–53. [Google Scholar] [CrossRef]
- Fu, L.; Li, J.; Wang, G.; Luan, Y.; Dai, W. Adsorption Behavior of Organic Pollutants on Microplastics. Ecotoxicol. Environ. Saf. 2021, 217, 112207. [Google Scholar] [CrossRef] [PubMed]
- Wagner, M.; Engwall, M.; Hollert, H. Editorial: (Micro) Plastics and the Environment. Environ. Sci. Eur. 2014, 26, 16. [Google Scholar] [CrossRef] [Green Version]
- Bhagat, K.; Barrios, A.C.; Rajwade, K.; Kumar, A.; Oswald, J.; Apul, O.; Perreault, F. Aging of Microplastics Increases Their Adsorption Affinity towards Organic Contaminants. Chemosphere 2022, 298, 134238. [Google Scholar] [CrossRef]
- Thompson, R.C.; Moore, C.J.; Saal, F.S.V.; Swan, S.H. Plastics, the Environment and Human Health: Current Consensus and Future Trends. Philos. Trans. R. Soc. B Biol. Sci. 2009, 364, 2153–2166. [Google Scholar] [CrossRef]
- Stark, M. Letter to the Editor Regarding “Are We Speaking the Same Language? Recommendations for a Definition and Categorization Framework for Plastic Debris”. Environ. Sci. Technol. 2019, 53, 4677. [Google Scholar] [CrossRef] [Green Version]
- Bakir, A.; Rowland, S.J.; Thompson, R.C. Transport of Persistent Organic Pollutants by Microplastics in Estuarine Conditions. Estuar. Coast. Shelf Sci. 2014, 140, 14–21. [Google Scholar] [CrossRef] [Green Version]
- Liu, P.; Zhan, X.; Wu, X.; Li, J.; Wang, H.; Gao, S. Effect of Weathering on Environmental Behavior of Microplastics: Properties, Sorption and Potential Risks. Chemosphere 2020, 242, 125193. [Google Scholar] [CrossRef] [PubMed]
- Singh, B.; Sharma, N. Mechanistic Implications of Plastic Degradation. Polym. Degrad. Stab. 2008, 93, 561–584. [Google Scholar] [CrossRef]
- Pospíšil, J.; Horák, Z.; Kruliš, Z.; Nešpůrek, S.; Kuroda, S.I. Degradation and Aging of Polymer Blends. I. Thermomechanical and Thermal Degradation. Polym. Degrad. Stab. 1999, 65, 405–414. [Google Scholar] [CrossRef]
- Wu, C.; Zhang, K.; Xiong, X. Microplastic Pollution in Inland Waters Focusing on Asia. In Freshwater Microplastics; Springer: Cham, Switzerland, 2018; Volume 58, ISBN 9783319616148. [Google Scholar]
- Gewert, B.; Plassmann, M.M.; Macleod, M. Environmental Science Processes & Impacts Pathways for Degradation of Plastic Polymers Fl Oating in the Marine Environment. Environ. Sci. Process. Impacts 2015, 17, 1513–1521. [Google Scholar] [CrossRef] [PubMed] [Green Version]
- Gardette, M.; Perthue, A.; Gardette, J.L.; Janecska, T.; Földes, E.; Pukánszky, B.; Therias, S. Photo- and Thermal-Oxidation of Polyethylene: Comparison of Mechanisms and Influence of Unsaturation Content. Polym. Degrad. Stab. 2013, 98, 2383–2390. [Google Scholar] [CrossRef] [Green Version]
- Cichy, B.; Kwiecieñ, J.; Pitkowska, M.; Ku, E.; Gibas, E.; Rymarz, G.; Ojeda, T.F.M.; Dalmolin, E.; Forte, M.M.C.; Jacques, R.J.S. PE-OXO Films under UV-B Radiation. J. Spectrosc. 2015, 2015, 965–970. [Google Scholar]
- Karlsson, T.M.; Hassellöv, M.; Jakubowicz, I. Influence of Thermooxidative Degradation on the in Situ Fate of Polyethylene in Temperate Coastal Waters. Mar. Pollut. Bull. 2018, 135, 187–194. [Google Scholar] [CrossRef]
- Nikolić, M.A.L.; Gauthier, E.; Colwell, J.M.; Halley, P.; Bottle, S.E.; Laycock, B.; Truss, R. The Challenges in Lifetime Prediction of Oxodegradable Polyolefin and Biodegradable Polymer Films. Polym. Degrad. Stab. 2017, 145, 102–119. [Google Scholar] [CrossRef] [Green Version]
- Thomas, N.L.; Clarke, J.; McLauchlin, A.R.; Patrick, S.G. Oxo-Degradable Plastics: Degradation, Environmental Impact and Recycling. Proc. Inst. Civ. Eng. Waste Resour. Manag. 2012, 165, 133–140. [Google Scholar] [CrossRef] [Green Version]
- Ammala, A.; Bateman, S.; Dean, K.; Petinakis, E.; Sangwan, P.; Wong, S.; Yuan, Q.; Yu, L.; Patrick, C.; Leong, K.H. An Overview of Degradable and Biodegradable Polyolefins. Prog. Polym. Sci. 2011, 36, 1015–1049. [Google Scholar] [CrossRef]
- Wiles, D.M.; Scott, G. Polyolefins with Controlled Environmental Degradability. Polym. Degrad. Stab. 2006, 91, 1581–1592. [Google Scholar] [CrossRef]
- Viera, J.S.C.; Marques, M.R.C.; Nazareth, M.C.; Jimenez, P.C.; Castro, Í.B. On Replacing Single-Use Plastic with so-Called Biodegradable Ones: The Case with Straws. Environ. Sci. Policy 2020, 106, 177–181. [Google Scholar] [CrossRef]
- Luo, H.; Liu, C.; He, D.; Xu, J.; Sun, J.; Li, J.; Pan, X. Environmental Behaviors of Microplastics in Aquatic Systems: A Systematic Review on Degradation, Adsorption, Toxicity and Biofilm under Aging Conditions. J. Hazard. Mater. 2022, 423, 126915. [Google Scholar] [CrossRef] [PubMed]
- Xiang, Y.; Jiang, L.; Zhou, Y.; Luo, Z.; Zhi, D.; Yang, J.; Lam, S.S. Microplastics and Environmental Pollutants: Key Interaction and Toxicology in Aquatic and Soil Environments. J. Hazard. Mater. 2022, 422, 126843. [Google Scholar] [CrossRef] [PubMed]
- Fred-Ahmadu, O.H.; Bhagwat, G.; Oluyoye, I.; Benson, N.U.; Ayejuyo, O.O.; Palanisami, T. Interaction of Chemical Contaminants with Microplastics: Principles and Perspectives. Sci. Total Environ. 2020, 706, 135978. [Google Scholar] [CrossRef]
- Wang, T.; Wang, L.; Chen, Q.; Kalogerakis, N.; Ji, R.; Ma, Y. Interactions between Microplastics and Organic Pollutants: Effects on Toxicity, Bioaccumulation, Degradation, and Transport. Sci. Total Environ. 2020, 748, 142427. [Google Scholar] [CrossRef]
- European Commission. European Commission Opinion on Parabens; European Commission: Brussels, Belgium, 2006. [Google Scholar]
- The Danish Environmental Agency Protection. Survey of Parabens; The Danish Environmental Agency Protection: Copenhagen, Denmark, 2013; ISBN 9788793026025. [Google Scholar]
- Costa, J.R.; Campos, M.S.; Lima, R.F.; Gomes, L.S.; Marques, M.R.; Taboga, S.R.; Biancardi, M.F.; Brito, P.V.A.; Santos, F.C.A. Endocrine-Disrupting Effects of Methylparaben on the Adult Gerbil Prostate. Environ. Toxicol. 2017, 32, 1801–1812. [Google Scholar] [CrossRef]
- Bolujoko, N.B.; Ogunlaja, O.O.; Alfred, M.O.; Okewole, D.M.; Ogunlaja, A.; Olukanni, O.D.; Msagati, T.A.M.; Unuabonah, E.I. Occurrence and Human Exposure Assessment of Parabens in Water Sources in Osun State, Nigeria. Sci. Total Environ. 2022, 814, 152448. [Google Scholar] [CrossRef]
- Bedoux, G.; Roig, B.; Thomas, O.; Dupont, V.; Le Bot, B. Occurrence and Toxicity of Antimicrobial Triclosan and By-Products in the Environment. Environ. Sci. Pollut. Res. 2012, 19, 1044–1065. [Google Scholar] [CrossRef]
- Dhillon, G.S.; Kaur, S.; Pulicharla, R.; Brar, S.K.; Cledón, M.; Verma, M.; Surampalli, R.Y. Triclosan: Current Status, Occurrence, Environmental Risks and Bioaccumulation Potential. Int. J. Environ. Res. Public Health 2015, 12, 5657–5684. [Google Scholar] [CrossRef]
- Jia, Y.W.; Huang, Z.; Hu, L.X.; Liu, S.; Li, H.X.; Li, J.L.; Chen, C.E.; Xu, X.R.; Zhao, J.L.; Ying, G.G. Occurrence and Mass Loads of Biocides in Plastic Debris from the Pearl River System, South China. Chemosphere 2020, 246, 125771. [Google Scholar] [CrossRef]
- Chen, X.; Gu, X.; Bao, L.; Ma, S.; Mu, Y. Comparison of Adsorption and Desorption of Triclosan between Microplastics and Soil Particles. Chemosphere 2021, 263, 127947. [Google Scholar] [CrossRef] [PubMed]
- Wu, X.; Liu, P.; Huang, H.; Gao, S. Adsorption of Triclosan onto Different Aged Polypropylene Microplastics: Critical Effect of Cations. Sci. Total Environ. 2020, 717, 137033. [Google Scholar] [CrossRef]
- Ma, J.; Zhao, J.; Zhu, Z.; Li, L.; Yu, F. Effect of Microplastic Size on the Adsorption Behavior and Mechanism of Triclosan on Polyvinyl Chloride. Environ. Pollut. 2019, 254, 113104. [Google Scholar] [CrossRef] [PubMed]
- Li, Y.; Li, M.; Li, Z.; Yang, L.; Liu, X. Effects of Particle Size and Solution Chemistry on Triclosan Sorption on Polystyrene Microplastic. Chemosphere 2019, 231, 308–314. [Google Scholar] [CrossRef]
- Ter Halle, A.; Ladirat, L.; Gendre, X.; Goudouneche, D.; Pusineri, C.; Routaboul, C.; Tenailleau, C.; Duployer, B.; Perez, E. Understanding the Fragmentation Pattern of Marine Plastic Debris. Environ. Sci. Technol. 2016, 50, 5668–5675. [Google Scholar] [CrossRef] [PubMed] [Green Version]
- Pickett, J.E.; Kuvshinnikova, O.; Sung, L.-P.; Ermi, B.D. Design and Interpretation of Laboratory Weathering Tests Using Acceleration Parameters of Aromatic Engineering Thermoplastics. In Service Life Prediction of Polymers and Coatings; Elsevier: Amsterdam, The Netherlands, 2020; ISBN 9780128183670. [Google Scholar]
- Mintenig, S.M.; Int-Veen, I.; Löder, M.G.J.; Primpke, S.; Gerdts, G. Identification of Microplastic in Effluents of Waste Water Treatment Plants Using Focal Plane Array-Based Micro-Fourier-Transform Infrared Imaging. Water Res. 2017, 108, 365–372. [Google Scholar] [CrossRef] [PubMed]
- Ziajahromi, S.; Neale, P.A.; Rintoul, L.; Leusch, F.D.L. Wastewater Treatment Plants as a Pathway for Microplastics: Development of a New Approach to Sample Wastewater-Based Microplastics. Water Res. 2017, 112, 93–99. [Google Scholar] [CrossRef]
- Hamid, S.H.; Prichard, W.H. Polymer-Plastics Technology and Engineering Application of Infrared Spectroscopy in Polymer Degradation. Polym.-Plast. Technol. Mater. 1998, 27, 303–334. [Google Scholar] [CrossRef]
- Almond, J.; Sugumaar, P.; Wenzel, M.N.; Hill, G.; Wallis, C. Determination of the Carbonyl Index of Polyethylene and Polypropylene Using Specified Area under Band Methodology with ATR-FTIR Spectroscopy. E-Polymers 2020, 20, 369–381. [Google Scholar] [CrossRef]
- Chemical, P.E. Triclosan; European Commission Health & Consumers Directorate C, Public Health and Risk Assessment Unit C7—Risk Assessment Office: Brussels, Belgium, 2009; ISBN 0980312442. [Google Scholar] [CrossRef]
- Nguyen, V.H.; Phan Thi, L.A.; Chandana, P.S.; Do, H.T.; Pham, T.H.; Lee, T.; Nguyen, T.D.; Le Phuoc, C.; Huong, P.T. The Degradation of Paraben Preservatives: Recent Progress and Sustainable Approaches toward Photocatalysis. Chemosphere 2021, 276, 130163. [Google Scholar] [CrossRef] [PubMed]
- Fan, C.; Huang, Y.Z.; Lin, J.N.; Li, J. Microplastic Constituent Identification from Admixtures by Fourier-Transform Infrared (FTIR) Spectroscopy: The Use of Polyethylene Terephthalate (PET), Polyethylene (PE), Polypropylene (PP), Polyvinyl Chloride (PVC) and Nylon (NY) as the Model Constituent. Environ. Technol. Innov. 2021, 23, 101798. [Google Scholar] [CrossRef]
- Aldas, M.; Paladines, A.; Valle, V.; Pazmiño, M.; Quiroz, F. Effect of the Prodegradant-Additive Plastics Incorporated on the Polyethylene Recycling. Int. J. Polym. Sci. 2018, 2018. [Google Scholar] [CrossRef] [Green Version]
- Briassoulis, D.; Babou, E.; Hiskakis, M.; Kyrikou, I. Degradation in Soil Behavior of Artificially Aged Polyethylene Films with Pro-Oxidants. J. Appl. Polym. Sci. 2015, 132, 2474176. [Google Scholar] [CrossRef]
- Sudhakar, M.; Doble, M.; Murthy, P.S.; Venkatesan, R. Marine Microbe-Mediated Biodegradation of Low- and High-Density Polyethylenes. Int. Biodeterior. Biodegrad. 2008, 61, 203–213. [Google Scholar] [CrossRef]
- Baztan, J.; Bergmann, M.; Carrasco, A.; Fossi, M.C.; Jorgensen, B.; Miguelez, A.; Pahl, S.; Thompson, R.C. MICRO 2018, Fate and Impact of Microplastics: Knowledge, Actions and Solutions. In Proceedings of the MICRO 2018, Fate and Impact of Microplastics: Knowledge, Actions and Solutions, Lanzarote, Spain, 19–23 November 2018; HAL Open Science: Lyon, France, 2019. ISBN 9788409064779. [Google Scholar]
- Weinstein, J.E.; Crocker, B.K.; Gray, A.D. From Macroplastic to Microplastic: Degradation of High-Density Polyethylene, Polypropylene, and Polystyrene in a Salt Marsh Habitat. Environ. Toxicol. Chem. 2016, 35, 1632–1640. [Google Scholar] [CrossRef]
- Bracco, G.; Holst, B. Surface Science Techniques; Springer: Berlin/Heidelberg, Germany, 2013; Volume 51, ISBN 9783642342431. [Google Scholar]
- SHIMADZU (Asia Pacific) Pte. Ltd. Characterization of Biodegradable and Oxo-Biodegradable Plastic Bags. Biometr. Technol. Today 2010, 2010, 3. [Google Scholar] [CrossRef]
- Al-Salem, S.M.; Al-Hazza’a, A.; Karam, H.J.; Al-Wadi, M.H.; Al-Dhafeeri, A.T.; Al-Rowaih, A.A. Insights into the Evaluation of the Abiotic and Biotic Degradation Rate of Commercial Pro-Oxidant Filled Polyethylene (PE) Thin Films. J. Environ. Manag. 2019, 250, 109475. [Google Scholar] [CrossRef]
- Fakhri, L.A.; Ghanbarzadeh, B.; Dehghannya, J.; Hosseini, M.; Dadashi, S. Photo-Catalytic and Biotic Degradation of Polystyrene Packaging Film: Effect of Zinc Oxide Photocatalyst Nanoparticles and Nanoclay. Chemosphere 2021, 283, 130972. [Google Scholar] [CrossRef]
- Tavares, R.S.; Martins, F.C.; Oliveira, P.J.; Ramalho-Santos, J.; Peixoto, F.P. Parabens in Male Infertility-Is There a Mitochondrial Connection? Reprod. Toxicol. 2009, 27, 1–7. [Google Scholar] [CrossRef] [Green Version]
- Chakraborty, I.; Bodurtha, K.J.; Heeder, N.J.; Godfrin, M.P.; Tripathi, A.; Hurt, R.H.; Shukla, A.; Bose, A. Massive Electrical Conductivity Enhancement of Multilayer Graphene/Polystyrene Composites Using a Nonconductive Filler. ACS Appl. Mater. Interfaces 2014, 6, 16472–16475. [Google Scholar] [CrossRef] [PubMed]
- Daugherty, M.; Conte, M.; Weber, J.C. Adsorption of Organic Pollutants to Microplastics: The Effects of Dissolved Organic Matter. Master’s Thesis, Northwestern University, Evanston, IL, USA, 2016. [Google Scholar]
- Goedecke, C.; Stollin, U.M.; Hering, S.; Richter, J.; Piechotta, C.; Paul, A.; Braun, U. A First Pilot Study on the Sorption of Environmental Pollutants on Various Microplastic Materials. J. Environ. Anal. Chem. 2017, 4, 1000191. [Google Scholar] [CrossRef]
- Rule, K.L.; Ebbett, V.R.; Vikesland, P.J. Formation of Chloroform and Chlorinated Organics by Free-Chlorine-Mediated Oxidation of Triclosan. Environ. Sci. Technol. 2005, 39, 3176–3185. [Google Scholar] [CrossRef] [PubMed]
- Davison, J.; Maillard, J. Opinion on Triclosan—Antimicrobial Resistance; European Commission: Brussels, Belgium, 2010; ISBN 9789279124846. [Google Scholar]
- Tong, H.; Hu, X.; Zhong, X.; Jiang, Q. Adsorption and Desorption of Triclosan on Biodegradable Polyhydroxybutyrate Microplastics. Environ. Toxicol. Chem. 2021, 40, 72–78. [Google Scholar] [CrossRef] [PubMed]


| Time | 0 h | 168 h | 495 h | 801 h |
|---|---|---|---|---|
| PE | 0.134 | 0.198 | 0.263 | 0.764 |
| Oxo-PE | 0.168 | 0.254 | 0.688 | 1.288 |
| Oxo-PEunknown | 2.007 | - | - | - |
| Weight Loss Temperature (°C) | T5% | T50% | T90% |
|---|---|---|---|
| PE | 459.8 | 501.2 | 517.8 |
| Oxo-PE | 470.9 | 504.5 | 520.8 |
| Oxo-PEunknown | 326.2 | 500.7 | 521.6 |
| Pollutant | MPs | Size | Concentration | Reference |
|---|---|---|---|---|
| Triclosan | Plastic debris | 250 μm–5 mm | 172 ± 25 ng/g | [34] |
| PE, PS | PE—225 ± 41 μm PS—313 ± 48 μm | PE—1248 μg/g PS—1033 μg/g Soil—961 μg/g | [35] | |
| PP | <180 μm | 1 mg/L | [36] | |
| PVC | <1 μm–74 μm | 8.98–12.7 mg/g | [37] | |
| PS | 75–214 μm | 0.9 mg/g | [38] | |
| PE, PHB | PE—1255 ± 144 μm PHB—1222 ± 104 μm | 3431.85–9442.27 μg/g | [63] | |
| PE | 50 μm (film) | 0.536–4.421 mg/g | Present work | |
| Methylparaben | Plastic debris | 250 μm–5 mm | 148 ± 40 ng/g | [34] |
| PE | 50 μm (film) | 0.709–2.715 mg/g | Present work |
Publisher’s Note: MDPI stays neutral with regard to jurisdictional claims in published maps and institutional affiliations. |
© 2022 by the authors. Licensee MDPI, Basel, Switzerland. This article is an open access article distributed under the terms and conditions of the Creative Commons Attribution (CC BY) license (https://creativecommons.org/licenses/by/4.0/).
Share and Cite
Budhiraja, V.; Urh, A.; Horvat, P.; Krzan, A. Synergistic Adsorption of Organic Pollutants on Weathered Polyethylene Microplastics. Polymers 2022, 14, 2674. https://doi.org/10.3390/polym14132674
Budhiraja V, Urh A, Horvat P, Krzan A. Synergistic Adsorption of Organic Pollutants on Weathered Polyethylene Microplastics. Polymers. 2022; 14(13):2674. https://doi.org/10.3390/polym14132674
Chicago/Turabian StyleBudhiraja, Vaibhav, Anja Urh, Petra Horvat, and Andrej Krzan. 2022. "Synergistic Adsorption of Organic Pollutants on Weathered Polyethylene Microplastics" Polymers 14, no. 13: 2674. https://doi.org/10.3390/polym14132674
APA StyleBudhiraja, V., Urh, A., Horvat, P., & Krzan, A. (2022). Synergistic Adsorption of Organic Pollutants on Weathered Polyethylene Microplastics. Polymers, 14(13), 2674. https://doi.org/10.3390/polym14132674