
Structural, Thermal, and Optical Studies of Gamma Irradiated Polyvinyl Alcohol-, Lignosulfonate-, and Palladium Nanocomposite Film

 ,
, 

Abstract
:1. Introduction
2. Experimental
2.1. Materials
2.2. Irradiation Facility
2.3. Experimental Apparatus
3. Results and Discussion
3.1. Structural Investigation
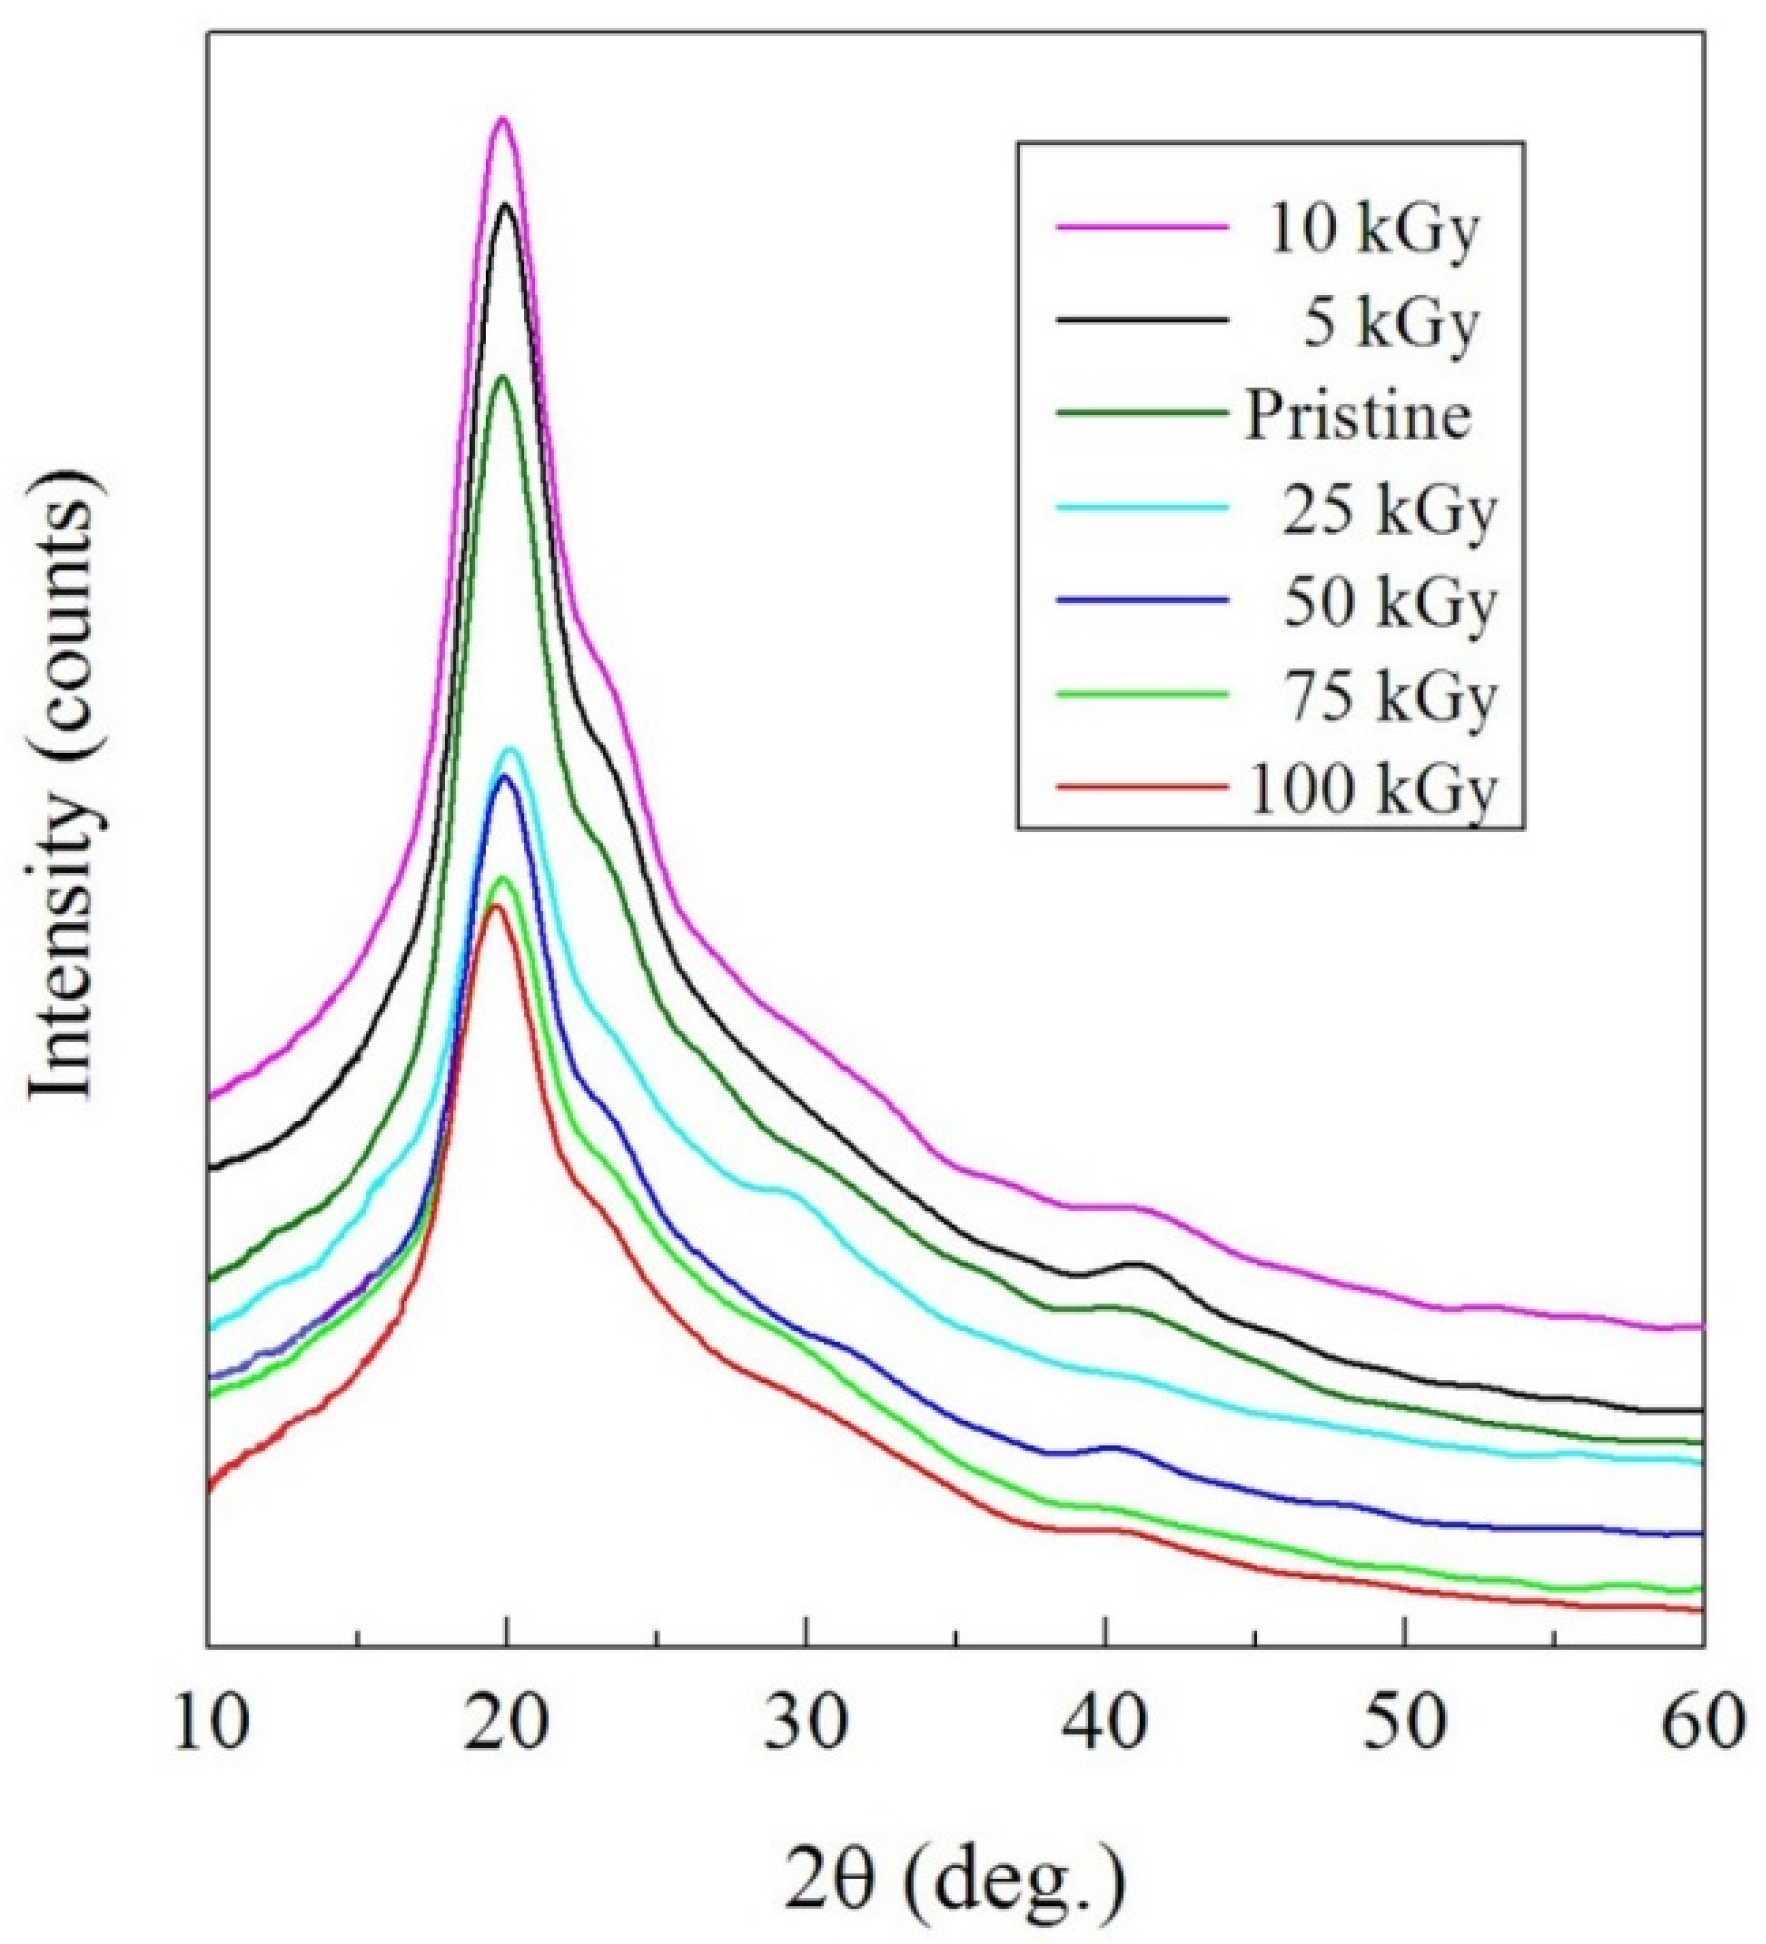
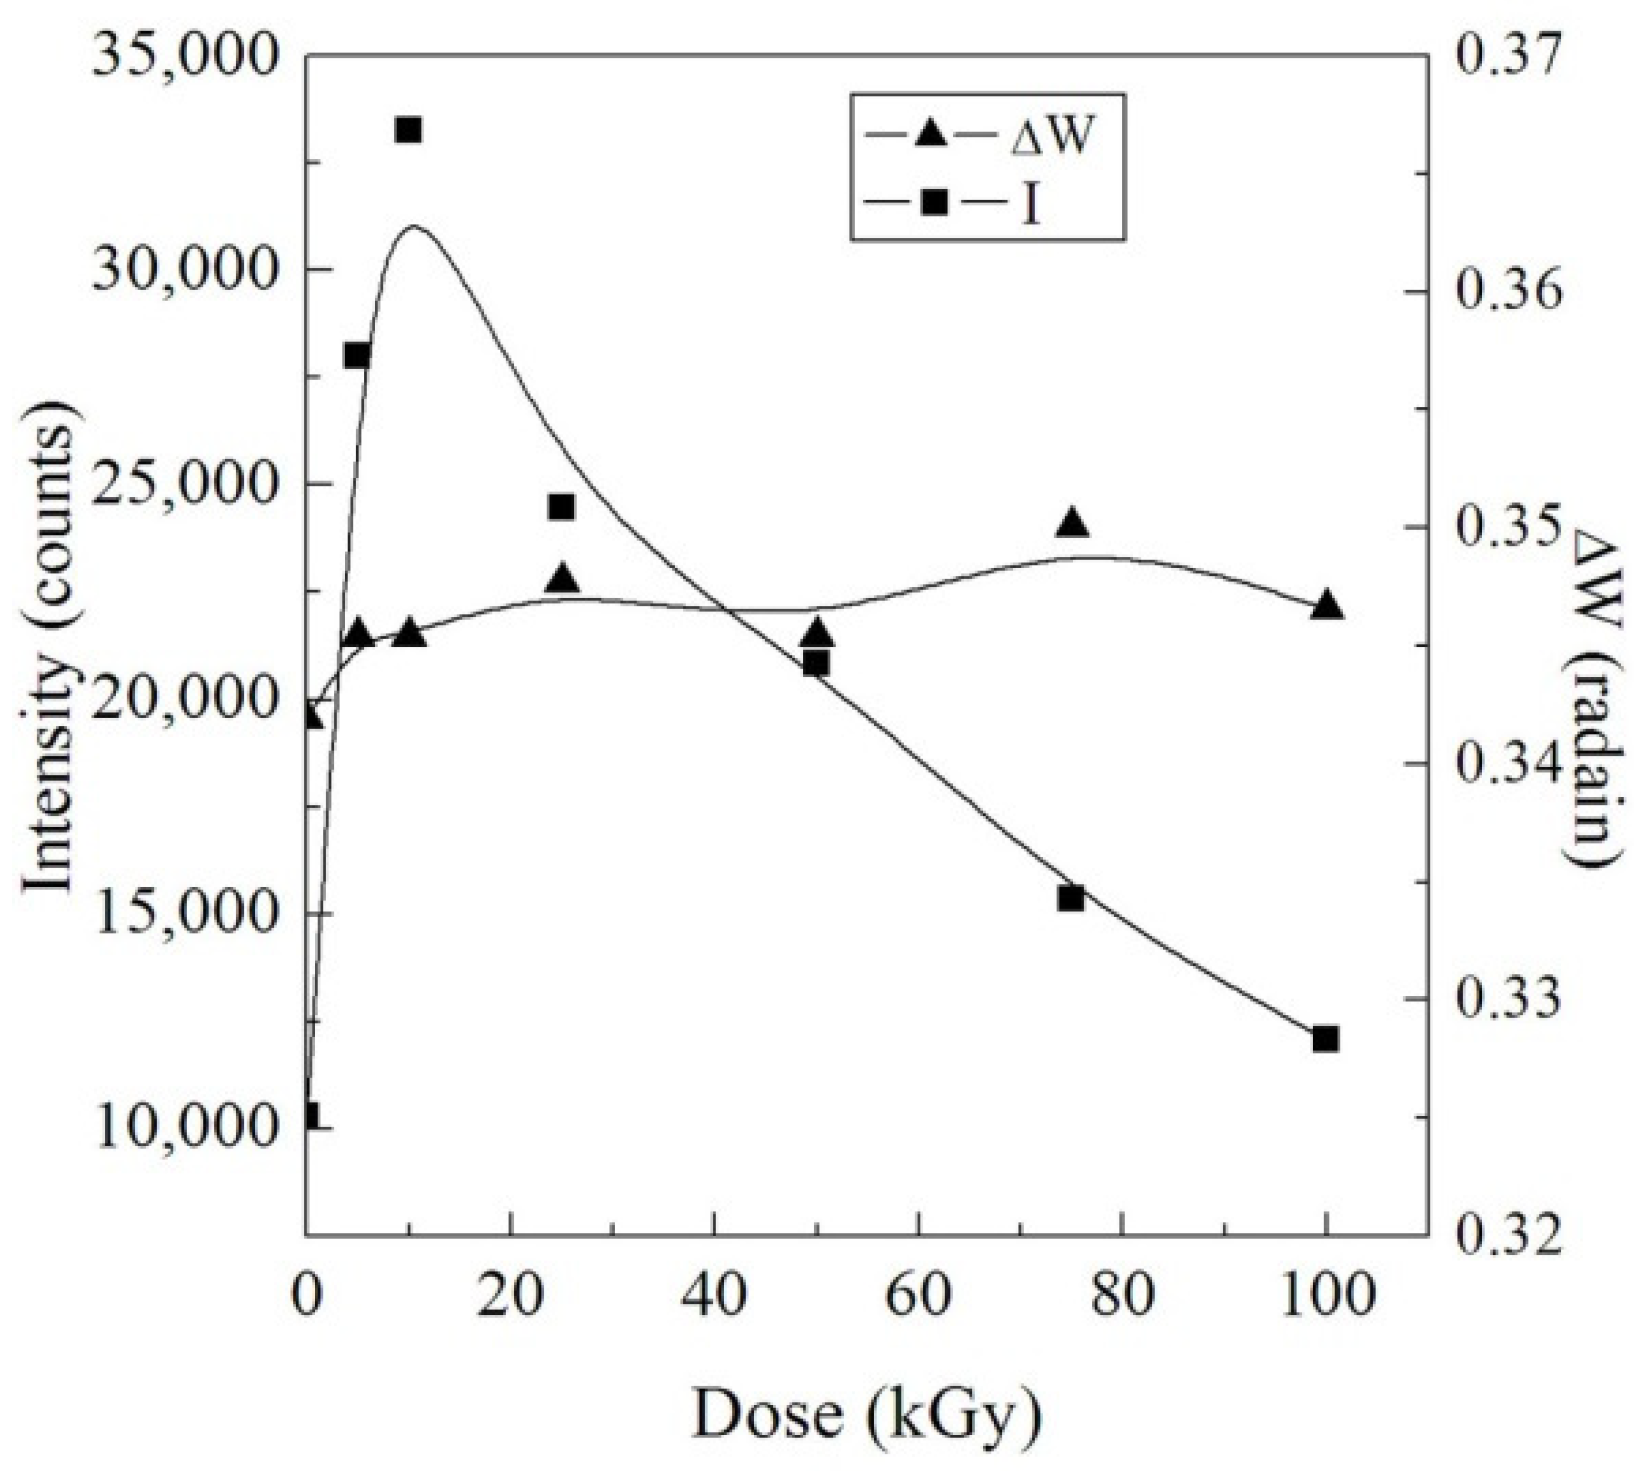
3.1.1. XRD
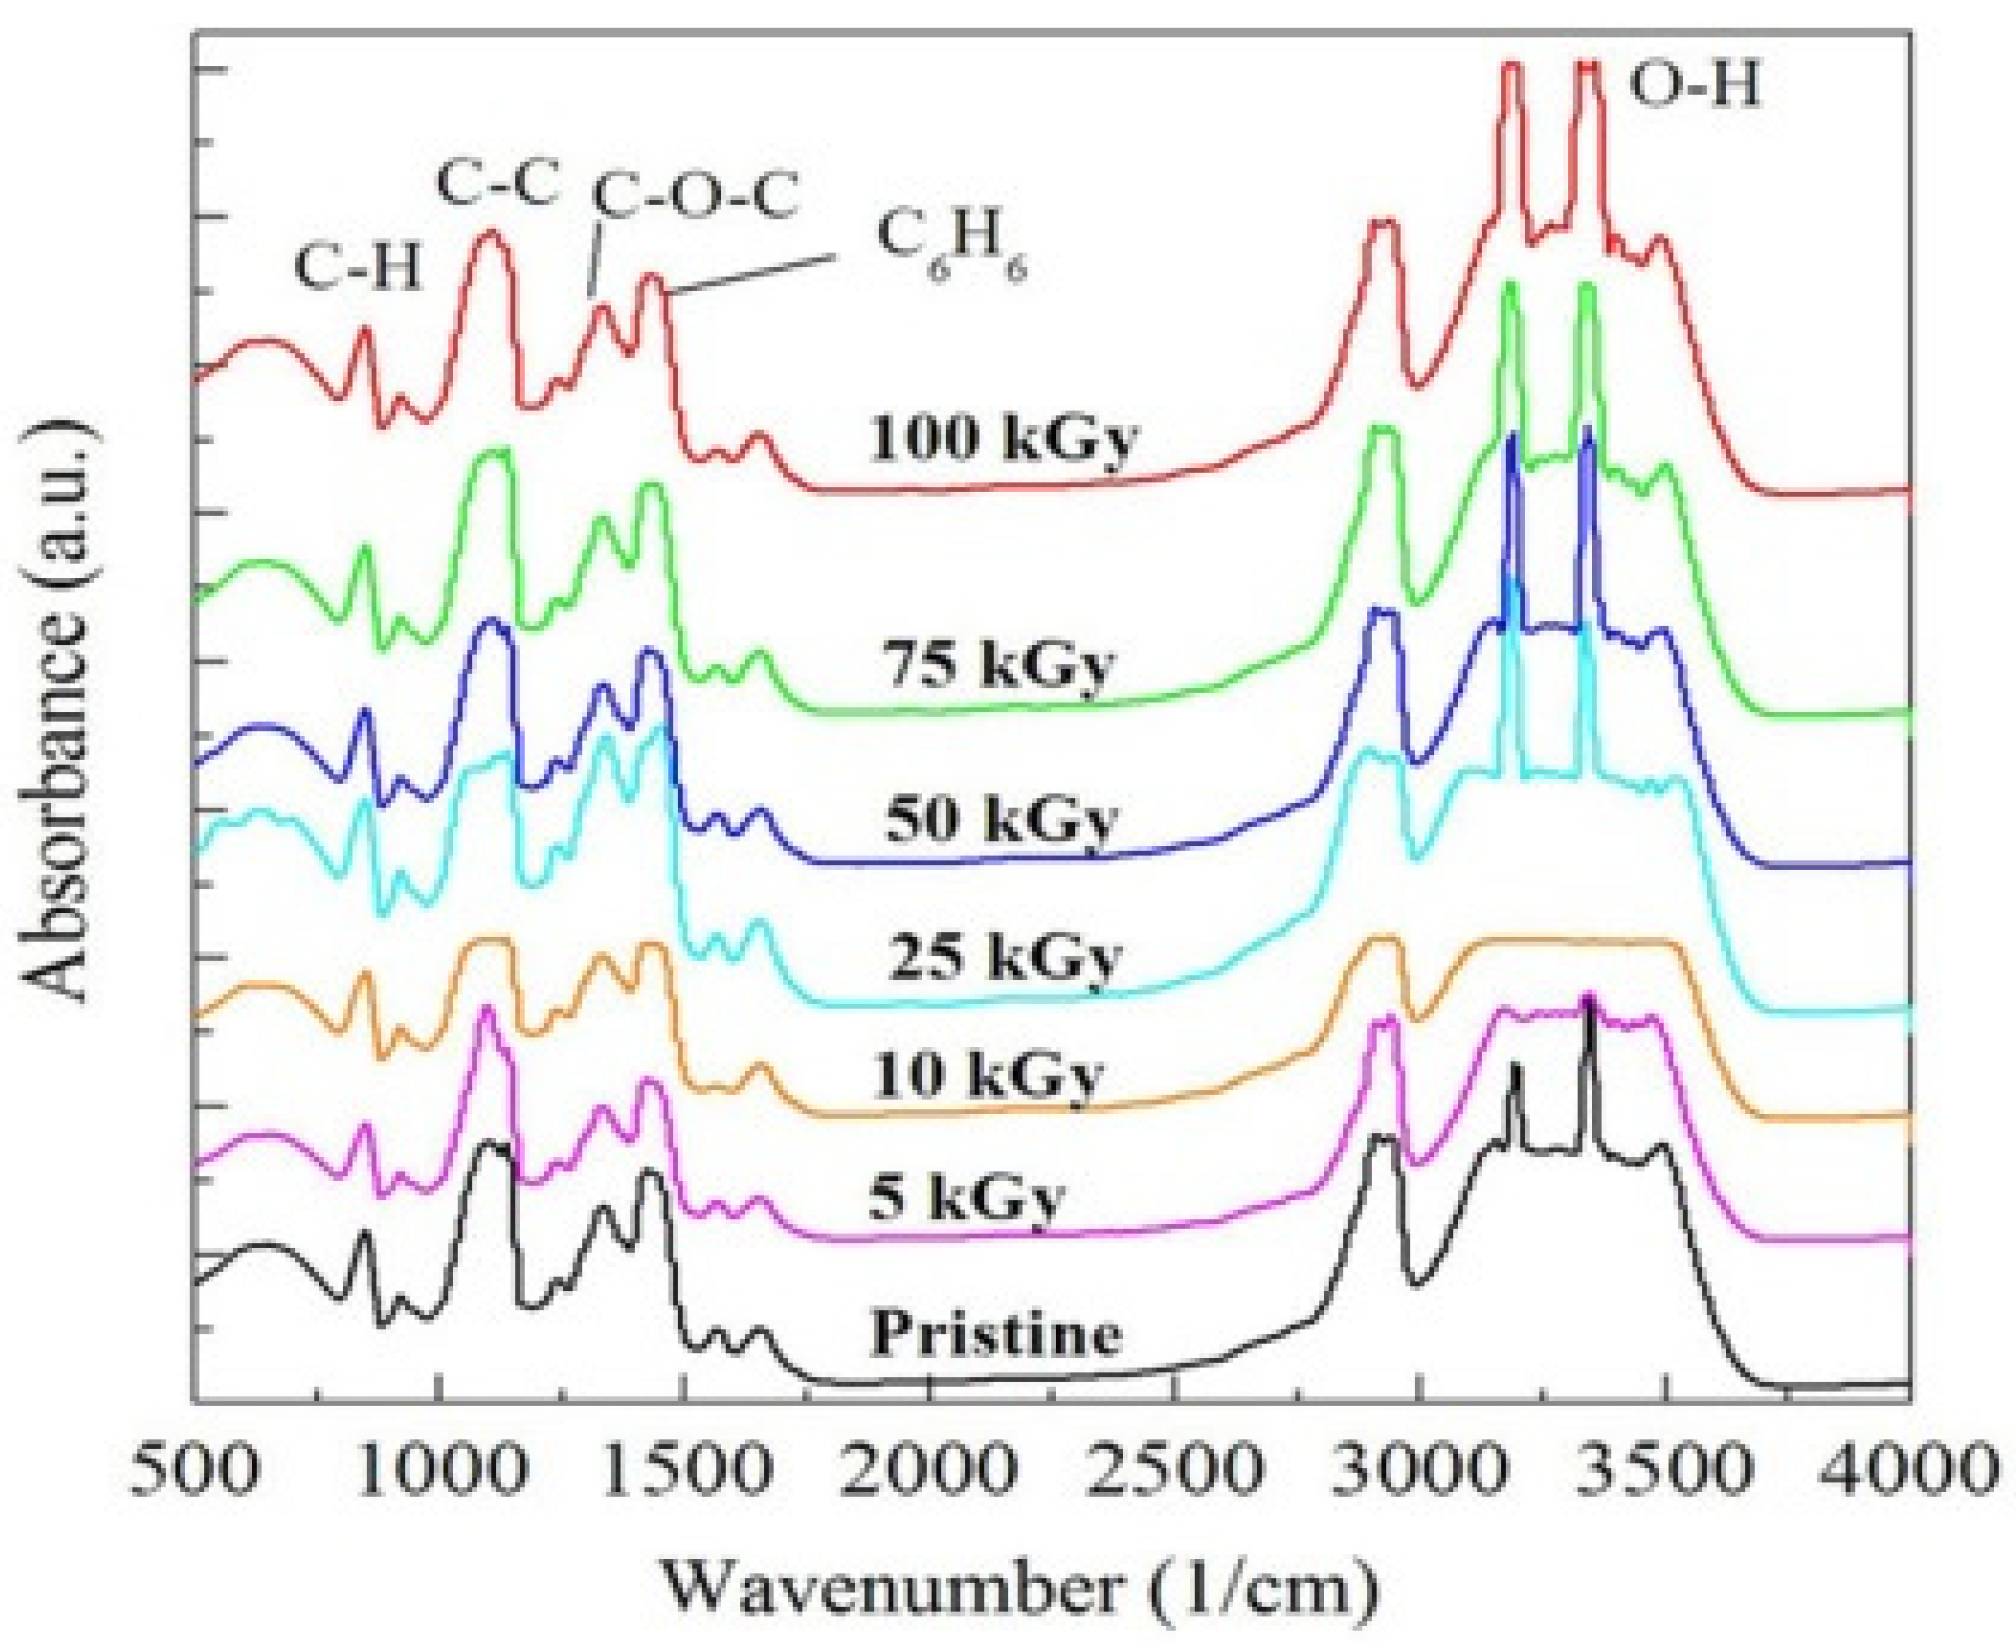
3.1.2. FTIR
3.2. Thermal Investigation
3.2.1. TGA
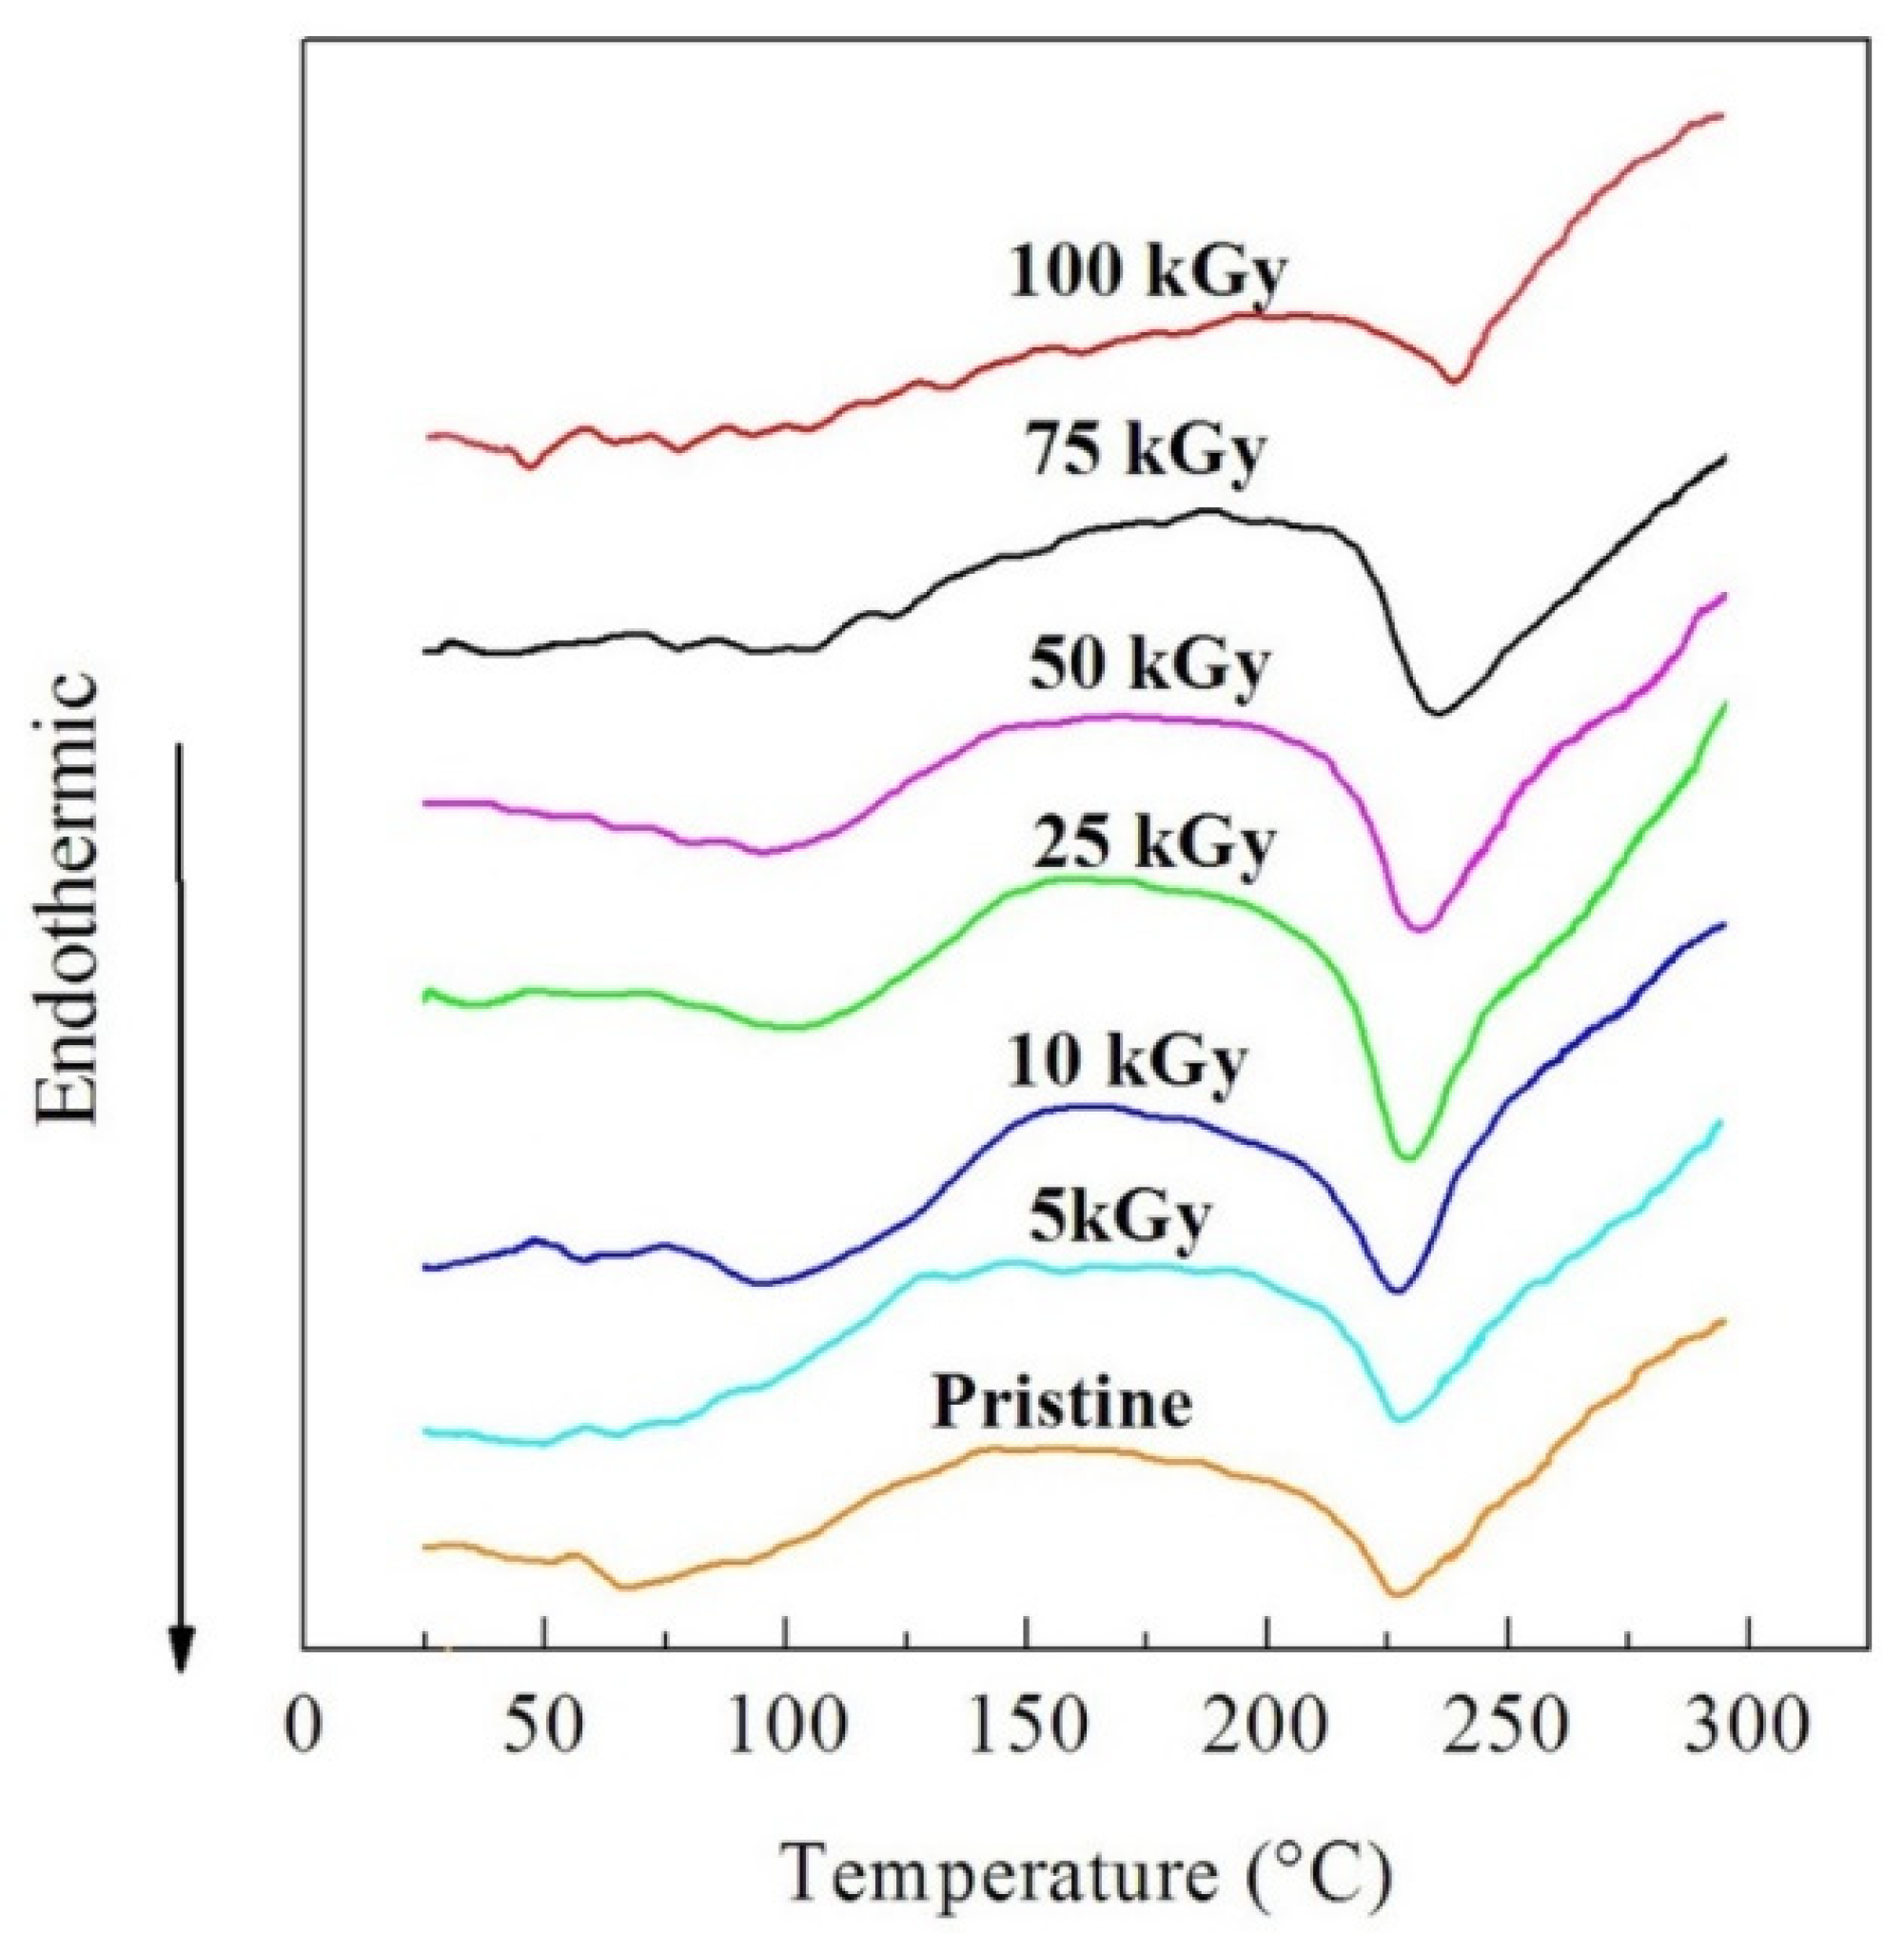
3.2.2. DTA
3.3. Optical Investigation
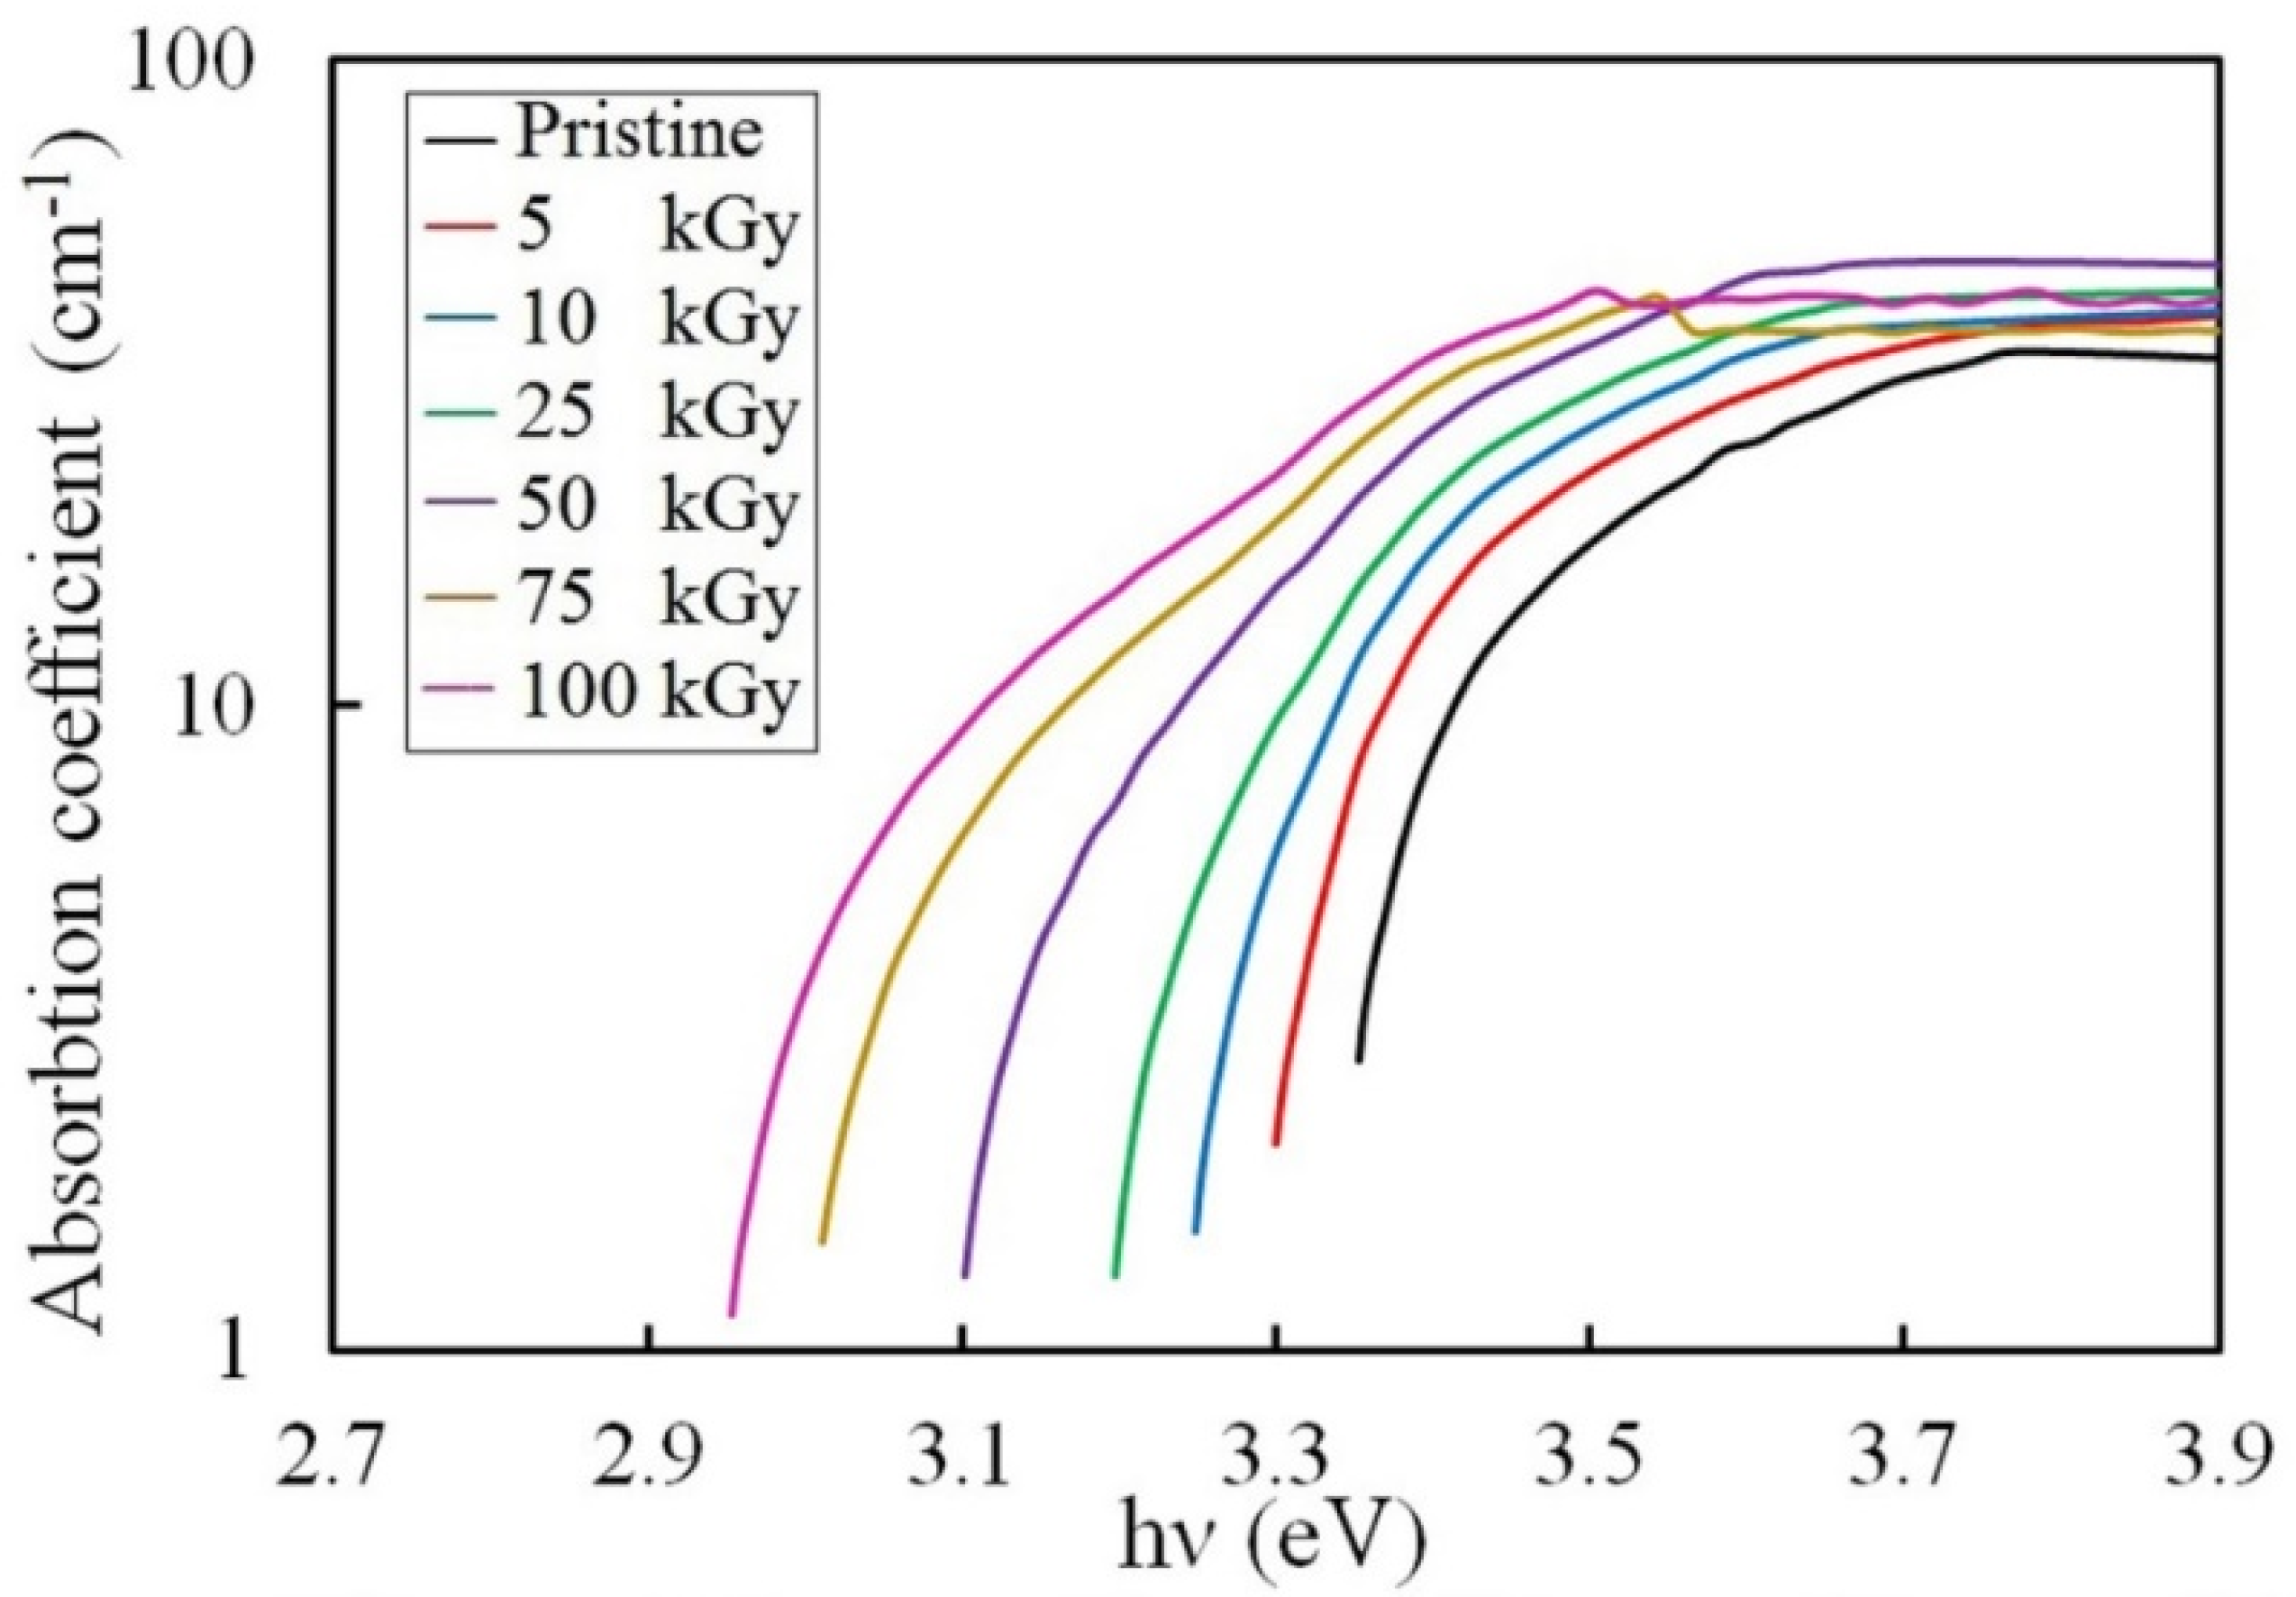
3.3.1. Absorption Coefficient Investigation
3.3.2. Urbach Energy Investigation
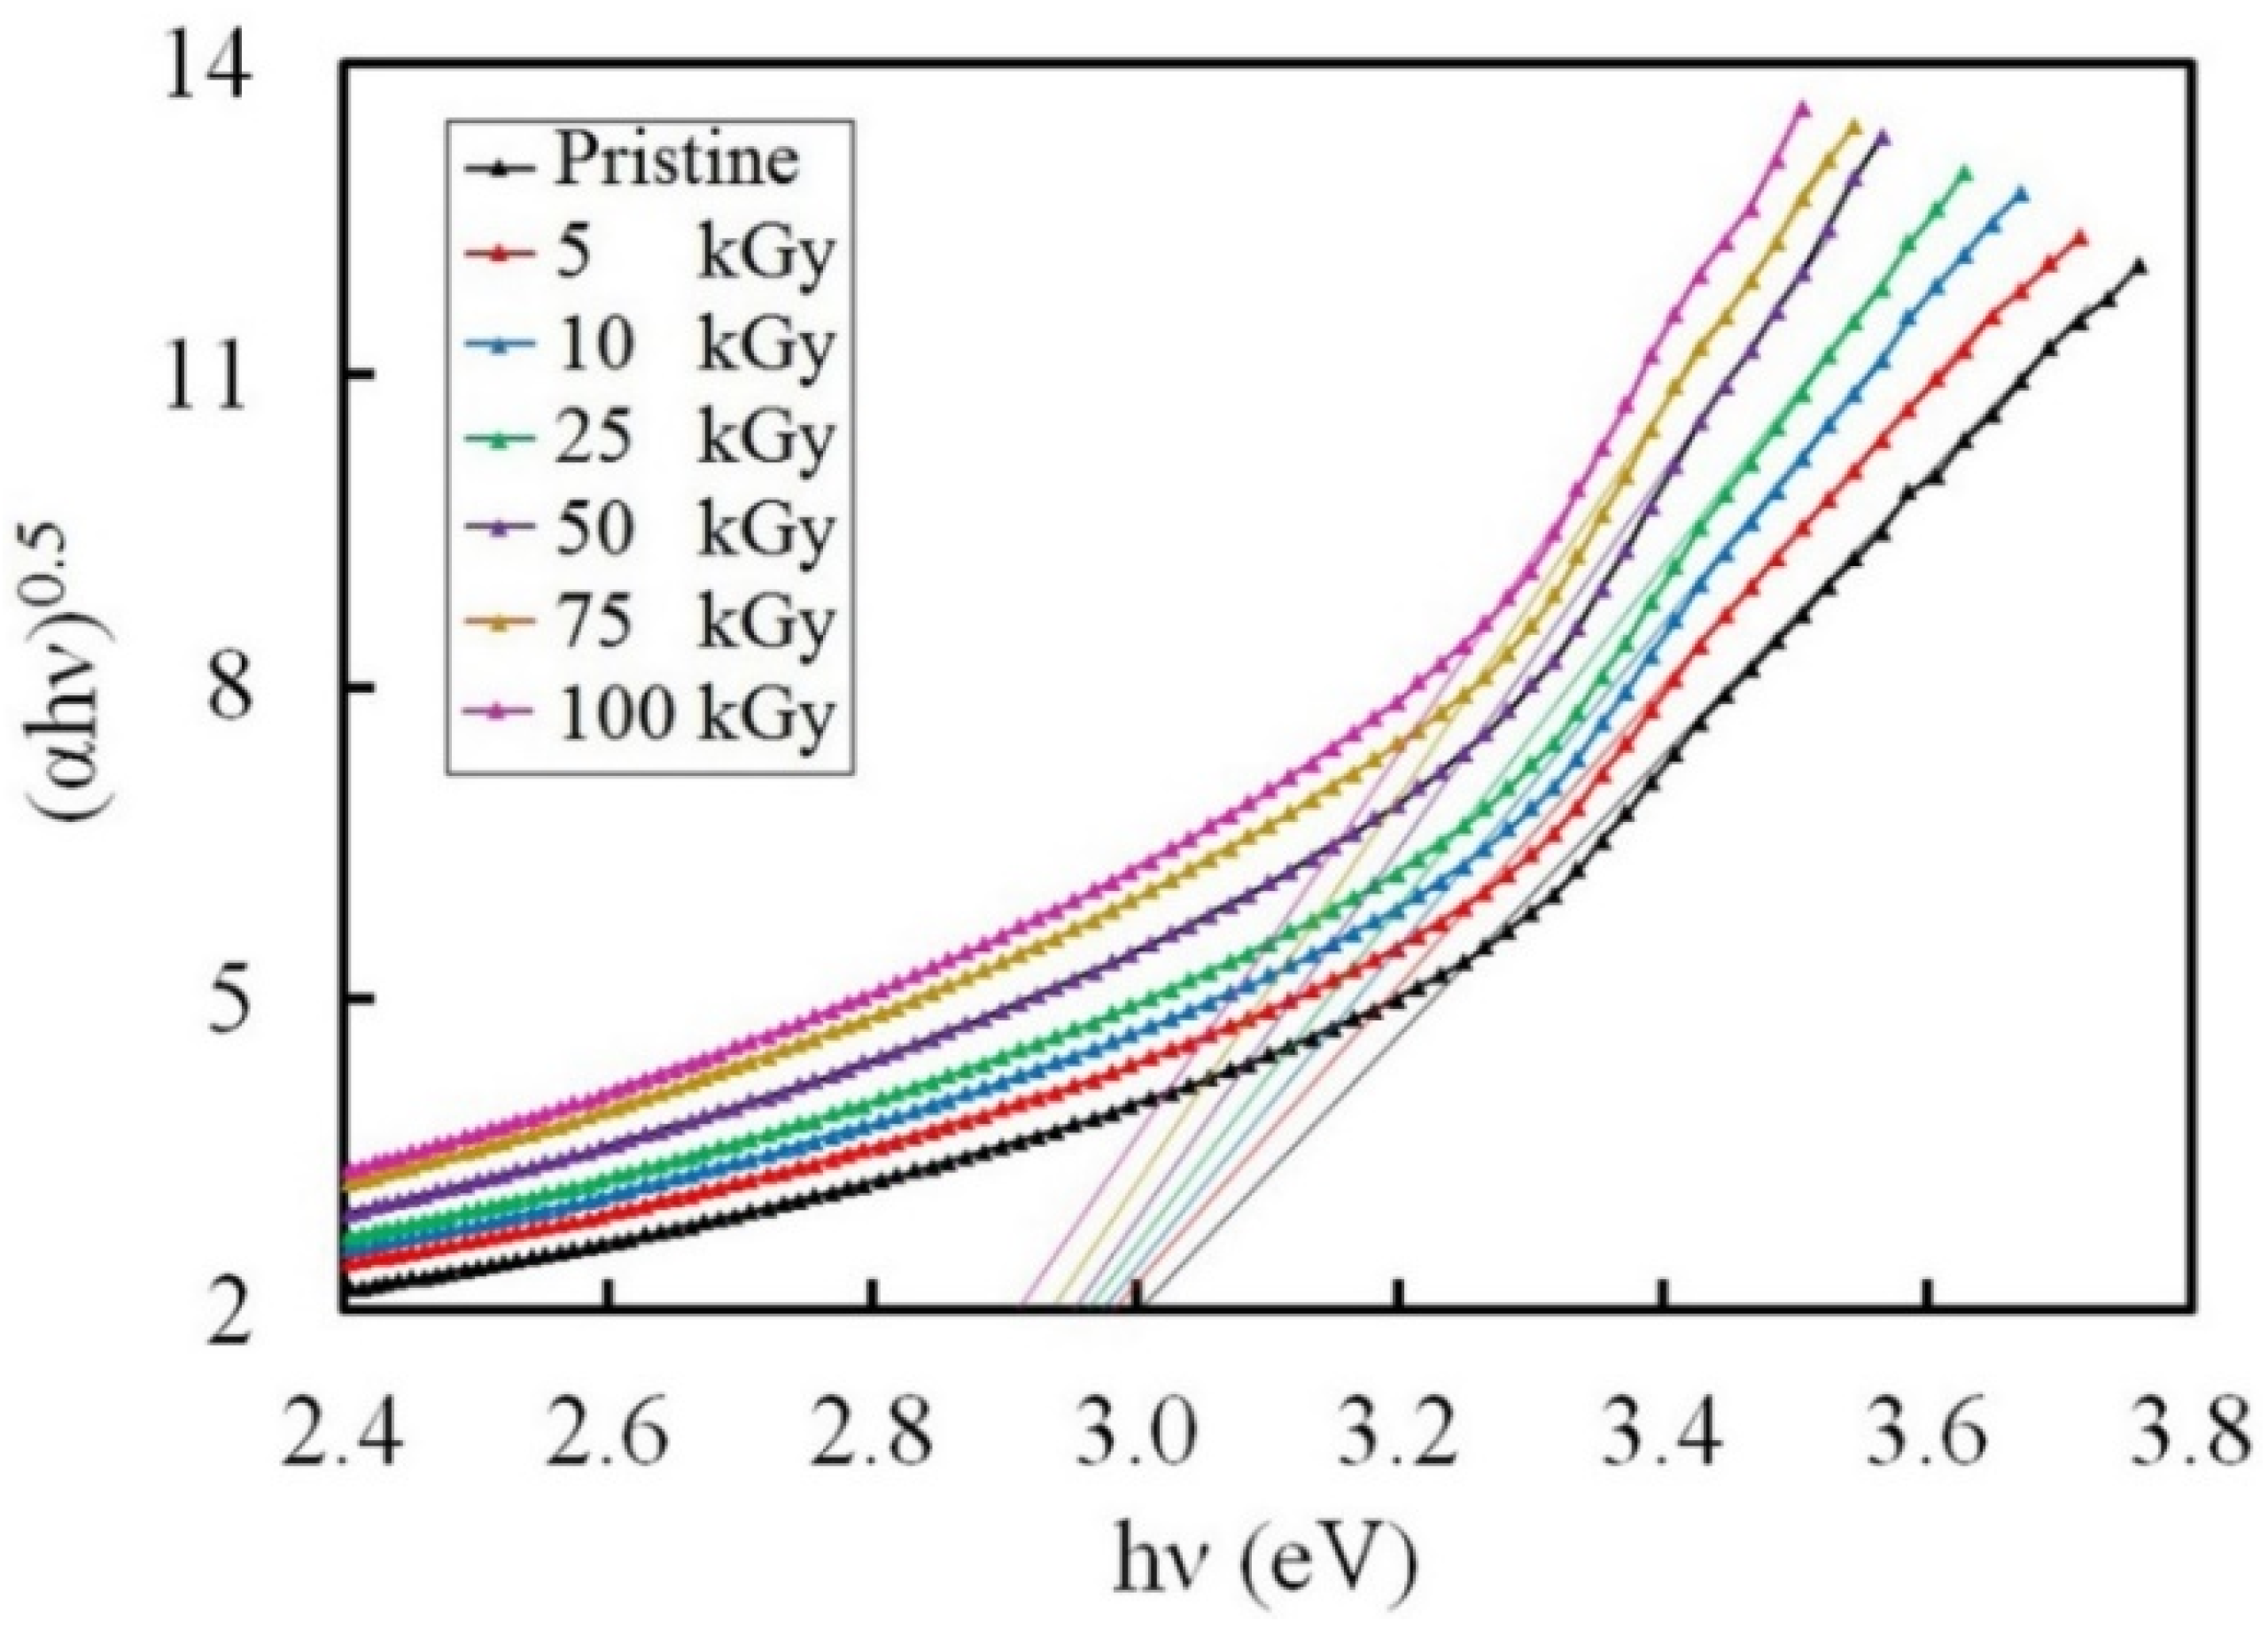
3.3.3. Band Gap Investigation
3.3.4. Refractive Investigation
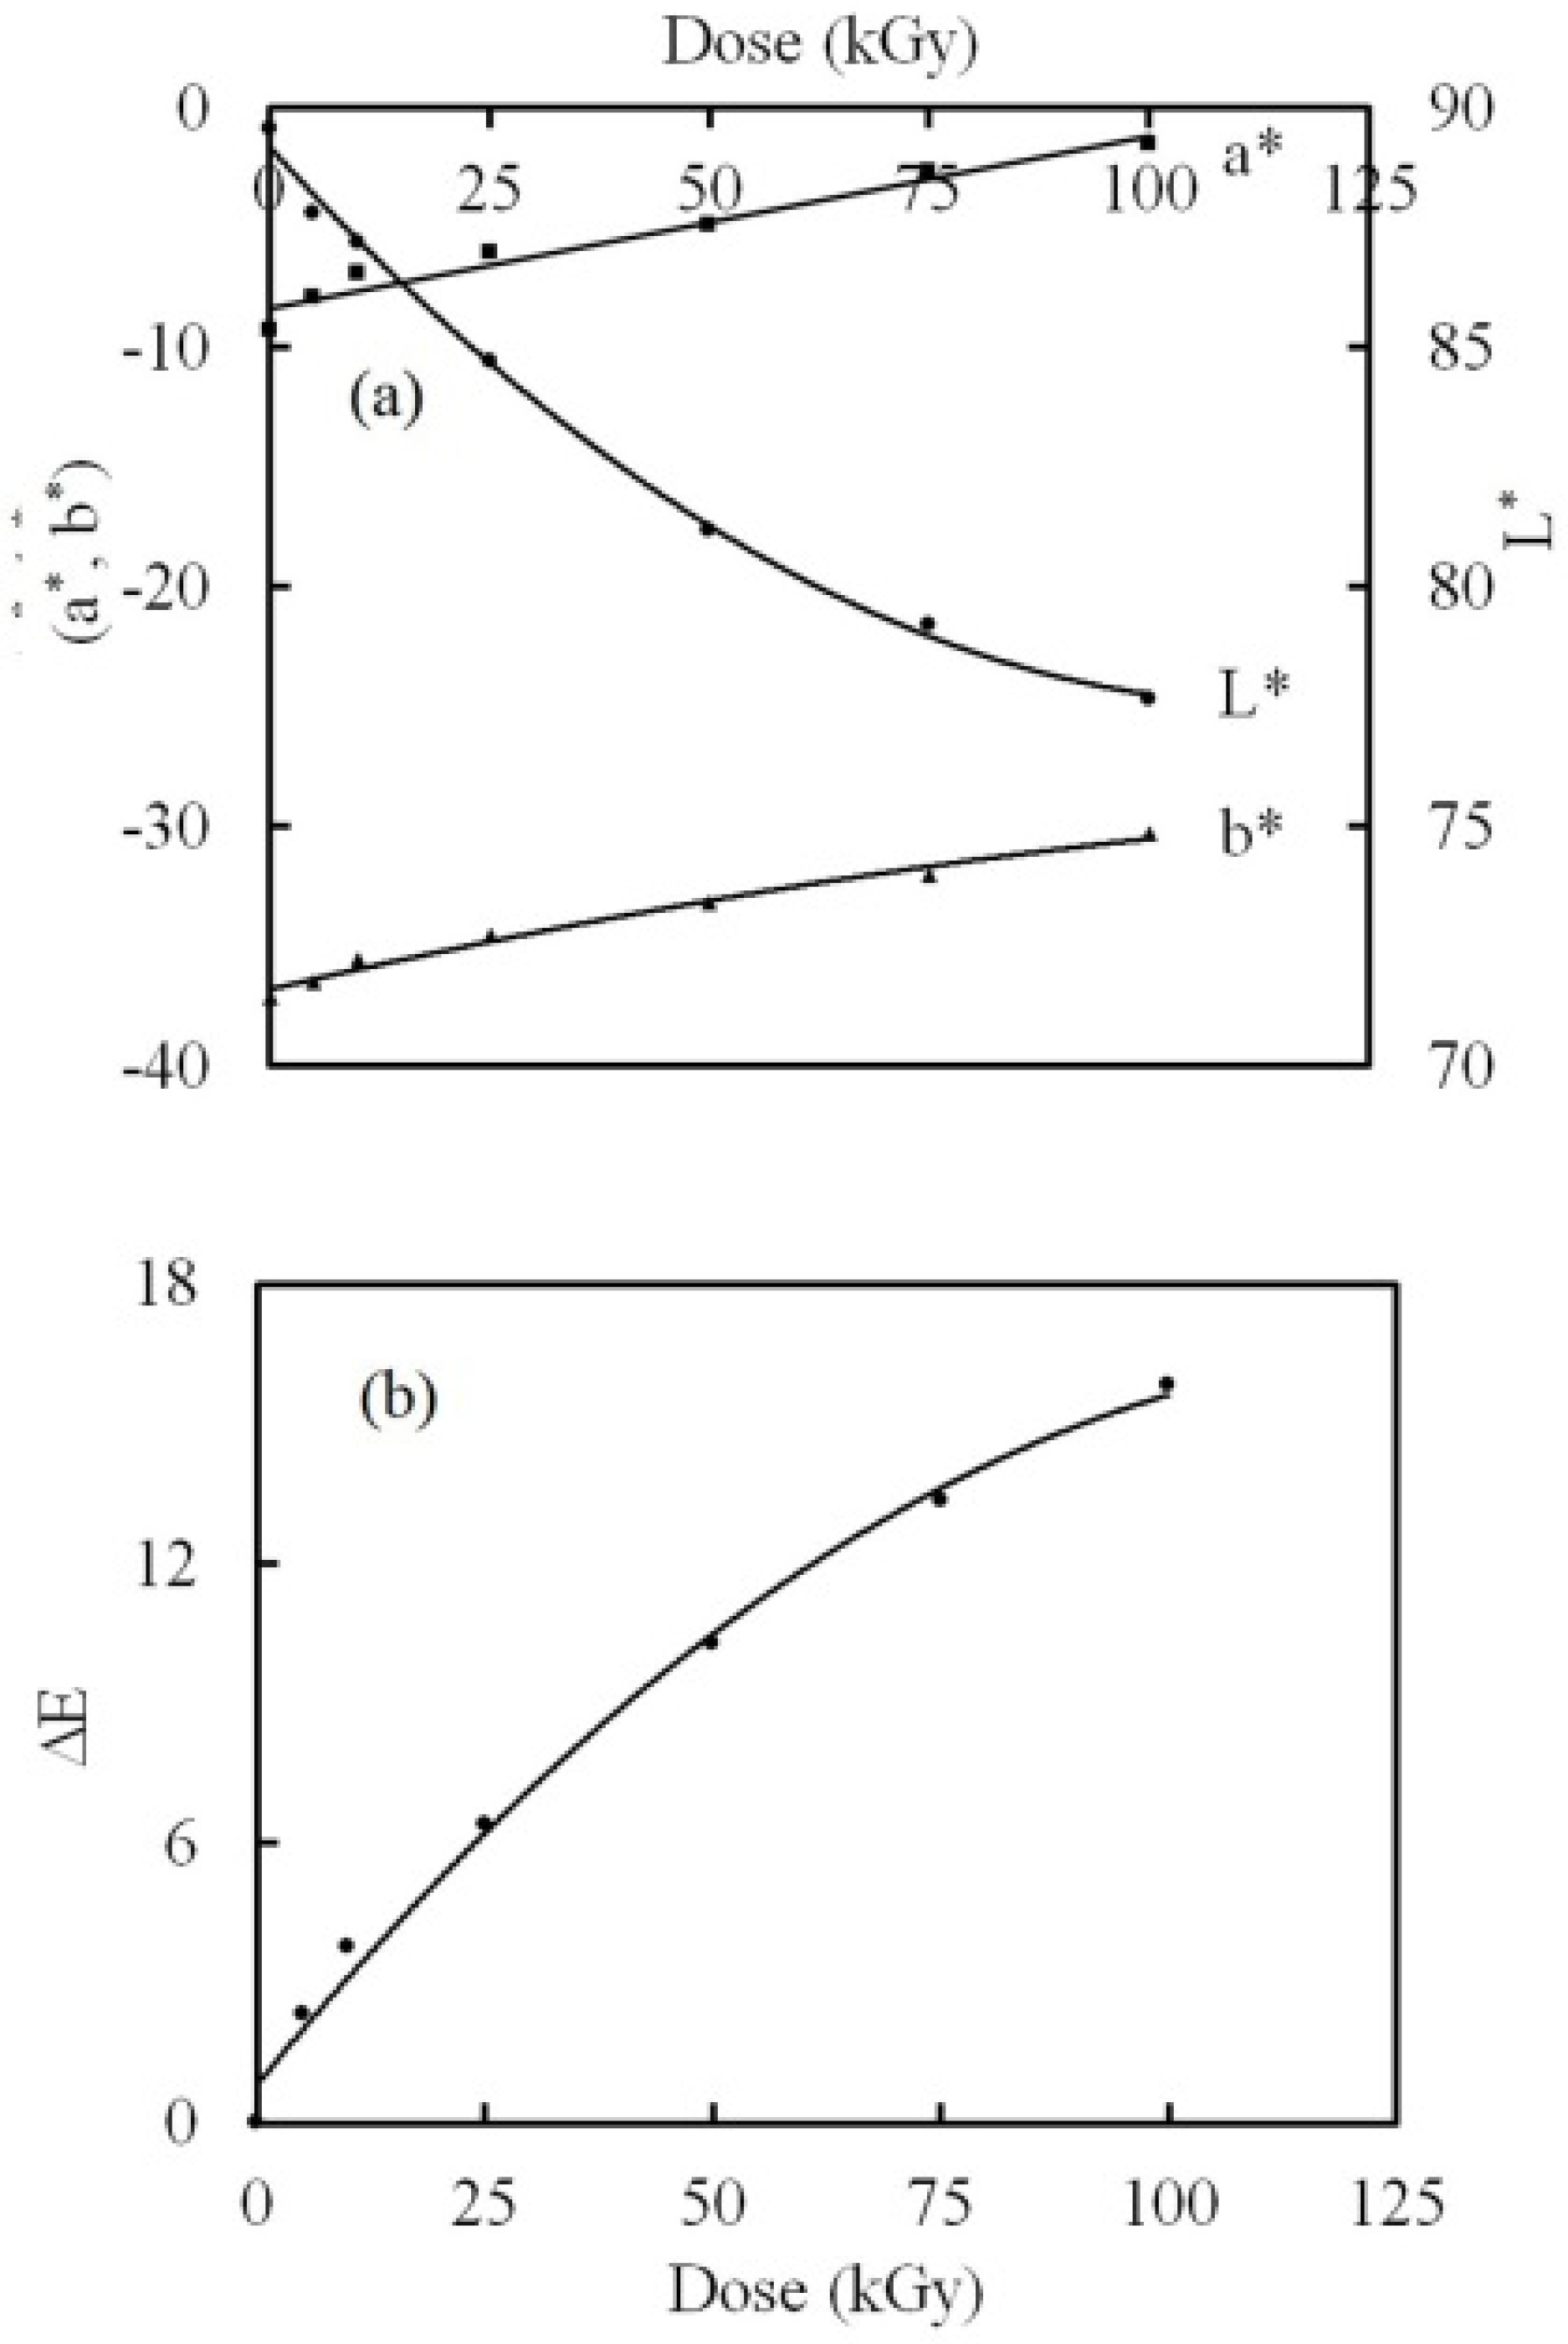
3.4. Color Difference Investigation
4. Conclusions
Author Contributions
Funding
Institutional Review Board Statement
Informed Consent Statement
Data Availability Statement
Conflicts of Interest
References
- Nouh, S.A.; Barakat, M.M.E.; Gupta, R.; Benthami, K.; Bahareth, R.A. Irradiation induced modification of optical properties of PANI-Cu/PMMA and PANI-Cu/CTA nanocomposites. Radiat. Eff. Defects Solids 2021, 176, 188–198. [Google Scholar] [CrossRef]
- Mahrous, E.M.; Barakat, M.M.E.; Bahareth, R.A.; Aldawood, S.; Nouh, S.A. Structural and optical characterization of γ -irradiated LG-PVA/Ag nanocomposite film. Radiat. Eff. Defects Solids 2022, 1–17. [Google Scholar] [CrossRef]
- Koole, R.; Groeneveld, E.; Vanmaekelbergh, D.; Meijerink, A. Nanoparticle. In Workhouses of Nanoscience; de Mello Donega, C., Ed.; Springer: Berlin, Germany, 2014; Chapter 2; ISBN 978-3-662-4822-9. [Google Scholar]
- Virtanen, S.; Vartianen, J.; Setala, H.; Tammelin, T.; Vuoti, S. Modified nano fibrillated cellulose-polyvinyl alcohol films with improved mechanical performance. RSC Adv. 2014, 4, 11343–11350. [Google Scholar] [CrossRef] [Green Version]
- Zhang, C.-H.; Yang, F.-L.; Wang, W.-J.; Chen, B. Preparation and characterization of hydrophilic modification of polypropylene non-woven fabric bydip-coating PVA (polyvinyl alcohol). Sep. Purif. Technol. 2008, 61, 276–286. [Google Scholar] [CrossRef]
- Abdelaziz, M.; Ghannam, M.M. Influence of titanium chloride addition on the optical and dielectric properties of PVA films. Phys. B 2010, 405, 958–964. [Google Scholar] [CrossRef]
- Ding, B.; Kim, H.-Y.; Lee, S.-C.; Lee, D.-R.; Choi, K.-J. Preparation and characterization of nanoscaled poly (vinyl alcohol) fibers via electrospinning. Fibers Polym. 2002, 3, 73–79. [Google Scholar] [CrossRef]
- Katsura, T.; Sasaki, H. On-going solutions to environmental issues in plastic packaging. Packag. Technol. Sci. 2001, 14, 87–95. [Google Scholar] [CrossRef]
- Ruwoldt, J.; Planque, J.; Øye, G. Lignosulfonate Salt Tolerance and the Effect on Emulsion Stability. ACS Omega 2020, 5, 15007–15015. [Google Scholar] [CrossRef]
- Huang, C.; Ma, J.; Zhang, W.; Huang, G.; Yong, Q. Preparation of Lignosulfonates from Biorefinery Lignins by Sulfomethylation and Their Application as a Water Reducer for Concrete. Polymers 2018, 10, 841. [Google Scholar] [CrossRef] [Green Version]
- Kubo, S.; Kadla, J.F. The formation of strong intermolecular interactions inimmiscible blends of poly(vinyl alcohol) (PVA) and lignin. Biomacromolecules 2003, 4, 561–567. [Google Scholar] [CrossRef]
- Saito, T.; Brown, R.H.; Hunt, M.A.; Pickel, D.L.; Pickel, J.M.; Messman, J.M.; Baker, F.S.; Keller, M.; Naskar, A.K. Turning renewable resources into value-added polymer: Development of lignin-based thermoplastic. Green Chem. 2012, 14, 3295–3303. [Google Scholar] [CrossRef]
- Ye, D.; Jiang, L.; Hu, X.; Zhang, M.; Zhang, X. Lignosulfonate as reinforcement in polyvinyl alcohol film: Mechanical properties and interaction analysis. Int. J. Biol. Macromol. 2016, 83, 209–215. [Google Scholar] [CrossRef] [PubMed]
- Lepifre, S.; Froment, M.; Cazaux, F.; Houot, S.; Lourdin, D.; Coqueret, X.; Lapierre, C.; Baumberger, S. Lignin incorporation combined with electron-beamirradiation improves the surface water resistance of starch films. Biomacromolecules 2004, 5, 1678–1686. [Google Scholar] [CrossRef] [PubMed]
- Gregorová, A.; Košíková, B.; Moravčík, R. Stabilization effect of lignin in natural rubber. Polym. Degrad. Stab. 2006, 91, 229–233. [Google Scholar] [CrossRef]
- Jamerson, M.H.; McCue, J.J.; Klette, K.L. Urine pH, container composition, and exposure time influence adsorptive loss of 11- nor-delta 9-tetrahydrocannabinol-9-carboxylic acid. J. Anal. Toxicol. 2005, 29, 627–631. [Google Scholar] [CrossRef] [Green Version]
- Chahal, R.P.; Mahendia, S.; Tomar, A.K.; Kumar, S. γ-Irradiated PVA/Ag Nanocomposite Films: Materials for Optical Applications. J. Alloys Compd. 2012, 538, 212–219. [Google Scholar] [CrossRef]
- Akbarzadeh, M.; Ebaid-Dehaghani, H.; Sadeghi, M. Validity of Several Thermal Conductivity Models in Metal Oxide Nanoparticles Filled Polycarbonate. Adv. Mater. Res. 2013, 739, 51–56. [Google Scholar] [CrossRef]
- Nimrodh, A.; Umapathy, S.; Sophia, J.; Mathavan, T.; Mangalaraj, D. On the optical and thermal properties of in situ/ex situ reduced Ag NP’s/PVA composites and its role as a simple SPR-based protein sensor. Appl. Nano Sci. 2011, 1, 87–96. [Google Scholar] [CrossRef] [Green Version]
- Chowdhury, S.R.; Roy, P.S.; Bhattacharya, S.K. Green synthesis and characterization of polyvinyl alcohol stabilized palladium nanoparticles: Effect of solvent on diameter and catalytic activity. Adv. Nat. Sci. Nanosci. Nanotechnol. 2017, 8, 025002. [Google Scholar] [CrossRef] [Green Version]
- Teresa, J.B.; Amy, A.C.; Stephen, R.L. CdSe/ZnS quantum dot intermittency in N,N-diphenyl-N,N-bis(3-methylphenyl)-(1,1-biphenyl)- 4,4-diamine (TPD). Chem. Phys. Lett. 2012, 521, 7–11. [Google Scholar] [CrossRef]
- Nouh, S.A.; Abou Elfadl, A.; Benthami, K.; Alhazime, A.A. Structural and optical characteristics of laser irradiated CdSe/PVA Nanocomposites. Int. Polym. Proc. 2019, 34, 255–261. [Google Scholar] [CrossRef]
- Nouh, S.A.; Barakat, M.M.E.; Benthami, K.; Samy, R.M.; Elhalawany, N. Synthesis and characterization of PANI-Co/PC nanocomposite: Gamma induced changes in the structure and thermal properties. Chem. Pap. 2021, 75, 2197–2205. [Google Scholar] [CrossRef]
- Al Naim, A.; Alnaim, N.; Ibrahim, S.S.; Metwally, S.M. Effect of gamma irradiation on the mechanical properties of PVC/ZnO polymer nanocomposite. J. Radiat. Res. Appl. Sci. 2017, 10, 165–171. [Google Scholar] [CrossRef] [Green Version]
- Yamauchi, T.; Nakai, H.; Somaki, Y.; Oda, K. Formation of CO2 gas and OH groups in CR-39 plastics due to gamma-ray and ions irradiation. Radiat. Meas. 2003, 36, 99. [Google Scholar] [CrossRef] [Green Version]
- Nouh, S.A.; Benthami, K.; Abou Elfadl, A.; El-Shamy, N.T.; Tommalieh, M.J. Structural, thermal and optical characteristics of laser-exposed Pd/PVA nanocomposite. Polym. Bull. 2021, 78, 1851–1866. [Google Scholar] [CrossRef]
- Nouh, S.A.; Gaballah, N.; Abou Elfadl, A.; Alsharif, S.A. Modification induced by proton irradiation in bayfol UV1 7-2 nuclear track detector. Radiat. Protect. Dosimet. 2019, 183, 450–459. [Google Scholar] [CrossRef]
- Somyia, E.S.; Tarob, A.B.; Abou Elfadl, A.; Arafa, H. Effect of nanosilica on optical, electric modulus and AC conductivity of polyvinyl alcohol/polyaniline films. Phys. B Condens. Matter 2015, 464, 17–27. [Google Scholar] [CrossRef]
- Zhudi, Z.; Wenxue, Y.; Xinfang, C. Study on increase in crystallinity in γ-irradiated poly(vinylidene fluoride). Radiat. Phys. Chem. 2002, 65, 173–176. [Google Scholar] [CrossRef]
- Noda, I.; Dowrey, A.W.; Marcott, C. Group Frequency Assignments for Major Infrared Bands Observed in Common Synthetic Polymers. In Physical properties of polymers; Mark, J.E., Ed.; AIP Press: New York, NY, USA, 1996. [Google Scholar]
- Pauleau, Y. Materials Surface Processing by Directed Energy Techniques; Elsevier: New York, NY, USA, 2006. [Google Scholar]
- Jayasekara, R.; Harding, I.; Bowater, I.; Christie, G.B.Y.; Lonergan, G.T. Preparation, surface modification and characterisation of solution cast starch PVA blended films. Polym. Test. 2004, 23, 17–27. [Google Scholar] [CrossRef]
- Abd El-kader, K.M. Spectroscopic behavior of poly(vinyl alcohol) films with different molecular weights after UV irradiation, thermal annealing, and double treatment with UV irradiation and thermal annealing. J. Appl. Polym. Sci. 2003, 88, 589. [Google Scholar] [CrossRef]
- Ali, Z.I.; Ali, A.; Hosam, A.M. Effect of electron beam irradiation on the structural properties of PVA/V2O5 xerogel. Spectrochim. Acta Part A Mol. Biomol. Spectrosc. 2009, 72, 868. [Google Scholar] [CrossRef] [PubMed]
- Horowitz, H.; Metzger, G. A New Analysis of Thermogravimetric Traces. Anal. Chem. 1963, 35, 1464–1468. [Google Scholar] [CrossRef]
- Sharma, R.; Kamal, K.K.; Das, M.K.; Gupta, G.K.; Kumar, S. Short Carbon Fiber-Reinforced Polycarbonate Composites. In Composite Materials Processing, Applications, Characterization; Kar, K.K., Ed.; Springer: Berlin/Heidelberg, Germany, 2016; pp. 199–223. [Google Scholar]
- Mahrous, E.M.; Barakat, M.M.E.; Bahareth, R.A.; Benthami, K.; Nouh, S.A. Tailoring the structural and optical properties of Makrofol/CdS nanocomposite by gamma radiation. J. Mater. Res. Technol. 2022, 15, 3085–3093. [Google Scholar] [CrossRef]
- Tommalieh, M.J.; Barakat, M.M.E.; Bahareth, R.A.; Mahrous, E.M.; Aldawood, S.; Nouh, S.A. Thermal, optical, and color modification in Makrofol VLG 7-1 nuclear track detector due to gamma irradiation. J. Macromol. Sci. B 2022, 61, 491–505. [Google Scholar] [CrossRef]
- Reddy, K.R.; Karthik, K.V.; Prasad, S.B.; Soni, S.K.; Jeong, H.M.; Raghu, A.V. Enhanced photocatalytic activity of nanostructured titanium dioxide/polyaniline hybrid photocatalysts. Polyhedron 2016, 120, 169–174. [Google Scholar] [CrossRef]
- Hanifehpour, Y.; Hamnabard, N.; Mirtamizdoust, B.; Joo, S.W. Sonochemical synthesis, characterization and sonocatalytic performance of terbium-doped CdS nanoparticles. J. Inorg. Organomet. Polym. 2016, 26, 623–631. [Google Scholar] [CrossRef]
- Nouh, S.A.; Hegazy, T.M. Fast neutron irradiation effects on CN-85 solid state nuclear track detector. Radiat. Meas. 2006, 41, 17–22. [Google Scholar] [CrossRef]
- El-Mesady, I.A.; Rammah, Y.S.; Abdalla, A.M.; Ghanim, E.H. Gamma irradiation effect towards photoluminescence and optical properties of Makrofol DE 6-2. Radiat. Phys. Chem. 2020, 168, 108578. [Google Scholar] [CrossRef]
- Eisa, W.H.; Zayed, M.F.; Abdel-Moneam, Y.K.; Abou Zeid, A.M. Water-soluble gold/polyaniline core/shell nanocomposite: Synthesis and characterization. Synth. Met. 2014, 195, 23. [Google Scholar] [CrossRef]
- Rammah, Y.S.; Ibrahim, S.E.; Awad, E.M. Electrical and optical properties of Makrofol DE 1-1 polymeric films induced by gamma irradiation. Bull. Natl. Res. Cent. 2019, 43, 1. [Google Scholar] [CrossRef]
- Rathore, B.S.; Gaur, M.S.; Singh, K.S. Investigation of optical and thermally stimulated properties of SiO2 nanoparticles-filled polycarbonate. J. Appl. Polym. Sci. 2012, 126, 960–968. [Google Scholar] [CrossRef]
- Seoudi, R.; Shabaka, A.A.; Kamal, M.; Abdelrazek, E.M.; Eisa, W.H. Dependence of structural, vibrational spectroscopy and optical properties on the particle sizes of CdS/polyaniline core/shell nanocomposites. J. Mol. Struct. 2012, 1013, 156–162. [Google Scholar] [CrossRef]
- Alhazime, A.A.; Benthami, K.A.; Alsobhi, B.O.; Ali, G.W.; Nouh, S.A. Pani-Ag/PVA nanocomposite: Gamma induced changes in the thermal and optical characteristics. J. Vinyl Addit. Technol. 2020, 27, 47–51. [Google Scholar] [CrossRef]
- Rakhshani, A.E. Study of Urbach tail, bandgap energy and grain-boundary characteristics in CdS by modulated photocurrent spectroscopy. J. Phys. Condens. Matter 2000, 12, 4391–4400. [Google Scholar] [CrossRef]
- Urbach, F. The Long-Wavelength Edge of Photographic Sensitivity and of the Electronic Absorption of Solids. Phys. Rev. 1953, 92, 1324. [Google Scholar] [CrossRef]
- Wahab, L.A.; Zayed, H.A.; Abd El-Galil, A.A. Study of structural and optical properties of Cd1-xZnxSe thin films. Thin Solid Films 2012, 520, 5195–5199. [Google Scholar] [CrossRef]
- Prasher, S.; Kumar, M.; Singh, S. Electrical and Optical Properties of O6+ Ion Beam–Irradiated Polymers. Int. J. Polym. Anal. Charact. 2014, 19, 204. [Google Scholar] [CrossRef]
- Tauc, J. Optical Properties of Solids; Abeles, F., Ed.; North-Holland Publisher: Amsterdam, The Netherlands; New York, NY, USA, 1972; p. 77. [Google Scholar]
- Aziz, S.B.; Abdullah, O.G.; Hussein, A.M.; Ahmed, H.M. From insulating PMMA polymer to conjugated double bond behavior: Green chemistry as a novel approach to fabricate small band gap polymers. Polymers 2017, 9, 626. [Google Scholar] [CrossRef] [Green Version]
- Palija, T.; Dobi, J.; Jai, M. A photochemical method for improvement of color stability at polymer–wood biointerfaces. Colloids Surf. B Biointerfaces 2013, 108, 152–157. [Google Scholar] [CrossRef]
- Shams-Eldin, M.A.; Wochnowski, C.; Koerdt, M.; Metev, S.; Hamza, A.A.; Juptner, W. Characterization of the optical-functional properties of a waveguide written by an UV-laser into a planar polymer chip. Opt. Mater. 2005, 27, 1138. [Google Scholar] [CrossRef]
- Ranby, B.; Rebek, J. Photodegradation, Photooxidation and Photostabilization of Polymers: Principles and Applications; Rabek, J.F., Ed.; Wiley: London, UK, 1996; p. 153. [Google Scholar]
- Soylu, M.; Al-Ghamdi, A.A.; Yakuphanoglu, F. Transparent CdO/n-GaN (0001) heterojunction for optoelectronic applications. J. Phys. Chem. Solids 2015, 85, 26–33. [Google Scholar] [CrossRef]
- Bhavsar, V.; Tripathi, D. Study of refractive index dispersion and optical conductivity of PPy doped PVC films. Indian J. Pure Appl. Phys. 2016, 54, 105–110. [Google Scholar]
- Brza, M.A.; Aziz, S.B.; Anuar, H.; Al Hazza, M.H. From Green remediation to polymer hybrid fabrication with improved optical band gaps. Int. J. Mol. Sci. 2019, 20, 3910. [Google Scholar] [CrossRef] [Green Version]
- Nassau, K. Color for Science, Art and Technology; Elsevier: New York, NY, USA, 1998. [Google Scholar]
- Witzel, R.F.; Burnham, R.W.; Onley, J.W. Threshold and suprathreshold perceptual color differences. J. Opt. Soc. Am. 1973, 63, 615. [Google Scholar] [CrossRef] [PubMed]
- Wyszecki, G.; Fielder, G.H. New color-matching ellipses. J. Opt. Soc. Am. 1971, 61, 1135. [Google Scholar] [CrossRef] [PubMed]


| γ dose (kGy) | To (°C) | T1 (°C) | Ea1 (kJ/mole) | Ea2 (kJ/mole) | Tm (°C) |
|---|---|---|---|---|---|
| 0 | 227 | 411 | 288 | 401 | 231 |
| 5 | 225 | 407 | 273 | 394 | 236 |
| 10 | 224 | 339 | 264 | 382 | 240 |
| 25 | 229 | 407 | 296 | 419 | 230 |
| 50 | 232 | 414 | 318 | 432 | 228 |
| 75 | 235 | 416 | 334 | 438 | 227 |
| 100 | 239 | 428 | 341 | 446 | 225 |
| γ Dose (kGy) | X | Y | Z | x | y | z |
|---|---|---|---|---|---|---|
| 0 | 82.78 | 75.36 | 42.59 | 0.381 | 0.362 | 0.247 |
| 5 | 76.66 | 70.58 | 41.80 | 0.384 | 0.372 | 0.244 |
| 10 | 73.14 | 67.93 | 40.61 | 0.393 | 0.378 | 0.233 |
| 25 | 69.82 | 65.39 | 39.54 | 0.400 | 0.384 | 0.226 |
| 50 | 63.70 | 60.62 | 37.67 | 0.403 | 0.389 | 0.224 |
| 75 | 57.04 | 55.23 | 36.19 | 0.406 | 0.394 | 0.221 |
| 100 | 53.85 | 52.60 | 34.85 | 0.412 | 0.397 | 0.212 |
Publisher’s Note: MDPI stays neutral with regard to jurisdictional claims in published maps and institutional affiliations. |
© 2022 by the authors. Licensee MDPI, Basel, Switzerland. This article is an open access article distributed under the terms and conditions of the Creative Commons Attribution (CC BY) license (https://creativecommons.org/licenses/by/4.0/).
Share and Cite
Gharbi, F.; Benthami, K.; Alsheddi, T.H.; Barakat, M.M.E.; Alnaim, N.; Alshoaibi, A.; Nouh, S.A. Structural, Thermal, and Optical Studies of Gamma Irradiated Polyvinyl Alcohol-, Lignosulfonate-, and Palladium Nanocomposite Film. Polymers 2022, 14, 2613. https://doi.org/10.3390/polym14132613
Gharbi F, Benthami K, Alsheddi TH, Barakat MME, Alnaim N, Alshoaibi A, Nouh SA. Structural, Thermal, and Optical Studies of Gamma Irradiated Polyvinyl Alcohol-, Lignosulfonate-, and Palladium Nanocomposite Film. Polymers. 2022; 14(13):2613. https://doi.org/10.3390/polym14132613
Chicago/Turabian StyleGharbi, Foued, Kaoutar Benthami, Tarfa. H. Alsheddi, Mai M. E. Barakat, Nisrin Alnaim, Adil Alshoaibi, and Samir A. Nouh. 2022. "Structural, Thermal, and Optical Studies of Gamma Irradiated Polyvinyl Alcohol-, Lignosulfonate-, and Palladium Nanocomposite Film" Polymers 14, no. 13: 2613. https://doi.org/10.3390/polym14132613
APA StyleGharbi, F., Benthami, K., Alsheddi, T. H., Barakat, M. M. E., Alnaim, N., Alshoaibi, A., & Nouh, S. A. (2022). Structural, Thermal, and Optical Studies of Gamma Irradiated Polyvinyl Alcohol-, Lignosulfonate-, and Palladium Nanocomposite Film. Polymers, 14(13), 2613. https://doi.org/10.3390/polym14132613