
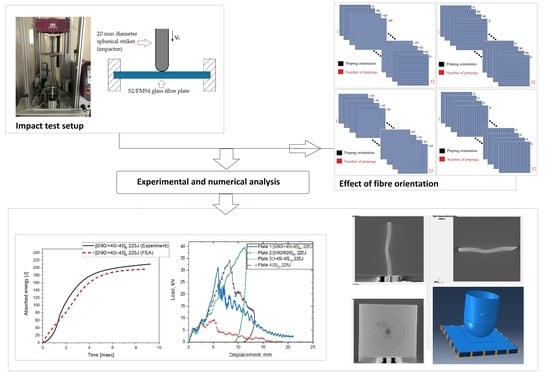
Effect of Fibre Orientation on Impact Damage Resistance of S2/FM94 Glass Fibre Composites for Aerospace Applications: An Experimental Evaluation and Numerical Validation

 ,
,  ,
, 
 , and
, and
Abstract
:
1. Introduction
2. Materials and Methods
2.1. Composite Plates Manufacturing and Sample Preparation
2.2. Setup of Impact Machine and Test Parameters
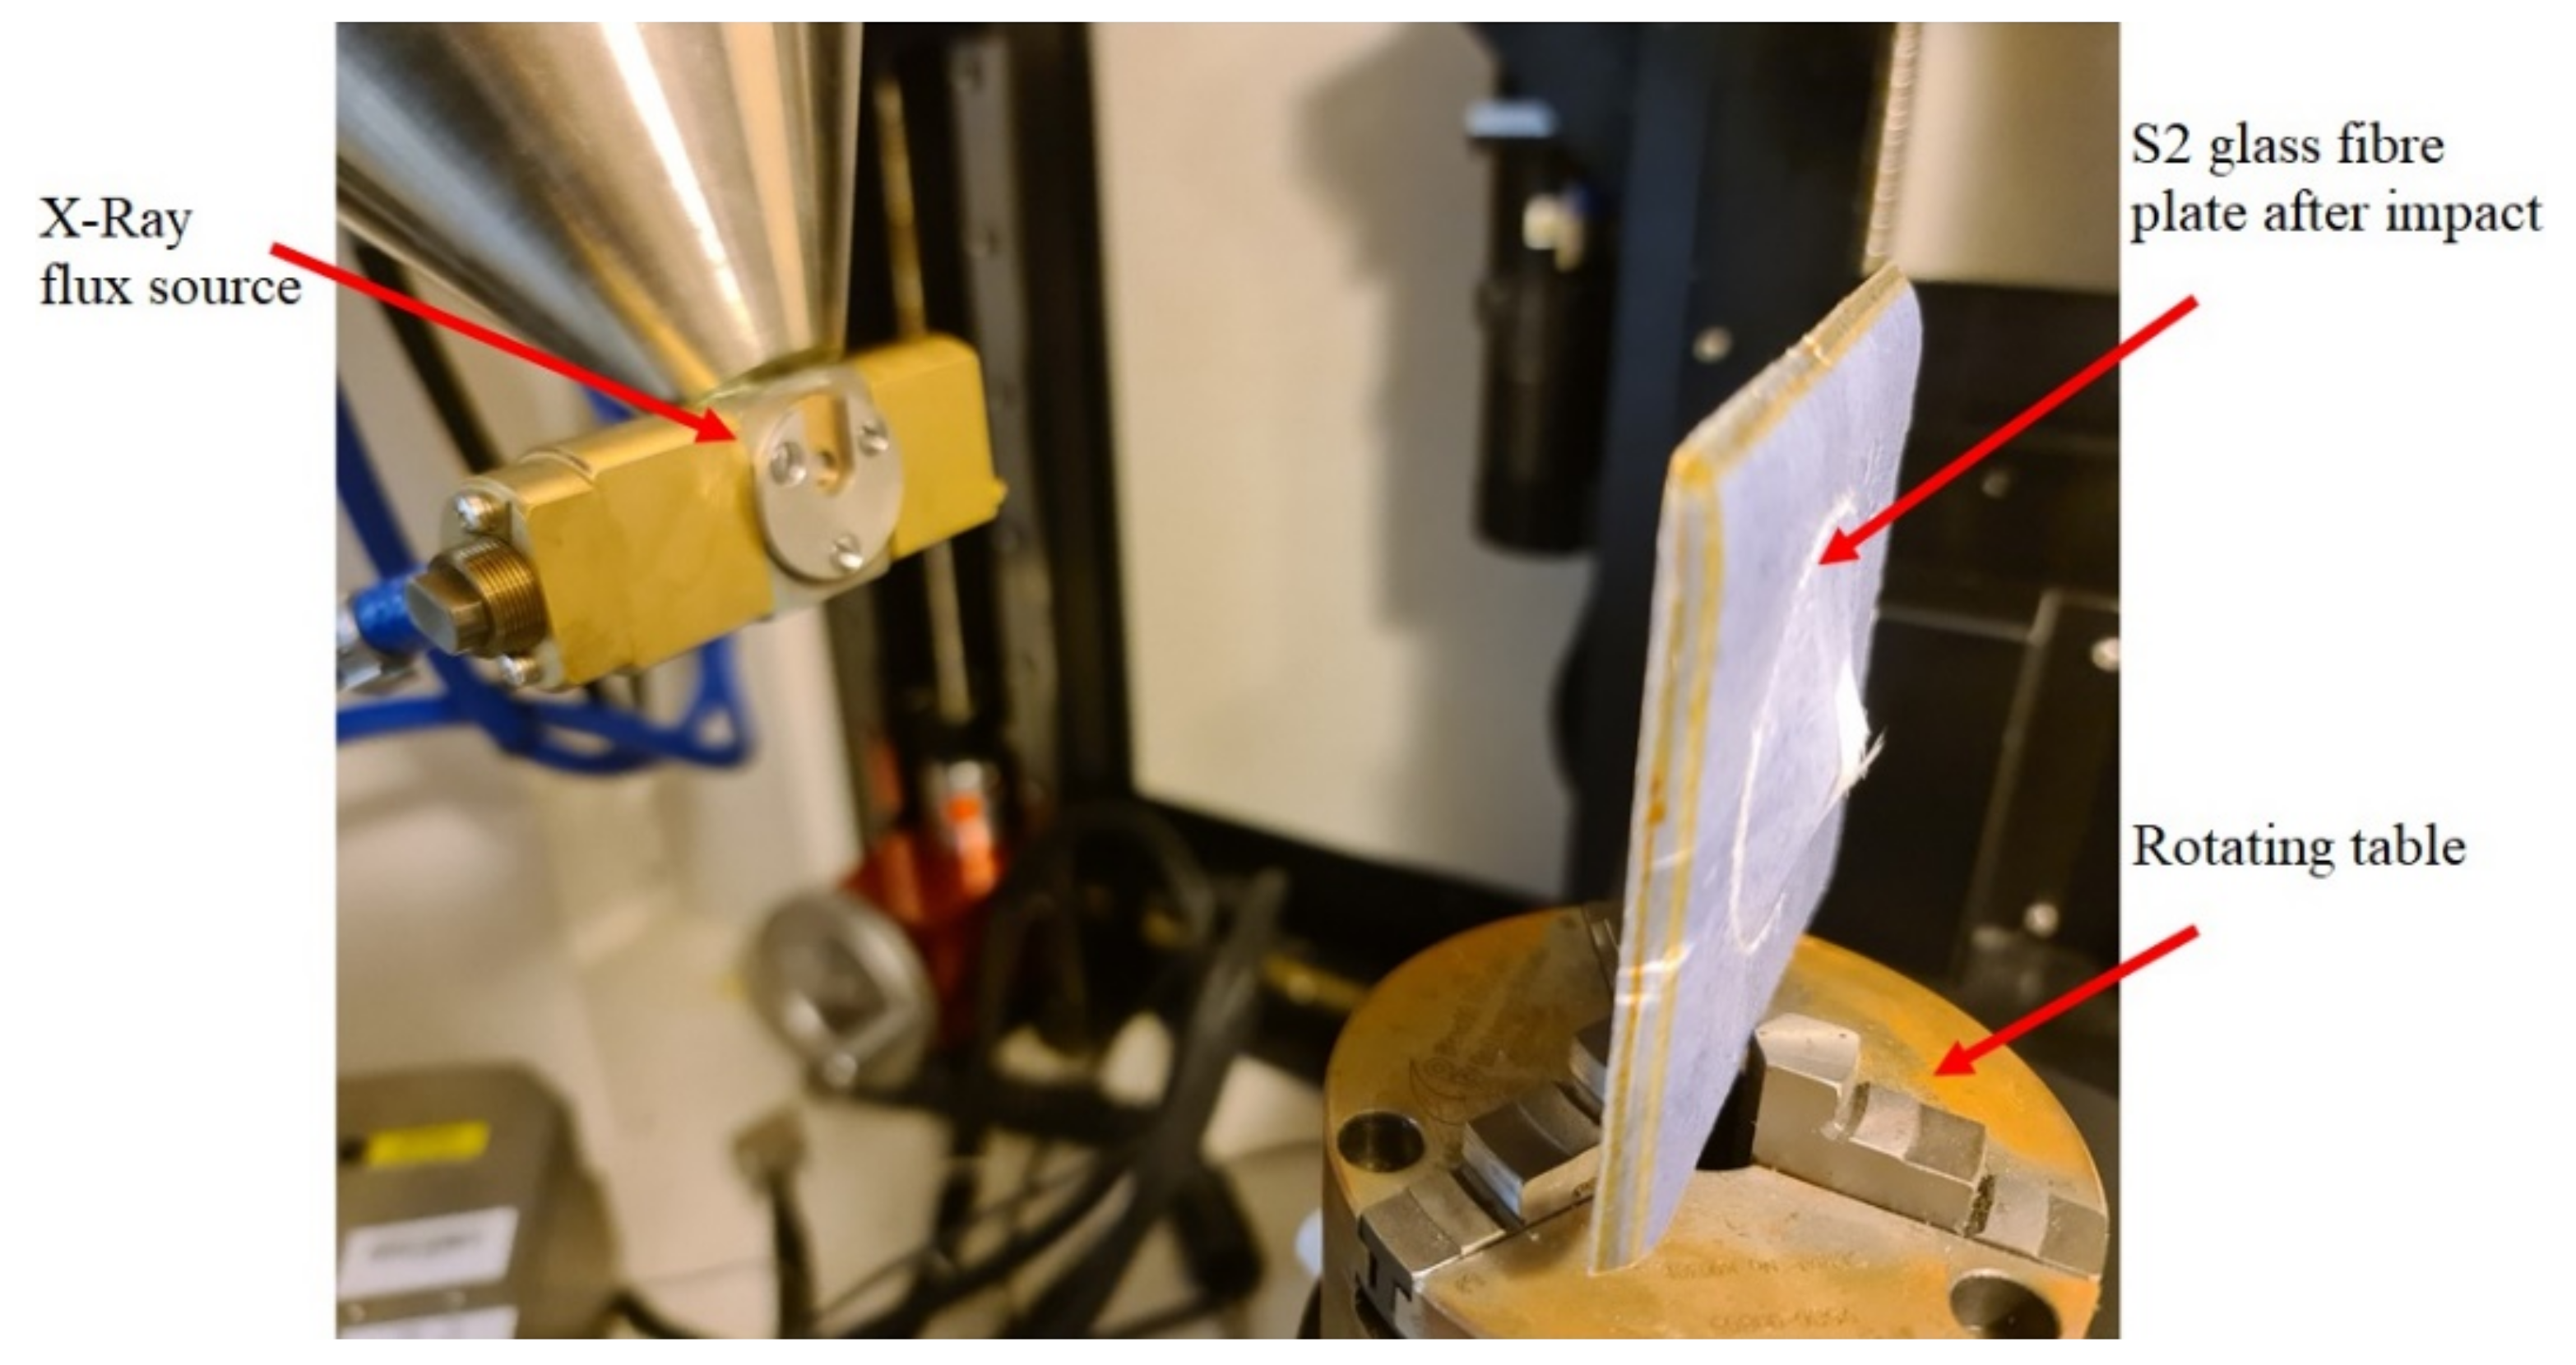
2.3. Computerised Tomography
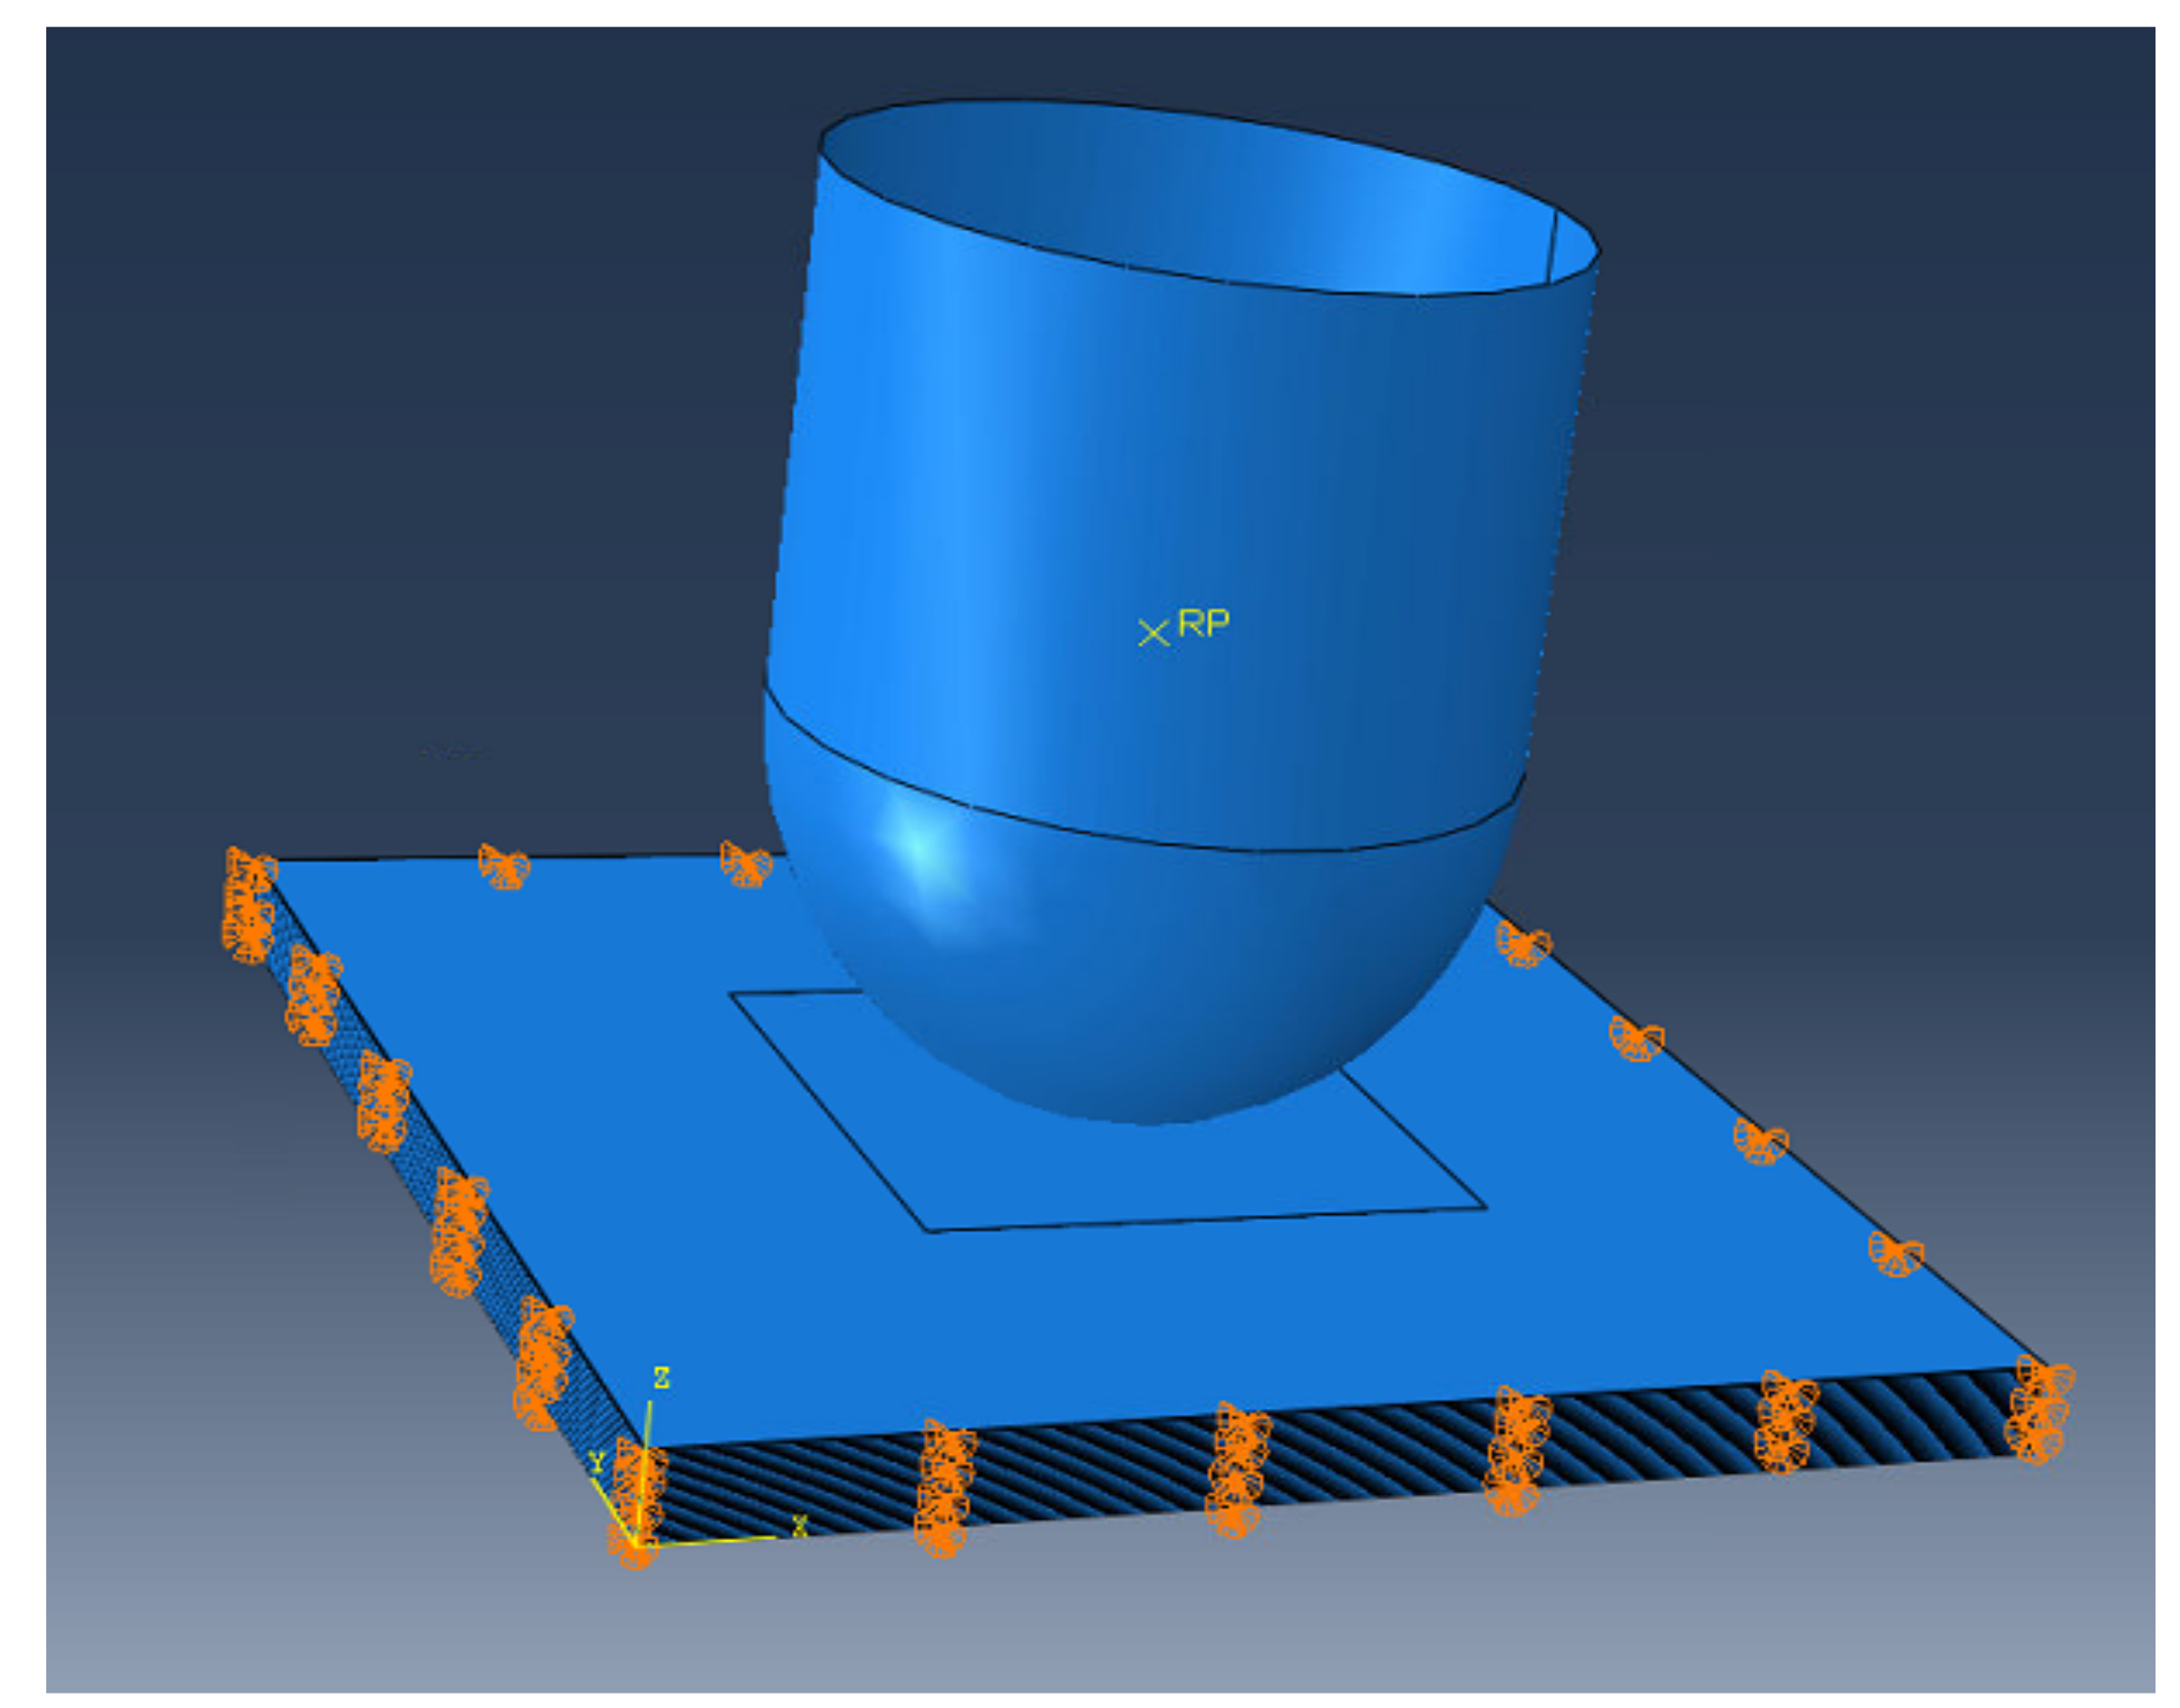
3. Numerical Model
3.1. Intralaminar Damage Model
3.2. Interlaminar Damage Model at Interfaces
3.3. Numerical Implementation
4. Results and Discussion
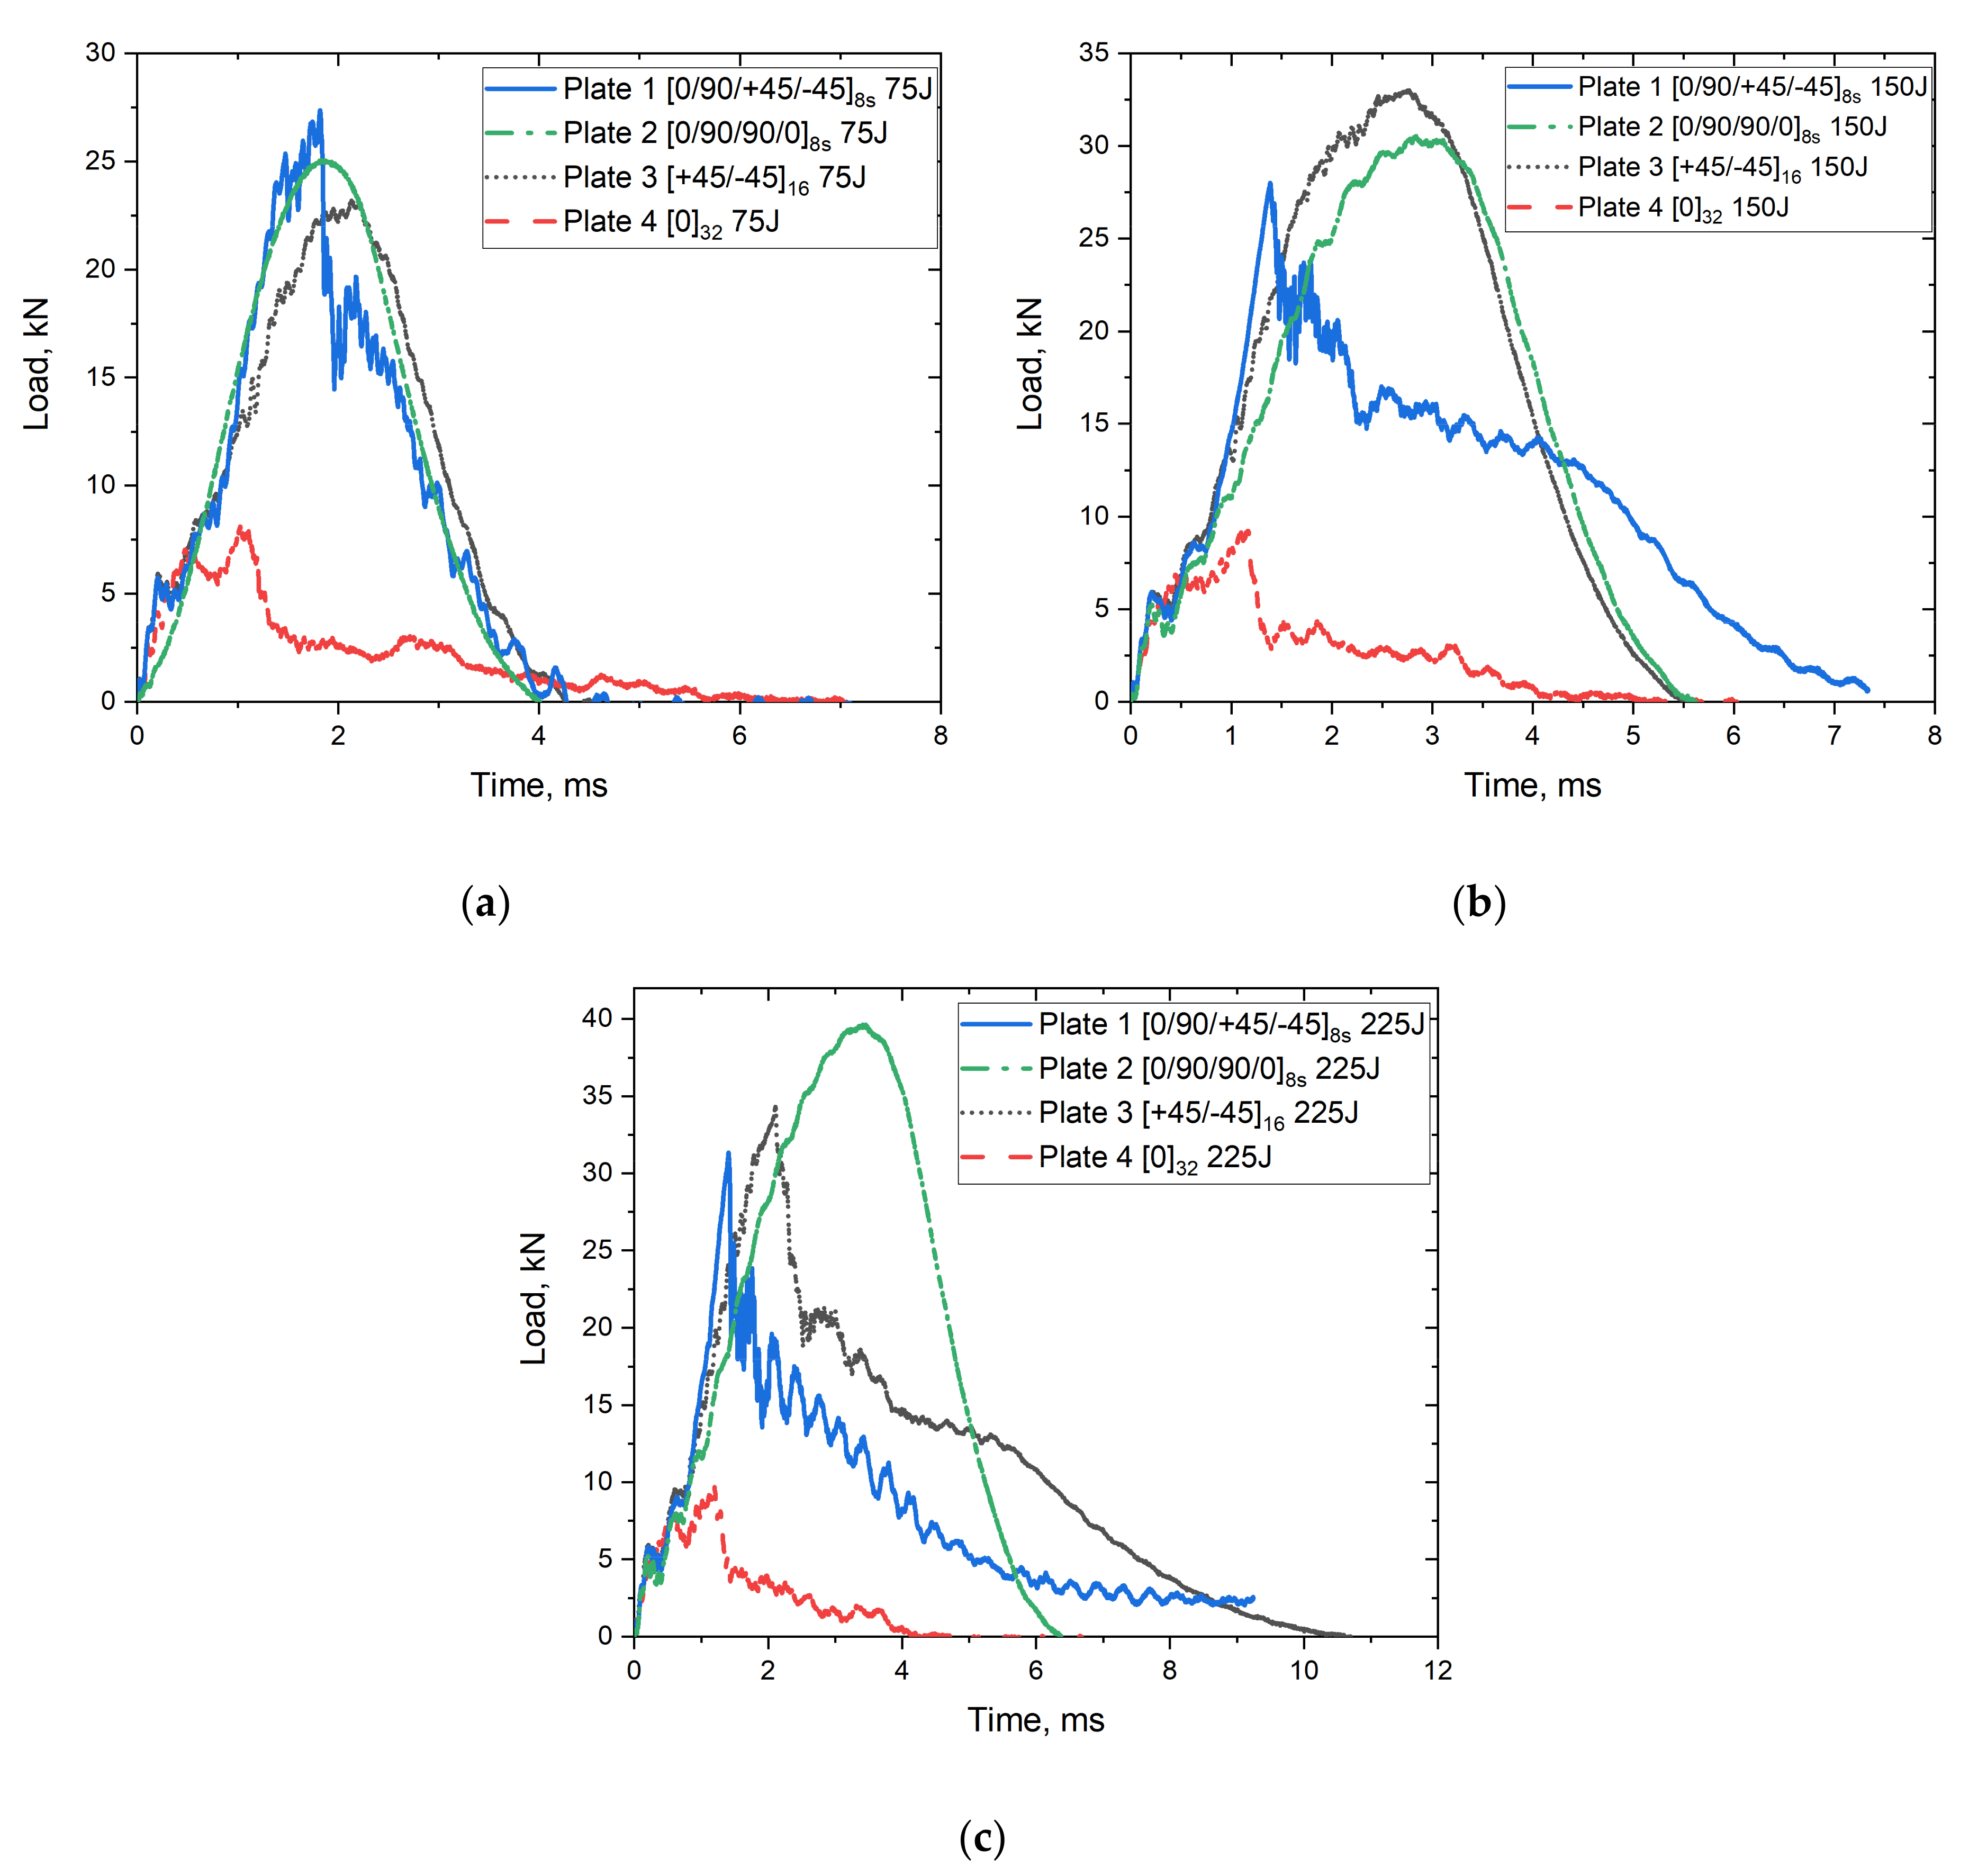
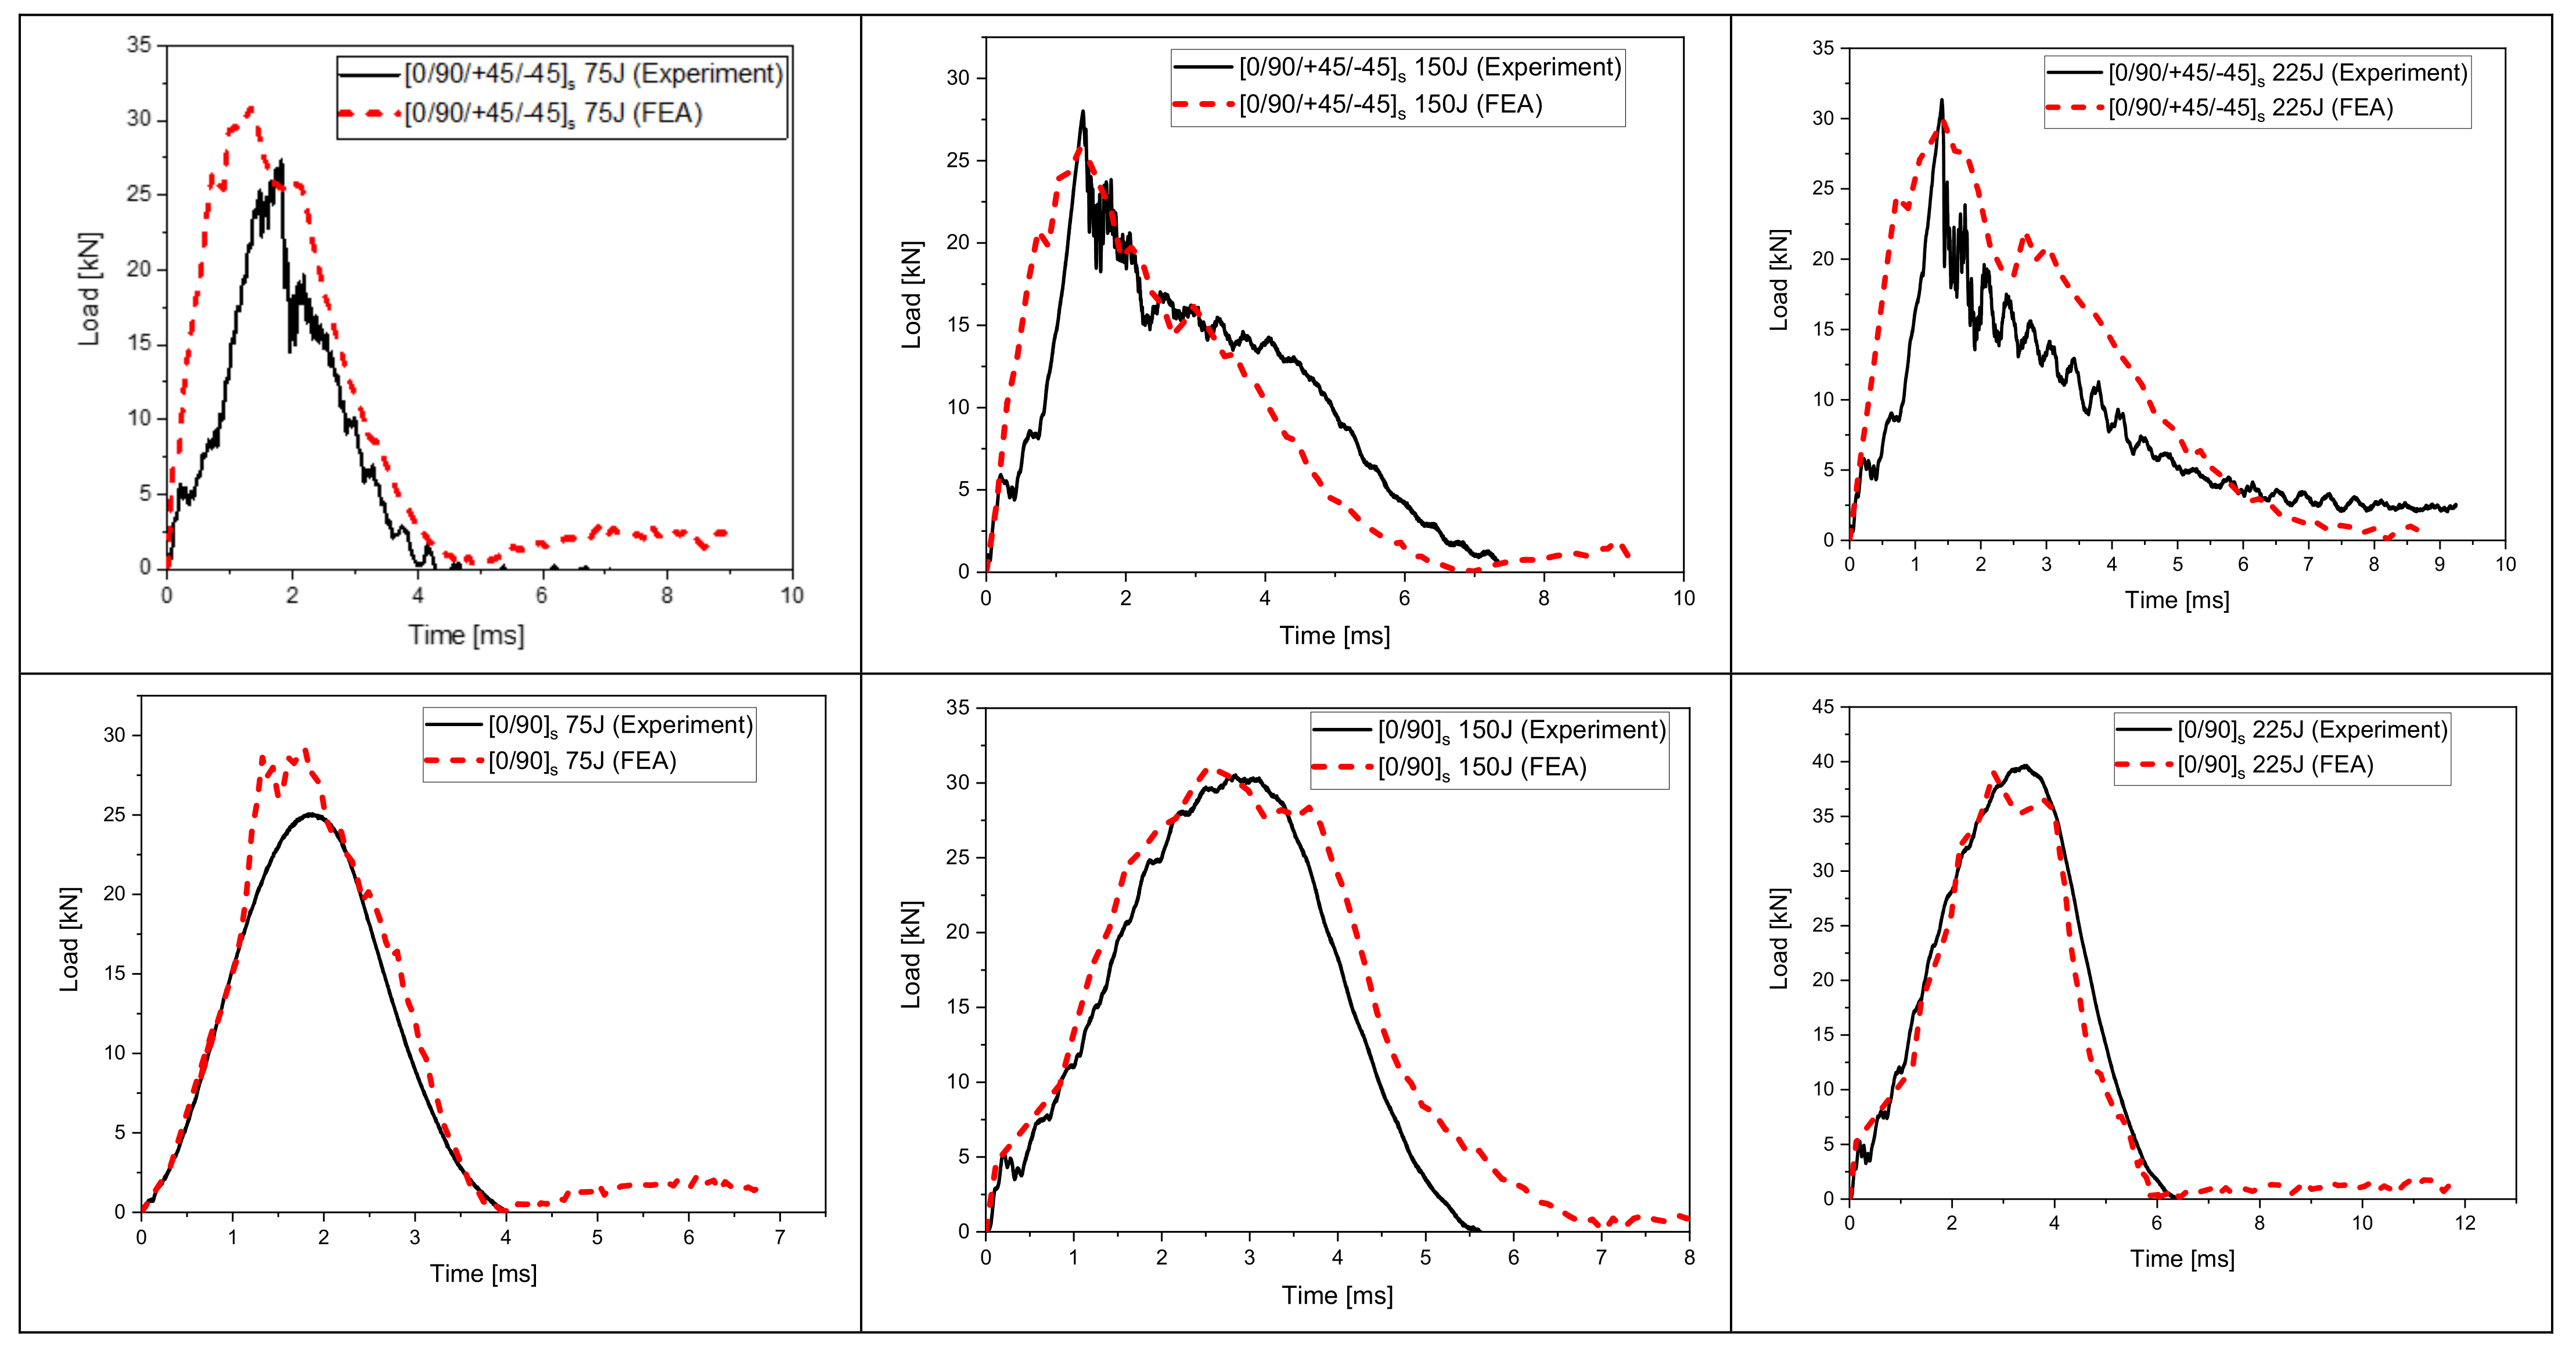
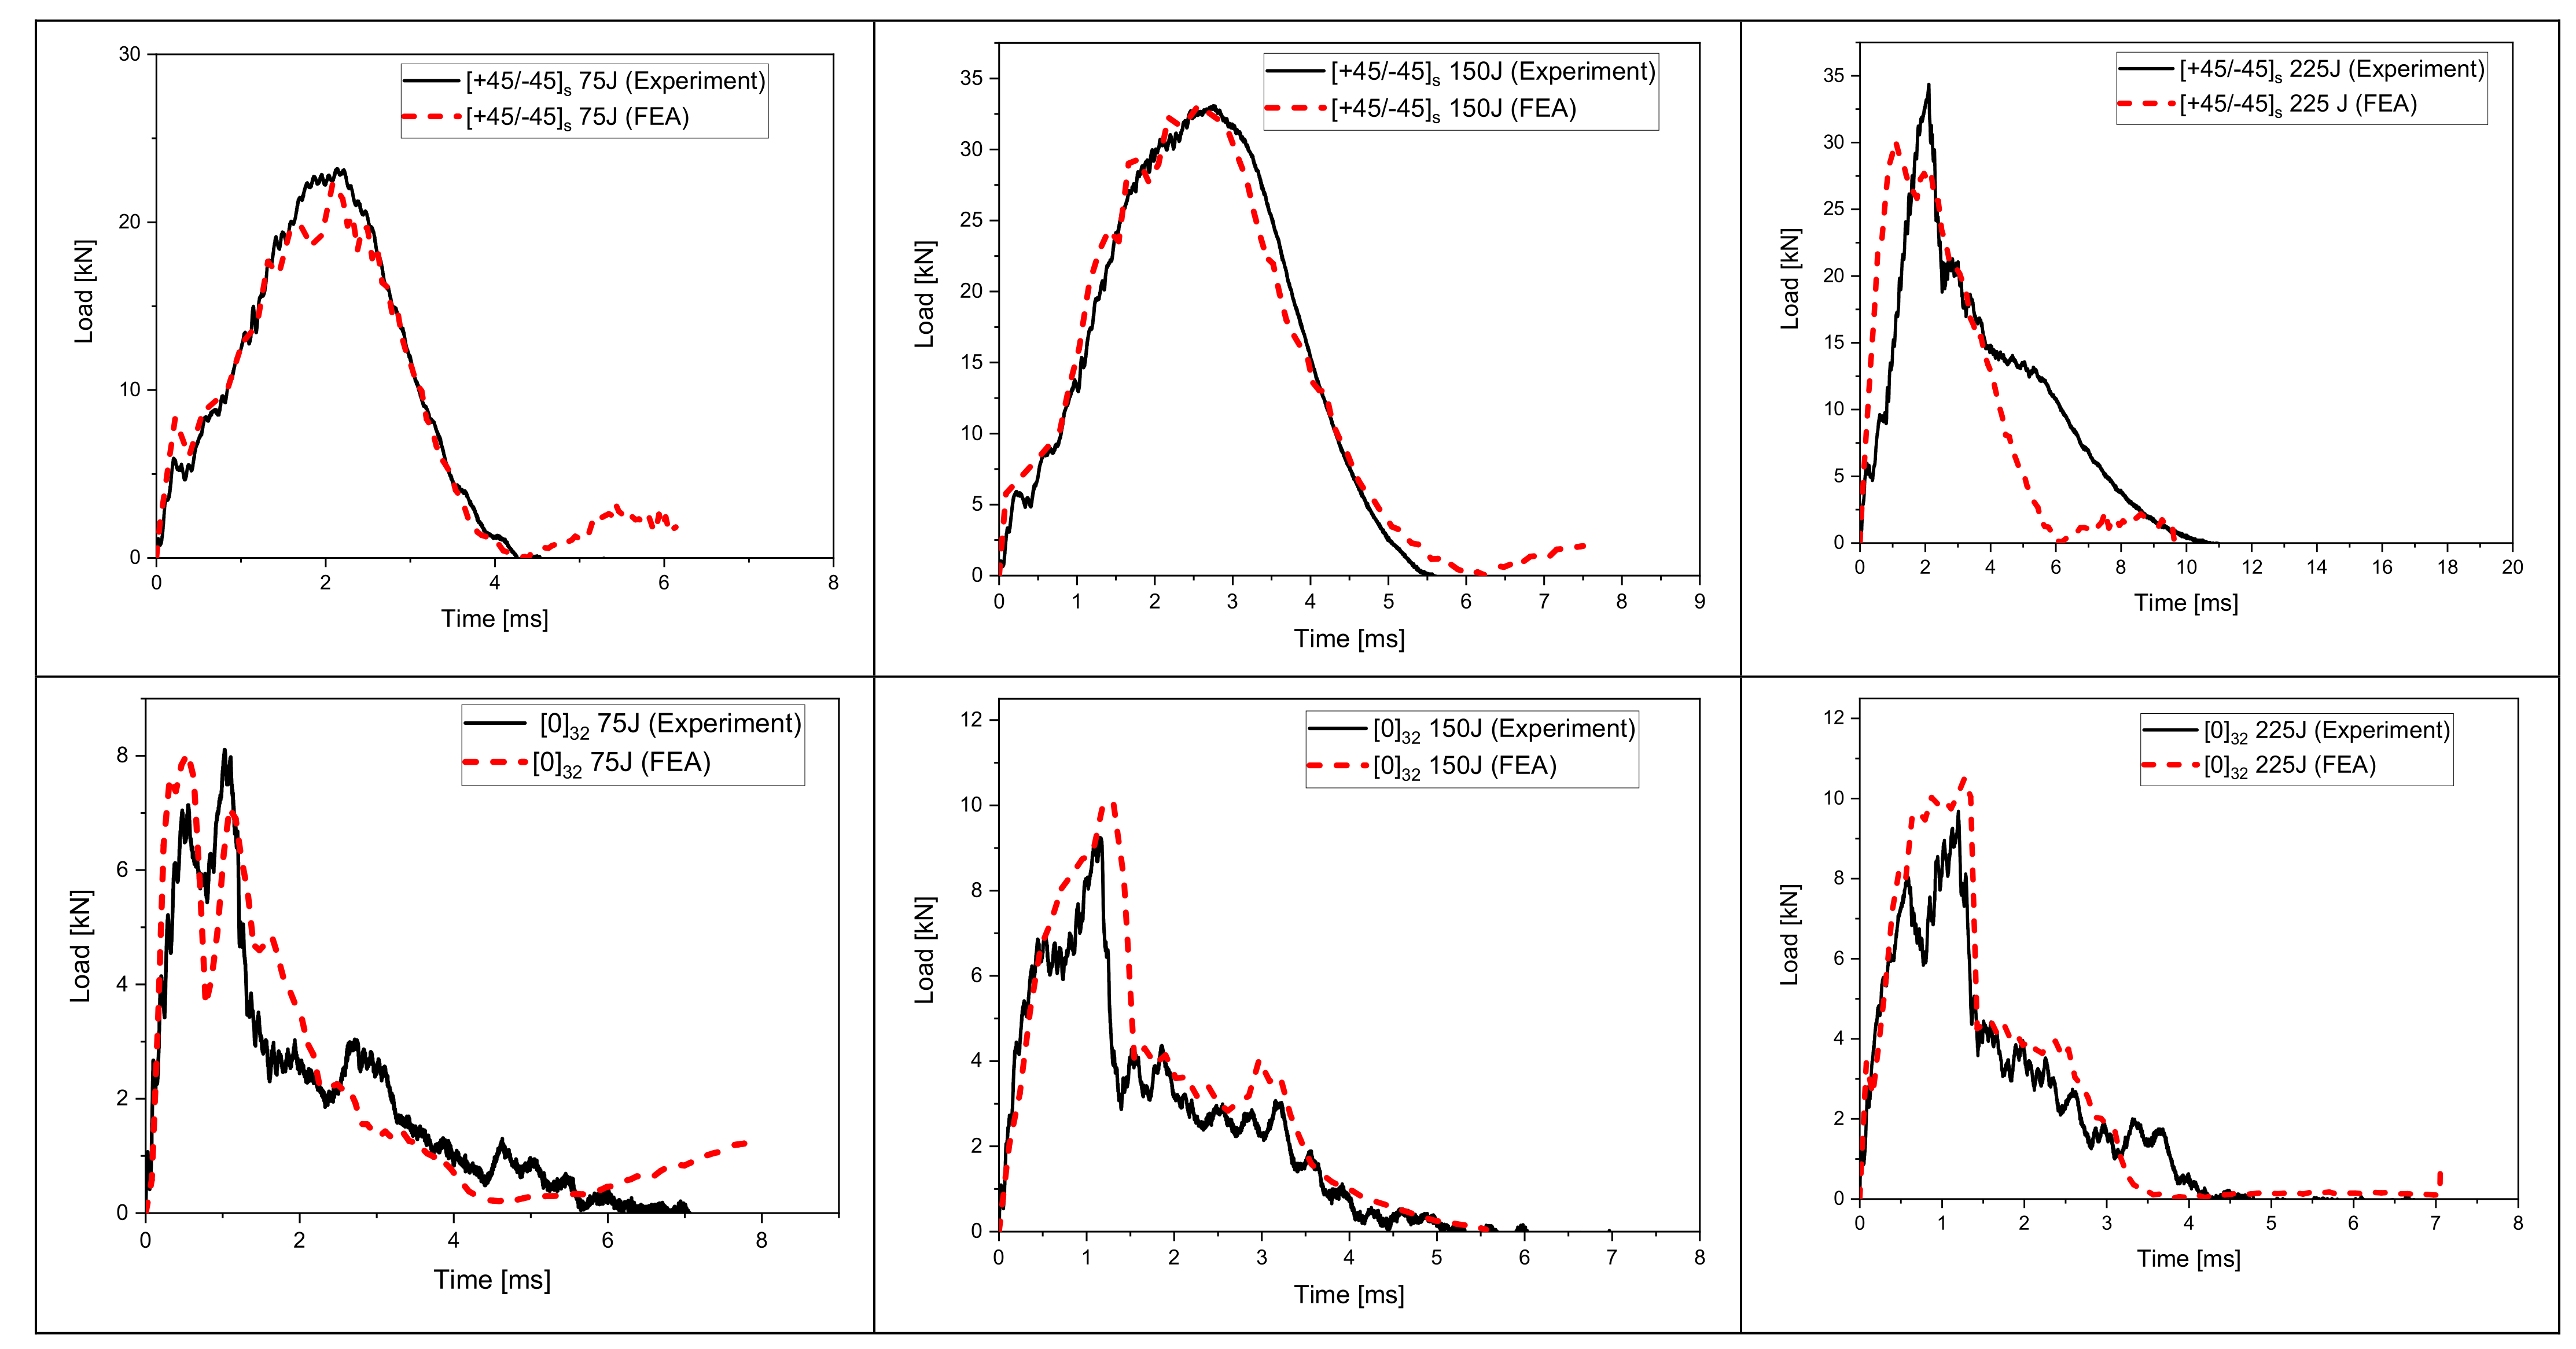
4.1. Load Time Response
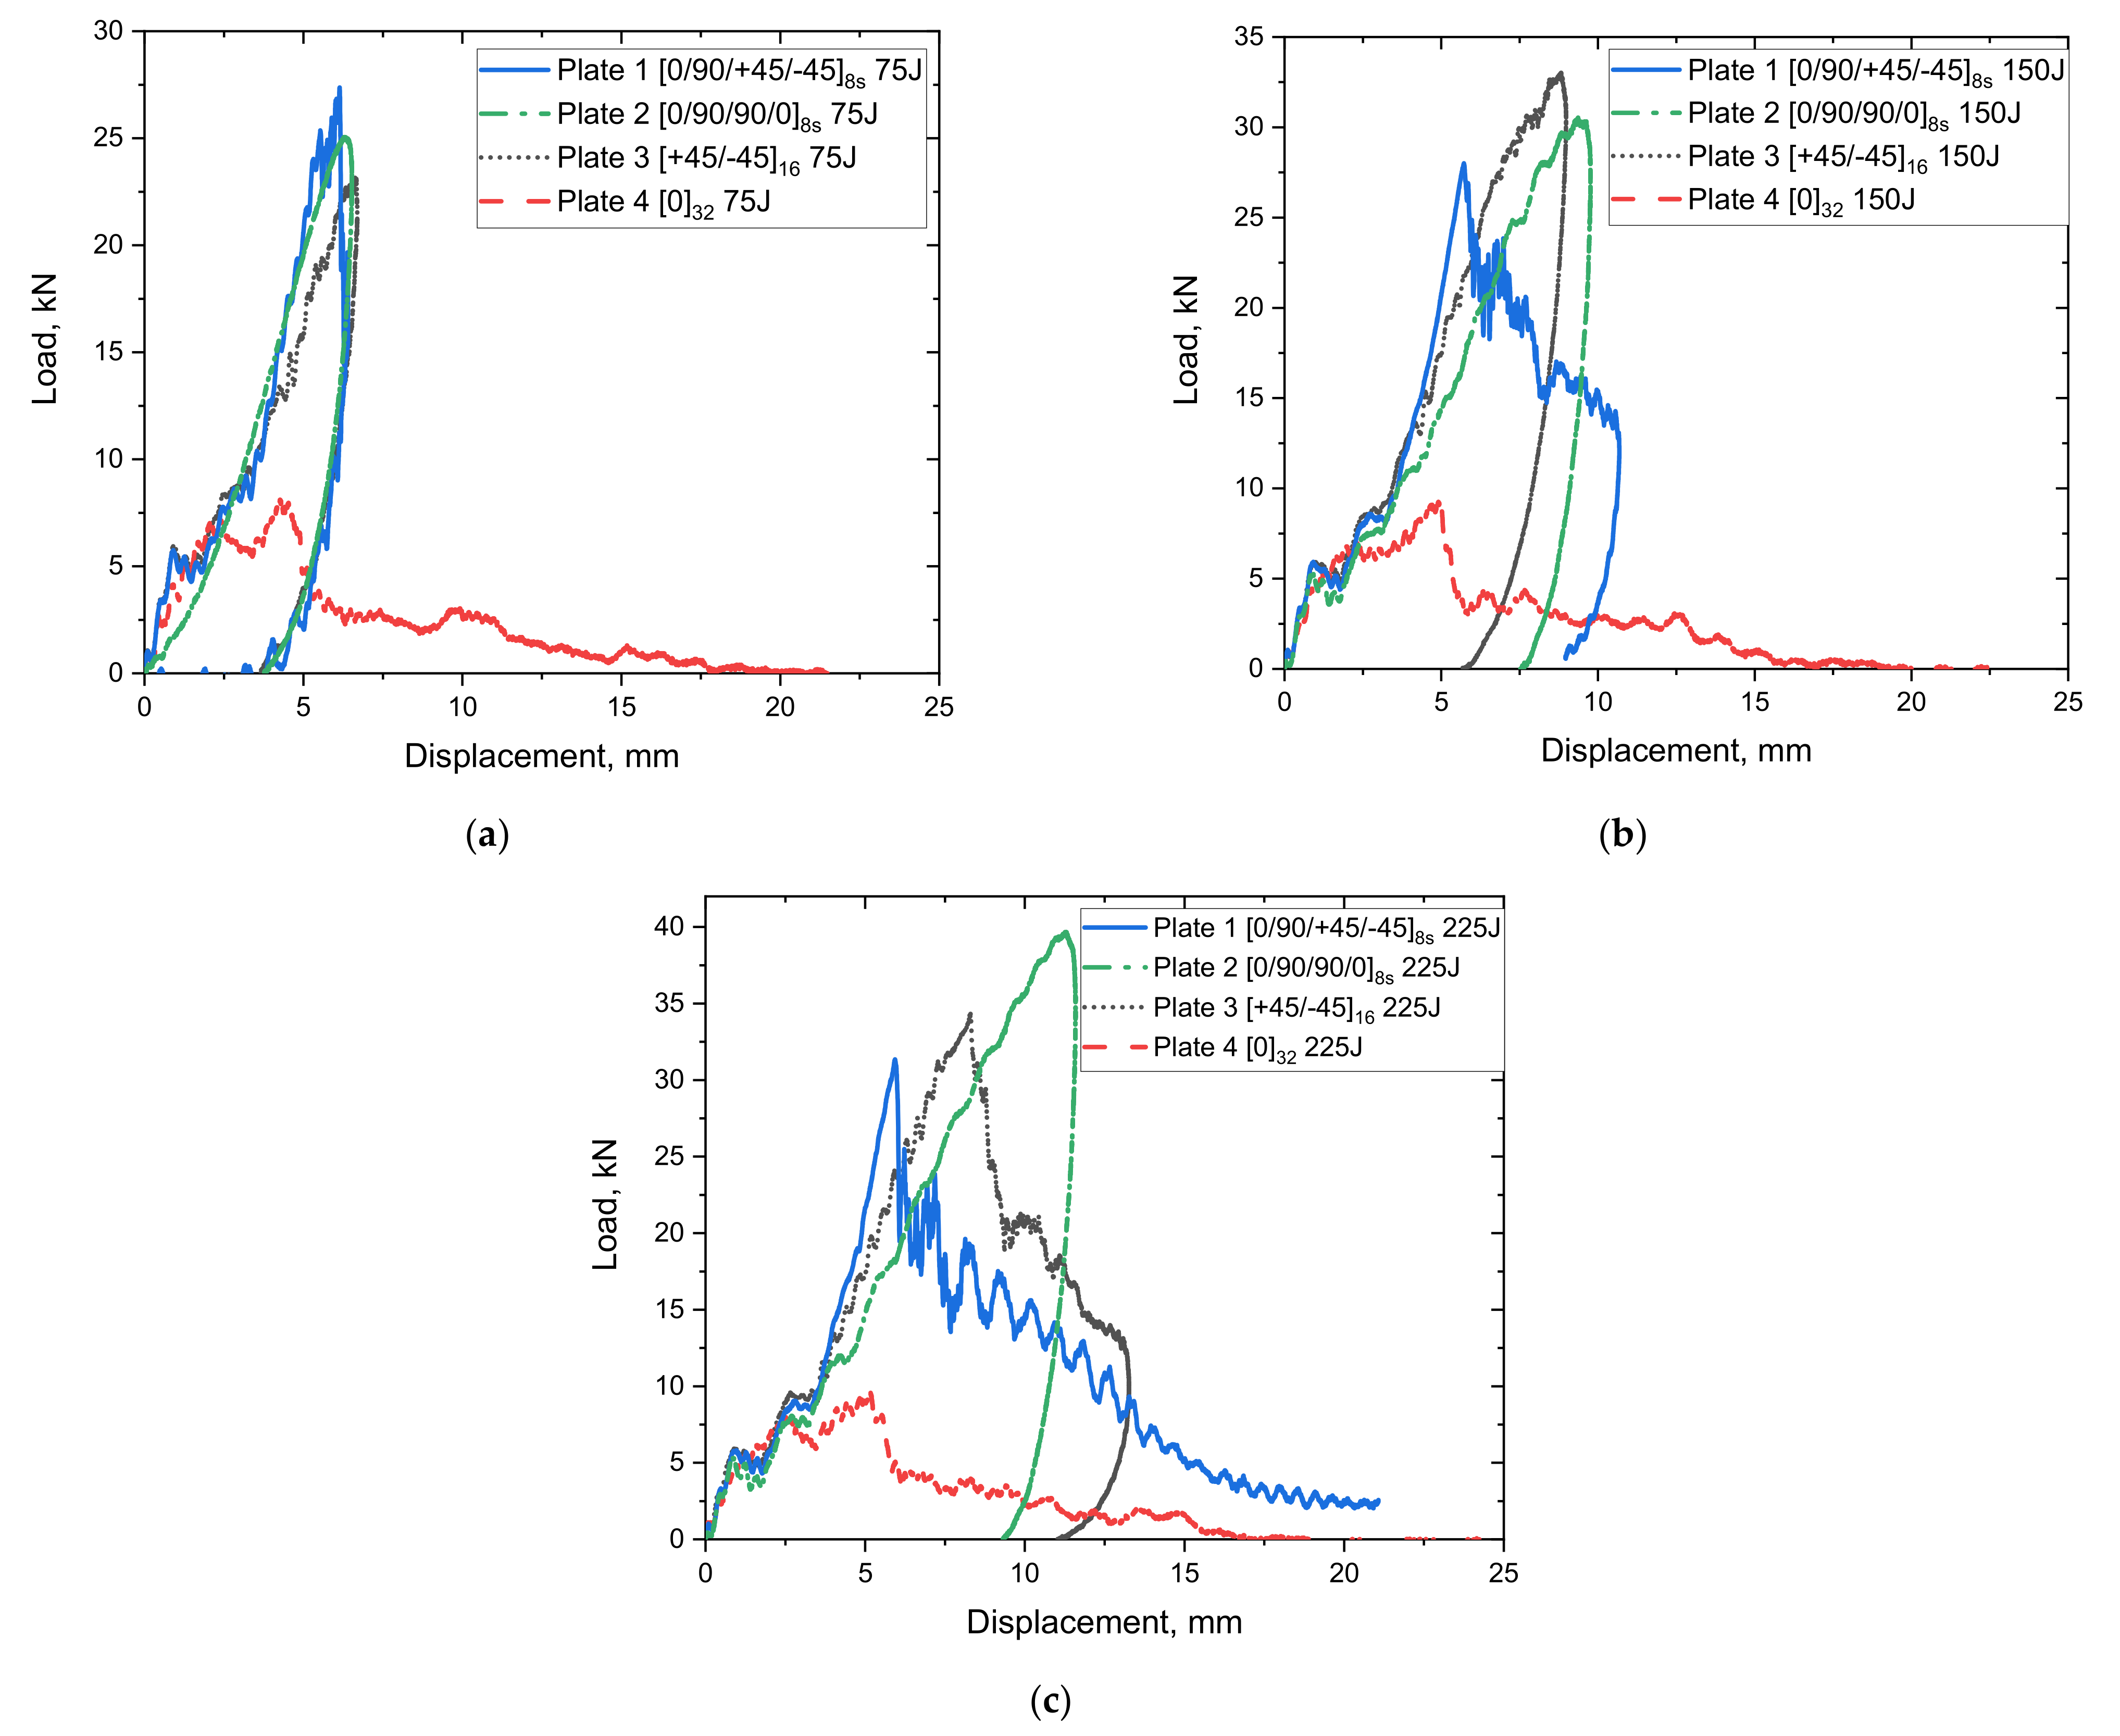
4.2. Load Displacement Response
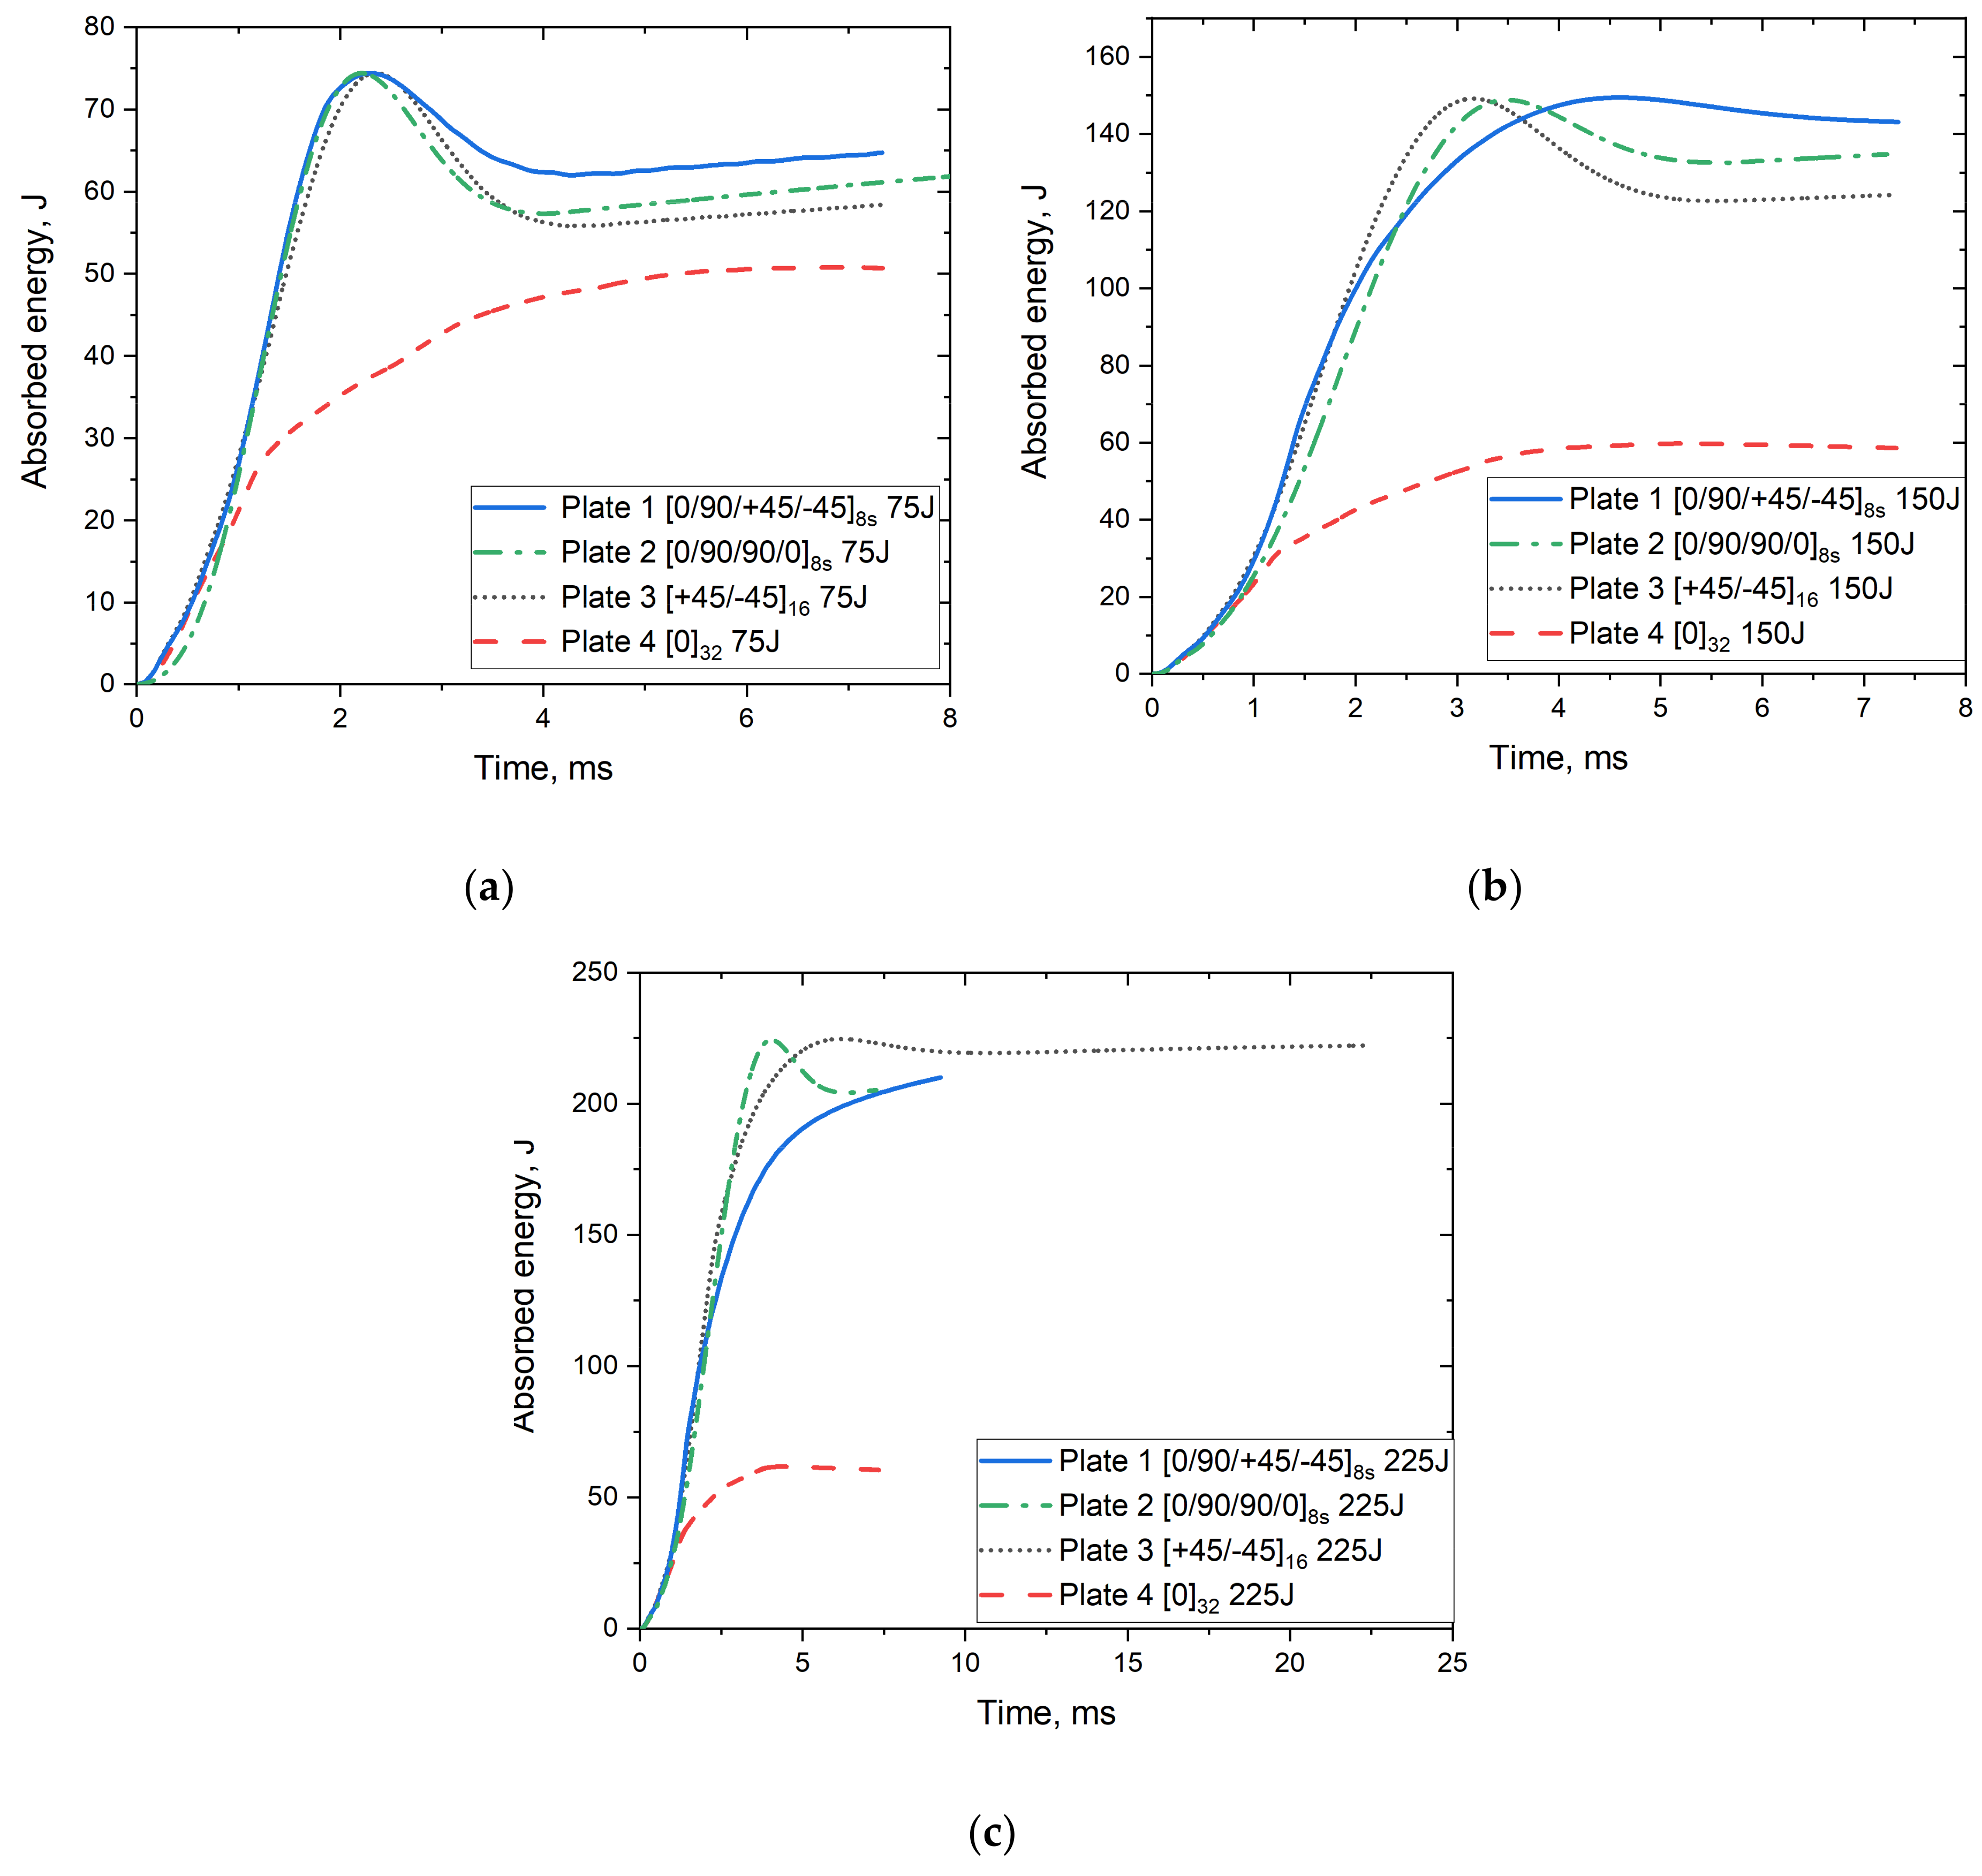
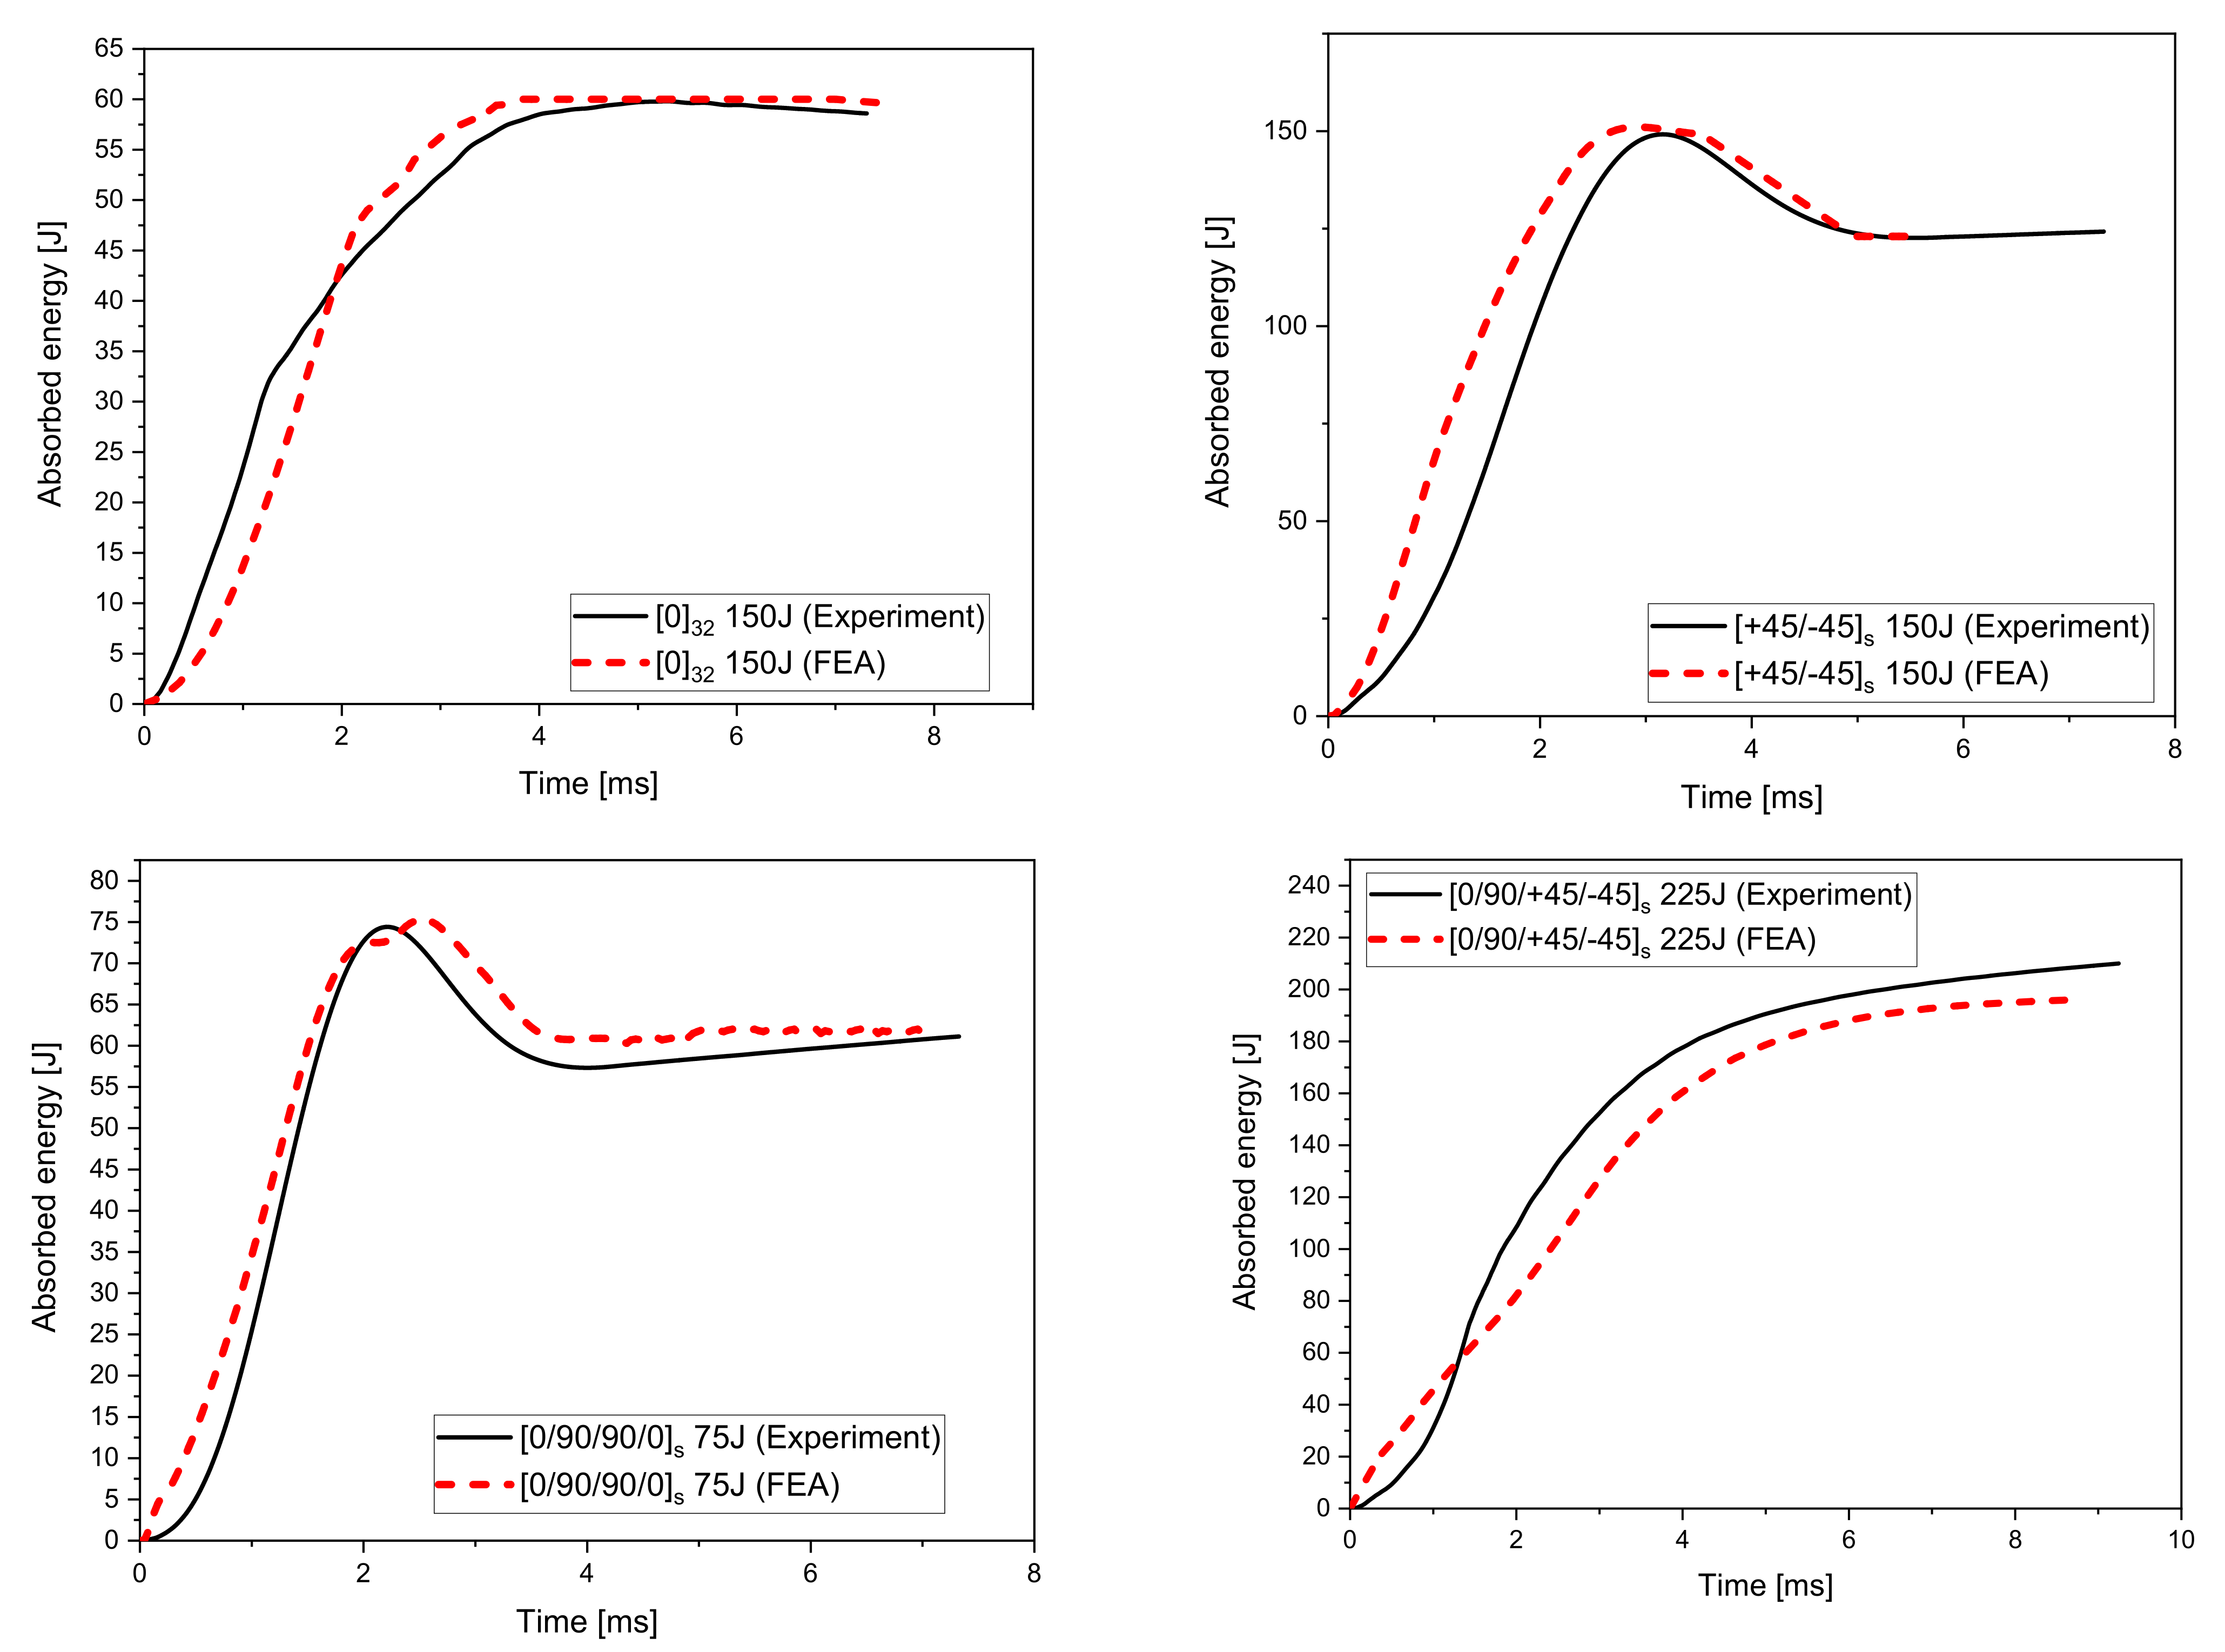
4.3. Absorbed Energy Time Response
5. Conclusions
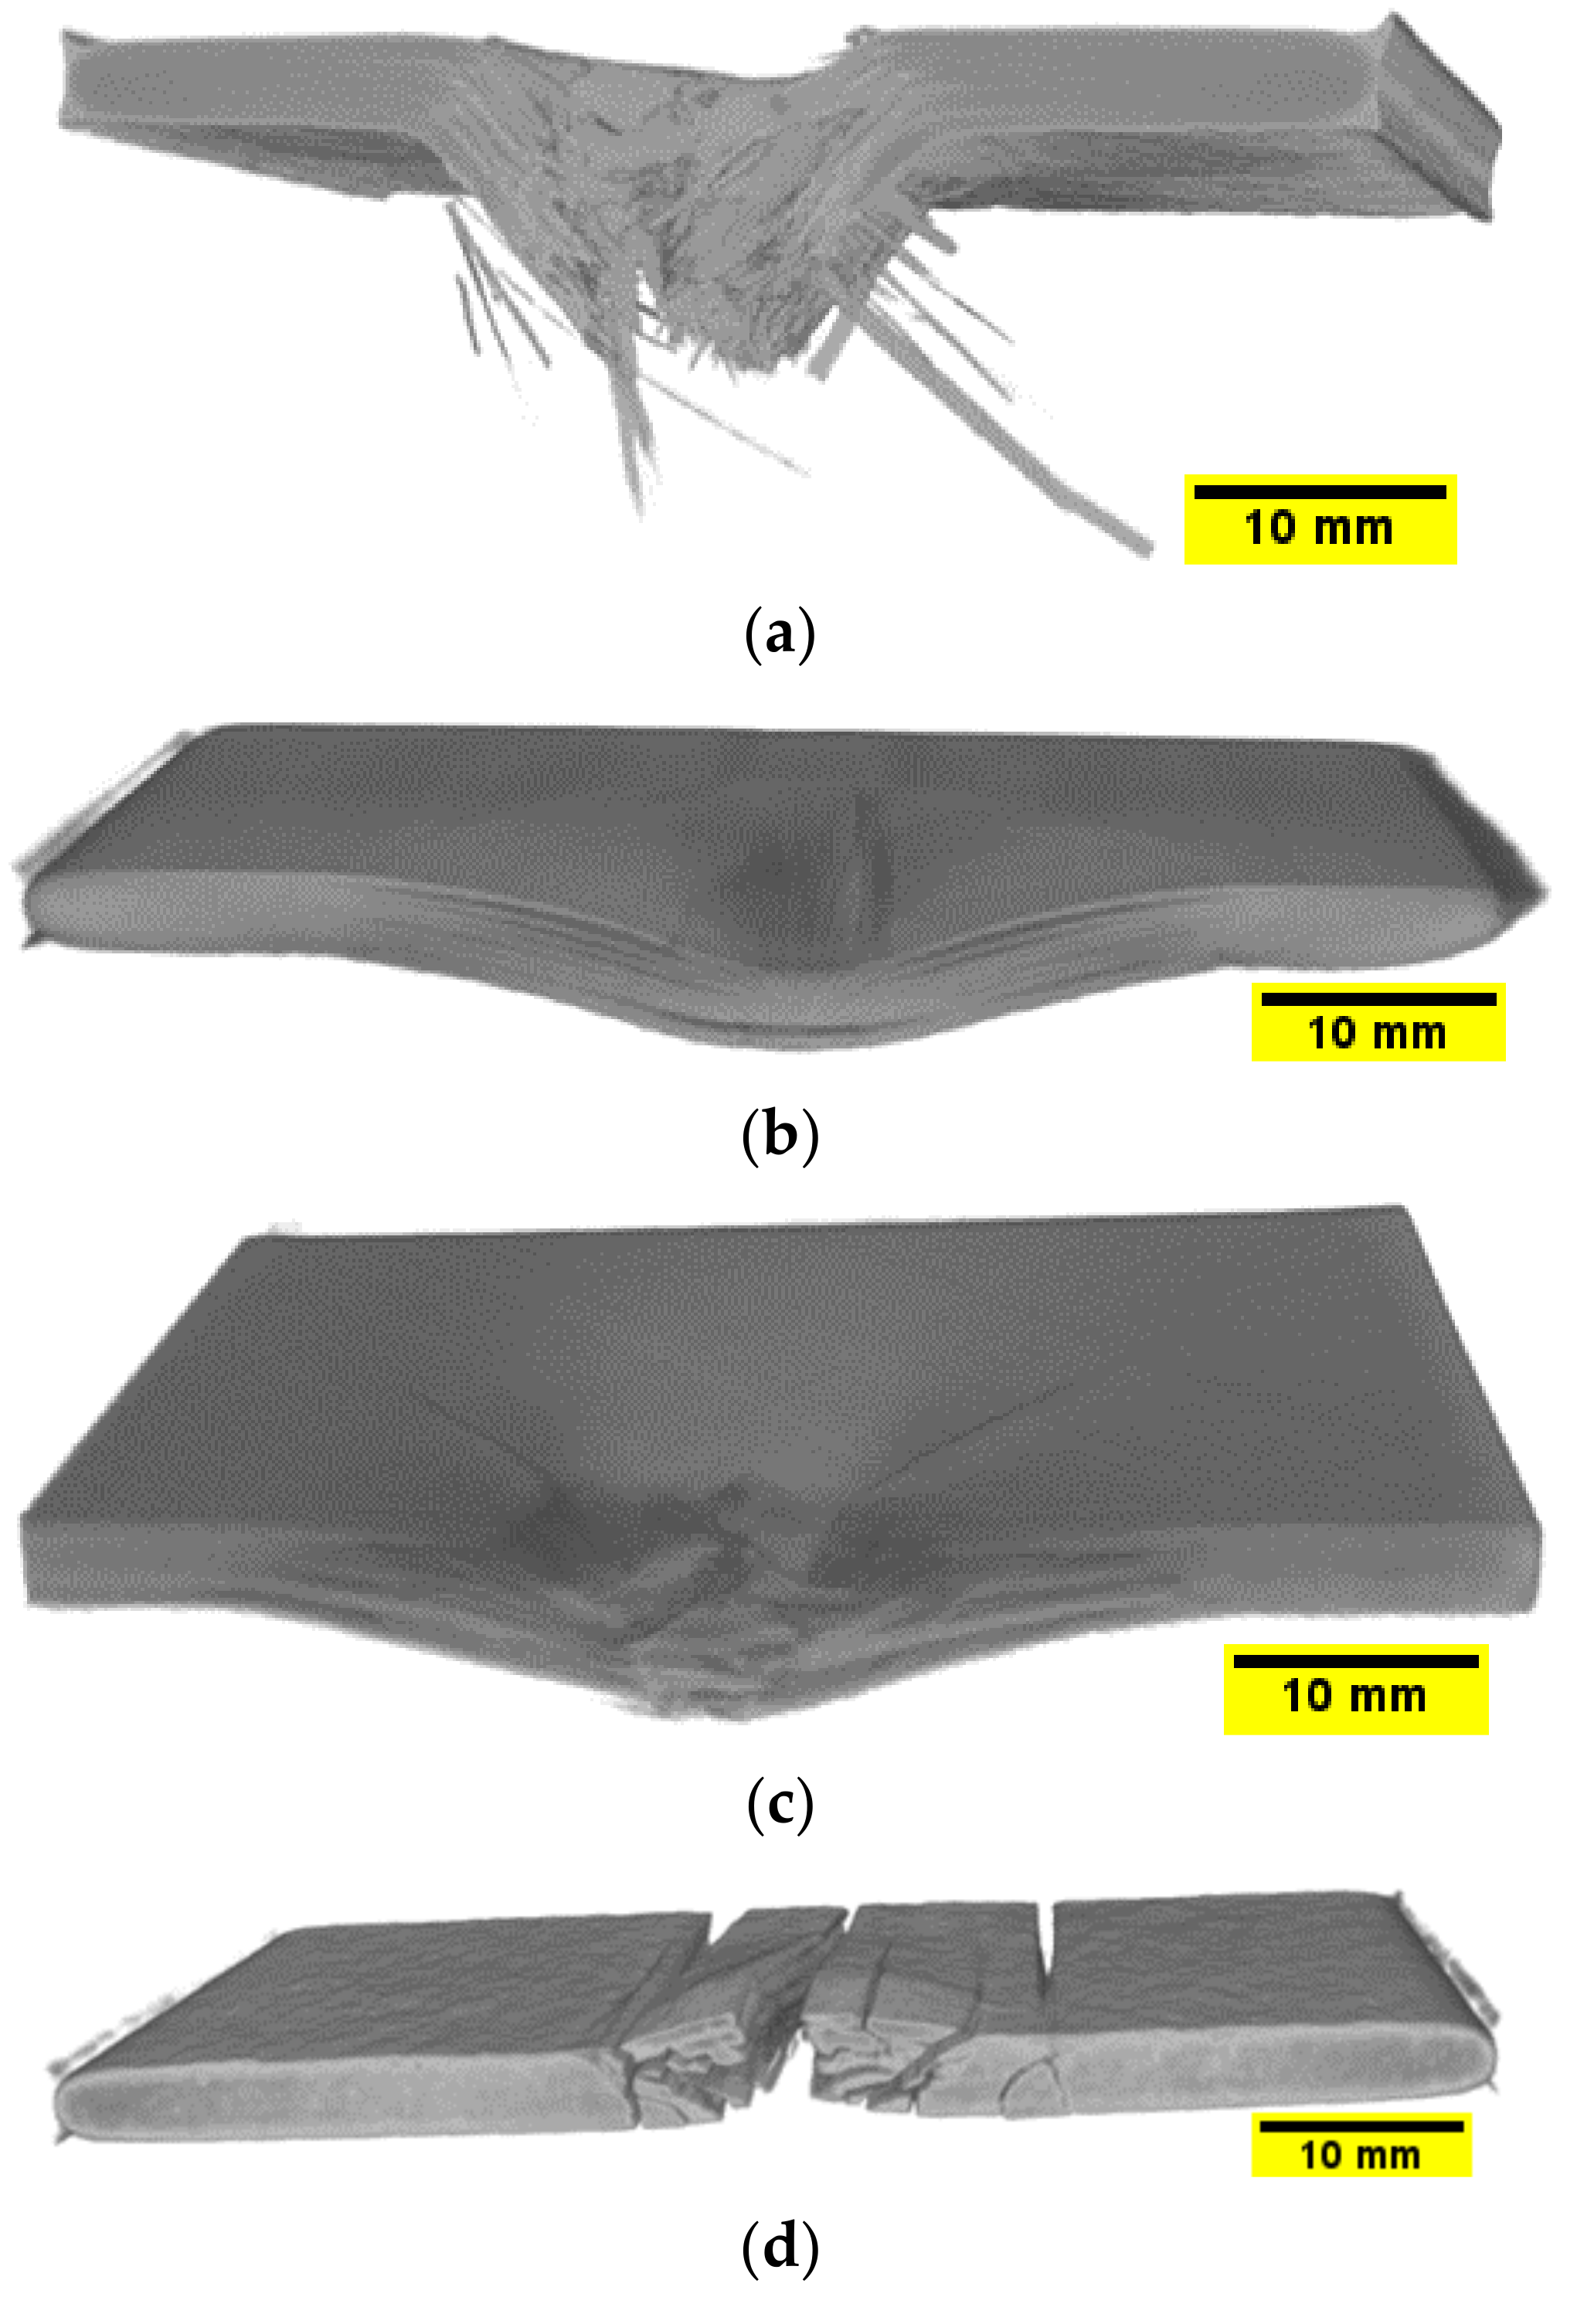
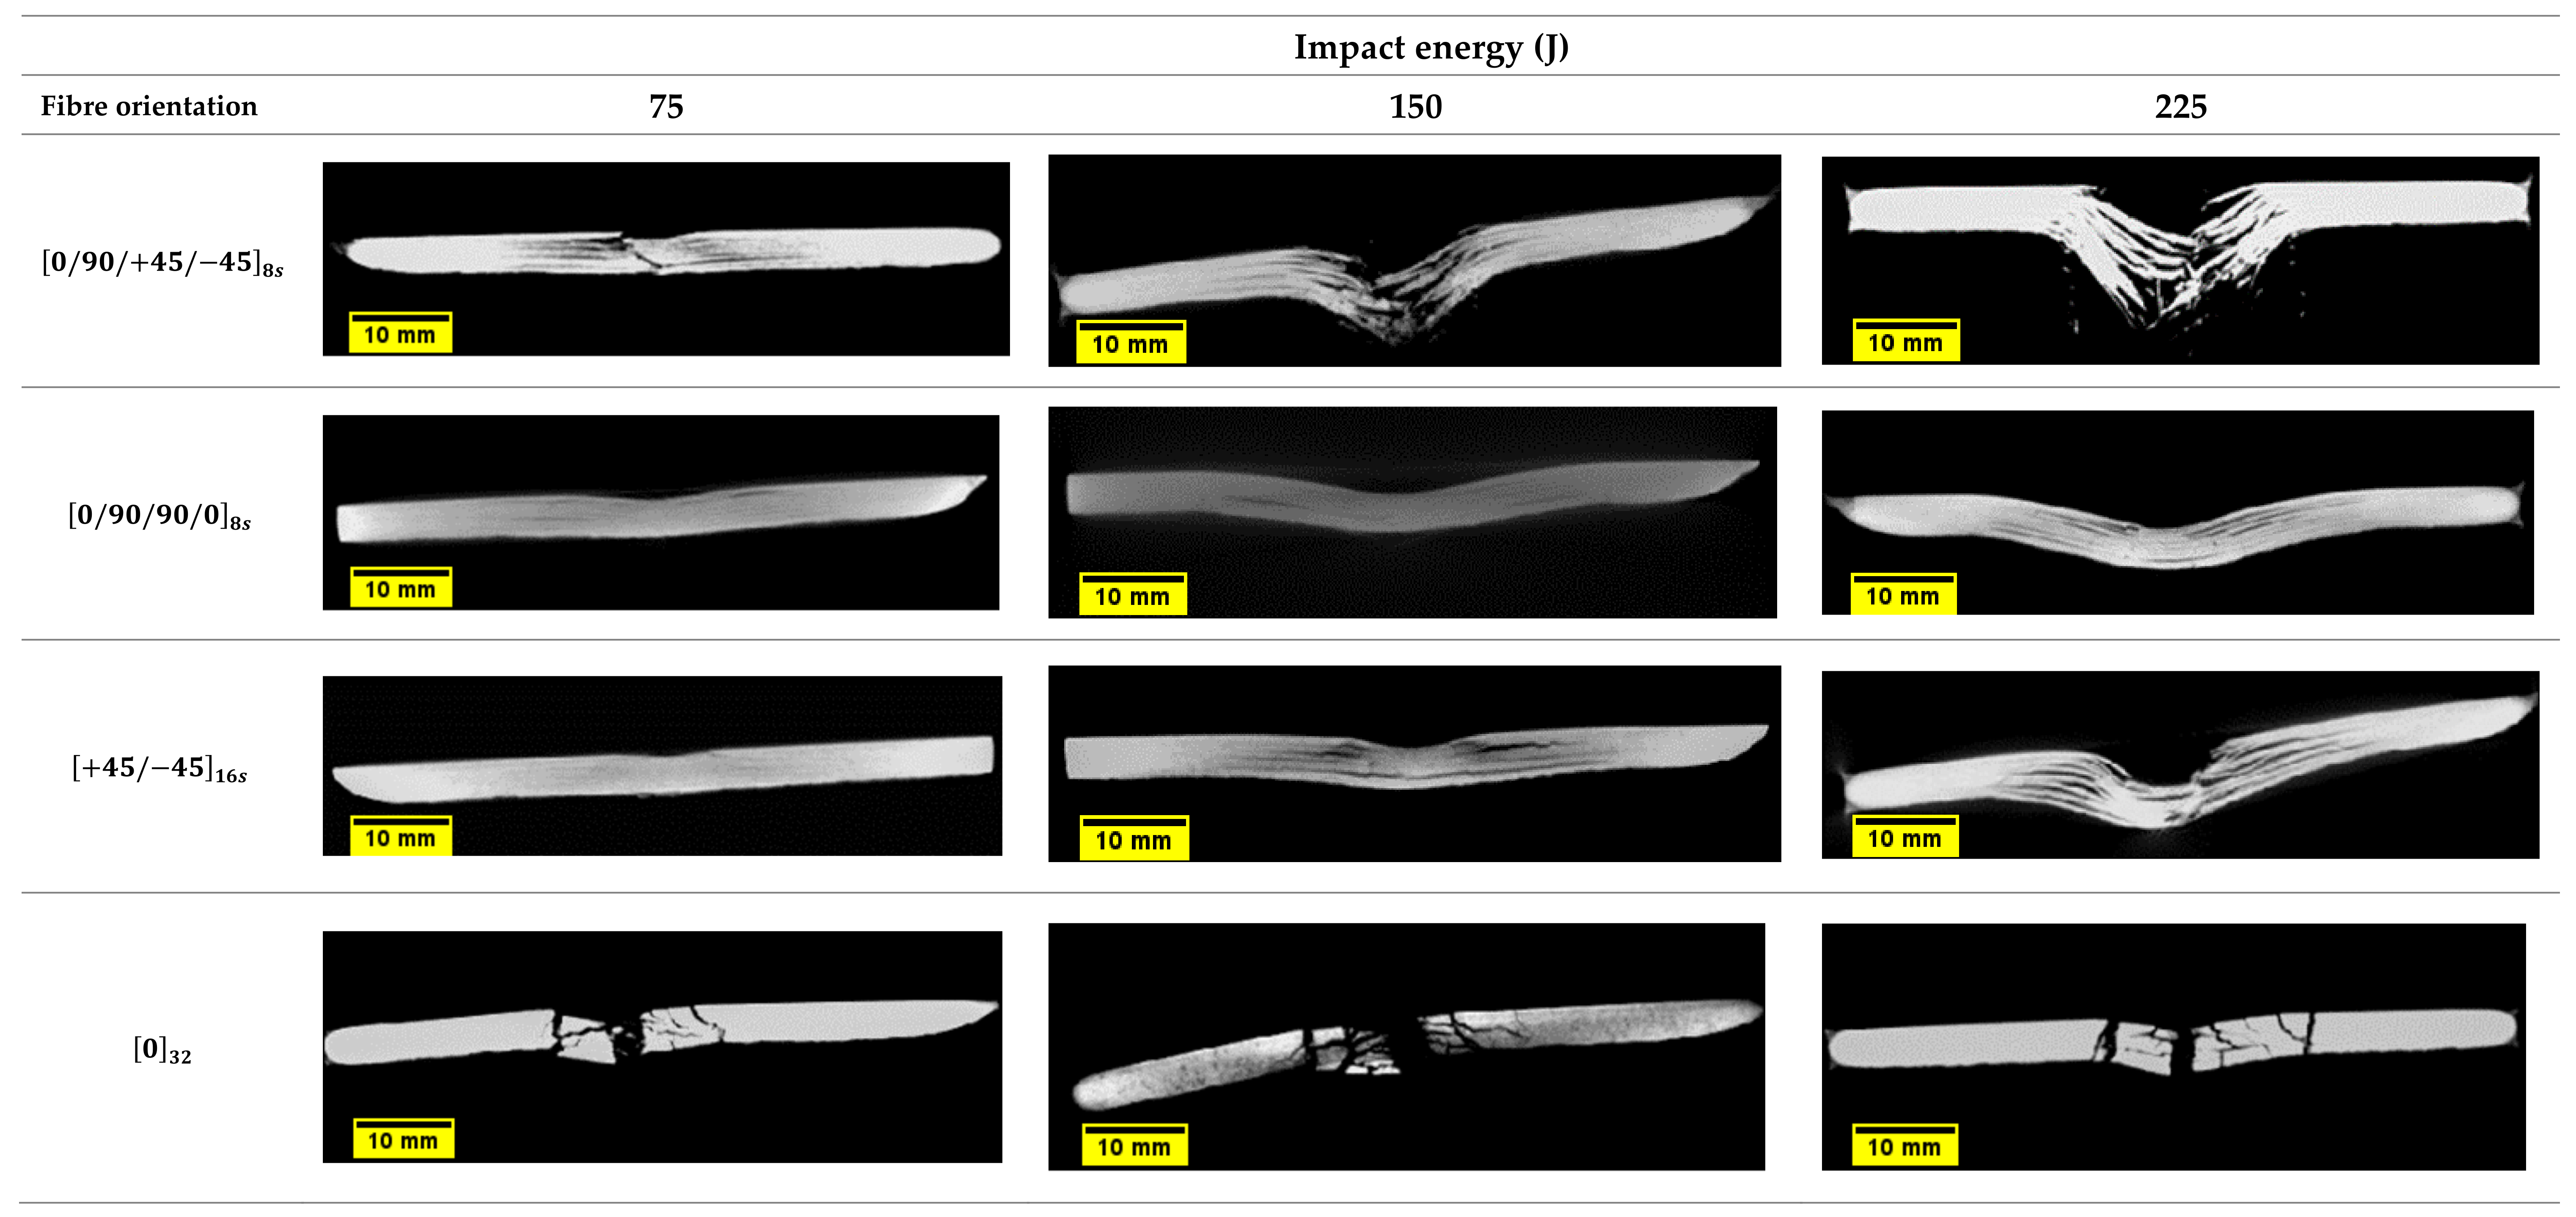
- Plates fabricated usingfibre orientation was the least resistant to impact at all tested energy levels. The samples were severely damaged and failed purely due to shear stresses without delaminating.
- The impact tests showed that the plates with configuration absorbed more energy with less penetration depth than the plates with other stacking configurations.
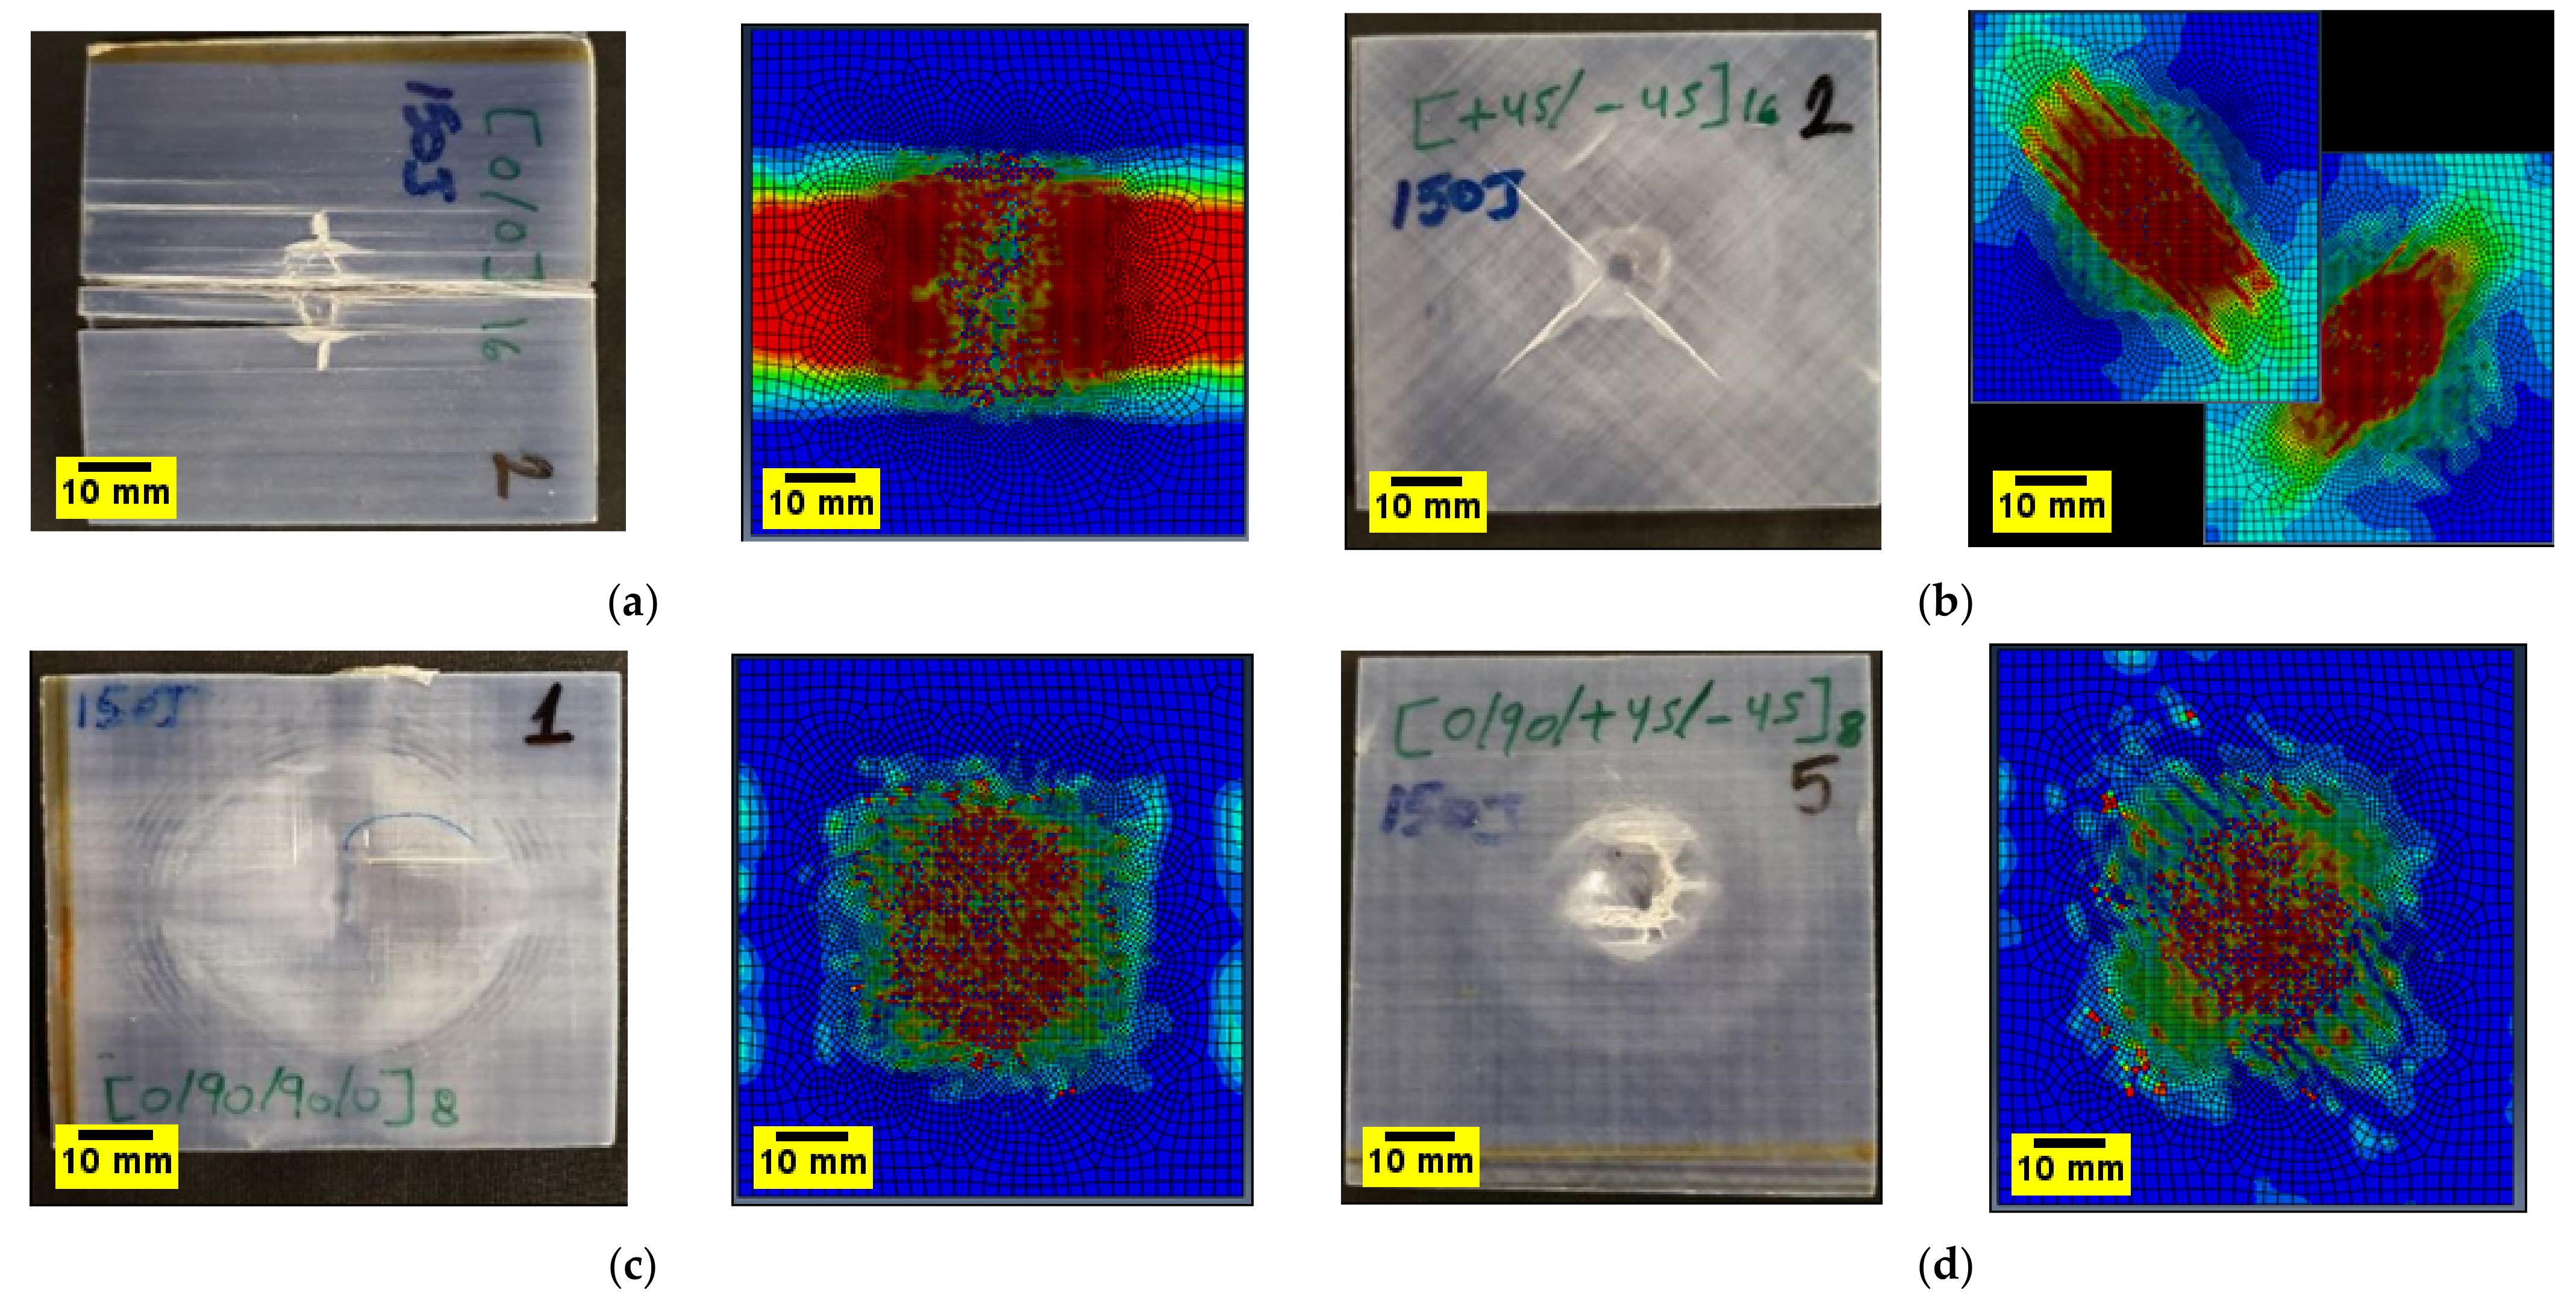
- CT scans revealed that delamination was the main failure mechanism in plates fabricated using , , and orientation.
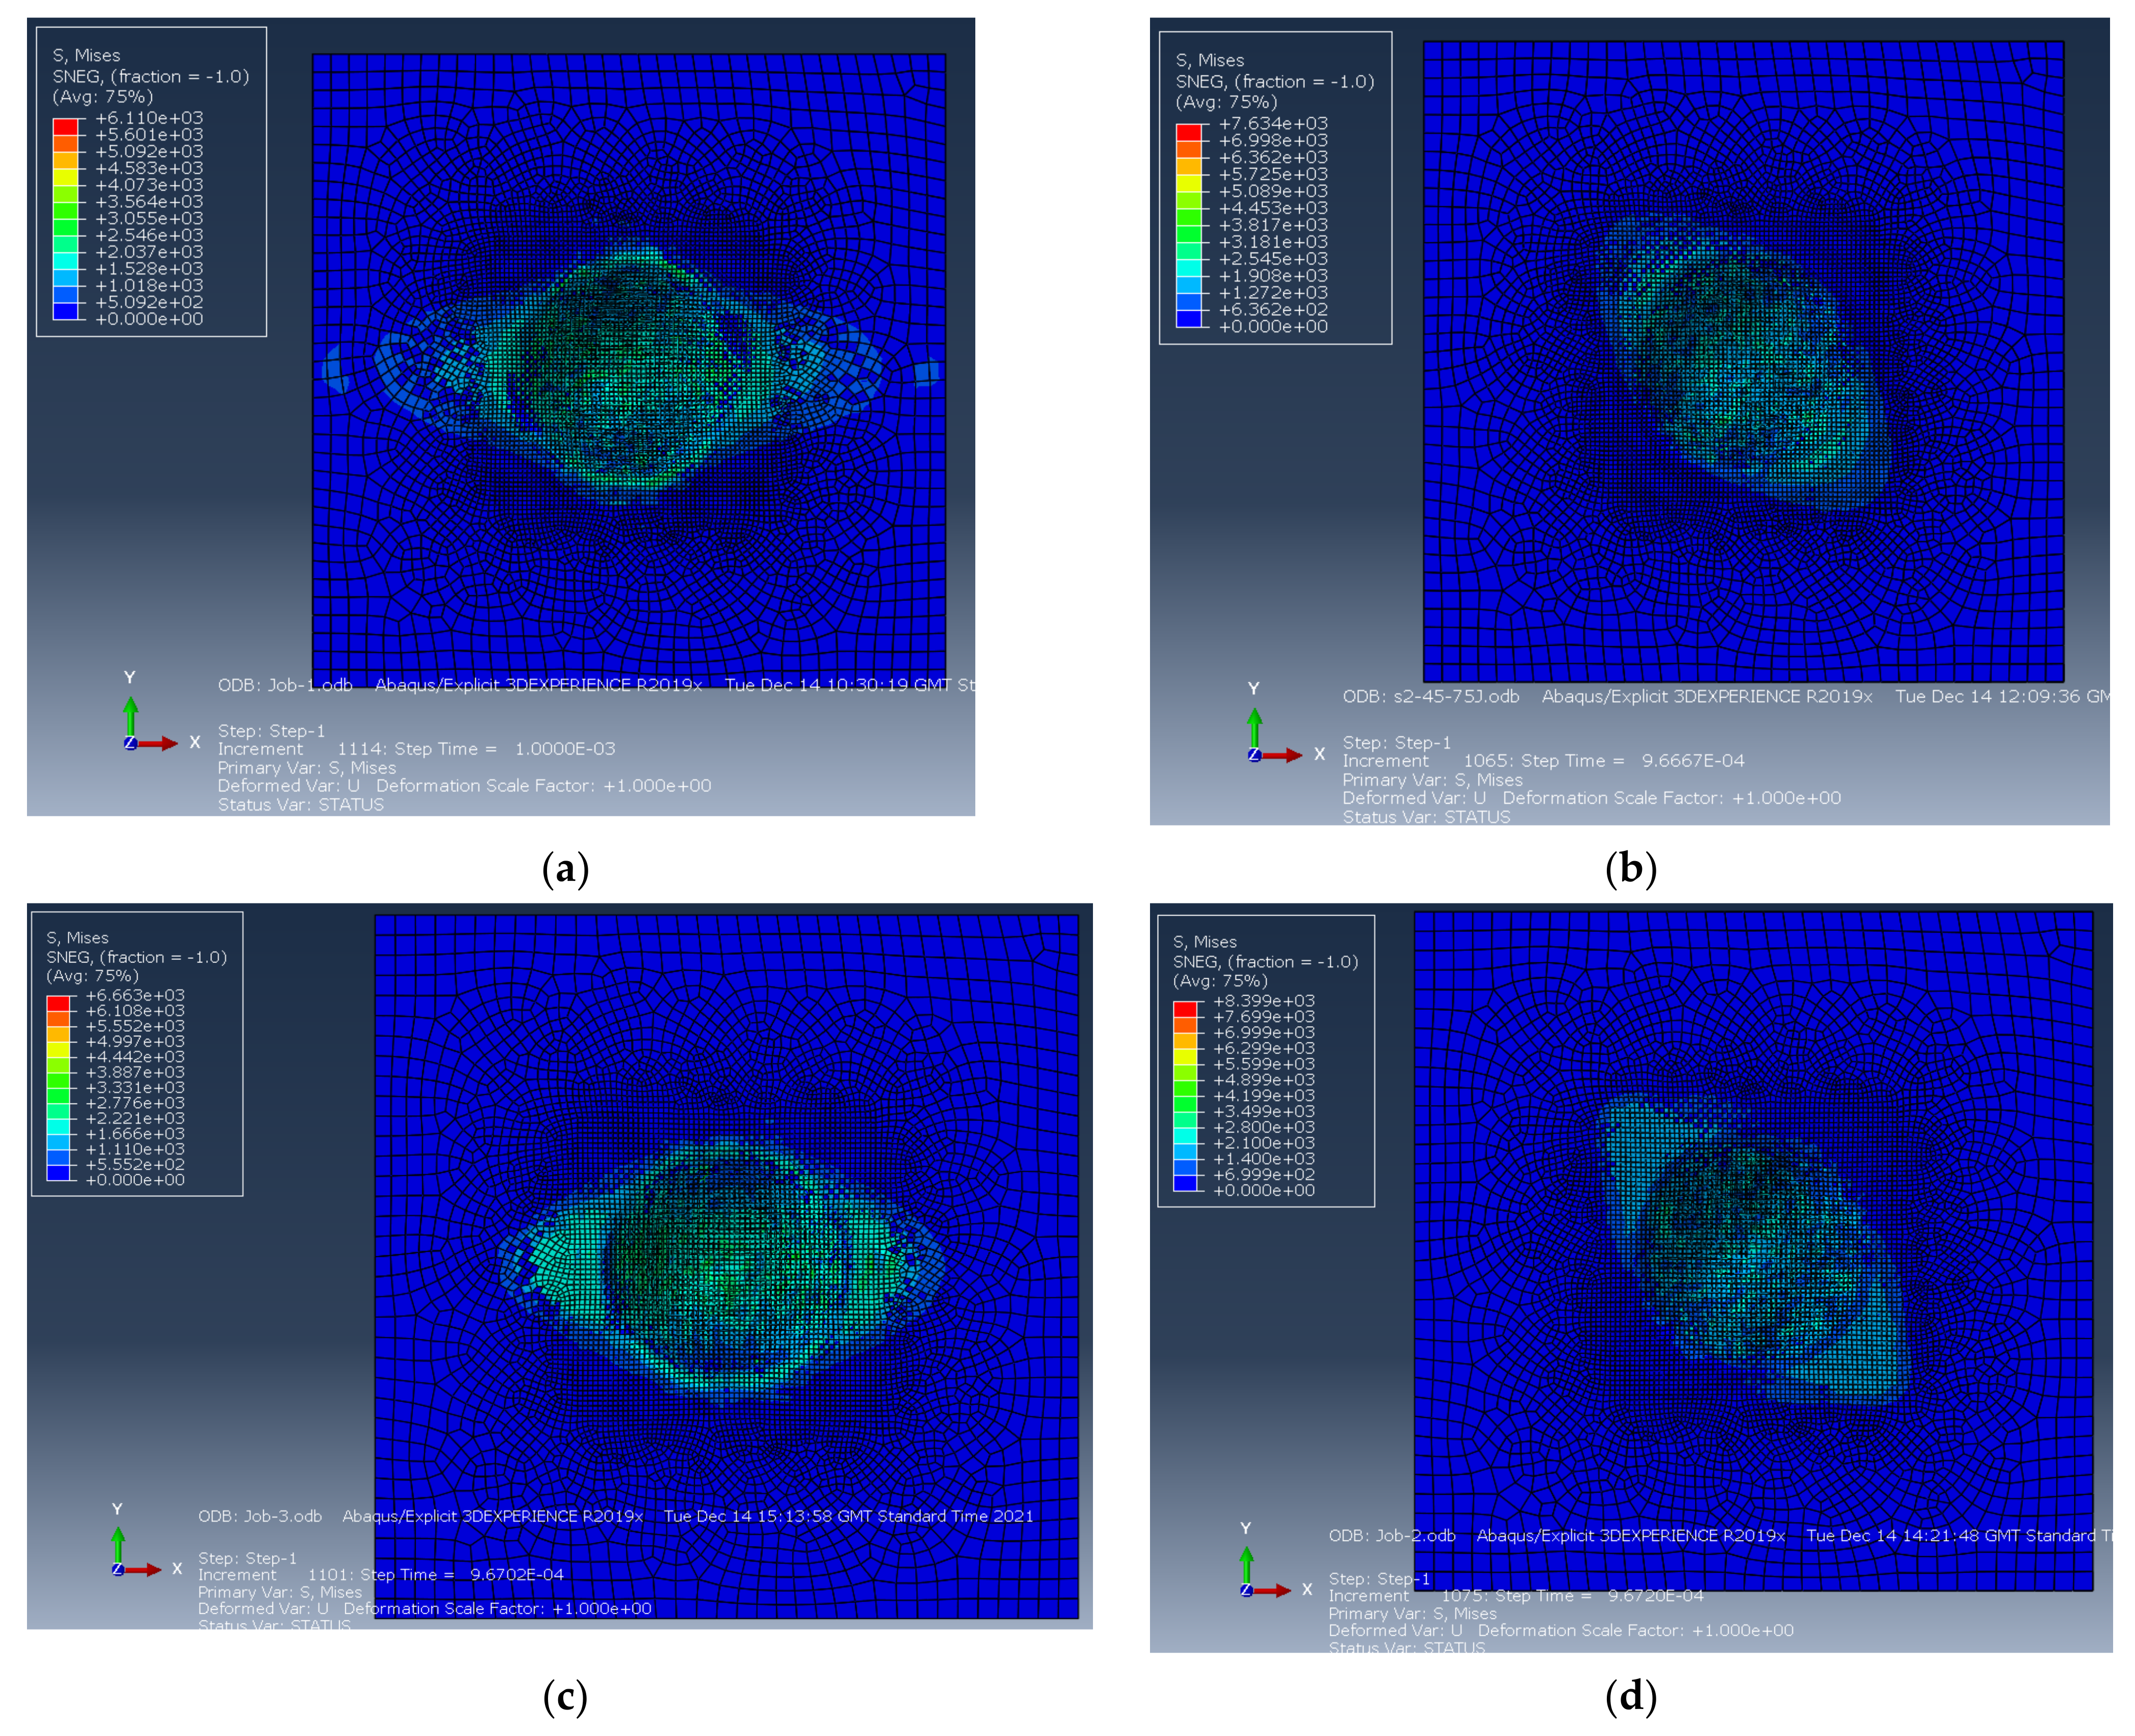
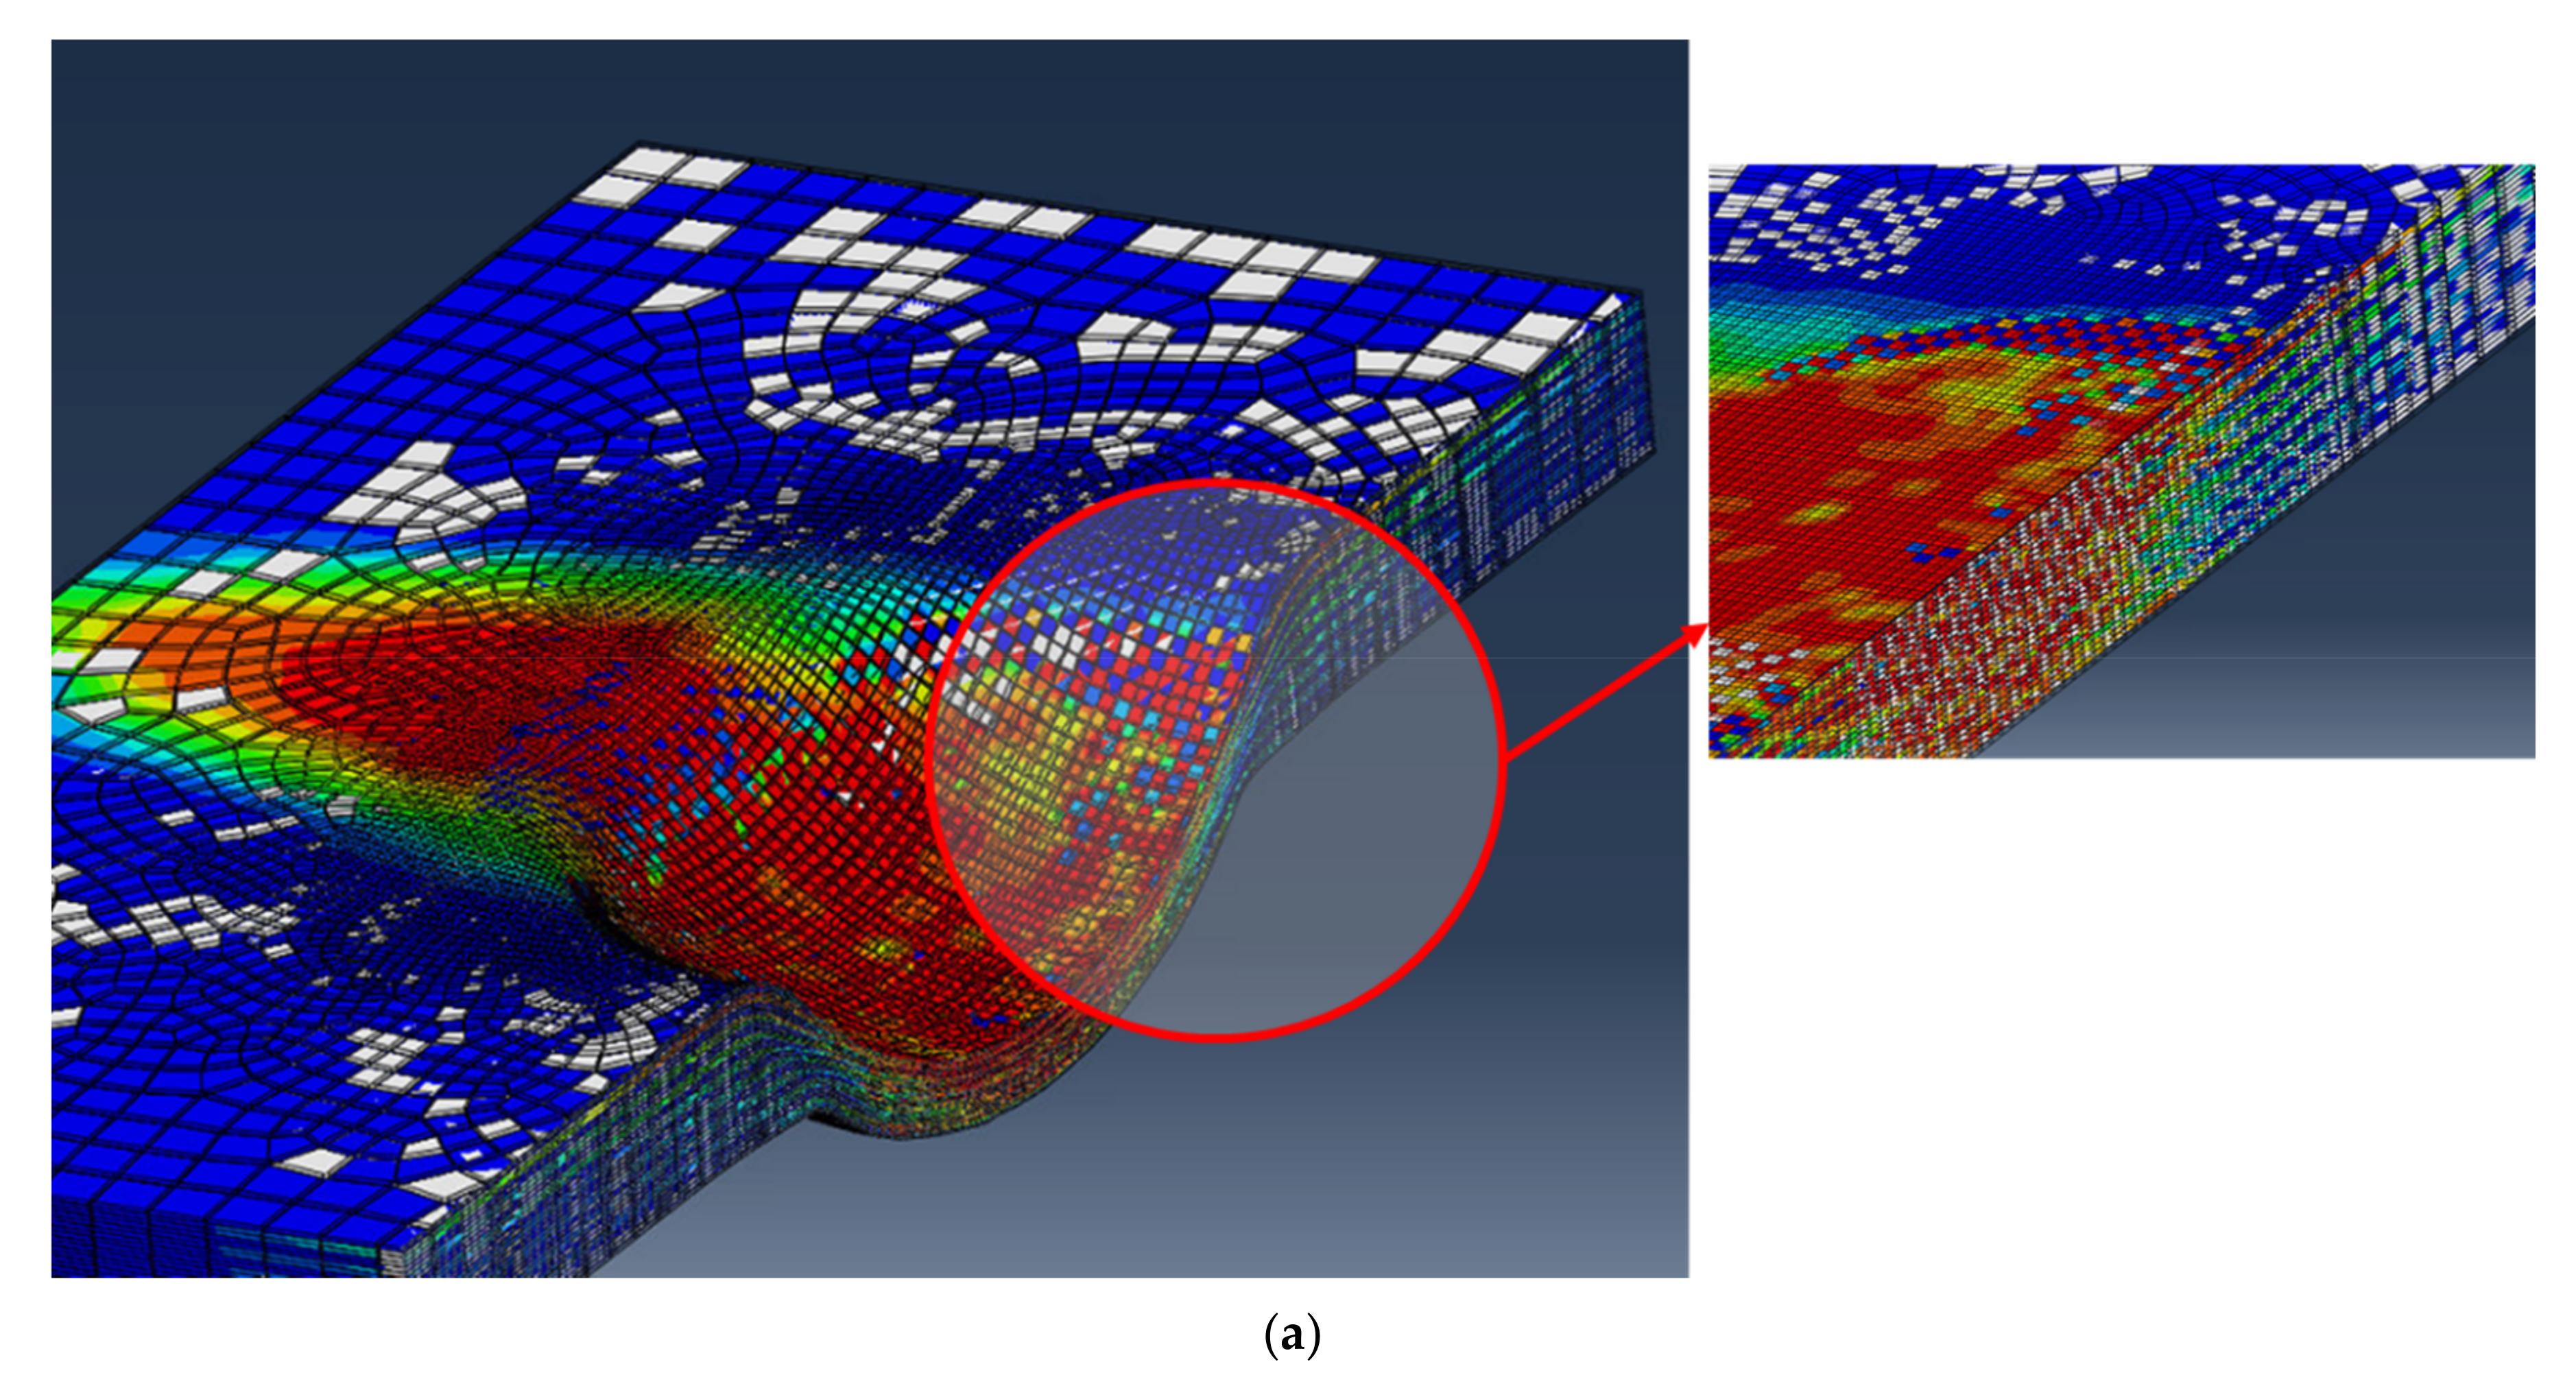
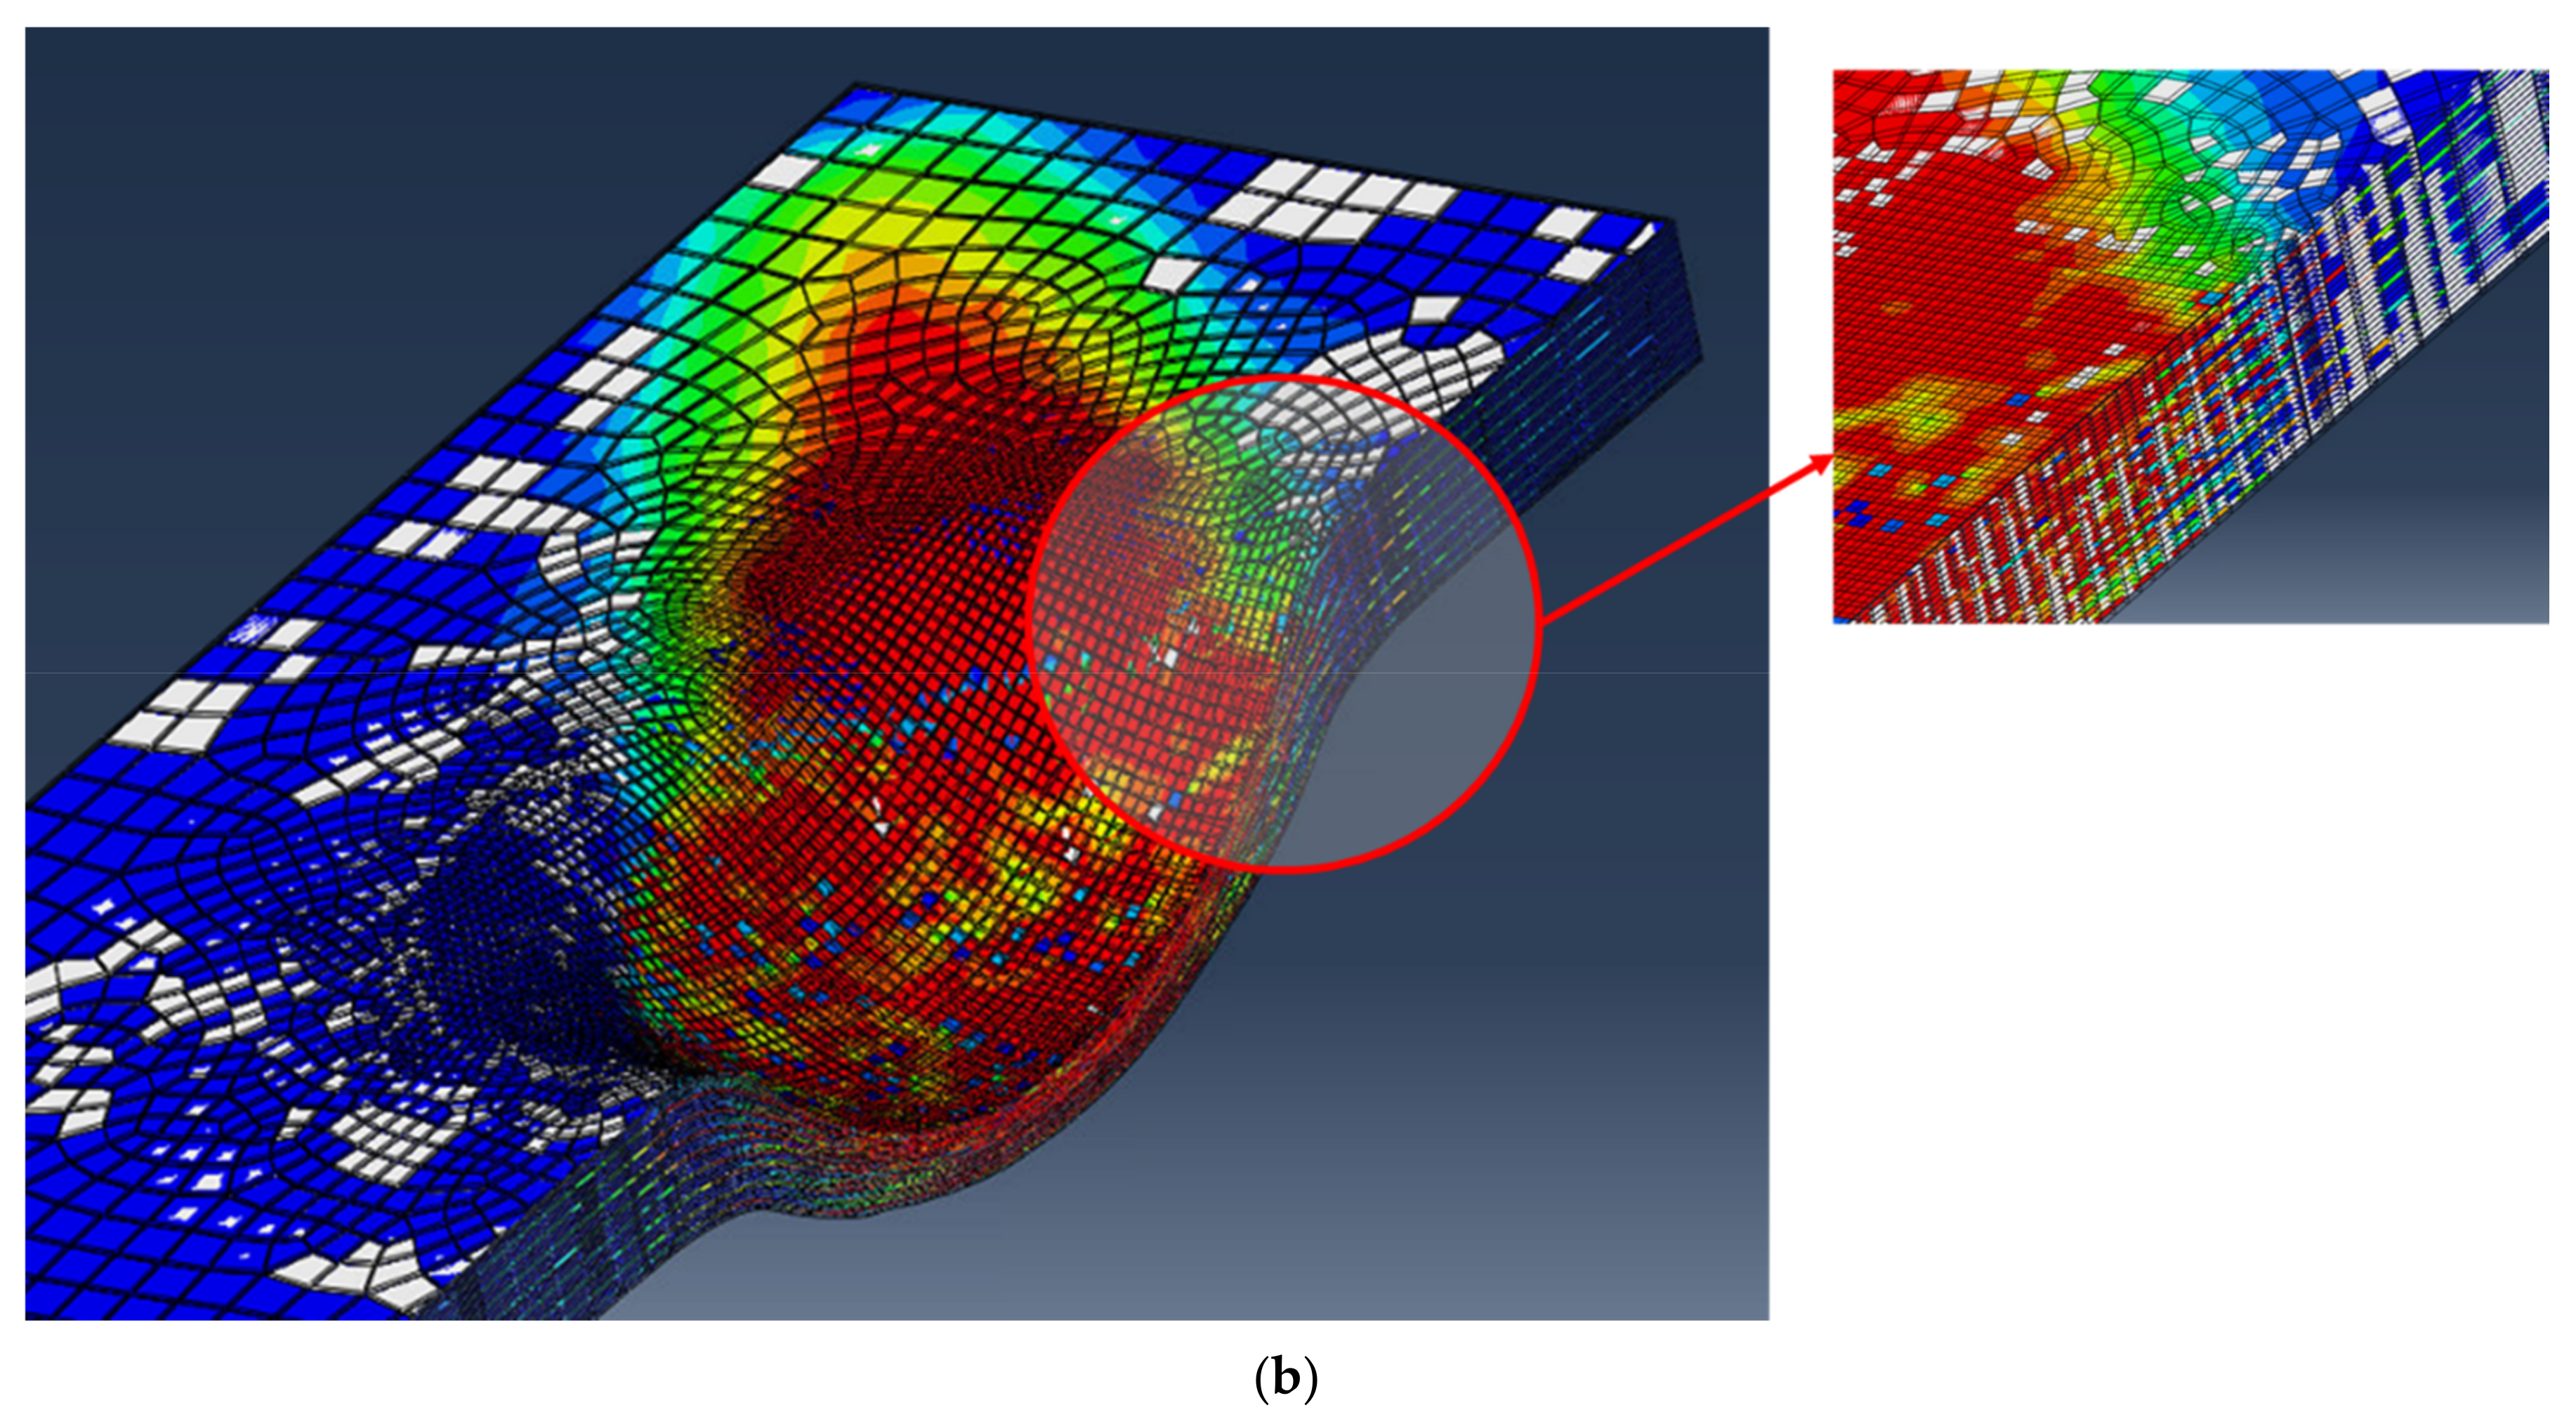
- Finite element models showed good agreement with experimental data and accurately predicted the failure modes in the plates due to impact.
- The use of cohesive elements between each ply of the laminate is a very useful technique to capture the delamination between differently oriented plies, but also to prove that the delamination onset occurs first when the fibres have different orientations between adjacent plies.
- From the four different plates tested, it was found that plates with stacking sequence showed better performance under the impact, whereas the unidirectional plates showed poor performance at all energy levels and were comparable to the plates. The performed satisfactorily at low and medium energy, which makes it the second suitable candidate for the studied loading condition.
- The presented findings in this study incorporating experimental and validated numerical modelling will help researchers in aerospace engineering in understanding the influence of various important parameters on the impact damage characteristics of S2/FM94 glass/epoxy composite laminates to be used in aircraft structures.
Author Contributions
Funding
Institutional Review Board Statement
Informed Consent Statement
Data Availability Statement
Acknowledgments
Conflicts of Interest
References
- Research And Markets. Composites in the Global Aerospace Market 2014–2019 & 2020–2025; Lucintel: Dallas, TX, USA, 2020. [Google Scholar]
- Giasin, K. Machining Fibre Metal. Laminates and Al2024-T3 Aluminium Alloy. Ph.D. Thesis, University of Sheffield, Sheffield, UK. Available online: http://etheses.whiterose.ac.uk/16061/ (accessed on 13 July 2021).
- Evci, C. Thickness-dependent energy dissipation characteristics of laminated composites subjected to low velocity impact. Compos. Struct. 2015, 133, 508–521. [Google Scholar] [CrossRef]
- Shyr, T.-W.; Pan, Y.-H. Impact resistance and damage characteristics of composite laminates. Compos. Struct. 2003, 62, 193–203. [Google Scholar] [CrossRef]
- Fuoss, E.; Straznicky, P.V.; Poon, C. Effects of stacking sequence on the impact resistance in composite laminates—Part. 1: Parametric study. Compos. Struct. 1998, 41, 67–77. [Google Scholar] [CrossRef]
- Abrate, S. Impact on laminated composite materials. Appl. Mech. Rev. 1991, 44, 155–190. [Google Scholar] [CrossRef]
- Cantwell, W.J.; Morton, J. The impact resistance of composite materials—A review. J Compos. 1991, 22, 347–362. [Google Scholar] [CrossRef]
- Liu, D.; Malvern, L.E. Matrix cracking in impacted glass/epoxy plates. J. Compos. Mater. 1987, 21, 594–609. [Google Scholar] [CrossRef]
- Choi, H.Y.; Wang, H.S.; Chang, F.-K. Effect of laminate configuration and impactor’s mass on the initial impact damage of graphite/epoxy composite plates due to line-loading impact. J. Compos. Mater. 1992, 26, 804–827. [Google Scholar] [CrossRef]
- Saifullah, A.; Wang, L.; Barouni, A.; Giasin, K.; Lupton, C.; Jiang, C.; Zhang, Z.; Quaratino, A.; Dhakal, H.N. Low velocity impact (LVI) and flexure-after-impact (FAI) behaviours of rotationally moulded sandwich structures. J. Mater. Res. Technol. 2021, 15, 3915–3927. [Google Scholar] [CrossRef]
- Richardson, M.O.W.; Wisheart, M.J. Review of low-velocity impact properties of composite materials. Compos. Part A Appl. Sci. Manuf. 1996, 27, 1123–1131. [Google Scholar] [CrossRef]
- Sathishkumar, T.P.; Satheeshkumar, S.; Naveen, J. Glass fiber-reinforced polymer composites—A review. J. Reinf. Plast. Compos. 2014, 33, 1258–1275. [Google Scholar] [CrossRef]
- Chen, D.; Luo, Q.; Meng, M.; Li, Q.; Sun, G. Low velocity impact behavior of interlayer hybrid composite laminates with carbon/glass/basalt fibres. Compos. Part B Eng. 2019, 176, 107191. [Google Scholar] [CrossRef]
- Mallick, P.K. Composites Engineering Handbook; CRC Press: Boca Raton, FL, USA, 1997. [Google Scholar]
- Kessler, A.; Bledzki, A.K. Low velocity impact behavior of glass/epoxy cross-ply laminates with different fiber treatments. Polym. Compos. 1999, 20, 269–278. [Google Scholar] [CrossRef]
- Belingardi, G.; Vadori, R. Low velocity impact tests of laminate glass-fiber-epoxy matrix composite material plates. Int. J. Impact Eng. 2002, 27, 213–229. [Google Scholar] [CrossRef]
- Sikarwar, R.S.; Velmurugan, R.; Gupta, N. Influence of fiber orientation and thickness on the response of glass/epoxy composites subjected to impact loading. Compos. Part B Eng. 2014, 60, 627–636. [Google Scholar] [CrossRef]
- Evci, C.; Gülgeç, M. An experimental investigation on the impact response of composite materials. Int. J. Impact Eng. 2012, 43, 40–51. [Google Scholar] [CrossRef]
- Karakuzu, R.; Erbil, E.; Aktas, M. Impact characterization of glass/epoxy composite plates: An experimental and numerical study. Compos. Part B Eng. 2010, 41, 388–395. [Google Scholar] [CrossRef]
- Mitrevski, T.; Marshall, I.H.; Thomson, R.; Jones, R.; Whittingham, B. The effect of impactor shape on the impact response of composite laminates. Compos. Struct. 2005, 67, 139–148. [Google Scholar] [CrossRef]
- Icten, B.M.; Atas, C.; Aktas, M.; Karakuzu, R. Low temperature effect on impact response of quasi-isotropic glass/epoxy laminated plates. Compos. Struct. 2009, 91, 318–323. [Google Scholar] [CrossRef]
- Quaresimin, M.; Ricotta, M.; Martello, L.; Mian, S. Energy absorption in composite laminates under impact loading. Compos. Part B Eng. 2013, 44, 133–140. [Google Scholar] [CrossRef]
- Wu, Z.; Zhang, L.; Ying, Z.; Ke, J.; Hu, X. Low-velocity impact performance of hybrid 3D carbon/glass woven orthogonal composite: Experiment and simulation. Compos. Part B Eng. 2020, 196, 108098. [Google Scholar] [CrossRef]
- Mars, J.; Chebbi, E.; Wali, M.; Dammak, F. Numerical and experimental investigations of low velocity impact on glass fiber-reinforced polyamide. Compos. Part B Eng. 2018, 146, 116–123. [Google Scholar] [CrossRef]
- Fan, J.; Guan, Z.; Cantwel, W.J. Modeling perforation in glass fiber reinforced composites subjected to low velocity impact loading. Polym. Compos. 2011, 32, 1380–1388. [Google Scholar] [CrossRef]
- Kaviti, A.K.; Namala, K.K.; Gupta, G.S.; Reddy, C.N. Modeling And Simulation On Composite Laminates Subjected To Low Velocity Impact. Mater. Today Proc. 2019, 18, 5364–5372. [Google Scholar] [CrossRef]
- Bunsell, A.R.; Renard, J. Fundamentals of Fibre Reinforced Composite Materials; CRC Press: Boca Raton, FL, USA, 2005. [Google Scholar] [CrossRef]
- Giasin, K.; Barouni, A.; Dhakal, H.N.; Featherson, C.; Redouane, Z.; Morkavuk, S.; Koklu, U. Microstructural investigation and hole quality evaluation in S2/FM94 glass-fibre composites under dry and cryogenic conditions. J. Reinf. Plast. 2020, 40, 273–293. [Google Scholar] [CrossRef]
- Vlot, A.; Gunnink, J.W. Fibre Metal Laminates: An Introduction; Springer: Dordrech, The Netherlands, 2001. [Google Scholar]
- Giasin, K.; Ayvar-Soberanis, S.; Hodzic, A. An experimental study on drilling of unidirectional GLARE fibre metal laminates. Compos. Struct. 2015, 133, 794–808. [Google Scholar] [CrossRef]
- Giasin, K.; Ayvar-Soberanis, S.; Hodzic, A. The effects of minimum quantity lubrication and cryogenic liquid nitrogen cooling on drilled hole quality in GLARE fibre metal laminates. Mater. Des. 2016, 89, 996–1006. [Google Scholar] [CrossRef]
- Giasin, K.; Ayvar-Soberanis, S. An Investigation of burrs, chip formation, hole size, circularity and delamination during drilling operation of GLARE using ANOVA. Compos. Struct. 2017, 159, 745–760. [Google Scholar] [CrossRef]
- Giasin, K.; Ayvar-Soberanis, S. Microstructural investigation of drilling induced damage in fibre metal laminates constituents. Compos. Part A Appl. Sci. Manuf. 2017, 97, 166–178. [Google Scholar] [CrossRef]
- Riccio, A.; di Felice, G.; Saputo, S.; Scaramuzzino, F. Stacking Sequence Effects on Damage Onset in Composite Laminate Subjected to Low Velocity Impact. Procedia Eng. 2014, 88, 222–229. [Google Scholar] [CrossRef] [Green Version]
- Pinnell, M.F.; Sjoblom, P.O. Low-Velocity Impact Testing of Thermoplastic and Thermoset Matrix Composite Materials; Wright Research and Development Center, Wright-Patterson AFB: Dayton, OH, USA, 1990. [Google Scholar]
- Barouni, A.K.; Dhakal, H.N. Damage investigation and assessment due to low-velocity impact on flax/glass hybrid composite plates. Compos. Struct. 2019, 226, 111224. [Google Scholar] [CrossRef]
- Abaqus, version 2019; Dassault Systèmes: Vélizy-Villacoublay, France, 2019.
- Hashin, Z. Failure criteria for unidirectional fiber composites. J. Appl. Mech. 1980, 2, 329–334. [Google Scholar] [CrossRef]
- Mohit, G.; Frank, A.; Michael, F.; Galib, A. Predicting Bearing Strength of Fiber Metal Laminates Via Progressive Failure Analysis. In Proceedings of the 52nd AIAA/ASME/ASCE/AHS/ASC Structures, Structural Dynamics and Materials Conference, Denver, CO, USA, 4–7 April 2011. [Google Scholar] [CrossRef]
- Sosa, J.C.; Karapurath, N. Delamination modelling of GLARE using the extended finite element method. Compos. Sci. Technol. 2012, 72, 788–791. [Google Scholar] [CrossRef]
- Giasin, K.; Ayvar-Soberanis, S.; French, T.; Phadnis, V. 3D Finite Element Modelling of Cutting Forces in Drilling Fibre Metal Laminates and Experimental Hole Quality Analysis. Appl. Compos. Mater. 2016, 24, 113–137. [Google Scholar] [CrossRef] [Green Version]
- Rathnasabapathy, M.; Mouritz, A.; Orifici, A. Numerical Investigation of Fibre-Metal Laminates Subject to Impact Damage. In Proceedings of the 18th International Conference on Composite Materials, Jeju Island, Korea, 21–26 August 2011. [Google Scholar]
- Benzeggagh, M.L.; Kenane, M. Measurement of mixed-mode delamination fracture toughness of unidirectional glass/epoxy composites with mixed-mode bending apparatus. Compos. Sci. Technol. 1996, 56, 439–449. [Google Scholar] [CrossRef]
- Phadnis, V.A.; Makhdum, F.; Roy, A.; Silberschmidt, V.V. Experimental and Numerical Investigations in Conventional and Ultrasonically Assisted Drilling of CFRP Laminate. Procedia CIRP 2012, 1, 455–459. [Google Scholar] [CrossRef] [Green Version]
- Shi, Y.; Swait, T.; Soutis, C. Modelling damage evolution in composite laminates subjected to low velocity impact. Compos. Struct. 2012, 94, 2902–2913. [Google Scholar] [CrossRef]
- Isbilir, O.; Ghassemieh, E. Numerical investigation of the effects of drill geometry on drilling induced delamination of carbon fiber reinforced composites. Compos. Struct. 2013, 105, 126–133. [Google Scholar] [CrossRef]
- Ismail, K.I.; Sultan, M.T.H.; Shah, A.U.M.; Jawaid, M.; Safri, S.N.A. Low velocity impact and compression after impact properties of hybrid bio-composites modified with multi-walled carbon nanotubes. Compos. Part B Eng. 2019, 163, 455–463. [Google Scholar] [CrossRef]
- Jaroslaw, B.; Barbara, S.; Patryk, J. The comparison of low-velocity impact resistance of aluminum/carbon and glass fiber metal laminates. Polym. Compos. 2016, 37, 1056–1063. [Google Scholar] [CrossRef]
- Papa, I.; Formisano, A.; Lopresto, V.; Langella, A. Low velocity impact behaviour of reinforced plastic laminates: Indentation and penetration laws validated for different fibres and matrices. Compos. Part B Eng. 2019, 164, 61–66. [Google Scholar] [CrossRef]
- Caminero, M.A.; García-Moreno, I.; Rodríguez, G.P. Damage resistance of carbon fibre reinforced epoxy laminates subjected to low velocity impact: Effects of laminate thickness and ply-stacking sequence. Polym. Test. 2017, 63, 530–541. [Google Scholar] [CrossRef]
- Zhang, Y.; Yan, L.; Zhang, C.; Guo, S. Low-velocity impact response of tube-reinforced honeycomb sandwich structure. Thin-Walled Struct. 2021, 158, 107188. [Google Scholar] [CrossRef]
- Ramakrishnan, K.R.; Corn, S.; le Moigne, N.; Ienny, P.; Slangen, P. Experimental assessment of low velocity impact damage in flax fabrics reinforced biocomposites by coupled high-speed imaging and DIC analysis. Compos. Part A Appl. Sci. Manuf. 2021, 140, 106137. [Google Scholar] [CrossRef]
- Talreja, R.; Singh, C.V. Damage and Failure of Composite Materials; Cambridge University Press: Cambridge, UK, 2012. [Google Scholar]
- Strong, A.B. Fundamentals of Composites Manufacturing: Materials, Methods and Applications; Society of Manufacturing Engineers: Dearborn, MI, USA, 2008. [Google Scholar]
- Lopes, C.; Seresta, O.; Coquet, Y.; Gürdal, Z.; Camanho, P.; Thuis, B. Low-velocity impact damage on dispersed stacking sequence laminates. Part I: Experiments. Compos. Sci. Technol. 2009, 69, 926–936. [Google Scholar] [CrossRef]
- Chung, D.D.L. Composite Materials: Science and Applications; Springer: London, UK, 2010. [Google Scholar]
- De Morais, W.; Monteiro, S.; d’Almeida, J. Evaluation of repeated low energy impact damage in carbon–epoxy composite materials. Compos. Struct. 2005, 67, 307–315. [Google Scholar] [CrossRef]
- Shen, Y.; Jiang, B.; Li, Y.; Jiang, X. Low velocity impact response and energy absorption behavior on glass fibre reinforced epoxy composites. Sci. China Technol. Sci. 2017, 60, 1339–1346. [Google Scholar] [CrossRef]
- Hou, J.P.; Petrinic, N.; Ruiz, C.; Hallett, S. Prediction of impact damage in composite plates. Compos. Sci. Technol. 2000, 60, 273–281. [Google Scholar] [CrossRef]
- Fidan, S.; Sınmazçelik, T.; Avcu, E. Internal damage investigation of the impacted glass/glass+ aramid fiber reinforced composites by micro-computerized tomography. NDT E Int. 2012, 51, 1–7. [Google Scholar] [CrossRef]
- Yoshimura, A.; Nakao, T.; Yashiro, S.; Takeda, N. Improvement on out-of-plane impact resistance of CFRP laminates due to through-the-thickness stitching. Compos. Part A Appl. Sci. Manuf. 2008, 39, 1370–1379. [Google Scholar] [CrossRef]
- Davies, G.; Zhang, X. Impact damage prediction in carbon composite structures. Int. J. Impact Eng. 1995, 16, 149–170. [Google Scholar] [CrossRef]
- Tan, K.T.; Watanabe, N.; Iwahori, Y. X-ray radiography and micro-computed tomography examination of damage characteristics in stitched composites subjected to impact loading. Compos. Part B Eng. 2011, 42, 874–884. [Google Scholar] [CrossRef]
- Naghipour, P.; Bartsch, M.; Chernova, L.; Hausmann, J.; Voggenreiter, H. Effect of fiber angle orientation and stacking sequence on mixed mode fracture toughness of carbon fiber reinforced plastics: Numerical and experimental investigations. Mater. Sci. Eng. A 2010, 527, 509–517. [Google Scholar] [CrossRef] [Green Version]
- Fuoss, E.; Straznicky, P.V.; Poon, C. Effects of stacking sequence on the impact resistance in composite laminates. Part. 2: Prediction method. Compos. Struct. 1998, 41, 177–186. [Google Scholar] [CrossRef]


| Plate Number | Plate 1 | Plate 2 | Plate 3 | Plate 4 |
|---|---|---|---|---|
| Ply orientation |
| Impact Level | Level 1 | Level 2 | Level 3 |
|---|---|---|---|
| Impact Energy (J) | 75 | 150 | 225 |
| 2430 | 2000 | 50 | 150 | 76 | 50 |
| Density (Kg/m3) | E11 (GPa) | E22 (GPa) | E33 (GPa) | G12 (GPa) | G13 (GPa) | G23 (GPa) | ν12 | ν13 | ν23 |
|---|---|---|---|---|---|---|---|---|---|
| 1980 | 53.98 | 9.412 | 9.412 | 5.548 | 3 | 5.548 | 0.0575 | 0.0575 | 0.33 |
(kJ/m2) | |||
|---|---|---|---|
| 12.5 | 12.5 | 1.0 | 1.0 |
| (kJ/m2) | (kJ/m2) | (kJ/m2) | E/Enn (GPa/mm) | G1Ess (GPa/mm) | G2Ett (GPa/mm) | |||
|---|---|---|---|---|---|---|---|---|
| 50 | 50 | 60 | 4.0 | 4.0 | 4.0 | 105 | 105 | 105 |
| Setup | Impactor | Plate |
|---|---|---|
| Mesh size | 2 × 2 mm2 | 1 × 1 mm2 |
| Element type | R3D3, R3D4 | SC8R, COH3D8 |
| Number of elements | 1431 | 475,272 |
| Material | Steel | S2 glass fibre composite |
| Body type | Discrete rigid non-deformable | Deformable |
| Solver | Dynamic Explicit | |
Publisher’s Note: MDPI stays neutral with regard to jurisdictional claims in published maps and institutional affiliations. |
© 2021 by the authors. Licensee MDPI, Basel, Switzerland. This article is an open access article distributed under the terms and conditions of the Creative Commons Attribution (CC BY) license (https://creativecommons.org/licenses/by/4.0/).
Share and Cite
Giasin, K.; Dhakal, H.N.; Featheroson, C.A.; Pimenov, D.Y.; Lupton, C.; Jiang, C.; Barouni, A.; Koklu, U. Effect of Fibre Orientation on Impact Damage Resistance of S2/FM94 Glass Fibre Composites for Aerospace Applications: An Experimental Evaluation and Numerical Validation. Polymers 2022, 14, 95. https://doi.org/10.3390/polym14010095
Giasin K, Dhakal HN, Featheroson CA, Pimenov DY, Lupton C, Jiang C, Barouni A, Koklu U. Effect of Fibre Orientation on Impact Damage Resistance of S2/FM94 Glass Fibre Composites for Aerospace Applications: An Experimental Evaluation and Numerical Validation. Polymers. 2022; 14(1):95. https://doi.org/10.3390/polym14010095
Chicago/Turabian StyleGiasin, Khaled, Hom N. Dhakal, Carol A. Featheroson, Danil Yurievich Pimenov, Colin Lupton, Chulin Jiang, Antigoni Barouni, and Ugur Koklu. 2022. "Effect of Fibre Orientation on Impact Damage Resistance of S2/FM94 Glass Fibre Composites for Aerospace Applications: An Experimental Evaluation and Numerical Validation" Polymers 14, no. 1: 95. https://doi.org/10.3390/polym14010095
APA StyleGiasin, K., Dhakal, H. N., Featheroson, C. A., Pimenov, D. Y., Lupton, C., Jiang, C., Barouni, A., & Koklu, U. (2022). Effect of Fibre Orientation on Impact Damage Resistance of S2/FM94 Glass Fibre Composites for Aerospace Applications: An Experimental Evaluation and Numerical Validation. Polymers, 14(1), 95. https://doi.org/10.3390/polym14010095