Article

Improving the Efficiency for the Production of Bis-(2-Hydroxyethyl) Terephtalate (BHET) from the Glycolysis Reaction of Poly(Ethylene Terephtalate) (PET) in a Pressure Reactor

by
Eider Mendiburu-Valor
1,
Gurutz Mondragon
1,
Nekane González
2,
Galder Kortaberria
1,
Arantxa Eceiza
1 and
Cristina Peña-Rodriguez
1,*
1
‘Materials+Tecnologies’ Research Group, Chemistry and Environmental Engineering Department, Faculty of Engineering, Gipuzkoa, University of the Basque Country (UPV/EHU), Plaza Europa 1, 20018 Donostia, Spain
2
Antex. Josep Hereu i Aulet 8, 17160 Anglés, Spain
*
Author to whom correspondence should be addressed.
Polymers 2021, 13(9), 1461; https://doi.org/10.3390/polym13091461
Submission received: 15 April 2021 / Revised: 26 April 2021 / Accepted: 29 April 2021 / Published: 30 April 2021
(This article belongs to the Section Polymer Processing and Engineering)

Abstract

:
The depolymerization process of PET by glycolysis into BHET monomer is optimized in terms of reaction temperature and time, by carrying out the process under pressure to be faster for reducing the energy required. Almost pure BHET has been obtained by working in a pressure reactor at 3 bar both at 220 and 180 °C after short reaction times, while for longer ones a mixture of oligomers and dimers is obtained. Depending on the potential application required, the obtention of different reaction products is controlled by adjusting reaction temperature and time. The use of a pressure reactor allows work at lower temperatures and shorter reaction times, obtaining almost pure BHET. To the best of our knowledge, except for microwave-assisted procedures, it is the first time in which pure BHET is obtained after such short reaction times, at lower temperatures than those usually employed.

Graphical Abstract

1. Introduction

Poly(ethylene terephthalate) (PET) is a semi-crystalline aromatic-aliphatic thermoplastic polyester used in food packaging manufacture, mainly for bottles (51%) and other food packaging (9.1%), as sheets and films (13.8%), as well as for non-food products (6.1%) [1]. Due to the great flexibility and low density, as well as low cost, the consumption of this polyester has increased in recent years [1], reaching to a demand of around 4 million tons in Europe during 2018 [2]. Among the most widely used polymers for food and beverage packaging, PET is the most suitable thermoplastic because its high mechanical, physical and chemical properties, including low gas transmission permeability [3,4]. The most important sources of PET residues are the manufacturing waste and post-consumer urban residues, which should be managed and recycled by specific companies.
The three main processes for the valorization of PET residues are the mechanical, chemical, and energetic recycling ones. Several companies around the world recycle PET by mechanical processing of post-consumer residues, mainly bottles, to produce laminates for packaging or fibers [5]. Among fibers, those with diameters from 5 to 150 mm (staple grades) are the most interesting, while larger ones are used to stuff anoraks, sleeping bags, and soft toys. Recycled PET is also used to spin fibers with lower diameter, which are then woven into “polar” fleece fabric used for sweatshirts, jackets and scarves [5]. PET urban waste show rheological, physical, and chemical properties very close to those of the virgin material, allowing their successful recycling by mechanical processes.
The environment provokes structural changes in PET samples due to degradation and changes in crystallinity or chain conformation [6,7,8]. These changes could be related to hydrolytic degradation, since hydrolysis is the main process occurring at temperatures below the glass transition temperature (Tg) [9]. In addition, the hydrolysis of PET is an autocatalytic reaction that can occur during extrusion process [10] with the formation of carboxylic acids. To increase the life cycle of this material, several researchers and companies are working for the optimization of chemical recycling processes that allow the use of the most degraded PET waste such as marine litter or manufacturing residues [11].
The different methods for the chemical recycling of PET could be categorized into five main branches according to the reaction mechanism, including glycolysis, methanolysis, hydrolysis, ammonolysis and aminolysis [12]. The most attractive method is the chemical recycling by glycolysis, because it is considered to be a versatile chemical recycling method in which, besides the bis(2-hydroxyethyl) terephthalate (BHET) monomer, specialized oligomeric products such as polyols are also produced [13]. These sub-products can be further used for the synthesis of polymers such as unsaturated polyesters, polyurethanes, vinyl esters, or epoxy resins, among others [14,15].
To optimize the reaction rate and BHET monomer yield, four glycolysis methods have been developed. The solvent-assisted glycolysis, in which organic solvents as xylene constitute the reaction medium [16]; the supercritical glycolysis, performed at 450 °C and 7–15 MPa of pressure [17]; the microwave-assisted glycolysis, in which the maximum BHET yield could be obtained in a significantly lower reaction time (30 min) when compared to the 8–9 h reaction by conventional heating process [18]. Finally, in the catalyzed glycolysis, with ionic liquids as reaction medium, the reaction takes 5–10 h at 165–190 °C [19].
Among the benefits of above presented glycolysis methods, several works have defined that catalyzed with zinc acetate as the most effective [20,21,22,23], obtaining yields of 70% with a PET/EG molar ratio of 1:7.6, in 1 h at 196 °C in a three necks glass reactor under atmospheric pressure [22]. Conversions of almost 100% can be obtained with reactions times from 1 to 4 h [24]. The effect of temperature, PET/EG ratio and pressure on glycolysis have been analyzed by Chen et al. [25,26]. They confirmed that the depolymerization of PET materials depends on temperature and PET/EG ratio, occurring faster than at atmospheric pressure. Campanelli et al. [27] examined the reaction in a pressure reactor at temperatures above 245 °C, with a molar ratio PET/EG of 3:1, also concluding that depolymerization was faster under pressure. Therefore, it can be concluded that the pressure improves the depolymerization reaction of PET obtaining a higher amount of BHET. Therefore, several parameters can be modulated to obtain high yields, but also analyzing the composition of reaction products to define the most useful application or the most suitable polymer into which they will be transformed, by using proper conditions and reactants. Table 1 presents a comparative of the different glycolysis procedures found in the literature with that employed in the present work.
The aim of this work is the characterization of reaction products obtained from the chemical glycolysis of PET catalyzed by zinc acetate at different reaction times, to optimize the conditions for obtaining higher yields. Moreover, to develop an eco-friendlier process, a closed pressure reactor has been used to avoid the loss of organic volatile compounds, also reducing reaction times and temperatures in order to reduce the energy consumption of the recycling process.

2. Materials and Methods

Virgin PET pellets with a melt flow index of 61 ± 14 g/10 min and an intrinsic viscosity (I.V.) of 0.58 dL/g was kindly supplied by PlastiVerd (Barcelona, Spain). Ethylene glycol (EG) from Sigma-Aldrich (EEUU) was used as solvent for the glycolysis, with chemically pure zinc acetate PROBUS, C. Busquets (Badalona, Spain) as catalyst. For characterization purposes, standard BHET from Sigma-Aldrich (San Louis, MO, USA) and tetrahydrofuran (THF) provided by Macron Fine Chemicals™ (Avantor, Gliwice, Poland) were also used. Reagents were used as purchased without further purification.

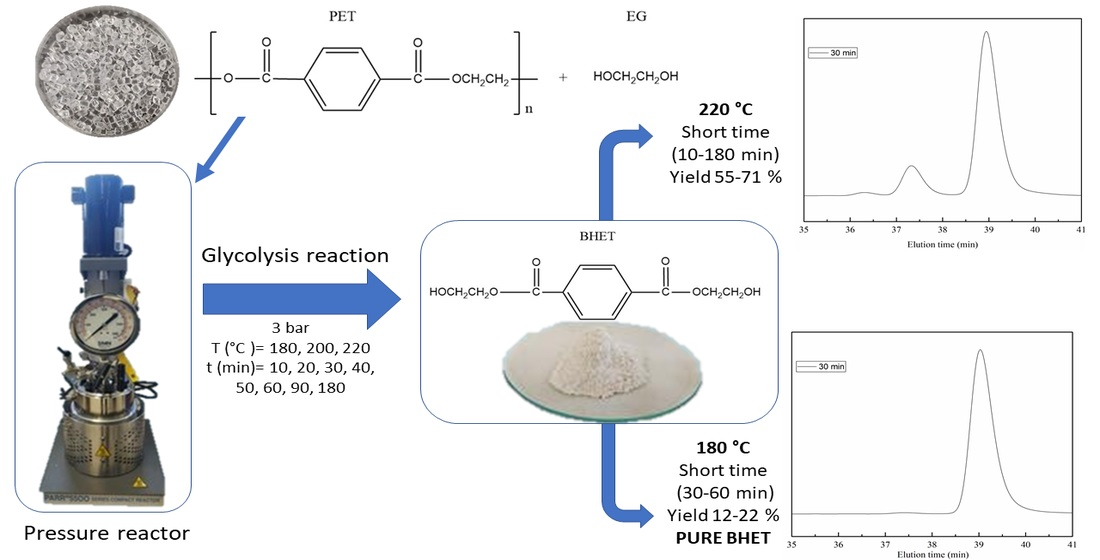
2.1. Glycolysis Reaction

Glycolysis reactions were carried out under a pressure of 3 bar in a 0.3 L Parr 50 mini reactor equipped with a thermometer, a manometer, and a refrigeration system. Mechanical stirring was maintained constant at 1000–1200 rpm. A PET/EG weight ratio of 1:3 was employed (40 g PET, 120 g EG), with 1% mass of zinc acetate as catalyst, the working volume is approximately 160 mL. To analyze reaction kinetics at 220 °C, 8 different reaction times between 10 and 180 min (10, 20, 30, 40, 50, 60, 90, and 180 min) were chosen. Moreover, to evaluate the effect of temperature, depolymerizations were carried out at 180 and 200 °C and different reaction times of 30, 60, 90, and 180 min. All reactants were first placed into the reactor and then it was heated to the specific temperature and once the temperature was reached, the reaction time was quantified. The previous warm-up time was variable between 30–45 min.
The process is summarized in Scheme 1. At the end of each reaction, the obtained liquid mixture was identified as the glycolysis reaction product (GRP). To determinate the unreacted PET and high molecular oligomers, THF filtration was performed, separating glycolysis products soluble in THF, such as BHET monomers, dimers or low molecular weight oligomers, from insoluble fractions (IF). In the other hand, glycolyzed products (G) were determined by filtration. With this purpose, a hot water excess was used to solve the GRP and to ensure a better separation between glycols, BHET and oligomers [22]. Then, samples were cooled at room temperature during 24 h, for being then stored in a refrigerator for 15 min at 4 °C to induce the precipitation of white crystals [28] of BHET monomer and other oligomeric fractions. Both the insoluble (IF) and the glycolyzed fractions (G) were filtrated by vacuum filtration using glass microfiber filters with pore diameters of 0.7 and 1.2 µm, respectively. Finally, the filters were dried under vacuum at 50 °C for 24 h.
The yield (η) for BHET was calculated by weight difference as shown in the following equation.
η weight % = W BHET . f / MW BHET W PET .0 / MW PET × 100
where WPET.0 refers to the initial PET weight and WBHET.f to the BHET weight obtained at the end of the process. Moreover, MwBHET and MwPET are the molecular weights of BHET (254 g/mol) and PET (192 g/mol) repeating unit, respectively [18,22].

2.2. Characterization Techniques

Weight and number average molecular weights, Mw and Mn, were determined by gel permeation chromatography (GPC, Thermo Fisher Scientific, Waltham, MA, USA) using a Thermo Scientific chromatograph, equipped with an isocratic Dionex UltiMate 3000 pump and a RefractoMax 521 refractive index detector. The separation was carried out at 30 °C within four Phenogel GPC columns from Phenomenex with 5 µm particle size and porosities of 105, 103, 100, and 50 Å, located in an UltiMate 3000 thermostated column compartment. Tetrahydrofuran (THF) was used as mobile phase at a flow rate of 1 mL/min. Samples were prepared solving obtained BHET into THF at 1 wt.% and filtering using nylon filters with 2 µm pore size. Weight average and number average molecular mass, Mw and Mn respectively, were reported as weight average based on calibration curve with monodisperse polystyrene standards.
The characteristic functional groups and chemical interactions from PET, BHET and glycolyzed products were analyzed by Fourier transform infrared spectroscopy (FTIR, Thermo Fisher Scientific, Waltham, MA, USA). Spectra were recorded by a Nicolet Nexus spectrometer provided with a MKII Golden Gate accessory (Specac) with a diamond crystal at a nominal incidence angle of 45° and ZnSe lens. Spectra were recorded in attenuated total reflection (ATR) mode between 4000 and 500 cm−1, performing 64 scans with a resolution of 8 cm−1.
Thermogravimetric analysis (TGA, Columbus, OH, USA) was performed on a TGA/SDTA851 Mettler Toledo equipment to evaluate the thermal stability of glycolyzed fractions. Samples were heated from room temperature to 800 °C at a heating rate of 10 °C min−1 under a nitrogen atmosphere.
Thermal properties of PET materials were determined by differential scanning calorimetry (DSC, Columbus, OH, USA), performed using a Mettler Toledo DSC3+ equipment provided with a robotic arm and an electric intracooler as refrigerator unit. 5–10 mg of sample were encapsulated in aluminum pans and heated from 25 to 170 °C at a heating rate of 10 °C min−1 in nitrogen atmosphere, determining the melting temperatures (Tm) of G products.

3. Results and Discussion

The depolymerization of PET by glycolysis is the reverse of the polycondensation reaction for PET synthesis (Scheme 2). As a result, the glycolysis product is a heterogenous mixture of BHET, dimmers, and other oligomers. Reaction yield (ƞ) and insoluble fraction (IF) values obtained at different reaction times are summarized in Table 2.
Reaction yield reaches the 55% at only 10 min of reaction, increasing up to almost 70% after 30 min. For longer reaction times, similar or lower yields are obtained (except that for 90 min, very close to 70%). Therefore, it can be assumed that the optimal reaction time for obtaining the highest yield of reaction will be between 30–90 min. This study was completed by GPC, as will be shown below.
To determinate the composition of the final product, FTIR, DSC, and GPC analysis were performed. Figure 1 shows FTIR spectra of glycolyzed products (G fraction) obtained from reaction, as well as those of reference PET and BHET.
As can be seen in Figure 1a, the spectrum of the product obtained after 10 min of reaction matches with that of BHET. PET depolymerization leads to the formation of hydroxyl groups, reflected in the band at 3600–3200 cm−1, present at the spectra of BHET and G10 [29]. The strong absorption band corresponding to the ester group at 1712 cm−1 is also detected. From Figure 1b, showing the spectra of samples obtained at different glycolysis times, can be seen that there are no significant differences among different materials.
FTIR spectra with higher magnification, showing the most representative bands related to characteristic functional groups are also presented in Figure 1 for a deeper analysis. From Figure 1c is observed that at 3100–2800 cm−1 interval, two peaks corresponding to the aliphatic (–CH2–) appear for G samples while only a single peak is detected in the PET spectra. The presence of the double peak is related to the BHET monomer while the single peak is related to the presence of BHET oligomers [31], only present at PET samples. In the same way, the band related to the ester group at 1712 cm−1 appears at PET spectrum as a single peak, while a double one is detected for the rest of samples, probably related with the amorphous and crystalline parts present in each sample [32].
DSC thermograms of the products obtained at different reaction times can be seen in Figure 2, corresponding to a heating scan from 25 to 170 °C at a heating rate of 10 °C/min.
All thermograms show the maximum peak corresponding to the melting temperature at around 100–110 °C, matching with that found for BHET in the literature [31], thus meaning that for all reaction times the product obtained is mainly BHET.
Molar mass values for obtained products have been measured by GPC. Figure 3 shows GPC traces obtained for the reaction products obtained at different reaction times, together with that corresponding to BHET. Obtained oligomer contents, integrating the area under the peak, and their Mw and Mn are summarized in Table 3, where O1, O2, and O3 correspond to the fraction of BHET monomer, dimer, and oligomer, respectively, with retention times of 39, 36 and 37 min [33].
Among the three different signals shown, that corresponding to O1 is the most significant one, with a molar mass of 162–171 g/mol (Mw), related to BHET monomer [31]. Peaks with lower intensity appear around 36–38 min, related to BHET oligomers with 2–3 repeating units: O2 fraction with a corresponding molar mass of 362–384 g/mol (Mw), and O3 one with a molar mass of 559–600 g/mol (Mw).
As can be concluded from Table 3, the highest amount of BHET monomer is obtained after 20 min of reaction. The presence of dimer seems to be quite constant, while oligomer fraction is almost inexistent, as can be also seen in Figure 4, showing the fractions obtained with reaction time.
Monomer and dimer BHET fractions do not show a regular trend, increasing and decreasing for different reaction times, probably related to the fact that PET glycolysis is a reversible reaction, as shown in Scheme 3 [33].
It seems that PET depolymerization into dimer occurs in a relatively short time interval, depolymerization rate of dimer into BHET constituting an important parameter [33].
Regarding TGA analysis of different glycolyzed fractions Figure 5 shows both TGA and DTGA curves for all samples obtained, while main parameters are summarized in Table 4.
Two main mass losses are observed for all samples (Figure 5a). The highest mass loss occurs around 433 °C, constituting approximately the 65% of mass loss, related to the thermal degradation of PET that has been produced in the same thermogravimetric analysis process by the thermal polymerization of BHET [34]. The first loss of mass, a loss of 21–27%, is related to the thermal degradation of the monomer and oligomer fraction [34]. From the derivative curves of Figure 5b it is observed that for G30 and G180, the mass loss step occurs at lower temperatures than for G60 and G90. It could be attributed to the evolution of dimers or oligomers with low molar mass, as was previously seen by GPC, G60, and G90 presenting higher dimer fractions. Therefore, it can be deduced that the thermal degradation above 200 °C is related to dimers or oligomers with low molar mass, while if it occurs at lower temperatures is related with BHET monomer [29,31,35].
Finally, the effect of temperature on the glycolysis process has been analyzed, by performing glycolysis reactions at 180, 200 and 220 °C, for 30, 60, 90, and 180 min. Obtained reaction yields and insoluble fractions are shown in Figure 6.
Regarding insoluble fraction (Figure 6a), for 200 and 220 °C, after 30 min of reaction, is lower than 10%, while for the reaction at 180 °C the insoluble faction is considerably higher. As it can be seen in Figure 6b, above 30 min of reaction the BHET yield decreases for all the samples. This could be because the depolymerization reaction is reversible, therefore at 60 min of reaction the polymerization can occur, generating dimers or oligomers, as can be seen from GPC analysis shown in Figure 7. Temperature is a critical factor to take into account, as seen by results presented at 180 °C, at which for short reaction times as 30 and 60 min, the percentage of unreacted PET is 67% and 55%, respectively, considerably higher than those at higher temperatures.
Figure 7 shows BHET monomer and dimer fractions from products obtained at different temperatures and reaction times, as obtained by GPC.
Observing the values obtained for the reactions at different temperatures after 60 min, an upward trend is observed for the amount of dimer in the sample, confirming that after 60 min of reaction, the BHET polymerized being the oligomer fraction higher and the BHET fraction lower. Therefore, it can be stated that during glycolysis reaction, polymerization reaction also occurs, since it is an easily reversible reaction. From GPC analysis, it can be also concluded that for lower reaction times, samples with lower dispersity of molar mass are obtained, indicating the higher purity of BHET monomer. In that conditions, a single peak is observed in the GPC from Figure 8 at 39 min that is related with the monomer of BHET.

4. Conclusions

The depolymerization process of PET depends on temperature and reaction time and those parameters must be adjusted for optimizing the process. It has been shown that after 10 min of reaction at 220 °C under pressure, the final product obtained is mostly BHET. However, as reaction time increases, dimers and low molecular weight oligomers are also generated by the polymerization process occurring due to the reversibility of the depolymerization reaction of PET into BHET.
On the other hand, pure BHET has also been obtained in this work by working under pressure at 180 °C and 30 and 60 min of reaction, implying that depolymerization can also occur at lower temperatures and reaction times. For longer reaction times, the yield of BHET increases but the purity is lower, as the number of dimers and oligomers also increases. It has been seen that there is a direct relationship between the yield of BHET, the quantity of dimers and monomers analyzed by GPC, and the degradation temperatures: a higher fraction of dimer in the final product results into a higher degradation temperature.
The conditions of the depolymerization reaction of PET residue becomes of crucial importance, since depending on reaction conditions, products with different compositions and potential applications can be obtained. The use of a pressure reactor allows work at lower temperatures and reaction times, reducing the consumed energy during the process and in consequence, the environmental impacts of chemical recycling.

Author Contributions

Conceptualization, A.E. and C.P.-R.; methodology, E.M.-V. and G.M.; software, E.M.-V.; validation, C.P.-R. and A.E. formal analysis, E.M.-V.; investigation, E.M.-V.; resources, N.G.; data curation, G.K.; writing—original draft preparation, E.M.-V.; writing—review and editing, G.K.; visualization, C.P.-R.; supervision, N.G., A.E. and C.P.-R.; project administration, C.P.-R.; funding acquisition, A.E. and C.P-R. All authors have read and agreed to the published version of the manuscript.

Funding

This research received no external funding.

Institutional Review Board Statement

Not applicable.

Informed Consent Statement

Not applicable.

Data Availability Statement

The data presented in this study are available on request from the corresponding author.

Acknowledgments

Financial support from the Basque Country Government in the frame of IT-776-13 project and from the Provincial Council of Gipuzkoa (ItsasMikro project) are gratefully acknowledged. Moreover, we are grateful to the Macrobehav-ior-Mesostructure-Nanotechnology SGIker unit of UPV/EHU. Eider Mendiburu Valor thanks Basque Government for PhD grant (PRE_2018_1_0014).

Conflicts of Interest

The authors declare no conflict of interest.

References

  1. Wei, H.S.; Liu, K.T.; Chang, Y.C.; Chan, C.H.; Lee, C.C.; Kuo, C.C. Superior mechanical properties of hybrid organic-inorganic superhydrophilic thin film on plastic substrate. Surf. Coat. Technol. 2017, 320, 377–382. [Google Scholar] [CrossRef]
  2. PlasticsEurope. Plastics—the Facts 2019. Available online: https://www.plasticseurope.org/en (accessed on 18 September 2020).
  3. Chapa-Martínez, C.A.; Hinojosa-Reyes, L.; Hernández-Ramírez, A.; Ruiz-Ruiz, E.; Maya-Treviño, L.; Guzmán-Mar, J.L. An evaluation of the migration of antimony from polyethylene terephthalate (PET) plastic used for bottled drinking water. Sci. Total Environ. 2016, 565, 511–518. [Google Scholar] [CrossRef]
  4. Hu, Y.S.; Prattipati, V.; Mehta, S.; Schiraldi, D.A.; Hiltner, A.; Baer, E. Improving gas barrier of PET by blending with aromatic polyamides. Polymer 2005, 46, 2685–2698. [Google Scholar] [CrossRef]
  5. Petcore Europe. Recycled Products. Available online: https://www.petcore-europe.org/recycled-products.html (accessed on 18 September 2020).
  6. Dubelley, F.; Planes, E.; Bas, C.; Pons, E.; Yrieix, B.; Flandin, L. The hygrothermal degradation of PET in laminated multilayer. Eur. Polym. J. 2017, 87, 1–13. [Google Scholar] [CrossRef]
  7. Sammon, C.; Yarwood, J.; Everall, N. An FT–IR study of the effect of hydrolytic degradation on the structure of thin PET films. Polym. Degrad. Stab. 2000, 67, 149–158. [Google Scholar] [CrossRef]
  8. Holland, B.J.; Hay, J.N. The thermal degradation of PET and analogous polyesters measured by thermal analysis—Fourier transform infrared spectroscopy. Polymer 2002, 43, 1835–1847. [Google Scholar] [CrossRef]
  9. Pirzadeh, E.; Zadhoush, A.; Haghighat, M. Hydrolytic and thermal degradation of PET fibers and PET granule: The effects of crystallization, temperature, and humidity. J. Appl. Polym. Sci. 2007, 106, 1544–1549. [Google Scholar]
  10. El’Darov, E.G.; Mamedov, F.V.; Gol’Dberg, V.M.; Zaikov, G.E. A kinetic model of polymer degradation during extrusion. Polym. Degrad. Stab. 1996, 51, 271–279. [Google Scholar]
  11. Petcore Europe. Processing. Available online: https://www.petcore-europe.org/processing.html (accessed on 22 September 2020).
  12. Ghaderian, A.; Haghighi, A.H.; Taromi, F.A.; Abdeen, Z.; Boroomand, A.; Taheri, S.M.R. Characterization of rigid polyurethane foam prepared from recycling of PET waste. Period. Polytech. Chem. Eng. 2015, 59, 296–305. [Google Scholar]
  13. George, N.; Kurian, T. Recent developments in the chemical recycling of postconsumer poly (ethylene terephthalate) waste. Ind. Eng. Chem. Res. 2014, 53, 14185–14198. [Google Scholar]
  14. Abdelaal, M.Y.; Sobahi, T.R.; Makki, M.S.I. Chemical transformation of pet waste through glycolysis. Constr. Build. Mater. 2011, 25, 3267–3271. [Google Scholar] [CrossRef]
  15. Nikles, D.E.; Farahat, M.S. New motivation for the depolymerization products derived from poly (ethylene terephthalate) (PET) waste: A review. Macromol. Mater. Eng. 2005, 290, 13–30. [Google Scholar] [CrossRef]
  16. Güçlü, G.; Kas göz, A.; Özbudak, S.; Özgümüs, S.; Orbay, M. Glycolysis of poly (ethylene terephthalate) wastes in xylene. J. Appl. Polym. Sci. 1998, 69, 2311–2319. [Google Scholar] [CrossRef]
  17. Al-Sabagh, A.M.; Yehia, F.Z.; Eshaq, G.; Rabie, A.M.; ElMetwally, A.E. Greener routes for recycling of polyethylene terephthalate. Egypt. J. Pet. 2016, 25, 53–64. [Google Scholar] [CrossRef] [Green Version]
  18. Chaudhary, S.; Surekha, P.; Kumar, D.; Rajagopal, C.; Roy, P.K. Microwave assisted glycolysis of poly (ethylene terepthalate) for preparation of polyester polyols. J. Appl. Polym. Sci. 2013, 129, 2779–2788. [Google Scholar] [CrossRef]
  19. Wang, H.; Liu, Y.; Li, Z.; Zhang, X.; Zhang, S.; Zhang, Y. Glycolysis of poly (ethylene terephthalate) catalyzed by ionic liquids. Eur. Polym. J. 2009, 45, 1535–1544. [Google Scholar] [CrossRef]
  20. Chen, J.W.; Chen, L.W.; Cheng, W.H. Kinetics of glycolysis of polyethylene terephthalate with zinc catalyst. Polym. Int. 1999, 48, 885–888. [Google Scholar] [CrossRef]
  21. Imran, M.; Al-Masry, W.A.; Mahmood, A.; Hassan, A.; Haider, S.; Ramay, S.M. Manganese-, cobalt-, and zinc-based mixed-oxide spinels as novel catalysts for the chemical recycling of poly (ethylene terephthalate) via glycolysis. Polym. Degrad. Stab. 2013, 98, 904–915. [Google Scholar] [CrossRef]
  22. López-Fonseca, R.; Duque-Ingunza, I.; De Rivas, B.; Arnaiz, S.; Gutiérrez-Ortiz, J.I. Chemical recycling of post-consumer PET wastes by glycolysis in the presence of metal salts. Polym. Degrad. Stab. 2010, 95, 1022–1028. [Google Scholar] [CrossRef]
  23. Baliga, S.; Wong, W.T. Depolymerization of poly (ethylene terephthalate) recycled from post-consumer soft-drink bottles. J. Polym. Sci. Part A Polym. Chem. 1989, 27, 2071–2082. [Google Scholar] [CrossRef]
  24. Viana, M.E.; Riul, A.; Carvalho, G.M.; Rubira, A.F.; Muniz, E.C. Chemical recycling of PET by catalyzed glycolysis: Kinetics of the heterogeneous reaction. Chem. Eng. J. 2011, 173, 210–219. [Google Scholar] [CrossRef]
  25. Chen, J.Y.; Ou, C.F.; Hu, Y.C.; Lin, C.C. Depolymerization of poly (ethylene terephthalate) resin under pressure. J. Appl. Polym. Sci. 1991, 42, 1501–1507. [Google Scholar] [CrossRef] [Green Version]
  26. Chen, J.W.; Chen, L.W. The glycolysis of poly (ethylene terephthalate). J. Appl. Polym. Sci. 1999, 73, 35–40. [Google Scholar] [CrossRef]
  27. Campanelli, J.R.; Kamal, M.R.; Cooper, D.G. Kinetics of glycolysis of poly (ethylene terephthalate) melts. J. Appl. Polym. Sci. 1994, 54, 1731–1740. [Google Scholar] [CrossRef]
  28. Aguado, A.; Martínez, L.; Becerra, L.; Arieta-Araunabeña, M.; Arnaiz, S.; Asueta, A.; Robertson, I. Chemical depolymerisation of PET complex waste: Hydrolysis vs. glycolysis. J. Mater. Cycles Waste Manag. 2014, 16, 201–210. [Google Scholar] [CrossRef]
  29. Ptiček Siročić, A.; Fijačko, A.; Hrnjak-Murgić, Z. Chemical recycling of postconsumer poly (ethylene-terephthalate) bottles–depolymerization study. Chem. Biochem. Eng. Q. 2013, 27, 65–71. [Google Scholar]
  30. Imran, M.; Kim, B.K.; Han, M.; Cho, B.G. Sub-and supercritical glycolysis of polyethylene terephthalate (PET) into the monomer bis (2-hydroxyethyl) terephthalate (BHET). Polym. Degrad. Stab. 2010, 95, 1686–1693. [Google Scholar] [CrossRef]
  31. Fang, P.; Liu, B.; Xu, J.; Zhou, Q.; Zhang, S.; Ma, J. High-efficiency glycolysis of poly (ethylene terephthalate) by sandwich-structure polyoxometalate catalyst with two active sites. Polym. Degrad. Stab. 2018, 156, 22–31. [Google Scholar] [CrossRef]
  32. Donelli, I.; Freddi, G.; Nierstrasz, V.A.; Taddei, P. Surface structure and properties of poly-(ethylene terephthalate) hydrolyzed by alkali and cutinase. Polym. Degrad. Stab. 2010, 95, 1542–1550. [Google Scholar] [CrossRef] [Green Version]
  33. López-Fonseca, R.; Duque-Ingunza, I.; de Rivas, B.; Flores-Giraldo, L.; Gutiérrez-Ortiz, J.I. Kinetics of catalytic glycolysis of PET wastes with sodium carbonate. Chem. Eng. J. 2011, 168, 312–320. [Google Scholar] [CrossRef]
  34. Chen, C.H. Study of glycolysis of poly (ethylene terephthalate) recycled from postconsumer soft-drink bottles. III. Further investigation. J. Appl. Polym. Sci. 2003, 87, 2004–2010. [Google Scholar] [CrossRef]
  35. Geng, Y.; Dong, T.; Fang, P.; Zhou, Q.; Lu, X.; Zhang, S. Fast and effective glycolysis of poly (ethylene terephthalate) catalyzed by polyoxometalate. Polym. Degrad. Stab. 2015, 117, 30–36. [Google Scholar]
Scheme 1. PET glycolysis reaction and products purification before characterization.
Polymers 13 01461 sch001
Scheme 2. Mechanism for glycolysis reaction [29,30].
Polymers 13 01461 sch002
Figure 1. FTIR spectra of PET and reaction products: (a) FTIR spectra of reference PET and BHET together with that of the product obtained after 10 min of reaction; (b) FTIR spectra of products obtained at different reaction times together with that of the reference BHET; (c) Band corresponding to aliphatic groups –CH2–, for G products, BHET and PET; (d) Band corresponding to ester groups C=O, for G products, BHET and PET.
Polymers 13 01461 g001aPolymers 13 01461 g001b
Figure 2. DSC thermograms corresponding to the products obtained at different reaction times.
Polymers 13 01461 g002
Figure 3. GPC traces for reaction products obtained at different times, together with that of BHET.
Polymers 13 01461 g003
Figure 4. Fractions of different compounds as obtained by GPC at different reaction times.
Polymers 13 01461 g004
Scheme 3. Reversible PET glycolysis reaction.
Polymers 13 01461 sch003
Figure 5. TGA (a) and DTGA (b) curves for samples obtained at different reaction times.
Polymers 13 01461 g005
Figure 6. Reaction yield (a) and insoluble fraction (b) values vs. reaction time at 180, 200 and 220 °C.
Polymers 13 01461 g006
Figure 7. BHET monomer and dimer fraction values of reaction compounds at different reaction temperatures and times, as calculated by GPC.
Polymers 13 01461 g007
Figure 8. GPC results for the depolymerization at 180 °C for different reaction times.
Polymers 13 01461 g008
Table 1. Comparative between depolymerization procedures found in the literature and other present work.
ReferenceMethodTime
(h)
Temperature
(°C)
Pressure
(at)
CatalystRatio PET:EG Yield
(%)
[16]Glycolysis in
xylene
1–3170–245 --1:0.5–1:3
Molar ratio
20
[18]Glycolysis by microwave
irradiation
0.5180–190-ZnAc 0.5 %1:2,1:4, 1:6
Molar ratio
40
[19]Ionic liquids as reaction
medium
5–10160–1951Ionic liquids
1–4 L
1:4
(w/w)
Max Yield 78
Conversion 70
[20]Glycolysis in a pressure reactor 235–275High pressureZnAc1:1.3
(w/w)
-
[21]Autoclave
reactor
12605 ZnMn2O4 1 %5:86
Molar ratio
92.2
[22]Glycolysis at
atmospheric pressure
1–21961 ZnAc 1 %
Or
Na2CO3 1%
1:7.6
Molar ratio
70
[23]Glycolysis in potassium
nitrate bath
8190-Metal acetate1:4
Molar ratio
-
[24]Glycolysis at
atmospheric pressure
1–4180–1901 ZnAc 2.35 %1:4
(w/w)
91.6
[25]Glycolysis
under pressure
0.5–3190–2401–6.12-1:1–1:4
Molar ratio
-
[26]Glycolysis at
atmospheric pressure
2–101901ZnAc 0.25–0.75 %1:4
Molar ratio
-
Our workGlycolysis
under pressure
10–1802203 barZnAc 1 %1:3
(w/w)
55–71
Table 2. Insoluble fraction and yield values obtained at 220 °C at several reaction times.
FractionInsoluble (%)ƞ (%)
G105.7855.00 ± 10
G208.0359.67 ± 14
G307.3967.75 ± 9
G405.1358.34 ± 4
6505.4762.95 ± 6
G605.8863.29 ± 3
6903.9770.60 ± 9
G1806.4157.71 ± 6
Table 3. Oligomer content (%) and Mw and Mn values as obtained by GPC.
SamplesO1
Mn = 155–167 g/mol
Mw = 160–171 g/mol
(%)
O2
Mn = 358–379 g/mol
Mw = 362–384 g/mol
(%)
O3
Mn = 556–595 g/mol
Mw = 559–600 g/mol
(%)
G1083.8314.611.46
G20 87.4011.710.89
G30 83.9714.581.45
G40 81.5616.671.67
G50 82.9715.511.47
G60 80.0517.662.11
G90 80.2517.651.93
G180 85.4313.311.26
Table 4. Main parameters obtained by thermogravimetric analysis.
Samples1. Step2. Step
Time
(Min)
T1
(°C)
Mass Loss
(%)
T2
(°C)
Mass Loss
(%)
3018322.6243270.27
6027127.3143464.4
9026726.7743364.68
18019824.4143367.29
Publisher’s Note: MDPI stays neutral with regard to jurisdictional claims in published maps and institutional affiliations.

