Abstract
Various methods for morphological, textural, and structural characterization of polymeric, carbon, and oxide adsorbents have been developed and well described. However, there are ways to improve the quantitative information extraction from experimental data for describing complex sorbents and polymer fillers. This could be based not only on probe adsorption and electron microscopies (TEM, SEM) but also on small-angle X-ray scattering (SAXS), cryoporometry, relaxometry, thermoporometry, quasi-elastic light scattering, Raman and infrared spectroscopies, and other methods. To effectively extract information on complex materials, it is important to use appropriate methods to treat the data with adequate physicomathematical models that accurately describe the dependences of these data on pressure, concentration, temperature, and other parameters, and effective computational programs. It is shown that maximum accurate characterization of complex materials is possible if several complemented methods are used in parallel, e.g., adsorption and SAXS with self-consistent regularization procedures (giving pore size (PSD), pore wall thickness (PWTD) or chord length (CLD), and particle size (PaSD) distribution functions, the specific surface area of open and closed pores, etc.), TEM/SEM images with quantitative treatments (giving the PaSD, PSD, and PWTD functions), as well as cryo- and thermoporometry, relaxometry, X-ray diffraction, infrared and Raman spectroscopies (giving information on the behavior of the materials under different conditions).
1. Introduction
The textural characteristics of unmodified and functionalized solid adsorbents and polymer fillers, such as metal and metalloid oxides (synthetic silica, alumina, titania, complex materials, natural zeolites, clays, etc.) and carbons (chars, activated carbons (AC), carbon blacks, carbon nanotubes (CNT), carbon nanofibers (CNF), carbon nanocomposites (CNC), graphene, graphene oxides (GO), etc.), are typically better-studied (as relatively rigid solids with stable characteristics) than those of polymer adsorbents [1,2,3,4,5,6,7,8,9,10,11,12,13,14,15,16,17,18,19,20,21,22,23,24,25]. The latter may be characterized by lower stability of the textural characteristics than stable and rigid solids due to various effects of dispersion media, swelling, aging, freezing with liquids, heating, mechanical loading, as well as due to high fractality, strongly tortuous pores, and disordered texture of nonrigid polymers [26,27,28,29,30,31,32,33,34]. Various composites [35,36,37,38], nanostructured polymers [39,40,41,42,43,44,45], polymer/oxides [46,47,48], and polymer/carbons [49,50,51,52] composites are of interest from a practical point of view. However, accurate textural characterization of polymeric composites, complex filler–polymer and filler–polymer–polymer systems is a more difficult task than a similar challenge for individual oxide, carbon, or polymeric materials. To solve the characterization tasks for complex and hybrid materials, several experimental methods should be used in parallel. Among the textural characterization methods, the adsorption of probes (nitrogen, argon, carbon dioxide, or benzene) is most frequently used [1,2,3,4,5,6]; however, for composites and hybrids, some problems arise. Therefore, additional methods, such as small-angle X-ray or neutrons scattering (SAXS, SANS) [53,54,55,56,57,58], X-ray diffraction (XRD) [59,60,61], high-resolution transmission (HRTEM) and scanning (SEM) electron microscopies [59,62], nuclear magnetic resonance (NMR) spectroscopy with cryoporometry and relaxometry [15,63,64,65], differential scanning calorimetry (DSC) and thermoporometry [66], infrared spectroscopy (FTIR), thermogravimetry (TG) and thermoporometry, dielectric relaxation spectroscopy (DRS), thermally stimulated depolarization current (TSDC) and relaxometry, theoretical simulations, etc. [67,68,69,70,71,72,73,74,75,76,77,78,79,80,81,82,83,84,85,86] should be used. Besides the textural characteristics, the data of these methods allow one to obtain information on the materials’ behavior under different conditions, which could model real situations related to practical applications. However, even accurate experimental data cannot guarantee accurate characterization of the materials because the data could be indirect and, therefore, need additional and typically complex computational treatments. In other words, certain appropriate physicomathematical tools should be applied to obtain anticipated accurate characteristics of complex materials. Typically, the treatment tools include model equations describing various experimental dependences, such as adsorption vs. pressure (gaseous phase) or concentration (liquid phase), scattering intensity vs. scattering angle, freezing/melting or heat flow vs. temperature, etc. To analyze these dependencies (typically complex for complex materials), certain model equations should be used and treated with the applied mathematics methods (used, e.g., to solve integral and differential equations, to minimize functionals, to regularize experimental noise effects, etc.) and related computer programs [3,4,5,6,7,8,31,32,53,54,55,56,63,64,74,75,76,77,78,79,80,81,82,83,84,85,86,87]. Even if the experimental methods give direct information (e.g., TEM, SEM) that certain computer methods and programs should be used to obtain quantitative characteristics, e.g., the particulate morphology, porosity, particle and crystallite size distributions, etc. There are additional problems with the correspondence of the models to complex materials, experimental methods, data, and conditions. For example, using inappropriate models (e.g., the BJH adsorption model developed for mesoporous materials for computation of the PSD for nanoporous materials) or unreasonable ignoration of the top possibilities of a method used (e.g., obtained SAXS data are not treated for comprehensive textural characterization) can result in an incomplete or incorrect picture on the textural characteristics [28,54,87,88]. Clearly, the tasks mentioned above become more complex for nonuniform and multicomponent systems. Note that firm software used with various adsorption analyzers is oriented on such simple materials as silica or carbon, i.e., the treatment results with this software are rather incorrect for complex and hybrid composites. Therefore, to increase the reliability and validity of the characterization of complex systems, several experimental and theoretical methods should be used in parallel with software, including models for complex materials [28,32,54,89,90,91], and this aspect is analyzed here in detail.
There are several adsorbent classes with different textural features. Therefore, it is difficult to accurately describe their various blends using firm software [87,89,90]. There are (i) synthetic highly disperse oxides (fumed silica, alumina, titania, binary and ternary fumed oxides) composed of spherical-like nonporous nanoparticles (NPNP); (ii) natural nanostructured oxides (clays, zeolites) with a complex shape of pores; (iii) porous oxides (silica gels, ordered mesoporous silicas, complex oxides) mainly with cylindrical pores, but with certain deviations and surface roughness; (iv) carbons (chars, activated carbons, graphene, graphene oxide, exfoliated graphite, nanotubes, carbon blacks, fullerites), which can have not only slit-shaped pores but also spherical, cylindrical, wedge-shaped and other pores; (v) polymers (1D, 2D, 3D hydrophobic and hydrophilic, functionalized, synthetic and natural) with complicated and tortuous pore networks; (vi) metal–organic framework structures with complex pore shapes; (vii) complex and hybrid systems with components of different kinds or classes [1,2,3,4,5,6,7,8,9,10,11,12,28,32]. Composites and hybrids can have pores with a shape different from that characteristic for individual components because of the possible penetration of one component into pores of other components. Therefore, the additive models could not appropriately work for composites.
The main characteristics of adsorbents or polymer fillers are linked to their specific surface area (rather accessible than total), porosity (pore volume, pore size and pore wall thickness distributions), adsorption surface sites (types and content), hydrophobicity/hydrophilicity, swelling, freezing of pore-confined liquids (especially water), conformation stability in different media vs. temperature, effects of dispersion media, adsorbates, co-adsorbates, etc. These characteristics could be changed during aging, mixing, wetting, drying, mechanical loading, etc. Additionally, these changes could be different for different components of the composites. Despite only a certain part of the characteristics of adsorbents or fillers can play a crucial role on the practical applications, the accurate determination of these characteristics remains a complex task.
In this work, some aspects of relatively comprehensive characterization of individual and complex, unmodified and functionalized materials with oxides, carbons, and polymers are analyzed to show the possibilities of parallel applications of several experimental methods with the treatment of the data with simple regularization/functional minimization or more complex self-consistent regularization procedures [87,89,90,91,92] and other applied mathematics and computational methods. Note that some experimental methods, which complement each other well, can give different pictures on the same materials. For example, nitrogen (or Ar, CO2, C6H6) adsorption and SAXS can give significantly discriminate information (specific surface area, S, pore size distributions, PSD, pore wall thickness distributions, PWTD, particle size distributions, PaSD, etc.) on accessible (open) and both accessible/inaccessible (open/closed) pores, respectively [54,55,56,93]. Additionally, the degree of pore accessibility depends on an adsorbed probe’s molecular size; therefore, different probes can give different information [3,4,5,6,94,95,96]. However, accurate and intelligent comparison of all the data allows one to obtain much more information on the materials than in the case of using only one method. Note that it is important to use the models accurately describing each component of the materials studied. For example, for highly disperse silicas composed of NPNP, a model of voids between spherical particles in random aggregates is better than a model of cylindrical pores in silica. For composites, various models, including different pore shapes for different components, e.g., for carbon/nanooxides, polymer/nanooxides, polymer/carbons, etc. (described here), are much better than any simple model (from firm software) for any individual material as a component of composites because it poorly describes other components with different textures [87,89,90]. Unfortunately, the simplified approach for textural characterization of composites based on the firm adsorption methods with firm software is typically used.
The effects of temperature, media, swelling, freezing/melting, confined space effects, etc., which may affect the textural characteristics, could be analyzed using a set of methods, such as NMR cryoporometry and relaxometry, DCS thermoporometry, TSDC relaxometry, TG thermoporometry, probe adsorption from liquid and gaseous phases, electron microscopies, etc. The application of some additional methods in parallel to the adsorption, SAXS, and TEM/SEM can give relatively comprehensive information on complex materials being under different conditions. Additionally, this allows one to forecast changes in the characteristics, temperature and interfacial behaviors of the complex materials under different conditions that are of importance from a practical point of view. Thus, this work aims to show certain aspects of relatively comprehensive characterization of complex materials of different types affected by dispersion media, temperature, pressure, aging time, and other conditions using a set of experimental and theoretical methods. In these approaches, the differences in the component characteristics are considered at a model level and considered upon using the self-consistent regularization procedures giving information on the contributions of the components into total characteristics, such as the PSD and PaSD functions. Some additional details on the materials analyzed here and used methods are given in Supplementary Materials file.
2. Materials and Methods
2.1. Materials
In this comparative study, various unmodified, modified and complex materials are used. First, highly disperse fumed metal and metalloid oxides (FMO with silica, alumina, titania, and related binary and ternary oxides, Pilot plant of Chuiko Institute of Surface Chemistry (CISC), Kalush, Ukraine) and Cab–O–Sil HS5 (Cabot Corp., Boston, USA) are characterized by certain distributions of NPNP and the specific surface area SBET in the range of 30–500 m2/g, bulk density ρb = 0.04–0.15 g/cm3, pore volume Vp = 0.1–1.5 cm3/g, and large empty volume in the powders Vem = 4–25 cm3/g. Second, porous silica gels Si-40, Si-60, Si-100 (Merck); HP39 and Gasil 200DF (Crosfield Ltd., Warrington, UK), ordered mesoporous silicas MCM-41, MCM-48, and SBA-15 (CISC), and precipitated silica Sipernat 50 (Evonik) represent spherical-like particles in the millimeter range at SBET = 300–1200 m2/g. Third, highly porous chars and activated carbons (AC) (MAST Carbon Technology Ltd., UK; Hypersil, Astmoor, UK; Wood Dry Distillation Works and HPSD, Hajnówka, and PSO MASKPOL, Poland, CISC) at SBET = 500–3500 m2/g and Vp = 0.5–3.0 cm3/g. Four, polymers, such as natural (starch, etc.) and synthetic (poly(vinyl pyrrolidone (PVP), poly(vinyl alcohol) (PVA), polydimethylsiloxane (PDMS), polymethylsiloxane (PMS), polystyrene, copolymers of styrene and divinylbenzene, acrylic ester polymer, a copolymer of 1,4-phenylene dimethacrylate and divinylbenzene, and others were studied under different conditions. Additionally, complex and hybrid systems with PVA/AC, fumed silica/PDMS, etc., are described here mainly concerning the morphological and textural characteristics. All these materials can be considered as representatives of various classes of simple and complex adsorbents and polymer fillers described in detail elsewhere [4,5,6,7,8,9,10,11,12,28,31,32,54,55,56,74,75,76,77,78,79,80,81,82,83,84,85,86,87,89,90,91]. Some details on the materials used here are given in the Supplementary Materials file.
2.2. Methods
The adsorption of probe (nitrogen, benzene) compounds was used to evaluate the accessible surface area, pore volume, and pore and particle size distributions. The nitrogen adsorption–desorption isotherms (Micromeritics ASAP 2010, 2020, 2405N, or 2420 and Quantachrome Autosorb adsorption analyzers) could be used to compute the pore size distributions (differential PSD fV(R) ~dVp/dR and fS(R) ~dS/dR) using various approaches [32,87,89,90]. Some simple approaches could include various systematic errors caused by an inappropriate model of pores (e.g., cylindrical pores poorly model voids between NPNP in supra-NPNP structures), inappropriate parameters of solids (e.g., parameters of carbons poorly describe polymeric adsorbents), etc. As a whole, for materials with the complex topology of pores or/and composed of several different phases (e.g., FMO and polymers or carbons, etc.), firm (Micromeritics, Quantachrome, etc.) software can give incorrect results with systematic errors. Better results could be obtained using complex pore models with slit-shaped (S) and cylindrical (C) pores and voids (V) between spherical nanoparticles (SCV method) with the corresponding parameters for different phases [87,89,90]. Additionally, the chemical structure of a solid surface (e.g., hydroxyls or other functionalities) can affect the interactions (and orientation, i.e., effective area of a surface occupied by a molecule) of nitrogen or other probe molecules with a surface that can be studied using quantum chemistry methods (see Supplementary Materials file). The SCV method with a self-consistent regularization (SCR) procedure [87] allows one to consider the presence of several phases since the parameters of several types of surfaces (e.g., silica, alumina, titania, carbon, carbohydrate polymers, etc.) could be simultaneously used with an appropriate pore model for each component. The SCR/SCV procedure gives information on contributions (weight coefficients) of different pore types and different components into the total porosity and specific surface area. As a whole, the model errors can remain upon using the SCV/SCR method because the texture of any adsorbent is not strongly ordered (pores can have very complex shapes) and affected by surface roughness, etc. However, the SCV/SCR method reduces the systematic errors appearing upon applying the firm software for complex materials. Note that the PSD could be calculated using molecular density functional theory (DFT) methods, such as nonlocal DFT (NLDFT), quenched solid DFT (QSDFT), 2D-NLDFT, well-developed modified Nguyen–Do (MND) method or others. For better view of the PSD at large values of R, the differential PSD concerning the pore volume fV(R) ~dV/dR, ∫fV(R)dR ~Vp could be recalculated to incremental PSD (IPSD) at ΦV(Ri) = (fV(Ri+1) + fV(Ri))(Ri+1 − Ri)/2 at ∑ΦV(Ri) = Vp. The fV(R) and fS(R) functions could also be used to calculate contributions of nanopores (Vnano and Snano at the radius in the range 0.35 nm < R < 1 nm), mesopores (Vmeso and Smeso at 1 nm < R < 25 nm), and macropores (Vmacro and Smacro at 25 nm < R < 100 nm) into the total pore volume and specific surface area. Clear, an incorrect PSD results in incorrect values of the textural characteristics. Some additional information on the adsorption methods is given in Figures S1–S16 and Table S1 in the Supplementary Materials file.
The spectral (NMR (Varian 400 Mercury or Agilent DD2 600 MHz NMR spectrometer, Agilent, Santa Clara), FTIR (FTIR 1725× PerkinElmer (PerkinElmer Inc., Waltham, MA, USA) or Specord M80 (Carl Zeiss, Jena, Germany), and Raman (inVia Reflex, Renishaw, Charfield, UK) spectroscopy) methods were used to analyze the chemical structure of the materials, content and composition of surface functionalities, structure of the adsorption layers at a surface of different materials [28]. Some IR spectra are shown in Figures S17–S20.
The differential PSD functions f(r) based on the SAXS data (Empyrean diffractometer, PANalytical, Cu Kα radiation at λ = 0.15418 nm, 2θ = 0.5–5°) were calculated using Fredholm integral equation of the first kind for scattering intensity I(q), as well as the total surface area, pore, pore wall and particle size distributions [54,55,56] (see Supplementary Materials file, Figures S21–S25). The main advantage of the SAXS method upon the textural characterization is that all open and closed pores could be analyzed in contrast to the adsorption methods giving the characteristics only of pores accessible for probe molecules. The SAXS patterns could be used to compute the PaSD for spherical, cylindrical, or lamellar particles alone or in any mixture (see Supplementary Materials file). For the latter, the self-consistent regularization procedure allows us to estimate the contributions of particles of different shapes [55,56].
The TEM (TECNAI G2 F30 microscope, FEI–Philips or JEM–2100 F, Tokyo, Japan) and SEM (QuantaTM 3D FEG, FEI, FE–SEM, Hitachi S–4700, Tokyo, Japan, or FEI NovaSEM 230) methods were used to analyze the particulate morphology, particle size distributions, and porosity (see Figures S26–S31). The TEM/SEM PaSD can be calculated using such software as ImageJ (with granulometry plugin) [97], Fiji (with local thickness plugin) [98], and some others [85,86].
For the textural and morphological characterization of various materials, the thermal characteristics NMR, DSC (PYRIS Diamond (PerkinElmer Instruments, Waltham, MA, USA), TSDC (Novocontrol Technologies), and TG (Derivatograph Q-1500 D apparatus, MOM, Budapest, Hungary) with related cryo- and thermoporometry, and relaxometry) and colloidal data (QELS for PaSD) could be effectively used as additional tools [28]. Their use is based on the confined space effects depending on pore sizes and features of the temperature behavior (freezing/melting, adsorption/evaporation, relaxation time, dipolar currents, etc.) of adsorbates located in different pores (see Figures S32–S39).
A certain set of methods could be selected for each type of the materials (being under certain conditions in certain dispersion media) and characteristics to obtain appropriate and quite comprehensive information. Here some aspects of the textural and morphological characterization of various materials are analyzed. This is done concerning the selection of experimental methods, models, and related treatments of the data using certain approaches and methods. They provide a set of the distribution functions of the characteristic parameters, such as PSD, PaSD, and PWTD, with the parallel evaluation of contributions of pores and particles of different shapes for a more comprehensive description of the materials. These approaches include model integral equations solved with the self-consistent regularization procedures. Some details of the used methods (experimental, Sections S1–S9, Figures S1–S39, Table S1, Equations (S1)–(S34), and theoretical, Section S10, Figures S40–S50, Tables S2 and S3) are described in detail in Supplementary Materials file.
3. Results and Discussion
There is a complex problem of accurate evaluation of the textural characteristics of composites using adsorption methods [87,89,90]. The estimated textural characteristics depend on a kind of probe adsorbate, pretreatment and measurement conditions, used data treatment methods, as well as on chemical composition, particulate morphology and texture of the materials. Even estimation of the specific surface area (SBET) (as a simple task in the textural characterization) depends on several factors: (i) a type of probe adsorbate (nitrogen, argon, benzene, carbon dioxide, etc.), (ii) the pressure range applied on calculations, (iii) the surface area (σ0) occupied by an adsorbate molecule (e.g., the σ0 value for nitrogen adsorbed onto carbons and metal/metalloid oxides differs as 0.162 and 0.137 nm2, respectively, due to adsorbed molecule orientation effects), (iv) pore shapes and accessibility, etc. [5,93] (see Figure S1 in Supplementary Materials file).
The tasks of estimation of the pore volume (Vp and its components Vnano at radius R < 1 nm, Vmeso at 1 nm < R < 25 nm, and Vmacro at R > 25 nm) and PSD have several aspects. Some adsorbents composed of relatively stable nanoparticles (e.g., nanosilica, Figure S2) demonstrate textural instability of upper-hierarchy structures, such as aggregates of NPNP and agglomerates of aggregates (supra-NPNP structures). Therefore, any treatment (e.g., mechanical loading, mechanochemical activation (MCA), hydrocompaction, etc.) results in significant changes in the supra-NPNP structures concerning the textural characteristics (Vp and PSD, Figure S3). It is also affected by aging (Figure S4), mixing with polymers (Figure S5), surface modification (Figure S11) in contrast to the PaSD of stable NPNP (Figure S2). Some other adsorbents, e.g., complex nanooxides (Figures S6, S7, and S10), carbons (Figures S8, S9 and S13), porous polymers (S12), can undergo significant textural changes upon activation, modification, washing or wetting–freezing. However, their chemical structure practically does not change (Figures S19 and S20). Note that the analysis of the water adsorption (Figures S14–S16, and appearing in several bands in the IR spectra, Figures S17–S20) needs special approaches (Equations (S9)–(S12)) because water tends to be adsorbed in various clusters [28] in contrast to nitrogen or argon, which weakly sense the surface chemistry [3,93,94]. Thus, the textural and morphological characterization of various materials is not a simple task.
The use of several different parallel methods that consider the nature of the materials (especially complex and hybrid) may improve the reliability of obtained morphological and textural characteristics. For example, such a set of methods as adsorption and SAXS (Figures S21–S25), TEM/SEM with appropriate treatment of images, adsorption and infrared spectroscopy (Figures S26–S31), SAXS and QELS (Figure S32), NMR cryoporometry (Figures S33 and S34), DSC thermoporometry (Figure S35), TSDC relaxometry (Figures S36–S38), confocal laser scanning microscopy (Figure S39), and theoretical modeling (Figures S40–S50) gives much more morphological, textural, and structural information. This may provide a much better and complete characterization of complex materials than the use only of one method (e.g., adsorption or TEM) from this set. As a whole, using the adsorption, microscopic, spectral (FTIR, Raman, XPS, etc.), and structural (XRD, NMR, EDAX, and TPD MS) methods allows one to obtain a practically comprehensive characterization of simple, complex, and hybrid materials.
Certain features inherent in each method should be considered upon the parallel use of a set of different methods. For example, there is a significant difference in the material characterization based on the adsorption and SAXS methods. The former gives information on accessible (open) surface/pores, but the latter gives information on both open and closed pores. This difference is especially large for carbon adsorbents with a small degree of activation (i.e., at a large contribution of closed pores), e.g., for the pore size distributions (Figure 1, comp. char with zero burn-off and AC with various burn-off activation, and Figure 2, Figure 3, Figure 4, Figure 5, Figure 6 and Figure 7, S13 and S22). The difference in the results based on the SAXS and adsorption data strongly decreases with increasing activation degree (contribution of closed pores decreases at a high burn-off degree) [54]. Typically, the specific surface area evaluated from the SAXS data (SSAXS) is larger than the SBET value estimated from the adsorption data. The S difference (as well as PSD) decreases with increasing activation degree. For example, for char/bentonite, SBET = 122 m2/g and SSAXS = 262 m2/g (i.e., only 46.6% of the total surface area is accessible for the nitrogen molecules), but for AC at 60% burn-off, 90.4% of the surface is accessible for the nitrogen molecules (Figure 1).
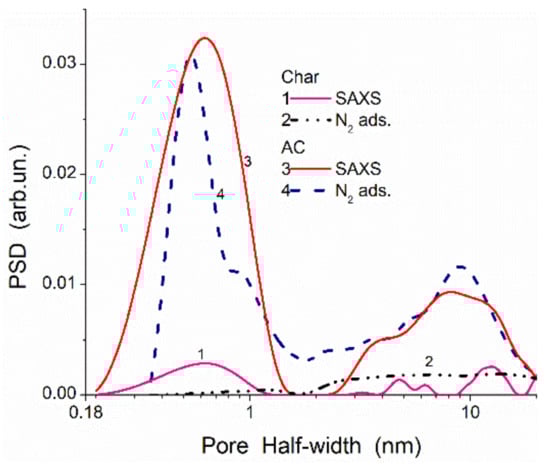
Figure 1.
Pore size distributions of a char/bentonite (20/80 w/w) composite (SBET = 122 m2/g and SSAXS = 262 m2/g), prepared upon carbonization of resorcinol–formaldehyde resin added to bentonite (curves 1 and 2), and activated carbons (AC) (carbonization of phenol–formaldehyde resin and subsequent activation by CO2 at 1183 K with 60% burn-off) (SBET = 1999 m2/g and SSAXS = 2211 m2/g, curves 3 and 4) calculated using SAXS (curves 1 and 3) and nitrogen adsorption–desorption isotherms with a model of slit-shaped and cylindrical pores and voids between nanoparticles with self-consistent regularization procedure (SCV/SCR) (curves 2 and 4) methods.
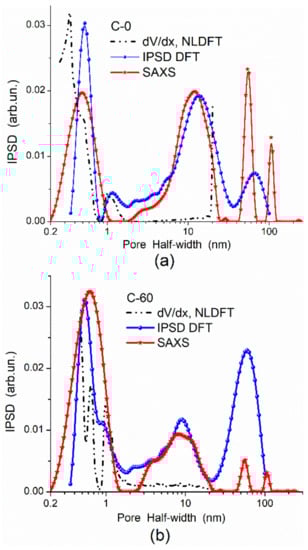
Figure 2.
Comparison of pore sizes (PSDs) calculated from the N2 adsorption and SAXS data for samples (a) C−0 (phenol–formaldehyde char, SBET = 549 m2/g, char with zero burn-off) and (b) C-60 (AC with 60% burn-off, SBET = 1999 m2/g).
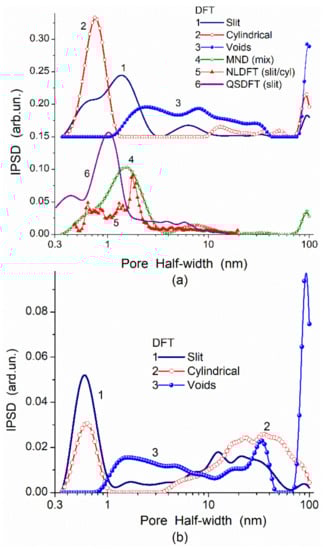
Figure 3.
Comparison of incremental PSDs (IPSDs) for (a) C-86 (86% burn-off, SBET = 3461 m2/g, pore volume Vp = 2.32 cm3/g) and (b) C-30 (30% burn-off, SBET = 1145 m2/g, Vp = 1.19 cm3/g) computed from the nitrogen adsorption isotherms using different models of pores (slit-shaped and cylindrical pores, voids between spherical particles, mixtures with slit/cylindrical pores or slit/cylindrical/voids) calculated with molecular density functional theory (DFT), modified Nguyen–Do (MND), nonlocal DFT (NLDFT), and quenched solid DFT (QSDFT) methods.
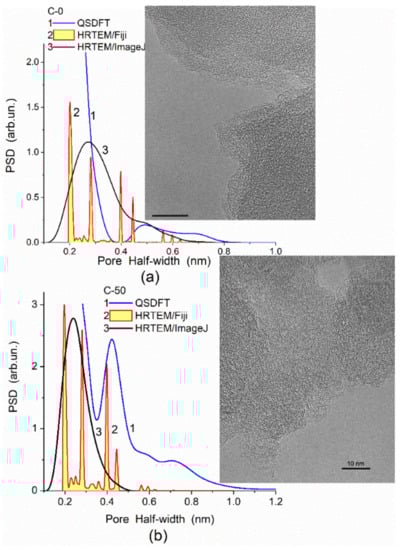
Figure 4.
PSD calculated using the QSDFT method with slit-shaped pore model for (a) char (porous phenol–formaldehyde resin beads were heated in a CO2 flow to 1073 K at a ramp rate of 3 K/min, SBET = 590 m2/g) and (b) AC with 50% burn-off (SBET = 1664 m2/g); inserts show HRTEM images of these carbons (scale bar 10 nm) used to obtain the PSD with Fiji (local thickness plugin) and ImageJ (granulometry plugin) software.
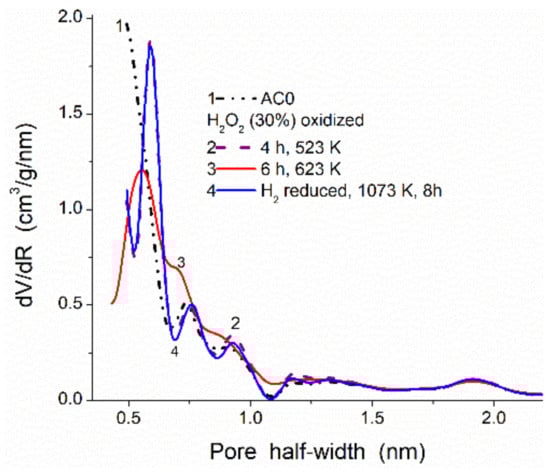
Figure 5.
NLDFT PSD for AC initial (prepared from plum stones [99]), oxidized by H2O2 for 4 and 6 h, and reduced by H2 at 1073 K for 8 h (SBET = 1054, 1149, 1162, 1201 m2/g, Vp = 0.720, 0.723, 0.713, 0.733 cm3/g, respectively).
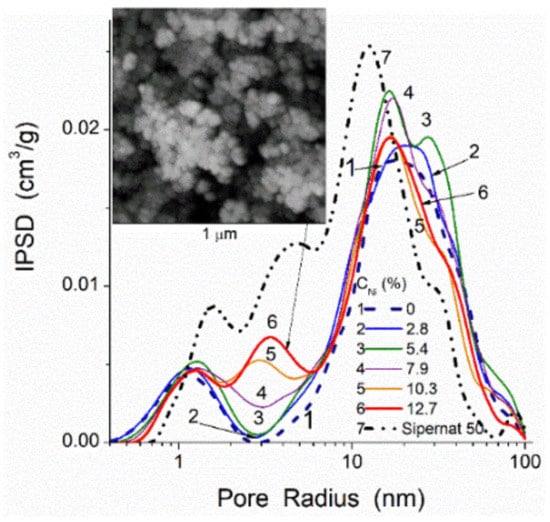
Figure 6.
SCV/SCR PSD of carbon/silica/Ni composites formed upon carbonization (500 °C, nitrogen atmosphere, 3 h) of potato starch with addition of Ni(NO3)2 (0.5 to 2.5 mmol per 3 g of silica Sipernat 50 (503 m2/g, 1.29 cm3/g) and 27 g of starch): resulting final Ni content from 2.8 to 12.7 wt % in composites at SBET = 292, 326, 330, 322, 322, 320 m2/g; Vp = 0.89, 0.98, 1.07, 1.05, 0.98, and 1.00 cm3/g, respectively.
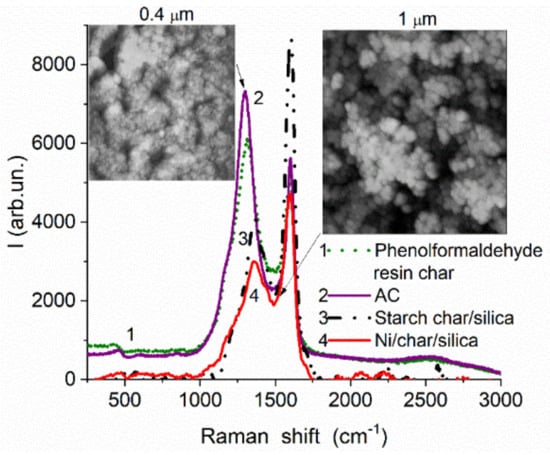
Figure 7.
Raman spectra (inVia Reflex, Renishaw, UK) of materials containing carbons of different origin: phenol–formaldehyde resin char (curve 1, SBET = 534 m2/g, Vp = 0.9 cm3/g) and related AC with 65% burn-off (curve 2, SBET = 2019 m2/g, Vp = 1.86 cm3/g); char formed using starch without (curve 3, 292 m2/g, 0.89 cm3/g) and with addition of Ni(NO3)2 (curve 4, 12.7 wt % Ni in composite, 320 m2/g, 1.0 cm3/g) at Sipernat 50 surface.
In the adsorption methods, the adsorption–desorption isotherms of various probes can give different textural characteristics because the accessibility of a surface in narrow pores depends strongly on the molecular sizes of probe adsorbates. To obtain accurate textural (or morphological) characteristics, the adsorption data should be treated using molecular density functional theory (DFT) methods (such as nonlocal DFT (NLDFT), quenched solid DFT (QSDFT), 2D-NLDFT) or other well-developed methods. For example, a DFT method developed [87,89] gives better PSD than NLDFT since the DFT PSD correspond to the SAXS PSD in a broad range of pore sizes in contrast to the NLDFT PSD (Figure 2) or QSDFT and modified Nguyen–Do (MND) PSD [7,28,32,89,90] (Figure 3). However, in the range of narrow nanopores (<0.5 nm in half-width), the QSDFT method gives better PSD than NLDFT, DFT, or MND PSD compared to the PSD HRTEM computed with ImageJ (granulometry plugin) [97] or Fiji (local thickness plugin) [98] (Figure 4). Thus, the accuracy of the textural analyses depends strongly on a correct choice of experimental methods, conditions, and data treatment methods [89,90].
Despite carbons (chars, AC, carbon black, graphite, carbon composites, etc.) are chemically stable materials, they can be activated, oxidized, reduced, functionalized, etc. (Figure 5, Figure 6, Figure 7 and Figure 8 and S13) under certain conditions. These processes result in changes not only in the surface chemistry of the carbon materials but also in their textural and morphological characteristics. Under relatively soft activation conditions in the controlled atmosphere, the textural changes of the carbon adsorbents could not be very great (Figure 5 and Figure S13). However, chemical modification of a surface (e.g., appearing or removal of polar O-containing surface functionalities) can affect the σ0 value for adsorbed nitrogen molecules. Therefore, for comparison of texturally similar materials, but having different surface functionalities (e.g., O- and H-containing groups), it will better to use the adsorption of argon instead of nitrogen [93] or to use a set of additional characterization methods (e.g., SAXS. TEM, etc.).
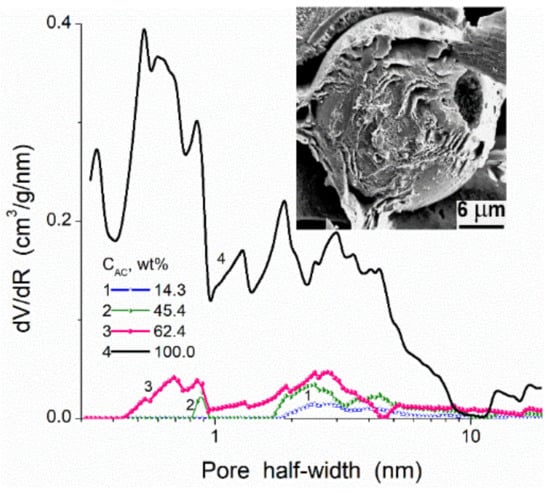
Figure 8.
Pore size distributions (NLDFT, model of slit/cylindrical pores in carbons) for poly(vinyl alcohol) (PVA) cryogels (glutaraldehyde as a crosslinker) filled by activated carbon microparticles (SBET = 979 m2/g, Vp = 1.33 cm3/g) at different amounts (curves 1–3) and initial AC alone (curve 4); insert: SEM image of AC particle covered by PVA.
For hybrid adsorbents or polymer fillers, e.g., carbon deposited onto nanooxides (composed of NPNP) or porous oxides, the morphological and textural characteristics of final composites depend on many factors. First, the morphology, texture, chemical structure of a matrix and other components (e.g., carbon precursors, atmosphere composition) play an important role. Second, carbon precursor structure and reactivity and reaction products, as well as the formation of phases catalytically active in carbonization, e.g., metals, metal oxides (Figure 6) or effectively interacting with a matrix (e.g., hydrothermal treatment in formed water vapor due to the presence of O-, H-, OH-containing groups in the precursors) are additional and important factors. Third, reaction conditions (temperature, pressure, flow rate) and post-reaction treatments can affect the morphology and texture of the final composites. These conditions can also affect contributions of different kinds of carbons characterized by various contributions of disordered/ordered structures, which can be analyzed using Raman spectroscopy. Structures with sp3 C (D band in the Raman spectra at lower Raman shifts, Figure 7) and more ordered structures with sp2 C (G band at higher Raman shifts) are well distinguished in the Raman spectra. Typically, the D band is broader (due to a variety in disordered structures) than the G band, and their shapes depend on many factors. Note that for mechanically treated blends of more (silicas) and less (carbons) rigid components, it is the possible deposition of fragments of soft components onto the outer surface or into the pores of rigid particles. The analysis of these effects is possible within the scope of SCV/SCR using models of various shapes of pores in various materials [87,90]. The use of any firm software does not give correct results. Thus, the morphological, textural, and chemical characteristics of carbons and related composites determine their properties as adsorbents, fillers, catalysts, etc. Therefore, accurate evaluation of the characteristics of the composites is of importance to forecast the behavior of the materials upon their practical applications under different conditions, e.g., upon interactions with polymers.
The properties and characteristics of all components alone and used on preparation, e.g., polymer/filler composites, allow one to evaluate possible consequences concerning possible changes in the characteristics of the final materials. For example, one can assume that using highly porous AC (microparticles) as a filler of macroporous poly(vinyl alcohol), PVA cryogels can result in blocking of nano/mesopores of AC by PVA. Really, in these composites, a great carbon content, even at 62.4 wt % of AC in the AC/PVA composite [100], does not provide high nano/mesoporosity of the composite (Figure 8). The use of these composites in aqueous or other liquid media can sightly improve the accessibility of pores due to swelling effects. However, this improvement could be small due to penetration of linear polymer (PVA) or glutaraldehyde (used as a crosslinker) oligomers into nano/mesopores of AC and strongly blocking of them. Thus, there is no sense in using highly porous AC fillers of polymers. The use of carbon blacks as fillers of polymers could be better than AC since their surface chemistry, PaSD, mechanical and thermal properties are close, but carbon black particles are practically nonporous in contrast to AC.
For nanostructured fillers, such as fumed silica or other fumed oxides, there is a problem of a correct choice of the filler content because filler NPNP, having high external surface area, can very effectively interact with polymers. This interaction depends on pretreatment of the blends, polymer–polymer and polymer–NPNP interactions, and the dispersion media. The hydroxyl groups play an important role in the properties not only of nanooxides [1,2] but also of other nanostructured materials based on the siloxane bridges ≡Si–O–Si≡, ≡Si–OH, and functionalized groups. For example, commercial polymethylsiloxane (PMS) hydrogel, synthesized using methyltrichlorosilane as a precursor, contains ~7–8 wt % of PMS and 93–92 wt % of water (Enterosgel, Kreoma-Pharm, Ukraine) [101]. It is characterized by incomplete crosslinking of residual silanols; therefore, it is hydrophilic and contains adsorbed water (see Figure S20). After drying at room temperature for a week, the amount of water bound in PMS is small (0.7 wt %). Dried and stirred PMS rehydrated (h = 1 g/g) and stirred again is hydrophilic, but to a smaller degree than the initial hydrogel due to partial crosslinking of residual silanols. The bulk density of hydrocompacted wetted PMS powder is ρb ≈ 0.5 g/cm3 at Vem ≈ 1.5 cm3/g, i.e., it remains as a disperse material, as well the blends with nanosilica A-300 [101]. Air-dried PMS and dry nanosilica A-300 (Pilot plant of Chuiko Institute of Surface Chemistry, Kalush, Ukraine) mixed in a porcelain mortar, and then with distilled water (h = 1 g/g) give a hydrophilic system. If the system is stirred without any strong mechanical loading (simple mixing), that ρb ≈ 0.5 g/cm3 (PMS/A-300). If the system is stirred under strong mechanical loading (careful grinding in a porcelain mortar with strong hand-loading giving ~20 atm, estimated from the mortar’s geometry and a pestle used and a loading weight, for 15 min) that ρb ≈ 0.6 g/cm3. This is a hydrocompacted sample (cPMS/A-300). Hydrocompaction effects for various nanomaterials depend on their structure, water amounts, mechanical loading, and treatment time [28,32,101].
If a polymer has a middle 2D–3D structure, e.g., PMS with CH3 group at each Si atom, which is linked with neighboring Si atoms by the ≡Si–O–Si≡ bridges (see additional information on PMS in Supplementary Materials file), that the PSD for its blends with nanosilica A-300 can be similar to that of initial PMS or A-300 depending on the blend pretreatment conditions (Figure 9 and Table 1). As a whole, linear polymers with relatively weak polymer–polymer interactions are well distributed in the blends with nanooxides even at low content of solvents (30–50% of water or water/alcohol) [6,7,8,9,28,32,75,77,79,84]. However, at comparative interaction energies for polymer–polymer and polymer–NPNP (e.g., PVA/A-300) [32], the uniform distribution of NPNP in the polymer matrix becomes difficult similar to the systems with chemical bonding of polymers to surface functionalities at NPNP of nanooxides [77].
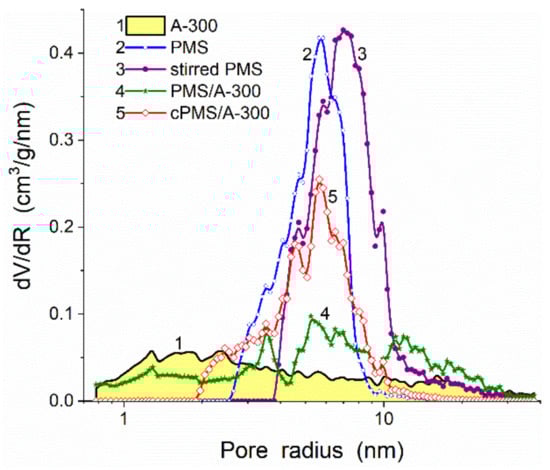
Figure 9.
Differential (dV/dR) NLDFT PSD for A-300 (curve 1), dried polymethylsiloxane (PMS) hydrogel (2), dried, rehydrated, hydrocompacted, and dried PMS (3), stirred wetted PMS/A-300 without (curve 4) and with (curve 5).

Table 1.
Textural characteristics of PMS alone and PMS/A-300.
Quantum chemical calculations of functionalized nanoparticles (using the Gaussian program suit with solvation SMD method [102]) show that despite their different hydrophilicity (Figure 10), the charge distribution functions (CDF) for the H atoms in the ≡Si–CH3 groups (Figure 11) are practically the same for four kinds of materials, such as modified silicas with methyl silyl (MS), dimethylsilyl (DMS), and trimethylsilyl (TMS) groups and PMS nanoparticles. The difference in the hydrophobic characteristics of these materials can be explained by the difference in the number of the ≡Si–CH3 groups per square unit of a surface, surface topology, and presence of residual silanols. The particle and supra-NPNP geometry can affect the hydrophobicity. Therefore, ΔGs/nx vs. the degree of hydroxyl substitution (ΘMS) shows greater hydrophobicity of MS-silica than DMS–silica (Figure 10). The presence of certain structural hierarchies from nano- to micro- and macro-scales of functionalized silicas (alone or in composites with polymers) with the same functional groups can provide superhydrophobicity at contact angles for water drops greater than 150° [103,104,105,106] that is impossible for any uniform functionalized surface.
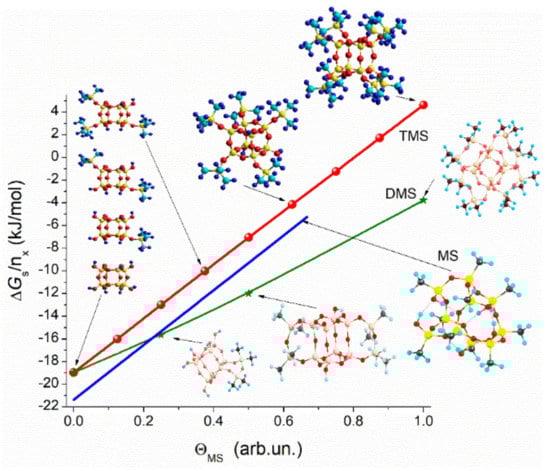
Figure 10.
Gibbs free energy of solvation (SMD/ωB97X-D/cc-pVDZ [102]) divided by a number of hydroxyls in the initial clusters vs. the degree of substitution of the hydroxyls by the trimethylsilyl (TMS), dimethylsilyl (DMS) and methyl groups.
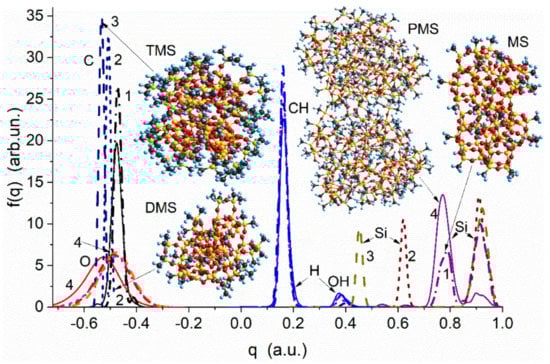
Figure 11.
Charge distribution functions of the H, C, O, and Si atoms in nanoparticles of silica with methyl silyl (MS, dot-dashed lines, curves 1), dimethylsilyl (DMS, short-dashed lines, curves 2), and trimethylsilyl (TMS, dashed lines, curves 3) groups and two PMS nanoparticles (solid lines, curves 4) (PM7 [107,108] method).
The sizes of the theoretical models used here (see Supplementary Materials file) correspond to real sizes of nanoparticles (Figures S40–S42) using the DFT or ab initio [102] and semiempirical (e.g., PM7 and PM6 [107,108]) methods. This allows one to accurately model the interfacial layers for various adsorbates (Tables S2 and S3), showing, e.g., variations in the orientation of the adsorbed molecules concerning a surface plane. The latter explains the diminution of the area occupied by a nitrogen molecule at a surface with hydroxyl groups, as well as the formation of water clusters, which can be attributed to strongly (changes in Gibbs free energy ΔG < −0.5 kJ/mol) and weakly (ΔG > −0.5 kJ/mol) bound or strongly (chemical shift of proton resonance δH = 4–6 ppm) and weakly associated (δH = 1–2 ppm) waters, the interaction energy between polymers and NPNP, etc. [7,28,32]. Thus, theoretical modeling provides a deeper insight into various phenomena occurring at a surface of simple and composite adsorbents.
There is another textural/structural aspect related to the pore accessibility for adsorbed probes or target compounds upon chemical modification of a surface of adsorbents by low- or high-molecular-weight compounds. The surface functionalization could be used to improve the adsorption characteristics concerning certain target adsorbates (both from gaseous and liquid media), as well as to improve compatibility with filled polymers, to change their mechanical and other characteristics and properties. Typically, any chemical modification (functionalization) of porous adsorbents results in the diminution of their textural characteristics, such as PSD (Figure 12), and contributions of nano-, meso, and macropores to the specific surface area, SBET and pore volume, Vp (Table 2). For example, for modified silica gel 200DF/EDTA (EDTA is N-(triethoxysilylpropyl)ethylenediaminetriacetic acid), Snano decreases from 289 m2/g (for initial 200DF at SBET = 484 m2/g) to 35 m2/g, and Vnano decreases from 0.05 to 0.02 cm3/g. Thus, the adsorption capacity of functionalized porous silicas can be more strongly decreased for the adsorbents with a significant contribution of nanopores (similar to 200DF) in contrast to the adsorbents with broader pores (similar to HP39 or SBA-15), which are characterized by a significant loss of the porosity, but it is not catastrophic [7,109,110]. Certain effects of the textural instability of polymers can be due to the significant contribution of narrow pores at a high value of the specific surface area (e.g., comp. AcSp and XAD-7 or XAD-16, Table 3, Figure 13).
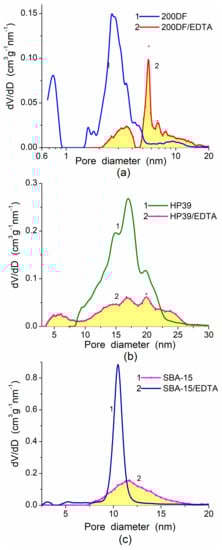
Figure 12.
Differential NLDFT PSD of Crosfield silica gels (a) 200DF and (b) HP39, and (c) SBA-15 [109,110] initial and modified by N-(triethoxysilylpropyl)ethylenediaminetriacetic acid (EDTA) (Gelest, Morrisville, USA).
Table 2.
Textural characteristics of initial and modified silicas.
Table 3.
Structural characteristics of initial and treated porous polymers.
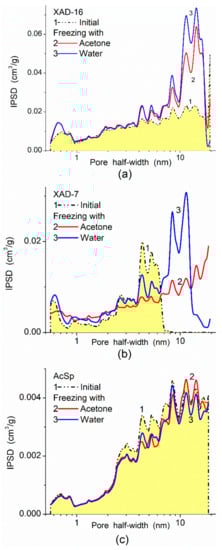
Figure 13.
NLDFT IPSD of porous polymers initial and frozen with water of acetone (polymers were treated with liquids for 24 h, then frozen by liquid nitrogen for 2 h, and then unfrozen and degassed before nitrogen adsorption): (a) Amberlite XAD-16 (polystyrene, Fluka), (b) Amberlite XAD-7 (acrylic ester polymer, Fluka), and (c) AcSp (UMCS, Lublin, [31]) is a copolymer of a mixture of 4,4′-diphenyl sulfone dimethacrylate and 4-hydroxydiphenyl sulfone with divinylbenzene.
The textural characteristics of porous polymers can be unstable depending on their composition and crosslinking degree, as well as on conditions. To demonstrate these effects, the characteristics of polymer beads (Table 3) were studied for initial samples and after suspending in water or acetone for 24 h and freezing by liquid nitrogen (77.4 K) for 2 h, then heated to room temperature and degassed before the nitrogen adsorption [31]. Additionally, some polymers (Table 4) were differently treated with water: washed–sonicated, washed, washed–sonicated–swollen, washed–swollen, and washed–sonicated–swollen–frozen. All the polymer samples were degassed (10−3 Torr) at 353–373 K for ca. 4 h before the nitrogen adsorption measurements. Since polymers XAD-7 and XAD-16 are characterized by the greatest structural changes due to washing–swelling–freezing, other treatment conditions have also been applied (Table 4): adding some quantity of water to a polymer, shaking in an ultrasonic bath (~2 min), storage for 24 h, freezing in liquid nitrogen, filtration, drying under mild conditions then at 353 K in the air; and degassing in vacuum at 353 K before nitrogen adsorption/desorption measurements. The treatments of some porous polymers under different conditions can strongly change their textural characteristics if they can be swollen and their 3D network is not enough strength (e.g., due to a low degree of crosslinking). However, a high value of SBET and a significant contribution of narrow pores could not always result in textural instability (see Figure S12c). LiChrolut EN composed of poly(ethylvinylbenzene/divinylbenzene) is relatively stable (due to rigid crosslinking) upon wetting–freezing–drying, despite high SBET = 1512 m2/g with a great contribution of nanopores at Snano = 1024 m2/g [111].
Table 4.
Structural characteristics of initial and treated XAD-7 and XAD-16.
Lignins, polymer/lignins and other related composites are of interest from a practical point of view [112,113]. However, the analysis of their texture is not a simple task. Therefore, a set of methods could be used in parallel, such as direct (TEM, SEM) and indirect (probe adsorption, SAXS, NMR cryoporometry, DSC thermoporometry, etc.) methods [9,28,31,54,55,56,64,65,66,74,75,76,77,78,79,80,81,82,83,84,85,86,87,111,114,115,116,117,118,119,120,121,122,123,124,125,126,127,128,129,130]. More accurate results can be obtained if several methods are used in parallel (e.g., SAXS and adsorption).
To change the adsorption characteristics of polymers, e.g., nonpolar polymers, such as poly(divinylbenzene) (PDVB), polystyrene (PS), copolymers of divinylbenzene and styrene (PDVBS), they could be filled not only by solid fillers (metal oxides, carbons, etc.) but also by polymers of various nature, e.g., polar polymers, such as various lignins, polyurethanes, poly(hydroxyethyl methacrylate), etc. For composites, there is a certain decrease in the SBET value for lignin/PDVB as ΔSBET = −133 m2/g and for ΔSSAXS = −140 m2/g. However, SSAXS >> SBET due to the significant contribution of closed nanopores and narrow mesopores at R < 10 nm in polymer particles (Figure 14). Condition SSAXS >> SBET for these polymers (Figure 14) is similar to that for chars and AC (Figure 1). This result could be explained by the strong compaction of neighboring polymer chains in particles but without chemical bonds between them. Non-crosslinked chains containing aromatic rings are located close to other similar (concerning closed pores) carbon structures in neighboring graphene planes without chemical bonding. Therefore, probe (nitrogen) molecules cannot penetrate in narrow voids between neighboring polymer chains. Thus, a surface of weakly spatially separated polymeric chains or graphene sheets in adsorbent particles is inaccessible for nitrogen molecules, but it can take part in the X-ray scattering as separated structures giving a contribution to the SSAXS values.
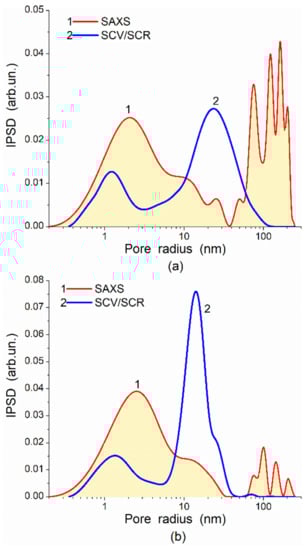
Figure 14.
Incremental pore size distributions calculated from nitrogen adsorption–desorption isotherms and SAXS data for samples (a) kraft lignin (MW = 1300 Da)/PDVB (2:5) (SBET = 409 m2/g, SSAXS = 1146 m2/g, Vp = 0.9 cm3/g) and (b) PDVB (SBET = 542 m2/g, SSAXS = 1286 m2/g, Vp = 1.3 cm3/g) (some details on the materials are given elsewhere [55]).
The difference in the SSAXS and SBET values allows one to evaluate a possible increase in the specific surface area due to certain activation, e.g., burn-off activation of carbons (Figure 1) or washing–swelling–freezing–drying of polymers (Table 3 and Table 4, Figure 13 and Figure 14). Additionally, some results of swelling of soft polymeric structures affecting the textural characteristics can be observed using NMR cryoporometry or DSC thermoporometry (e.g., for cryogels or hydrogels). These effects can also appear upon ions’ adsorption, low-molecular-weight compounds from the gaseous (vapor) phase (e.g., water, see Figures S14–S16), or solutes from liquid media. This is because the polymeric adsorbents or related composites can demonstrate a much greater swelling degree in aqueous media than oxide or carbon adsorbents. Thus, to analyze the complex phenomena for composites being in different dispersion media, a maximum large set of methods should be used.
4. Conclusions
Thus, accurate textural and morphological characterization of relatively simple but nonuniform materials, such as metal and metalloid oxides, carbons, polymers, etc., is not a simple task due to various factors related to the experiments per se and the treatment methods of the experimental data [1,2,93,131,132,133,134]. This task becomes much more complex for composites and hybrids, such as polymers/fillers, carbon, metal or metal oxides/polymers, nonuniform composite blends with different phases, etc. [28,54,55,56,85,86,87,88,89,90]. Therefore, to separate the results with large and small systematic errors, a set of various methods should be used for accurate morphological, textural, and structural characterization of composites and hybrid systems, considering all their components, as well as interactions of these components in composites [28,89,90,91].
This study’s main aim was to show some ways to improve information extraction for more complete and accurate characterization of complex adsorbents, polymer fillers, and composites of different kinds. This could be provided by using the models, which correctly describe each component in composites concerning material kinds and shapes of pores and particles, and by using the self-consistent regularization procedures for simultaneously solving a set of related integral equations [89,90,91]. For effective data treatments and maximal information extraction, it is of importance to use appropriate methods to treat the experimental (especially indirect) data with accurate physicomathematical models of the experimental dependences on pressure, concentration, temperature, and other parameters and related computational programs, e.g., with the SCR procedures. Besides this way, a set of additional methods may be used. Among these methods are electron microscopies (TEM, SEM), small-angle X-ray scattering (SAXS), X-ray diffraction, cryoporometry, relaxometry, thermoporometry, quasi-elastic light scattering, Raman and infrared spectroscopies and some others. Note that even infrared spectroscopy could be used for the textural characterization of silica-containing materials [135].
Thus, a more accurate description of complex and hybrid materials is possible if several methods complemented one another are used in parallel, e.g., adsorption and SAXS with the SCR procedures giving pore size, pore wall thickness, and particle size distributions functions for each component with consideration of the influence of one component onto others; as well as the specific surface area of open and closed pores, TEM/SEM/CLSM with quantitative treatments of images giving the PaSD, PSD, and PWTD functions for whole composite and each component. Some other methods, such as cryo- and thermoporometry and relaxometry, may give information not only on the textural characteristics of composites but also on the structure and temperature and interfacial behaviors of adsorbates confined in pores. As a whole, the software complex developed for the treatment of various experimental data includes more than 200 programs for more than 30 experimental methods, and only a small part of these programs is described here. In future works, this software complex may be expanded to include more types of materials, pore and particle shapes, other experimental, theoretical, and applied mathematics methods, etc.
Supplementary Materials
The following are available online at https://www.mdpi.com/article/10.3390/polym13081249/s1. Figure S1: SBET vs. maximal p/p0 for MCM-41, MCM-48, and SBA-15. Figure S2: PaSD for nanosilica based on SEM image and adsorption data. Figure S3: IPSD for initial and MCA-treated nanosilica. Figure S4: Nitrogen adsorption-desorption isotherms and PSD for fresh and aged A-500. Figure S5: IPSD for PDMS-modified A-300. Figure S6: PSD and nitrogen adsorption energy distributions (NAED) for alumina/silica. Figure S7: PSD and NAED for titania/silica. Figure S8: PSD and NAED for various carbons. Figure S9: PSD of various AC estimated from nitrogen and benzene adsorption. Figure S10: SBET estimated for nanooxides using different probes. Figure S11: Effects of silica hydrophobization on NAED. Figure S12: PSD for treated polymers. Figure S13: PSD for treated AC. Figure S14: Water adsorption onto nanosilicas. Figure S15: SAr vs. silanol concentration for nanosilicas. Figure S16: Modeling of clustered adsorption of water. Figure S17: IR spectra of A-300. Figure S18: Decomposition of the IR spectrum of A-300 over the OH range. Figure S19: FTIR spectra of treated polymers. Figure S20: Infrared spectra of PMS and PDMS. Figure S21: SAXS and SCV/SCR PSD for a char. Figure S22: SAXS and SCV/SCR PSD for AC. Figure S23: SAXS and V/SCR PaSD for A-300. Figure S24: SAXS PaSD for a polymer and related char. Figure S25: Chord size distributions for a polymer and related char. Figure S26: SEM and TEM images of fresh and aged nanosilicas. Figure S27: AFM PaSD for AC and char/silica. Figure S28: TEM images of PMS and PMS/A-300. Figure S29: TEM PaSD of PMS and PMS/A-300. Figure S30: SEM images of PDMS-modified A-300. Figure S31: SEM PaSD of PDMS-modified A-300. Figure S32: PaSD of A-300 computed using different experimental data. Figure S33: NMR-cryoporometry PSD for nanosilica dispersions. Figure S34. NMR-cryoporometry PSD for treated nanosilica. Figure S35: DSC thermoporometry for different silicas. Figure S36: TSDC relaxometry PSD for nanosilica dispersions. Figure S37: TSDC relaxometry and SCV/SCR PSD for nanosilicas. Figure S38: TSDC relaxometry and N2 PSD for MCM-48. Figure S39: CLSM images, PSD and PWTD for a cryogel. Figure S40: Cluster models of silica nanoparticles. Figure S41: Models of nonporous and porous particles of silica. Figure S42: HRTEM image and cluster model of AC. Figure S43: Interaction energy vs. charge transfer for probes interacting with nanosilicas. Figure S44: Theoretical 1H NMR spectra of silica with different adsorbates. Figure S45: Theoretical 1H NMR spectra of water bound to nanoparticles. Figure S46: Models of hydrophobic AM1, PMS and PDMS. Figure S47: Theoretical 1H NMR spectra of water and methane bound to silicas. Figure S48: MD model of water bound to silica vs. temperature. Figure S49: MD calculations of dehydration of silicas. Figure S50: MD calculations of dehydration of silica gel. Table S1: Textural characteristics of PMS and PMS/A-300. Table S2: Adsorption energy and charge transfer for probes adsorbed onto silica (DFT). Table S3: Adsorption energy of various probes bound to silica and AC (PM7).
Funding
This research was funded by the National Research Foundation of Ukraine (support of advanced and young scientists, grant 2020.02/0057) and the Target-Oriented Program of Scientific Investigations of National Academy of Sciences of Ukraine “Novel Functional Compounds and Materials in Chemical Manufacturing” (agreement No 19–19).
Institutional Review Board Statement
Not applicable.
Informed Consent Statement
Not applicable.
Data Availability Statement
The data presented in this study are available on request from the corresponding author.
Acknowledgments
The work was supported by the National Research Foundation of Ukraine (support of advanced and young scientists, grant 2020.02/0057) and the Target-Oriented Program of Scientific Investigations of National Academy of Sciences of Ukraine “Novel Functional Compounds and Materials in Chemical Manufacturing” (agreement No 19–19). The author thanks V.V. Turov, E.M. Pakhlov, V.M. Bogatyrov, M. Galaburda, O.K. Matkovky, and I. Protsak (Chuiko Institute of Surface Chemistry, Kyiv, Ukraine), R. Leboda, J. Skubiszewska-Zięba, B. Gawdzik, B. Charmas, D. Sternik, M. Goliszek, and B. Podkościelna (Maria Curie-Sklodowska University, Lublin, Poland), J.P. Blitz (Eastern Illinois University, Charleston, USA), O. Kozynchenko (MAST Carbon Technology Ltd., Guildford, UK),. S. Mikhalovsky and I. Savina (University of Brighton, UK) for a set of various experimental data.
Conflicts of Interest
The author declares that there are no conflict of interest. The funders had no role in the design of the study, in the collection, analyses, or interpretation of data; in the writing of the manuscript, or in the decision to publish the results.
References
- Iler, R.K. The Chemistry of Silica; Wiley: Chichester, UK, 1979. [Google Scholar]
- Legrand, A.P. (Ed.) The Surface Properties of Silicas; Wiley: New York, NY, USA, 1998. [Google Scholar]
- Adamson, A.W.; Gast, A.P. Physical Chemistry of Surface, 6th ed.; Wiley: New York, NY, USA, 1997. [Google Scholar]
- Blitz, J.P.; Little, C. (Eds.) Fundamental and Applied Aspects of Chemically Modified Surfaces; Elsevier: Amsterdam, The Netherlands, 1999. [Google Scholar]
- Rodriguez-Reinoso, F.; McEnaney, B.; Rouquerol, J.; Unger, K. (Eds.) Characterisation of Porous Solids VI. Studies in Surface Science and Catalysis; Elsevier Science: Amsterdam, The Netherlands, 2002; Volume 144. [Google Scholar]
- Somasundaran, P. (Ed.) Encyclopedia of Surface and Colloid Science, 3rd ed.; Taylor & Francis, CRC Press: Boca Raton, FL, USA, 2015. [Google Scholar]
- Blitz, J.P.; Gun’ko, V.M. (Eds.) Surface Chemistry in Biomedical and Environmental Science; NATO Science Series II: Mathematics, Physics and Chemistry; Springer: Dordrecht, The Netherlands, 2006; Volume 228. [Google Scholar]
- Shpak, A.P.; Gorbyk, P.P. (Eds.) Nanomaterials and Supramolecular Structures; Springer: Dordrecht, The Netherlands, 2010. [Google Scholar]
- Majka, T.; Pielichowski, K. (Eds.) Polymer Composites with Functionalized Nanoparticles. Synthesis, Interactions, Properties and Applications; Elsevier: Amsterdam, The Netherlands, 2019. [Google Scholar]
- Auner, N.; Weis, J. (Eds.) Organosilicon Chemistry VI: From Molecules to Materials; Wiley: Weinheim, Germany, 2005. [Google Scholar]
- Bergna, H.E. (Ed.) Colloidal Silica: Fundamentals and Applications; Taylor & Francis LLC: Salisbury, UK, 2005. [Google Scholar]
- Sprenger, S. Nanosilica-toughened epoxy resins. Polymers 2020, 12, 1777. [Google Scholar] [CrossRef] [PubMed]
- Ismail, A.F.; Goh, P.S. (Eds.) Carbon-Based Polymer Nanocomposites for Environmental and Energy Applications, 1st ed.; Elsevier: Amsterdam, The Netherlands, 2018. [Google Scholar]
- Morgan, P. Carbon Fibers and Their Composites; CRC Press: Boca Raton, FL, USA, 2005. [Google Scholar]
- Dong, Y.; Umer, R.; Lau, A.K.T. (Eds.) Fillers and Reinforcements for Advanced Nanocomposites; Woodhead Publishing: Cambridge, UK, 2015. [Google Scholar]
- Vajtai, R. (Ed.) Springer Handbook of Nanomaterials; Springer: Berlin/Heidelberg, Germany, 2013. [Google Scholar]
- Sivasankaran, S. (Ed.) Nanocomposites—Recent Evolutions; IntechOpen: London, UK, 2019. [Google Scholar]
- Lee, B.-S.; Yu, W.-R. Electrospun carbon nanofibers as a functional composite platform: A review of highly tunable microstructures and morphologies for versatile applications. Funct. Compos. Struct. 2020, 2, 012001. [Google Scholar] [CrossRef]
- Ates, M.; Eker, A.A.; Eker, B. Carbon nanotube-based nanocomposites and their applications. J. Adhes. Sci. Technol. 2017, 4243, 1–21. [Google Scholar] [CrossRef]
- Feng, L.; Xie, N.; Zhong, J. Carbon nanofibers and their composites: A review of synthesizing, properties and applications. Materials 2014, 7, 3919–3945. [Google Scholar] [CrossRef] [PubMed]
- Lin, Y.; Zhou, B.; Fernando, K.A.S.; Liu, P.; Allard, L.F.; Sun, Y.-P. Polymeric carbon nanocomposites from carbon nanotubes functionalized with matrix polymer. Macromolecules 2003, 36, 7199–7204. [Google Scholar] [CrossRef]
- Diez-Pascual, A.M. Carbon-based polymer nanocomposites for high-performance applications. Polymers 2020, 12, 872. [Google Scholar] [CrossRef]
- Diez-Pascual, A.M.; Luceño-Sanchez, J.A.; Peña-Capilla, R.; Garcia-Diaz, P. Recent developments in graphene/polymer nanocomposites for application in polymer solar cells. Polymers 2018, 10, 217. [Google Scholar] [CrossRef]
- Yu, B.; Zhao, Z.; Fu, S.; Meng, L.; Liu, Y.; Chen, F.; Wang, K.; Fu, Q. Fabrication of PLA/CNC/CNT conductive composites for high electromagnetic interference shielding based on pickering emulsions method. Compos. Part A 2019, 125, 105558. [Google Scholar] [CrossRef]
- Ambika; Singh, P.P. Carbon nanocomposites: The potential heterogeneous catalysts for organic transformations. Curr. Org. Chem. 2021, 25, 332. [Google Scholar] [CrossRef]
- Chuiko, A.A. (Ed.) Chemistry of Silica Surface; UkrINTEI: Kiev, Ukraine, 2001. (In Russian) [Google Scholar]
- Henderson, M.A. Interaction of water with solid surfaces: Fundamental aspects revisited. Surf. Sci. Rep. 2002, 46, 1–308. [Google Scholar] [CrossRef]
- Gun’ko, V.M.; Turov, V.V. Nuclear Magnetic Resonance Studies of Interfacial Phenomena; CRC Press: Boca Raton, FL, USA, 2013. [Google Scholar]
- Birdi, K.S. (Ed.) Handbook of Surface and Colloid Chemistry, 3rd ed.; CRC Press: Boca Raton, FL, USA, 2009. [Google Scholar]
- Al-Abadleh, H.A.; Grassian, V.H. Oxide surfaces as environmental interfaces. Surf. Sci. Rep. 2003, 52, 63–161. [Google Scholar] [CrossRef]
- Gun’ko, V.M.; Leboda, R.; Skubiszewska-Zięba, J.; Gawdzik, B.; Charmas, B. Structural characteristics of porous polymers treated by freezing with water or acetone. Appl. Surf. Sci. 2005, 252, 612–618. [Google Scholar] [CrossRef]
- Gun’ko, V.M.; Turov, V.V.; Zarko, V.I.; Goncharuk, O.V.; Pakhlov, E.M.; Skubiszewska-Zięba, J.; Blitz, J.P. Interfacial phenomena at a surface of individual and complex fumed nanooxides. Adv. Colloid Interface Sci. 2016, 235, 108–189. [Google Scholar] [CrossRef]
- Xiao, B.; Zhang, Y.; Wang, Y.A.N.; Jiang, G.; Liang, M.; Chen, X.; Long, G. A fractal model for Kozeny—Carman constant and dimensionless permeability of fibrous porous media with roughened surfaces of fibrous porous media with roughened. Fractals 2019, 27, 1–12. [Google Scholar] [CrossRef]
- Xiao, B.; Huang, Q.; Chen, H.; Chen, X.; Long, G. A fractal model for capillary flow through a single tortuous capillary with roughened surfaces in fibrous porous media. Fractals 2021, 29, 2150017. [Google Scholar] [CrossRef]
- Nee, A.Y.C. (Ed.) Handbook of Manufacturing Engineering and Technology, 1st ed.; Springer: London, UK, 2015. [Google Scholar]
- Mittal, V. (Ed.) Polymer Nanocomposites by Emulsion and Suspension Polymerization, 1st ed.; Royal Society of Chemistry: London, UK, 2011. [Google Scholar]
- Ducheyne, P.; Healy, K.; Hutmacher, D.W.; Grainger, D.W.; Kirkpatrick, C.J. (Eds.) Comprehensive Biomaterials II, 1st ed.; Elsevier: Amsterdam, The Netherlands, 2017. [Google Scholar]
- Feldman, D. Polymer nanocomposites in medicine. J. Macromol. Sci. Part A 2016, 53, 55–62. [Google Scholar] [CrossRef]
- Koerner, H.; Drummy, L.F.; Benicewicz, B.; Li, Y.; Vaia, R.A. Nonisotropic self-organization of single-component hairy nanoparticle assemblies. ACS Macro Lett. 2013, 2, 670–676. [Google Scholar] [CrossRef]
- Ethier, J.G.; Hall, L.M. Structure and entanglement network of model polymer-grafted nanoparticle monolayers. Macromolecules 2018, 51, 9878–9889. [Google Scholar] [CrossRef]
- Kim, Y.-G.; Wagner, M.; Thérien-Aubin, H. Dynamics of soft and hairy polymer nanoparticles in a suspension by NMR relaxation. Macromolecules 2020, 53, 844–851. [Google Scholar] [CrossRef]
- Wichaita, W.; Kim, Y.-G.; Tangboriboonrat, P.; Thérien-Aubin, H. Polymer-functionalized polymer nanoparticles and their behaviour in suspensions. Polym. Chem. 2020, 11, 2119–2128. [Google Scholar] [CrossRef]
- Bratek-Skicki, A. Towards a new class of stimuli-responsive polymer-based materials—Recent advances and challenges. Appl. Surf. Sci. Adv. 2021, 4, 100068. [Google Scholar] [CrossRef]
- Richter, D.; Kruteva, M. Polymer dynamics under confinement. Soft Matter 2019, 15, 7316–7349. [Google Scholar] [CrossRef]
- Hore, M.J.A. Polymers on nanoparticles: Structure & dynamics. Soft Matter 2019, 15, 1120–1134. [Google Scholar]
- Vogiatzis, G.G.; Theodorou, D.N. Structure of polymer layers grafted to nanoparticles in silica-polystyrene nanocomposites. Macromolecules 2013, 46, 4670–4683. [Google Scholar] [CrossRef]
- Askar, S.; Li, L.; Torkelson, J.M. Polystyrene-grafted silica nanoparticles: Investigating the molecular weight dependence of glass transition and fragility behavior. Macromolecules 2017, 50, 1589–1598. [Google Scholar] [CrossRef]
- Chen, X. Preparation and property of TiO2 nanoparticle dispersed polyvinyl alcohol composite materials. J. Mater. Sci. Lett. 2002, 21, 1637–1639. [Google Scholar] [CrossRef]
- Yellampalli, S. (Ed.) Carbon Nanotubes Polymer Nanocomposites, 1st ed.; Intech: Rijeka, Croatia, 2011. [Google Scholar]
- Gonzalez, J.A.; Villanueva, M.E.; Piehl, L.L.; Copello, G.J. Development of a chitin/graphene oxide hybrid composite for the removal of pollutant dyes: Adsorption and desorption study. Chem. Eng. J. 2015, 280, 41–48. [Google Scholar] [CrossRef]
- Kashyap, S.; Pratihar, S.K.; Behera, S.K. Strong and ductile graphene oxide reinforced PVA nanocomposites. J. Alloys Compd. 2016, 684, 254–260. [Google Scholar] [CrossRef]
- Yarlagadda, V.; Carpenter, M.K.; Moylan, T.E.; Kukreja, R.S.; Koestner, R.; Gu, W.; Thompson, L.; Kongkanand, A. Boosting fuel cell performance with accessible carbon mesopores. ACS Energy Lett. 2018, 3, 618–621. [Google Scholar] [CrossRef]
- Fairén-Jiménez, D.; Carrasco-Marín, F.; Djurado, D.; Bley, F.; Ehrburger-Dolle, F.; Moreno-Castilla, C. Surface area and microporosity of carbon aerogels from gas adsorption and small- and wide-angle X-ray scattering measurements. J. Phys. Chem. B 2006, 110, 8681–8688. [Google Scholar] [CrossRef]
- Gun’ko, V.M.; Meikle, S.T.; Kozynchenko, O.P.; Tennison, S.R.; Ehrburger-Dolle, F.; Morfin, I.; Mikhalovsky, S.V. Comparative characterization of carbon and polymer adsorbents by SAXS and nitrogen adsorption methods. J. Phys. Chem. C 2011, 115, 10727–10735. [Google Scholar] [CrossRef]
- Goliszek, M.; Podkościelna, B.; Fila, K.; Riazanova, A.V.; Aminzadeh, S.; Sevastyanova, O.; Gun’ko, V.M. Synthesis and structure characterization of polymeric nanoporous microspheres with lignin. Cellulose 2018, 25, 5843–5862. [Google Scholar] [CrossRef]
- Sternik, D.; Galaburda, M.V.; Bogatyrov, V.M.; Oranska, O.I.; Charmas, B.; Gun’ko, V.M. Novel porous carbon/clay nanocomposites derived from kaolinite/resorcinol-formaldehyde polymer blends: Synthesis, structure and sorption properties. Appl. Surf. Sci. 2020, 525, 146361. [Google Scholar] [CrossRef]
- Ares, A.E. (Ed.) X-ray Scattering; InTech: Rijeka, Croatia, 2017. [Google Scholar]
- Sztucki, M.; Narayanan, T. Development of an ultra-small-angle X-ray scattering instrument for probing the microstructure and the dynamics of soft matter. J. Appl. Crystallogr. 2007, 40, s459–s462. [Google Scholar] [CrossRef]
- Fultz, B.; Howe, J. Transmission Electron Microscopy and Diffractometry of Materials; Springer: Berlin/Heidelberg, Germany, 2007. [Google Scholar]
- Cullity, B.D.; Stock, S.R. Elements of X-ray Diffraction, 3rd ed.; Prentice-Hall Inc.: New York, NY, USA, 2001. [Google Scholar]
- David, W.I.F.; Shankland, K.; McCusker, L.B.; Baerlocher, C. Structure Determination form Powder Diffraction Data; Oxford Science: London, UK, 2002. [Google Scholar]
- Mai, Y.-W.; Yu, Z.-Z. Polymer Nanocomposites; CRC Press: Boca Raton, FL, USA, 2006. [Google Scholar]
- Aksnes, D.W.; Førland, K.; Kimtys, L. Pore size distribution in mesoporous materials as studied by 1H NMR. Phys. Chem. Chem. Phys. 2001, 3, 3203–3207. [Google Scholar] [CrossRef]
- Mitchell, J.; Webber, J.B.W.; Strange, J.H. Nuclear magnetic resonance cryoporometry. Phys. Rep. 2008, 461, 1–36. [Google Scholar] [CrossRef]
- Shapiro, Y.E. Structure and dynamics of hydrogels and organogels: An NMR spectroscopy approach. Prog. Polymer Sci. 2011, 36, 1184–1253. [Google Scholar] [CrossRef]
- Landry, M.R. Thermoporometry by differential scanning calorimetry: Experimental considerations and applications. Thermochim. Acta 2005, 433, 27–50. [Google Scholar] [CrossRef]
- Naito, S.; Koyanagi, J.; Komukai, T.; Uno, T. Analysis of three-phase structure of epoxy resin/CNT/graphene by molecular simulation. Polymers 2020, 12, 1821. [Google Scholar] [CrossRef]
- Kwon, J.; Jung, H.; Jung, H.; Lee, J. Micro/nanostructured coating for cotton textiles that repel oil, water, and chemical warfare agents. Polymers 2020, 12, 1826. [Google Scholar] [CrossRef]
- Xu, E.; Zhang, Y.; Lin, L. Improvement of mechanical, hydrophobicity and thermal properties of Chinese fir wood by impregnation of nano silica sol. Polymers 2020, 12, 1632. [Google Scholar] [CrossRef] [PubMed]
- Hong, T.; Jeong, S.-M.; Choi, Y.K.; Lim, T.; Ju, S. Superhydrophobic, elastic, and conducting polyurethane-carbon nanotube–silane–aerogel composite microfiber. Polymers 2020, 12, 1772. [Google Scholar] [CrossRef] [PubMed]
- Rollo, G.; Ronca, A.; Cerruti, P.; Gan, X.P.; Fei, G.; Xia, H.; Gorokhov, G.; Bychanok, D.; Kuzhir, P.; Marino Lavorgna, M.; et al. On the synergistic effect of multi-walled carbon nanotubes and graphene nanoplatelets to enhance the functional properties of SLS 3D-printed elastomeric structures. Polymers 2020, 12, 1841. [Google Scholar] [CrossRef]
- Erdal, N.B.; Lando, G.A.; Yadav, A.; Srivastava, R.K.; Hakkarainen, M. Hydrolytic degradation of porous crosslinked poly(ε-caprolactone) synthesized by high internal phase emulsion templating. Polymers 2020, 12, 1849. [Google Scholar] [CrossRef] [PubMed]
- Jeon, B.; Ha, T.; Lee, D.Y.; Choi, M.-S.; Lee, S.W.; Jung, K.-H. Preparation and electrochemical properties of porous carbon nanofiber electrodes derived from new precursor polymer: 6FDA-TFMB. Polymers 2020, 12, 1851. [Google Scholar] [CrossRef]
- Savina, I.N.; Gun’ko, V.M.; Turov, V.V.; Dainiak, M.; Galaev, I.Y.; Phillips, G.J.; Mikhalovsky, S.V. Porous structure and water state in cross-linked polymer and protein cryo-hydrogels. Soft Matter 2011, 7, 4276–4283. [Google Scholar] [CrossRef]
- Sulym, I.Y.; Klonos, P.; Borysenko, M.V.; Pissis, P.; Gun’ko, V.M. Dielectric and thermal studies of segmental dynamic in silica/PDMS and silica/titania/PDMS nanocomposites. J. Appl. Polym. Sci. 2014, 131, 41154. [Google Scholar] [CrossRef]
- Tomaszewski, W.; Gun’ko, V.M.; Leboda, R.; Skubiszewska-Zięba, J. Interaction of methoxy- and methylenedioxyamphetamines with carbon and polymeric adsorbents in polar liquids. Cent. Eur. J. Chem. 2010, 8, 750–757. [Google Scholar] [CrossRef]
- Stamatopoulou, C.; Klonos, P.; Bondaruk, O.; Koutsoumpis, S.; Gun’ko, V.; Pissis, P.; Karabanova, L. Hydrophilic nanocomposites based on polyurethane/poly(2-hydroxyethyl methacrylate) semi-IPNs and modified/unmodified nanosilica for biomedical applications. J. Polym. Sci. Part B Polym. Phys. 2014, 52, 397–408. [Google Scholar] [CrossRef]
- Klonos, P.; Sulym, I.Y.; Kyriakos, K.; Vangelidis, I.; Zidropoulos, S.; Sternik, D.; Borysenko, M.V.; Kyritsis, A.; Deryło-Marczewska, A.; Gun’ko, V.M.; et al. Interfacial phenomena in core–shell nanocomposites of PDMS adsorbed onto low specific surface area fumed silica nanooxides: Effects of surface modifications. Polymer 2015, 68, 158–167. [Google Scholar] [CrossRef]
- Klonos, P.; Sulym, I.Y.; Sternik, D.; Konstantinou, P.; Goncharuk, O.V.; Deryło–Marczewska, A.; Gun’ko, V.M.; Kyritsis, A.; Pissis, P. Morphology, crysallization and rigid amorphous fraction in PDMS adsorbed onto carbon nanotubes and graphite. Polymer 2018, 139, 130–144. [Google Scholar] [CrossRef]
- Tomaszewski, W.; Gun’ko, V.M.; Skubiszewska-Zięba, J. Solid phase extraction of explosive nitramines on macroreticular polymers modified by freezing with water or acetone. J. Sep. Sci. 2016, 39, 1524–1532. [Google Scholar] [CrossRef] [PubMed]
- Klonos, P.; Kulyk, K.; Borysenko, M.; Gun’ko, V.M.; Kyritsis, A.; Pissis, P. Effects of molecular weight below the entanglement threshold on interfacial nanoparticles/polymer dynamics. Macromolecules 2016, 49, 9457–9473. [Google Scholar] [CrossRef]
- Podkościelna, B.; Gordobil, O.; Riazanova, A.V.; Dobele, G.; Labidi, J.; Lindström, M.; Gun’ko, V.M.; Sevastyanova, O. Novel porous polymeric materials obtained from methacrylic derivatives of lignin copolymerized with styrene and divinylbenzene. ChemistrySelect 2017, 2, 2257–2264. [Google Scholar] [CrossRef]
- Sulym, I.; Goncharuk, O.; Sternik, D.; Terpilowski, K.; Derylo-Marczewska, A.; Borysenko, M.V.; Gun’ko, V.M. Nanooxide/polymer composites with silica@PDMS and ceria-zirconia-silica@PDMS: Textural, morphological and hydrophilic/hydrophobic features. Nanoscale Res. Lett. 2017, 12, 152. [Google Scholar] [CrossRef]
- Gun’ko, V.M.; Pakhlov, E.M.; Goncharuk, O.V.; Andriyko, L.S.; Nychiporuk, Y.M.; Balakin, D.Y.; Sternik, D.; Derylo-Marczewska, A. Nanosilica modified by polydimethylsiloxane depolymerized and chemically bound to nanoparticles or physically bound to unmodified or modified surfaces: Structure and interfacial phenomena. J. Colloid Interface Sci. 2018, 529, 273–282. [Google Scholar] [CrossRef]
- Gun’ko, V.M.; Savina, I.N.; Mikhalovsky, S.V. Cryogels: Morphological, structural and adsorption characterisation. Adv. Colloid Interface Sci. 2013, 187–188, 1–46. [Google Scholar] [CrossRef] [PubMed]
- Gun’ko, V.M.; Savina, I.N.; Mikhalovsky, S.V. Properties of water bound in hydrogels. Gels 2017, 3, 37. [Google Scholar] [CrossRef]
- Gun’ko, V.M. Composite materials: Textural characteristics. Appl. Surf. Sci. 2014, 307, 444–454. [Google Scholar] [CrossRef]
- Moreno, Y.P.; da Silva, W.L.; Stedile, F.C.; Radtke, C.; dos Santos, J.H.Z. Micro and nanodomains on structured silica/titania photocatalysts surface evaluated in RhB degradation: Effect of structural properties on catalytic efficiency. Appl. Surf. Sci. Adv. 2021, 3, 100055. [Google Scholar] [CrossRef]
- Gun’ko, V.M. Nano/meso/macroporous materials characterization affected by experimental conditions and features of the used methods. Chem. Phys. Technol. Surf. 2020, 11, 5–24. [Google Scholar] [CrossRef]
- Gun’ko, V.M. Textural characteristics of composite adsorbents analyzed with density functional theory and self-consistent regularization procedure. Chem. Phys. Technol. Surf. 2020, 11, 163–174. [Google Scholar] [CrossRef]
- Gun’ko, V.M.; Oranska, O.I.; Paientko, V.V.; Sulym, I.Y. Particulate morphology of nanostructured materials. Chem. Phys. Technol. Surf. 2020, 11, 368–378. [Google Scholar] [CrossRef]
- Provencher, S.W. A constrained regularization method for inverting data represented by linear algebraic or integral equations. Comp. Phys. Comm. 1982, 27, 213–227. [Google Scholar] [CrossRef]
- Thommes, M.; Kaneko, K.; Neimark, A.V.; Olivier, J.P.; Rodriguez–Reinoso, F.; Rouquerol, J.; Sing, K.S.W. Physisorption of gases, with special reference to the evaluation of surface area and pore size distribution (IUPAC Technical Report). Pure Appl. Chem. 2015, 87, 1051–1069. [Google Scholar] [CrossRef]
- Bergna, H.E.; Roberts, W.O. (Eds.) Colloidal Silica: Fundamentals and Applications; CRC Press: Boca Raton, FL, USA, 2006. [Google Scholar]
- Tan, K.; Zuluaga, S.; Gong, Q.; Gao, Y.; Nijem, N.; Li, J.; Thonhauser, T.; Chabal, Y.J. Competitive co-adsorption of CO2 with H2O, NH3, SO2, NO, NO2, N2, O2, and CH4 in M-MOF-74 (M = Mg, Co, Ni): The role of hydrogen bonding. Chem. Mater. 2015, 27, 2203–2217. [Google Scholar] [CrossRef]
- Orsikowsky-Sanchez, A.; Plantier, F.; Miqueu, C. Coupled gravimetric, manometric and calorimetric study of CO2, N2 and CH4 adsorption on zeolites for the assessment of classical equilibrium models. Adsorption 2020, 26, 1137–1152. [Google Scholar] [CrossRef]
- ImageJ. Available online: https://imagej.nih.gov/ij/plugins/granulometry.html (accessed on 23 October 2020).
- Fiji. 2021. Available online: https://imagej.net/Local_Thickness (accessed on 23 October 2020).
- Leboda, R.; Gun’ko, V.M.; Tomaszewski, W.; Trznadel, B.J. Relationship between structural characteristics of activated carbons and their concentrating efficiency with respect to nitroorganics. J. Colloid Interface Sci. 2001, 238, 489–500. [Google Scholar] [CrossRef] [PubMed]
- Zheng, Y.; Gun’ko, V.M.; Howell, C.A.; Sandeman, S.R.; Phillips, G.J.; Kozynchenko, O.P.; Tennison, S.R.; Ivanov, A.E.; Mikhalovsky, S.V. Composites with macroporous poly(vinyl alcohol) cryogels with attached activated carbon microparticles with controlled accessibility of a surface. ACS Appl. Mater. Interfaces 2012, 4, 5936–5944. [Google Scholar] [CrossRef]
- Gun’ko, V.M.; Turov, V.V.; Krupska, T.V.; Protsak, I.S.; Borysenko, M.V.; Pakhlov, E.M. Polymethylsiloxane alone and in composition with nanosilica under various conditions. J. Colloid Interface Sci. 2019, 541, 213–225. [Google Scholar] [CrossRef]
- Frisch, M.J.; Trucks, G.W.; Schlegel, H.B.; Scuseria, G.E.; Robb, M.A.; Cheeseman, J.R.; Scalmani, G.; Barone, V.; Mennucci, B.; Petersson, G.A.; et al. Gaussian 09; Revision D.01; Gaussian, Inc.: Wallingford, CT, USA, 2013. [Google Scholar]
- Gong, X.; He, S. Highly durable superhydrophobic polydimethylsiloxane/silica nanocomposite surfaces with good self-cleaning ability. ACS Omega 2020, 5, 4100–4108. [Google Scholar] [CrossRef]
- Gu, H.; Zhang, Q.; Gu, J.; Li, N.; Xiong, J. Facile preparation of superhydrophobic silica nanoparticles by hydrothermal-assisted sol–gel process and effects of hydrothermal time on surface modification. J. Sol. Gel Sci. Technol. 2018, 87, 478–485. [Google Scholar] [CrossRef]
- Sun, X.L.; Fan, Z.P.; Zhang, L.D.; Wang, L.; Wei, Z.J.; Wang, X.Q.; Liu, W.L. Superhydrophobicity of silica nanoparticles modified with polystyrene. Appl. Surf. Sci. 2011, 257, 2308–2312. [Google Scholar] [CrossRef]
- Gurav, A.B.; Xu, Q.; Latthe, S.S.; Vhatkar, R.S.; Liu, S.; Yoon, H.; Yoon, S.S. Superhydrophobic coatings prepared from methyl-modified silica particles using simple dip-coating method. Ceram. Int. B 2015, 41, 3017–3023. [Google Scholar] [CrossRef]
- Stewart, J.J.P. MOPAC2016. Stewart Computational Chemistry. Available online: http://openmopac.net (accessed on 21 February 2021).
- Stewart, J.J.P. Optimization of parameters for semiempirical methods VI: More modifications to the NDDO approximations and re-optimization of parameters. J. Mol. Mod. 2013, 19, 1–32. [Google Scholar] [CrossRef] [PubMed]
- Kothalawala, N.; Blitz, J.P.; Gun’ko, V.M.; Jaroniec, M.; Grabicka, B.; Semeniuc, R.F. Post-synthesis surface modified silicas as adsorbents for heavy metal ion contaminants Cd(II), Cu(II), Cr(III), and Sr(II) in aqueous solutions. J. Colloid Interface Sci. 2013, 392, 57–64. [Google Scholar] [CrossRef] [PubMed]
- Blitz, I.P.; Blitz, J.P.; Gun’ko, V.M.; Sheeran, D.J. Functionalized silicas: Structural characteristics and adsorption of Cu(II) and Pb(II). Colloids Surf. A Physicochem. Eng. Asp. 2007, 307, 83–92. [Google Scholar] [CrossRef]
- Gun’ko, V.M.; Turov, V.V.; Zarko, V.I.; Nychiporuk, Y.M.; Goncharuk, E.V.; Pakhlov, E.M.; Yurchenko, G.R.; Kulik, T.V.; Palyanytsya, B.B.; Borodavka, T.V.; et al. Structural features of polymer adsorbent LiChrolut EN and interfacial behavior of water and water-organic mixtures. J. Colloid Interface Sci. 2008, 323, 6–17. [Google Scholar] [CrossRef] [PubMed]
- Wang, Y.-Y.; Meng, X.; Pu, Y.; Ragauskas, A.J. Recent advances in the application of functionalized lignin in value-added polymeric materials. Polymers 2020, 12, 2277. [Google Scholar] [CrossRef] [PubMed]
- Li, T.; Takkellapati, S. The current and emerging sources of technical lignins and their applications. Biofuel. Bioprod. Biorefin. 2018, 12, 756–787. [Google Scholar] [CrossRef]
- Bolze, J.; Kogan, V.; Beckers, D.; Fransen, M. High-performance small- and wide-angle X-ray scattering (SAXS/WAXS) experiments on a multi-functional laboratory goniometer platform with easily exchangeable X-ray modules. Rev. Sci. Instrum. 2018, 89, 085115. [Google Scholar] [CrossRef]
- Kim, Y.; Wichaita, W.; Thérien-Aubin, H. Influence of the architecture of soft polymer-functionalized polymer nanoparticles on their dynamics in suspension. Polymers 2020, 12, 1844. [Google Scholar] [CrossRef]
- Ghosh, S.; Das, S.; Mosquera, M.E.G. Conducting polymer-based nanohybrids for fuel cell application. Polymers 2020, 12, 2993. [Google Scholar] [CrossRef] [PubMed]
- EL-Ghoul, Y.; Ammar, C.; Alminderej, F.M.; Shafiquzzama, M. Design and evaluation of a new natural multi-layered biopolymeric adsorbent system-based chitosan/cellulosic nonwoven material for the biosorption of industrial textile effluents. Polymers 2021, 13, 322. [Google Scholar] [CrossRef] [PubMed]
- Torres-Ávalos, J.A.; Cajero-Zul, L.R.; Milton, V.-L.; López-Dellamary, F.A.; Antonio Martínez-Richa, A.; Barrera-Rivera, K.A.; Francisco, L.-S.; Nuño-Donlucas, S.M. Synthesis of poly(methacrylic acid-co-butyl acrylate) grafted onto functionalized carbon nanotube nanocomposites for drug delivery. Polymers 2021, 13, 533. [Google Scholar] [CrossRef] [PubMed]
- Power, A.J.; Remediakis, I.N.; Harmandaris, V. Interface and interphase in polymer nanocomposites with bare and core-shell gold nanoparticles. Polymers 2021, 13, 541. [Google Scholar] [CrossRef]
- Cho, B.-G.; Joshi, S.R.; Lee, S.; Kim, S.-K.; Park, Y.-B.; Kim, G.-H. Enhanced mechanical and antibacterial properties of nanocomposites based on poly(vinyl alcohol) and biopolymer-derived reduced graphene oxide. Polymers 2021, 13, 615. [Google Scholar] [CrossRef]
- Orellana, J.; Moreno-Villoslada, I.; Bose, R.K.; Picchioni, F.; Flores, M.E.; Araya-Hermosilla, R. Self-healing polymer nanocomposite materials by Joule effect. Polymers 2021, 13, 649. [Google Scholar] [CrossRef] [PubMed]
- Cisneros, C.G.; Bloemen, V.; Mignon, A. Synthetic, natural, and semisynthetic polymer carriers for controlled nitric oxide release in dermal applications: A review. Polymers 2021, 13, 760. [Google Scholar] [CrossRef] [PubMed]
- Bifulco, A.; Marotta, A.; Passaro, J.; Costantini, A.; Cerruti, P.; Gentile, G.; Ambrogi, V.; Malucelli, G.; Branda, F. Thermal and fire behavior of a bio-based epoxy/silica hybrid cured with methyl nadic anhydride. Polymers 2020, 12, 1661. [Google Scholar] [CrossRef] [PubMed]
- Gun’ko, V.M.; Skubiszewska-Zięba, J.; Leboda, R.; Voronin, E.F.; Zarko, V.I.; Levitskaya, S.I.; Brei, V.V.; Guzenko, N.V.; Kazakova, O.A.; Seledets, O.; et al. Pyrocarbons prepared by carbonisation of polymers adsorbed or synthesised on a surface of silica and mixed oxides. Appl. Surf. Sci. 2004, 227, 219–243. [Google Scholar] [CrossRef]
- Gun’ko, V.M.; Leboda, R.; Skubiszewska-Zięba, J.; Goncharuk, E.V.; Nychiporuk, Y.M.; Zarko, V.I.; Blitz, J.P. Influence of different treatments on characteristics of nanooxide powders alone or with adsorbed polar polymers or proteins. Powder Technol. 2008, 187, 146–158. [Google Scholar] [CrossRef]
- Turov, V.V.; Turova, A.A.; Goncharuk, E.V.; Gun’ko, V.M. Adsorption of methane with the presence of water on oxide, polymer and carbon adsorbents studied using 1H NMR spectroscopy at low temperatures. Appl. Surf. Sci. 2008, 255, 3310–3317. [Google Scholar] [CrossRef]
- Vilarrasa-García, E.; Cecilia, J.A.; Bastos-Neto, M.; Cavalcante, C.L., Jr.; Azevedo, D.C.S.; Rodriguez-Castellón, E. CO2/CH4 adsorption separation process using pore expanded mesoporous silicas functionalizated by APTES grafting. Adsorption 2015, 21, 565–575. [Google Scholar] [CrossRef]
- Ullmann’s Encyclopedia of Industrial Chemistry; Wiley-VCH: Weinheim, Germany, 2008.
- Wyman, E.B.; Skief, M.C. (Eds.) Organosilanes Properties Performance and Applications; Nova Science Publishers: New York, NY, USA, 2010. [Google Scholar]
- Buschow, K.H.J. Encyclopedia of Materials: Science and Technology; Elsevier: Amsterdam, The Netherlands, 2001. [Google Scholar]
- Do, D.D. Adsorption Analysis: Equilibria and Kinetics; Imperial College Press: London, UK, 1998. [Google Scholar]
- Butt, H.-J.; Graf, K.; Kappl, M. Physics and Chemistry of Interfaces; Wiley-VCH Verlag: Weinheim, Germany, 2003. [Google Scholar]
- Rouquerol, J.; Rouquerol, F.; Sing, K.S.W.; Llewellyn, P.; Maurin, G. Adsorption by Powders and Porous Solids: Principles, Methodology and Applications; Academic Press: London, UK, 2014. [Google Scholar]
- Chang, R. Physical Chemistry for the Biosciences; Edwards Brothers, Inc.: Sausalito, CA, USA, 2005. [Google Scholar]
- Gun’ko, V.M.; Pakhlov, E.M.; Skubiszewska-Zięba, J.; Blitz, J.P. Infrared spectroscopy as a tool for textural and structural characterization of individual and complex fumed oxides. Vib. Spectrosc. 2017, 88, 56–62. [Google Scholar] [CrossRef]


Publisher’s Note: MDPI stays neutral with regard to jurisdictional claims in published maps and institutional affiliations. |
© 2021 by the author. Licensee MDPI, Basel, Switzerland. This article is an open access article distributed under the terms and conditions of the Creative Commons Attribution (CC BY) license (https://creativecommons.org/licenses/by/4.0/).