
Spider Web-Inspired Lightweight Membrane-Type Acoustic Metamaterials for Broadband Low-Frequency Sound Isolation


Abstract
1. Introduction
2. Structural Design and Methods
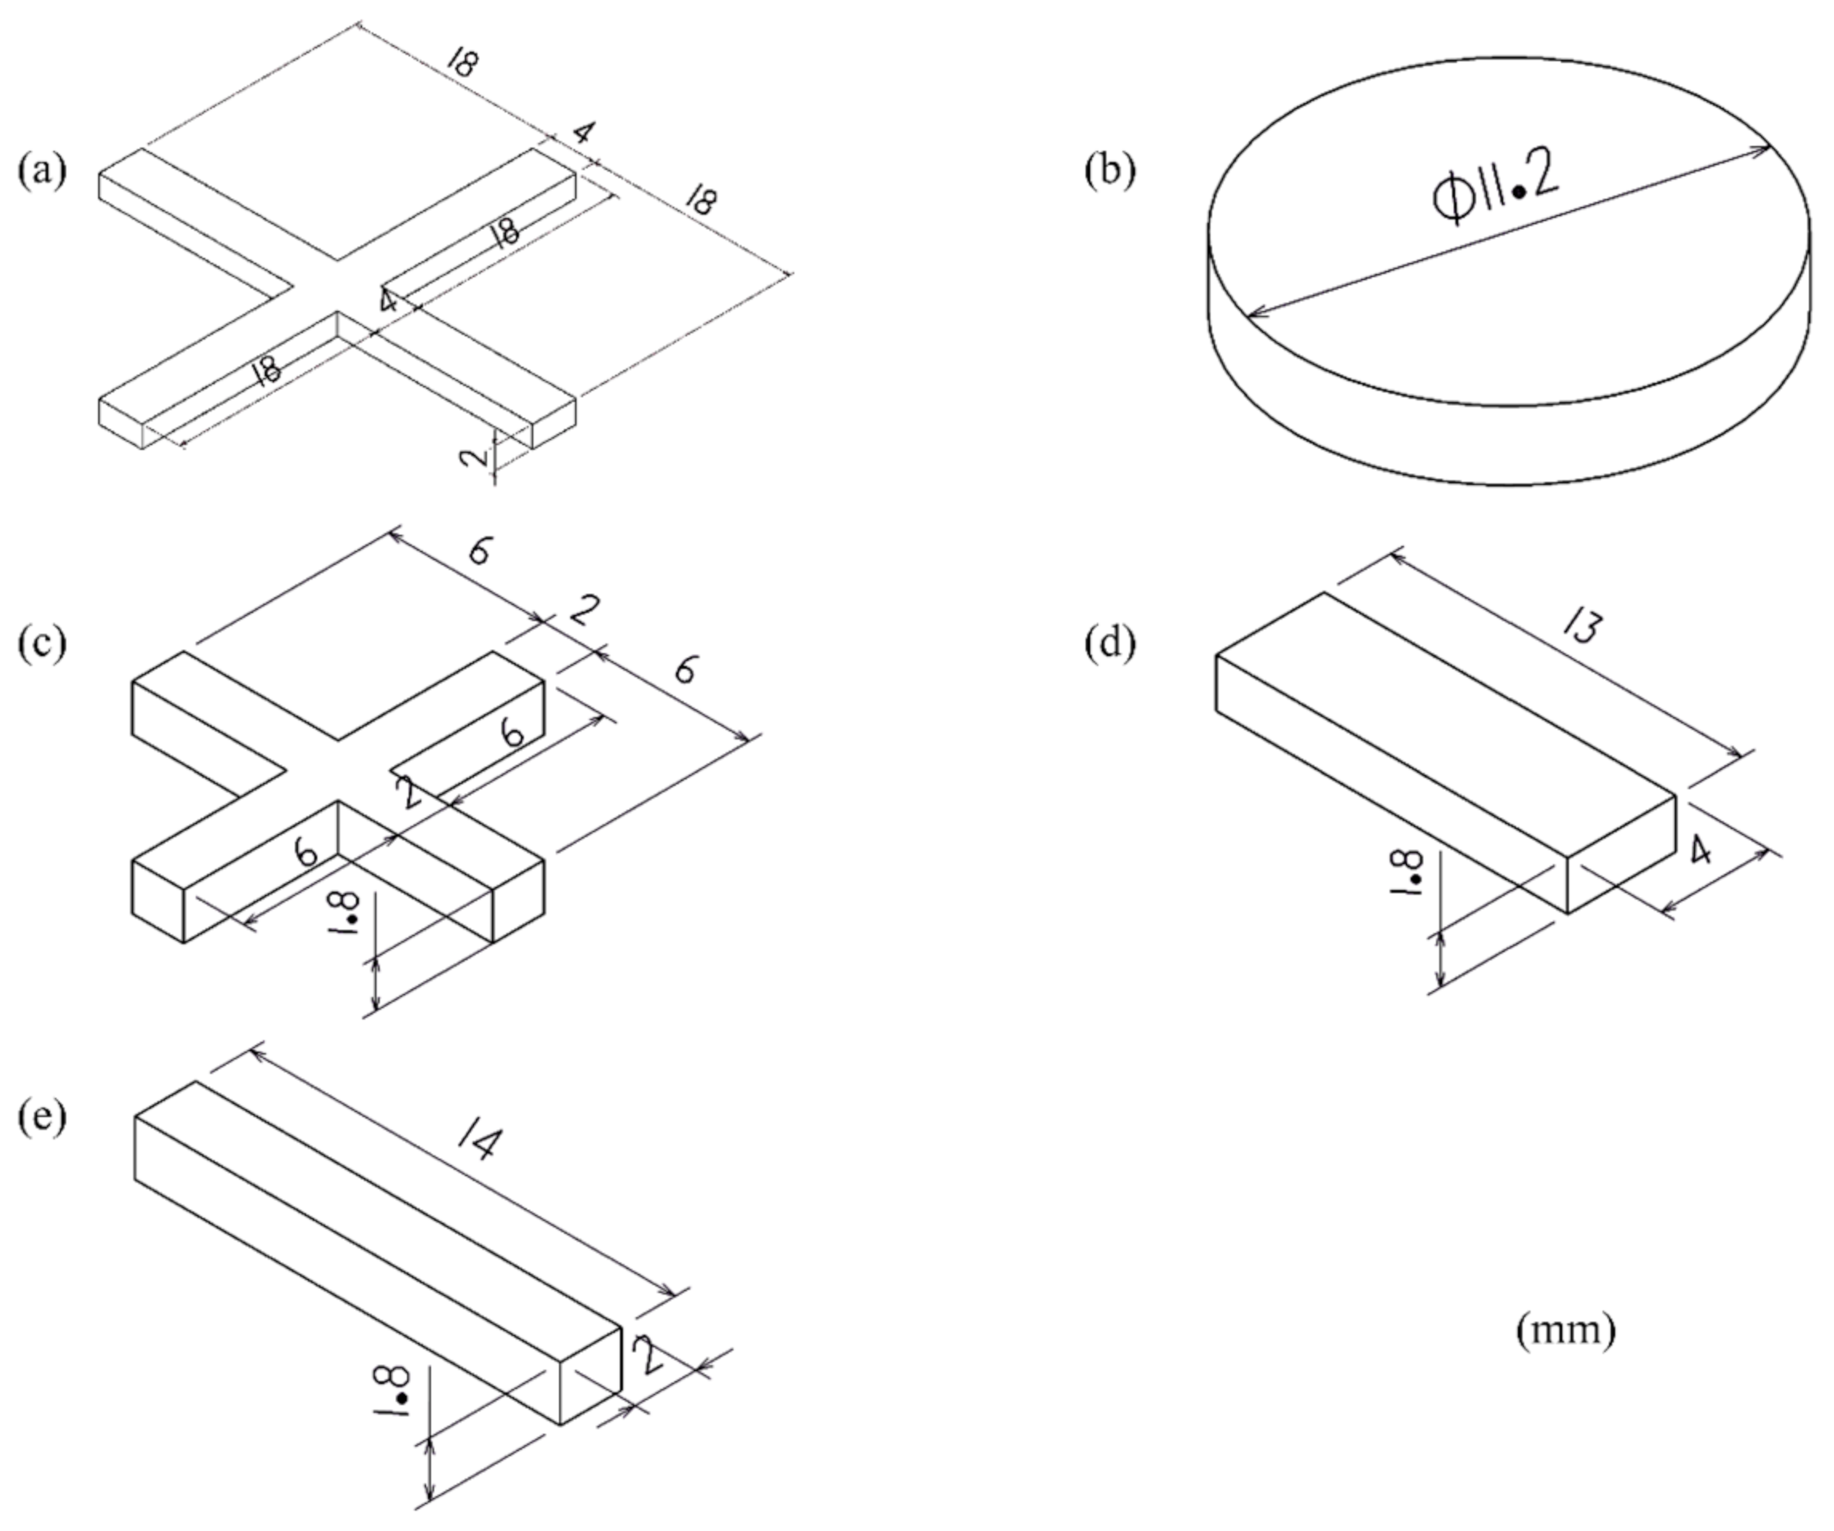
2.1. Spider Web-Inspired MAMs
2.2. Numerical Acoustic-Structure Models
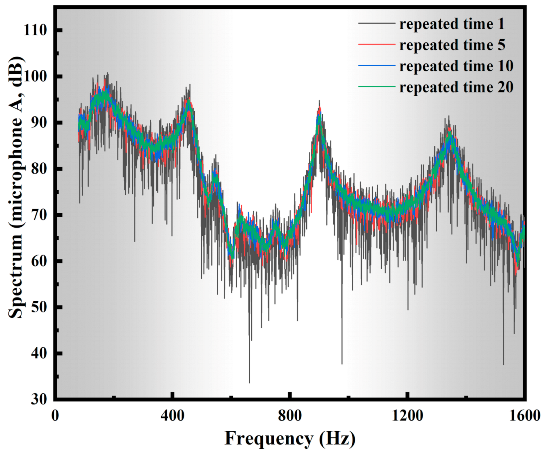
2.3. Experimental Setup
3. Results and Discussion
3.1. STL and Anti-Resonance Modes
3.2. Bandwidth Widening in Lighter Bio-Inspired Designs
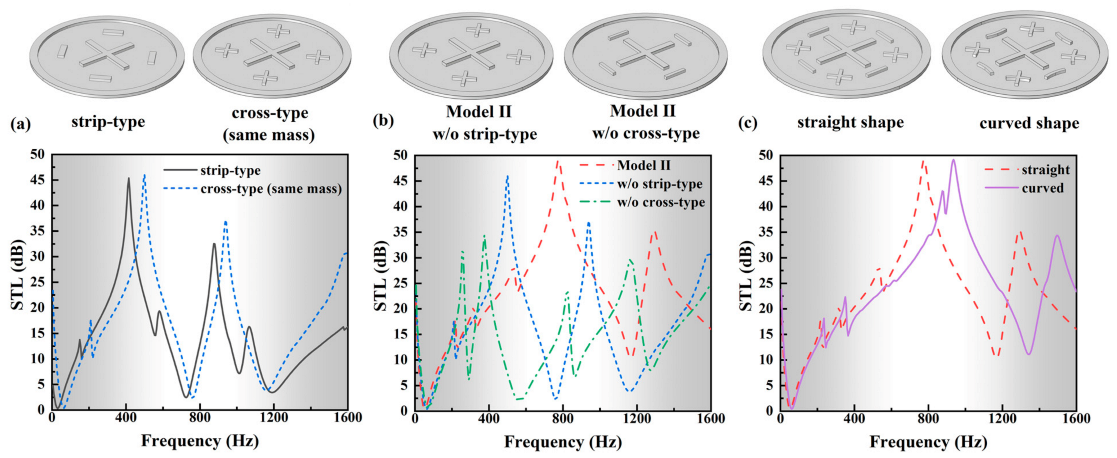
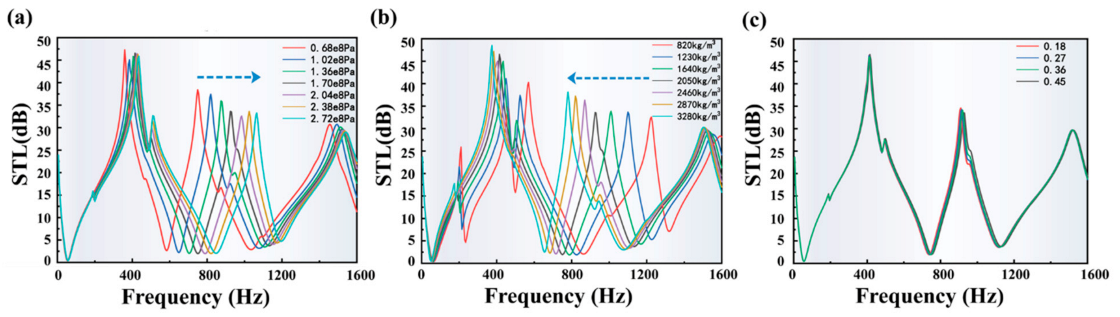
3.3. Effects of the Shape Design and Membrane Parameters
4. Conclusions
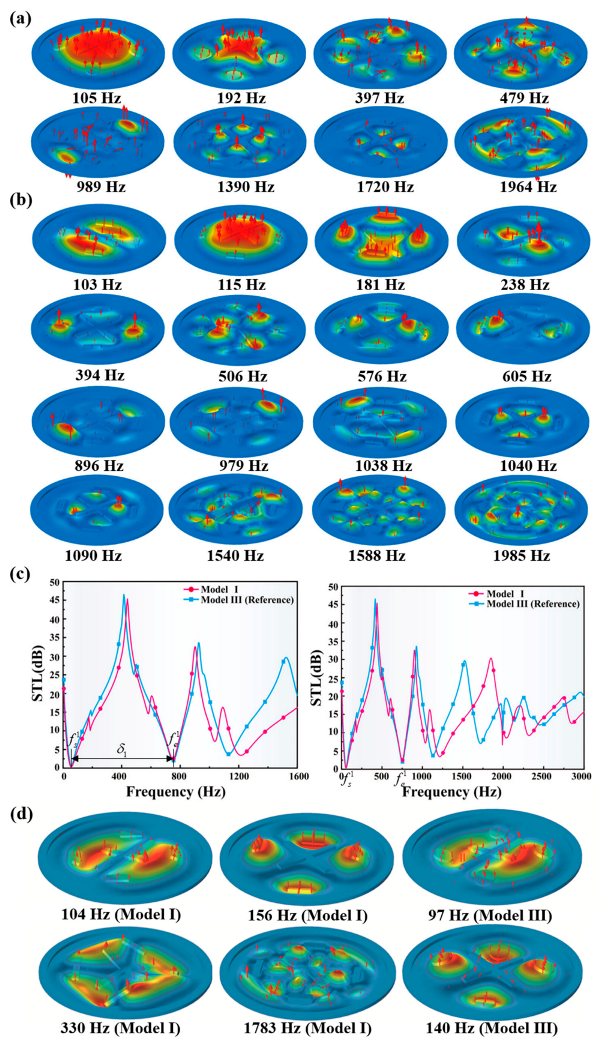
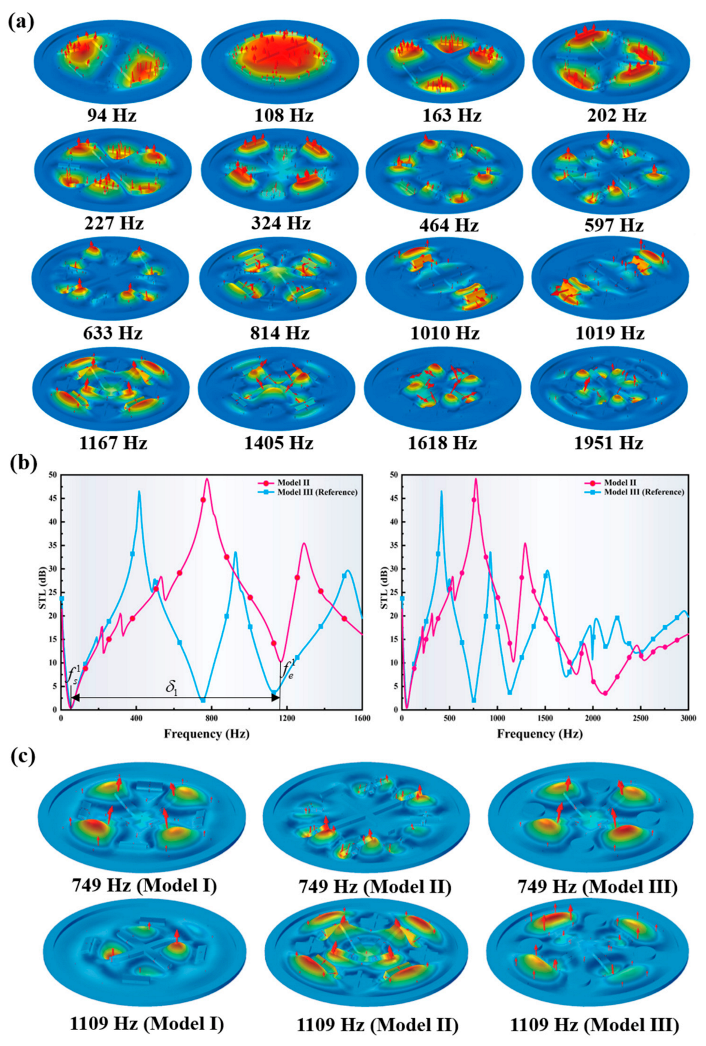
- By using the proposed bio-inspired MAM models, significant sound attenuation within a broadband low-frequency range is achieved. It is verified that the prominent attenuation performance is induced by the multi-state anti-resonance modes of the symmetrically distributed multi-resonators. Such unremitting anti-resonance behaviors can maintain the dynamic balances within a wide bandwidth by trapping the vibration energy.
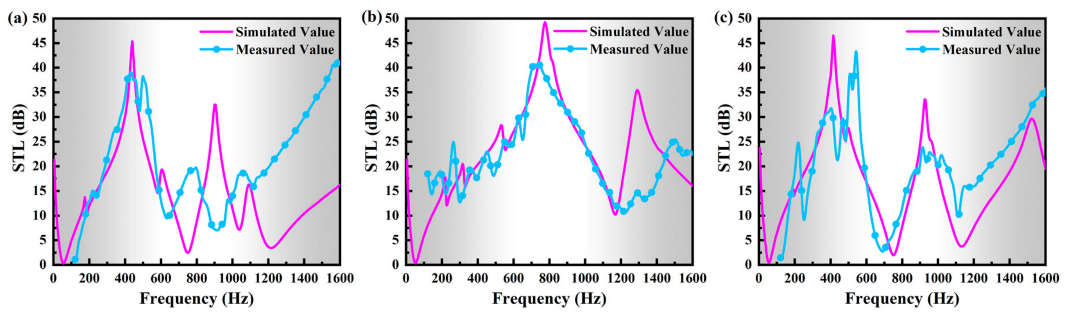
- The experimentally measured STL properties of the bio-inspired MAM structures are discussed and compared in depth. Remarkably, compared with a reference MAM model, outstanding enhancements in both attenuation bandwidth and weight-reduction performance are illustrated in the spider web-inspired designs.
- Specifically, the bio-inspired Model I can significantly reduce the structure weight by nearly half (47%), but still maintain a same sound attenuation property as the reference model. The bio-inspired Model II can greatly enhance the comprehensive sound attenuation while keeping a lighter weight design (19% less than the reference model). The continuous attenuation bandwidth in the proposed Model II has a 61% increase compared to the reference model, while the normalized bandwidth has a significant ~80% broadening.
- The arrangement of the spider web structure can enhance the coupling interaction between the multi-resonators and host film along the circumferential and radial directions. Therefore, more adjacent, multi-state anti-resonance modes are generated in the low-frequency range to suppress the discontinuity, leading to a broadening attenuation bandwidth.
Author Contributions
Funding
Institutional Review Board Statement
Informed Consent Statement
Data Availability Statement
Conflicts of Interest
Appendix A

Appendix B

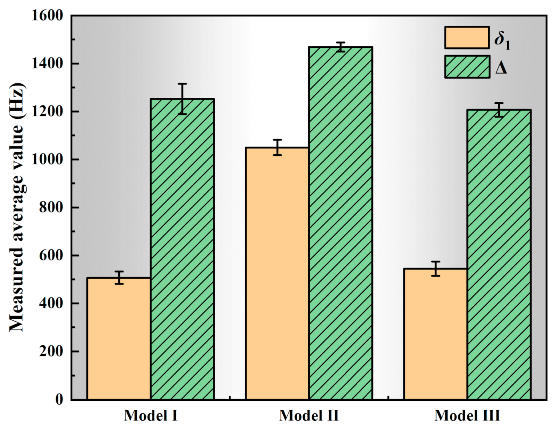
| Model | STL | Test 1 (Hz) | Test 2 (Hz) | Test 3 (Hz) | Test 4 (Hz) | Relative Error (%) |
|---|---|---|---|---|---|---|
| I | 505 | 529 | 523 | 471 | −7.10~4.34 | |
| 1291 | 1195 | 1321 | 1202 | −4.57~5.49 | ||
| II | 1049 | 1062 | 1083 | 1006 | −4.19~3.14 | |
| 1485 | 1480 | 1442 | 1467 | −1.80~1.12 | ||
| III | 559 | 507 | 576 | 537 | −6.93~5.74 | |
| 1240 | 1187 | 1221 | 1179 | −2.30~5.49 |


References
- Poletti, C.; Buchwald, B.; Lewin, P.; Harris, C.M. Handbook of Noise Control. Columbia Law Rev. 1958, 58, 580. [Google Scholar] [CrossRef]
- Mei, J.; Ma, G.; Yang, M.; Yang, Z.Y.; Wen, W.; Sheng, P. Dark acoustic metamaterials as super absorbers for low-frequency sound. Nat. Commun. 2012, 3, 756. [Google Scholar] [CrossRef] [PubMed]
- Liao, Y.; Chen, Y.; Huang, G.; Zhou, X. Broadband low-frequency sound isolation by lightweight adaptive metamaterials. J. Appl. Phys. 2018, 123, 091705. [Google Scholar] [CrossRef]
- Ma, F.; Wu, J.H.; Huang, M.; Zhang, W.; Zhang, S. A purely flexible lightweight membrane-type acoustic metamaterial. J. Phys. D Appl. Phys. 2015, 48, 175105. [Google Scholar] [CrossRef]
- Liu, Z.; Zhang, X.; Mao, Y.; Zhu, Y.Y.; Yang, Z.; Chan, C.T.; Sheng, P. Locally Resonant Sonic Materials. Science 2000, 289, 1734–1736. [Google Scholar] [CrossRef] [PubMed]
- Cummer, S.A.; Christensen, J.; Alù, A. Controlling sound with acoustic metamaterials. Nat. Rev. Mater. 2016, 1, 16001. [Google Scholar] [CrossRef]
- Ma, G.; Sheng, P. Acoustic metamaterials: From local resonances to broad horizons. Sci. Adv. 2016, 2, e1501595. [Google Scholar] [CrossRef] [PubMed]
- Fang, N.; Xi, D.; Xu, J.; Ambati, M.; Srituravanich, W.; Sun, C.; Zhang, X. Ultrasonic metamaterials with negative modulus. Nat. Mater. 2006, 5, 452–456. [Google Scholar] [CrossRef]
- Li, B.; Li, Z.; Christensen, J.; Tan, K.T. Dual Dirac cones in elastic Lieb-like lattice metamaterials. Appl. Phys. Lett. 2019, 114, 081906. [Google Scholar] [CrossRef]
- Gao, S.; Liu, W.; Zhang, L.; Gain, A.K. A New Polymer-Based Mechanical Metamaterial with Tailorable Large Negative Poisson′s Ratios. Polymers 2020, 12, 1492. [Google Scholar] [CrossRef]
- Zhang, W.; Zhao, S.; Sun, R.; Scarpa, F.; Wang, J. In-Plane Mechanical Behavior of a New Star-Re-Entrant Hierarchical Metamaterial. Polymers 2019, 11, 1132. [Google Scholar] [CrossRef] [PubMed]
- Ding, Y.; Liu, Z.; Qiu, C.; Shi, J. Metamaterial with Simultaneously Negative Bulk Modulus and Mass Density. Phys. Rev. Lett. 2007, 99, 093904. [Google Scholar] [CrossRef] [PubMed]
- Zhu, R.; Liu, X.N.; Hu, G.K.; Sun, C.T.; Huang, G.L. Negative refraction of elastic waves at the deep-subwavelength scale in a single-phase metamaterial. Nat. Commun. 2014, 5, 5510. [Google Scholar] [CrossRef] [PubMed]
- Li, B.; Tan, K.T.; Christensen, J. Tailoring the thermal conductivity in nanophononic metamaterials. Phys. Rev. B 2017, 95, 144305. [Google Scholar] [CrossRef]
- Chen, Y.; Qian, F.; Scarpa, F.; Zuo, L.; Zhuang, X. Harnessing multi-layered soil to design seismic metamaterials with ultralow frequency band gaps. Mater. Des. 2019, 175, 107813. [Google Scholar] [CrossRef]
- Craster, R.V.; Guenneau, S. Acoustic Metamaterials: Negative Refraction, Imaging, Lensing and Cloaking; Springer Science & Business Media: Berlin/Heidelberg, Germany, 2012; Volume 166. [Google Scholar]
- Nassar, H.; Yousefzadeh, B.; Fleury, R.; Ruzzene, M.; Alù, A.; Daraio, C.; Norris, A.N.; Huang, G.; Haberman, M.R. Nonreciprocity in acoustic and elastic materials. Nat. Rev. Mater. 2020, 5, 667–685. [Google Scholar] [CrossRef]
- Hirsekorn, M. Small-size sonic crystals with strong attenuation bands in the audible frequency range. Appl. Phys. Lett. 2004, 84, 3364–3366. [Google Scholar] [CrossRef]
- Li, B.; Zhang, C.; Peng, F.; Wang, W.; Vogt, B.D.; Tan, K.T. 4D printed shape memory metamaterial for vibration bandgap switching and active elastic-wave guiding. J. Mater. Chem. C 2021, 9, 1164–1173. [Google Scholar] [CrossRef]
- Oudich, M.; Senesi, M.; Assouar, M.B.; Ruzenne, M.; Sun, J.-H.; Vincent, B.; Hou, Z.; Wu, T.-T. Experimental evidence of locally resonant sonic band gap in two-dimensional phononic stubbed plates. Phys. Rev. B 2011, 84, 165136. [Google Scholar] [CrossRef]
- Yang, Z.; Mei, J.; Yang, M.; Chan, N.H.; Sheng, P. Membrane-Type Acoustic Metamaterial with Negative Dynamic Mass. Phys. Rev. Lett. 2008, 101, 204301. [Google Scholar] [CrossRef]
- Ang, L.Y.L.; Koh, Y.K.; Lee, H.P. Broadband sound transmission loss of a large-scale membrane-type acoustic metamaterial for low-frequency noise control. Appl. Phys. Lett. 2017, 111, 041903. [Google Scholar] [CrossRef]
- Naify, C.J.; Chang, C.-M.; McKnight, G.P.; Nutt, S.R. Transmission loss and dynamic response of membrane-type locally resonant acoustic metamaterials. J. Appl. Phys. 2010, 108, 114905. [Google Scholar] [CrossRef]
- Naify, C.J.; Chang, C.-M.; McKnight, G.P.; Scheulen, F.; Nutt, S.R. Membrane-type metamaterials: Transmission loss of multi-celled arrays. J. Appl. Phys. 2011, 109, 104902. [Google Scholar] [CrossRef]
- Sui, N.; Yan, X.; Huang, T.-Y.; Xu, J.; Yuan, F.G.; Jing, Y. A lightweight yet sound-proof honeycomb acoustic metamaterial. Appl. Phys. Lett. 2015, 106, 216101. [Google Scholar] [CrossRef]
- Wang, X.; Zhao, H.; Luo, X.; Huang, Z. Membrane-constrained acoustic metamaterials for low frequency sound insulation. Appl. Phys. Lett. 2016, 108, 041905. [Google Scholar] [CrossRef]
- Chen, Y.; Huang, G.; Zhou, X.; Hu, G.; Sun, C.-T. Analytical coupled vibroacoustic modeling of membrane-type acoustic metamaterials: Membrane model. J. Acoust. Soc. Am. 2014, 136, 969–979. [Google Scholar] [CrossRef]
- Naify, C.J.; Chang, C.-M.; McKnight, G.; Nutt, S.R. Transmission loss of membrane-type acoustic metamaterials with coaxial ring masses. J. Appl. Phys. 2011, 110, 124903. [Google Scholar] [CrossRef]
- Knudson, D.V. Fundamentals of Biomechanics; Springer: New York, NY, USA, 2007; Volume 2, p. 337. Available online: https://www.springer.com/gp/book/9780387493114 (accessed on 10 January 2021).
- Huston, R.L. Principles of Biomechanics; Apple Academic Press: Waretown, NJ, USA, 2008; Volume 1, p. 442. Available online: https://www.taylorfrancis.com/books/mono/10.1201/9781420018400/principles-biomechanics-ronald-huston (accessed on 10 January 2021).
- Hu, J.; Yu, T.; Yin, S.; Xu, J. Low-speed impact mitigation of recoverable DNA-inspired double helical metamaterials. Int. J. Mech. Sci. 2019, 161-162, 105050. [Google Scholar] [CrossRef]
- Sepehri, S.; Jafari, H.; Mashhadi, M.M.; Yazdi, M.R.H.; Fakhrabadi, M.M.S. Study of tunable locally resonant metamaterials: Effects of spider-web and snowflake hierarchies. Int. J. Solids Struct. 2020, 204–205, 81–95. [Google Scholar] [CrossRef]
- Ma, F.; Wu, J.H.; Huang, M.; Fu, G.; Bai, C. Cochlear bionic acoustic metamaterials. Appl. Phys. Lett. 2014, 105, 213702. [Google Scholar] [CrossRef]
- Krushynska, A.O.; Bosia, F.; Miniaci, M.; Pugno, N.M. Spider web-structured labyrinthine acoustic metamaterials for low-frequency sound control. New J. Phys. 2017, 19, 105001. [Google Scholar] [CrossRef]
- Zhou, G.; Wu, J.H.; Lu, K.; Tian, X.; Huang, W.; Zhu, K. Broadband low-frequency membrane-type acoustic metamaterials with multi-state anti-resonances. Appl. Acoust. 2020, 159, 107078. [Google Scholar] [CrossRef]
- ASTM E2611-09, Standard Test Method for Measurement of Normal Incidence Sound Transmission of Acoustical Materials Based on the Transfer Matrix Method; ASTM International: West Conshohocken, PA, USA, 2009; Available online: https://www.astm.org/DATABASE.CART/HISTORICAL/E2611-09.htm (accessed on 10 January 2021).


| Young’s Modulus (Pa) | Density (kg/m3) | Poisson’s Ratio | |
|---|---|---|---|
| PI | 1.42 × 10⁹ | 1100 | 0.36 |
| EVA | 1.7 × 10⁸ | 2050 | 0.45 |
| Metal | 2 × 10¹¹ | 7800 | 0.33 |
| Model | Vibrator Area (mm2) | Vibrator Mass (g) | STL Peak (dB) | Bandwidth of STL (Hz) (>10 dB) | |||||||||
|---|---|---|---|---|---|---|---|---|---|---|---|---|---|
| Within 3000 Hz | |||||||||||||
| I | 4 × 52 | 2.92 | 45.4 | 55 | 750 | 695 | 12.64 | 750 | 1035 | 285 | 0.38 | 1010 | 2250 |
| II | 4 × 80 | 4.49 | 49.2 | 50 | 1170 | 1120 | 22.4 | 1170 | 1825 | 655 | 0.56 | 1465 | 2360 |
| III | 4 × 98.52 | 5.52 | 46.5 | 55 | 750 | 695 | 12.64 | 750 | 1130 | 380 | 0.51 | 1160 | 2340 |
Publisher’s Note: MDPI stays neutral with regard to jurisdictional claims in published maps and institutional affiliations. |
© 2021 by the authors. Licensee MDPI, Basel, Switzerland. This article is an open access article distributed under the terms and conditions of the Creative Commons Attribution (CC BY) license (https://creativecommons.org/licenses/by/4.0/).
Share and Cite
Huang, H.; Cao, E.; Zhao, M.; Alamri, S.; Li, B. Spider Web-Inspired Lightweight Membrane-Type Acoustic Metamaterials for Broadband Low-Frequency Sound Isolation. Polymers 2021, 13, 1146. https://doi.org/10.3390/polym13071146
Huang H, Cao E, Zhao M, Alamri S, Li B. Spider Web-Inspired Lightweight Membrane-Type Acoustic Metamaterials for Broadband Low-Frequency Sound Isolation. Polymers. 2021; 13(7):1146. https://doi.org/10.3390/polym13071146
Chicago/Turabian StyleHuang, Heyuan, Ertai Cao, Meiying Zhao, Sagr Alamri, and Bing Li. 2021. "Spider Web-Inspired Lightweight Membrane-Type Acoustic Metamaterials for Broadband Low-Frequency Sound Isolation" Polymers 13, no. 7: 1146. https://doi.org/10.3390/polym13071146
APA StyleHuang, H., Cao, E., Zhao, M., Alamri, S., & Li, B. (2021). Spider Web-Inspired Lightweight Membrane-Type Acoustic Metamaterials for Broadband Low-Frequency Sound Isolation. Polymers, 13(7), 1146. https://doi.org/10.3390/polym13071146