
Enhanced Mechanical and Antibacterial Properties of Nanocomposites Based on Poly(vinyl Alcohol) and Biopolymer-Derived Reduced Graphene Oxide

 ,
, 

Abstract
1. Introduction
2. Materials and Methods
2.1. Materials
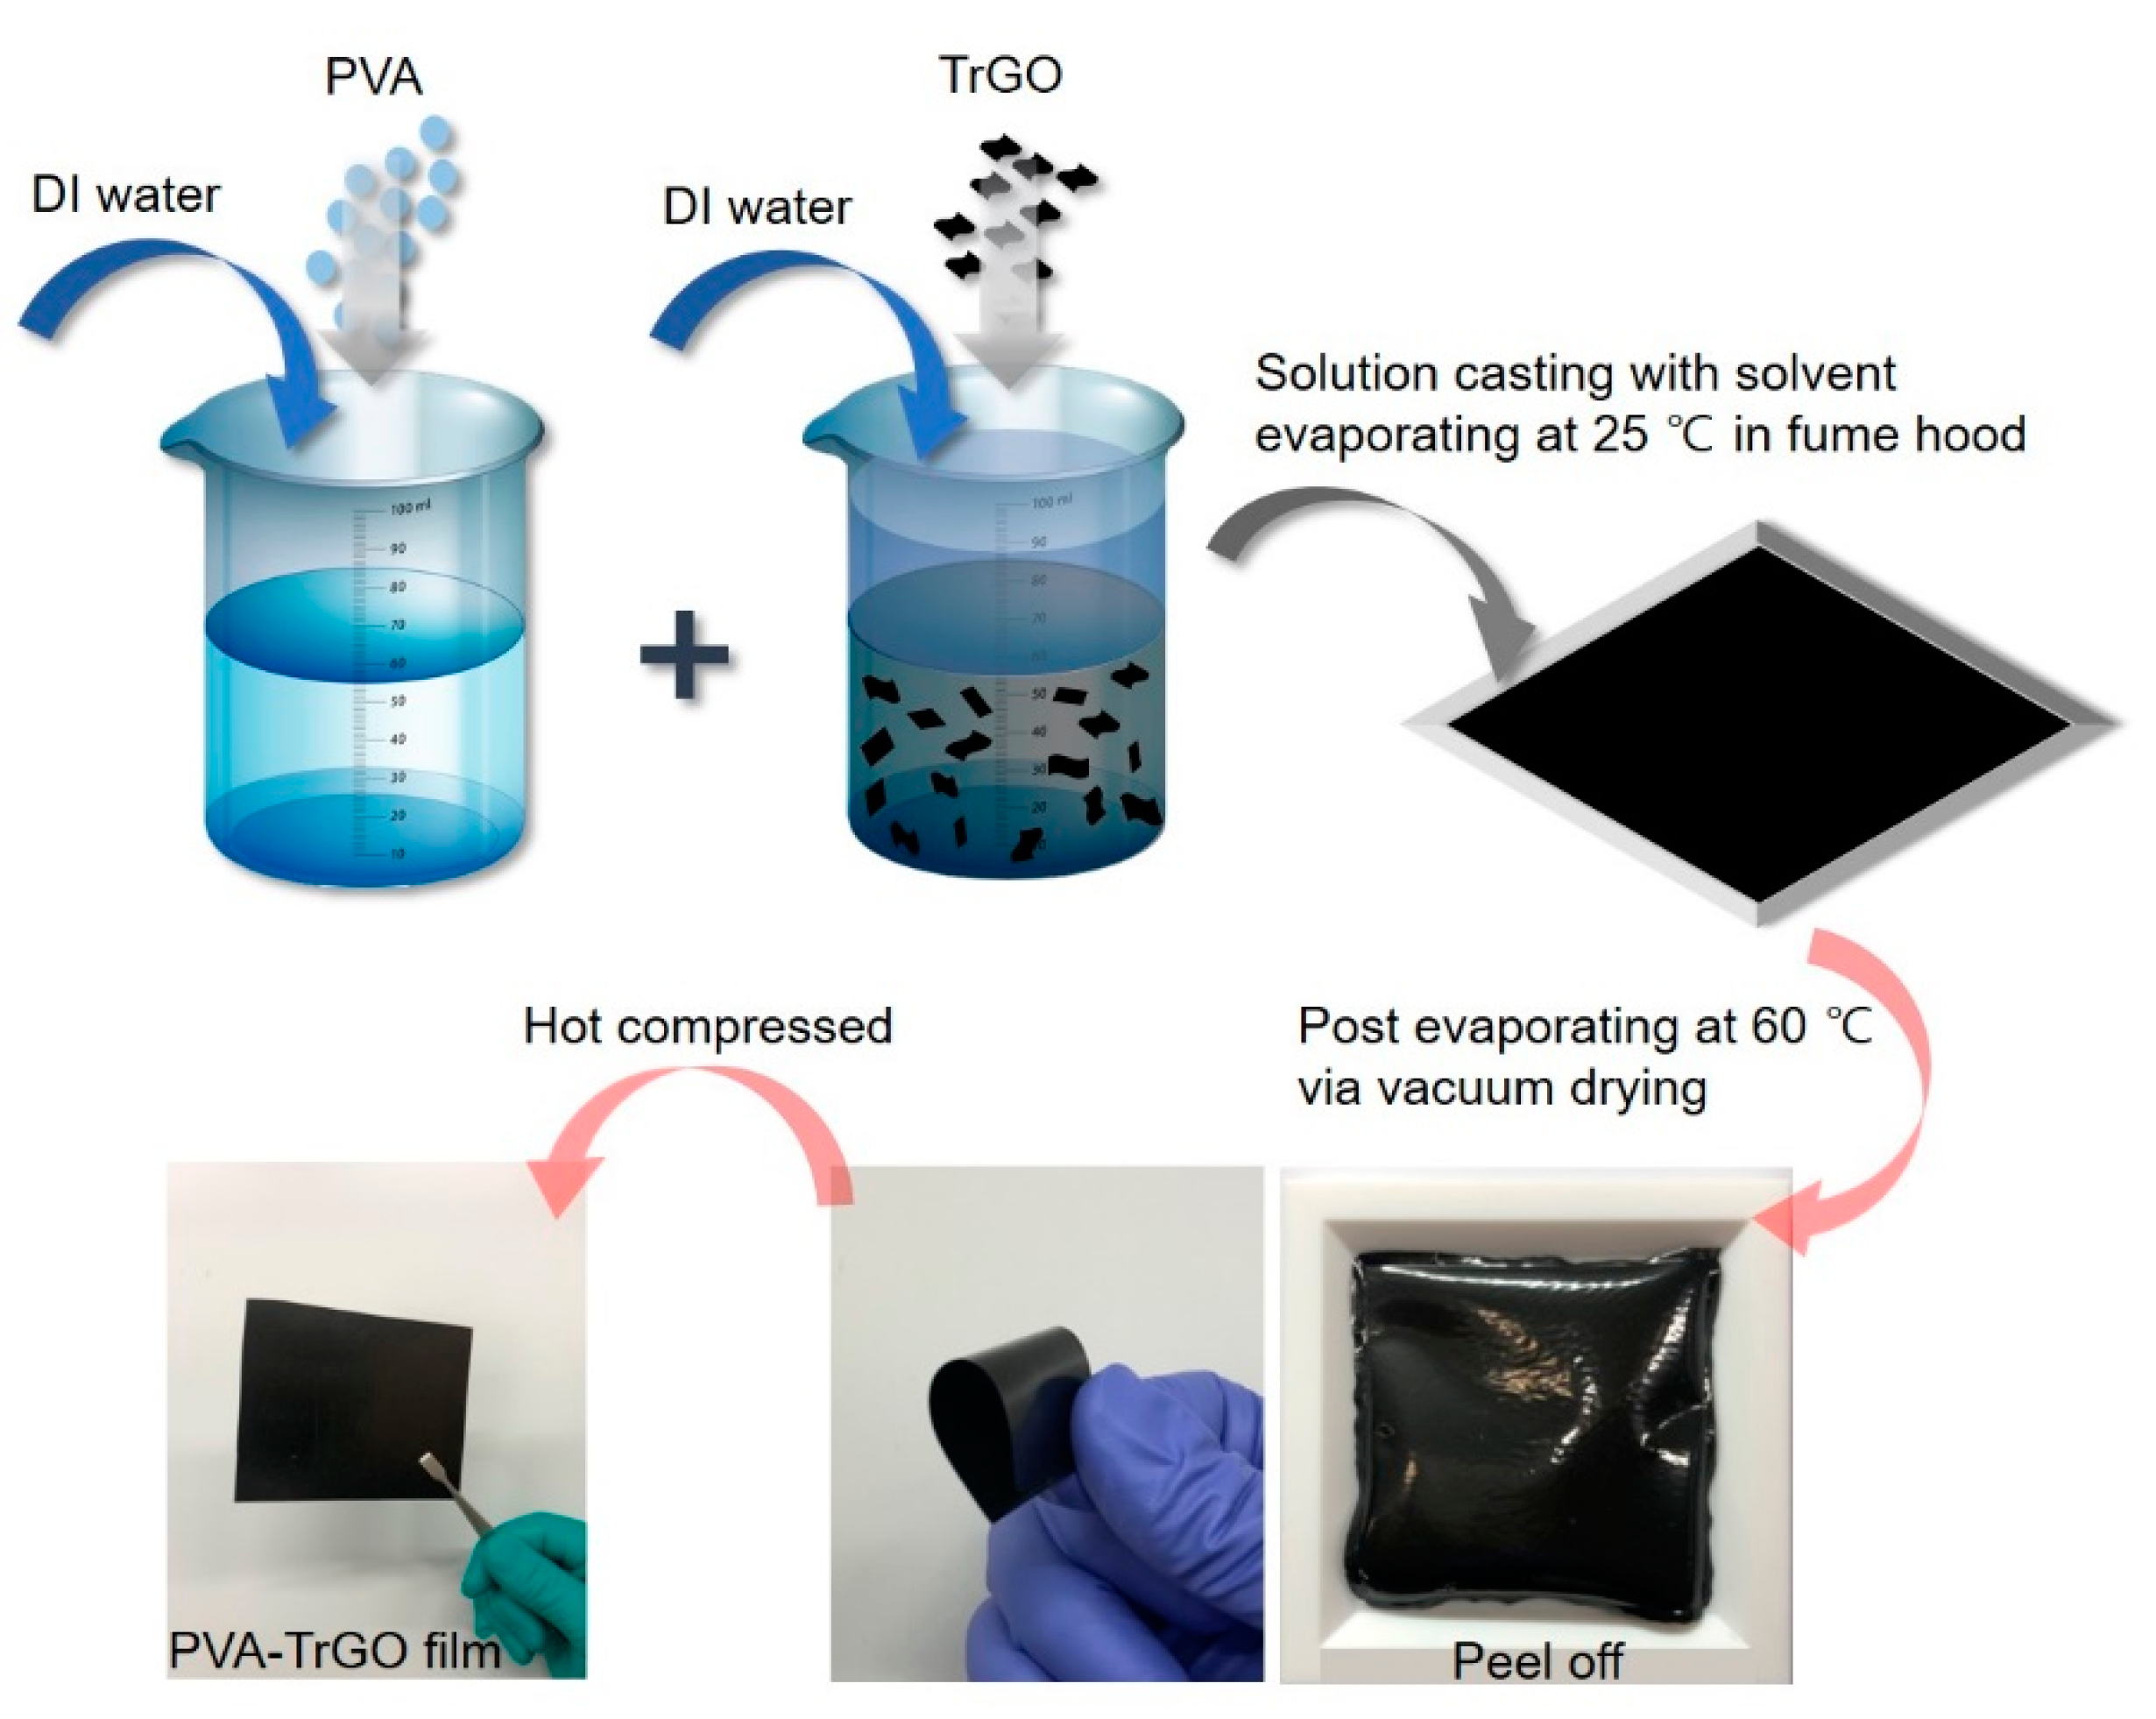
2.2. Fabrication of PVA–TrGO Films
2.3. Characterization
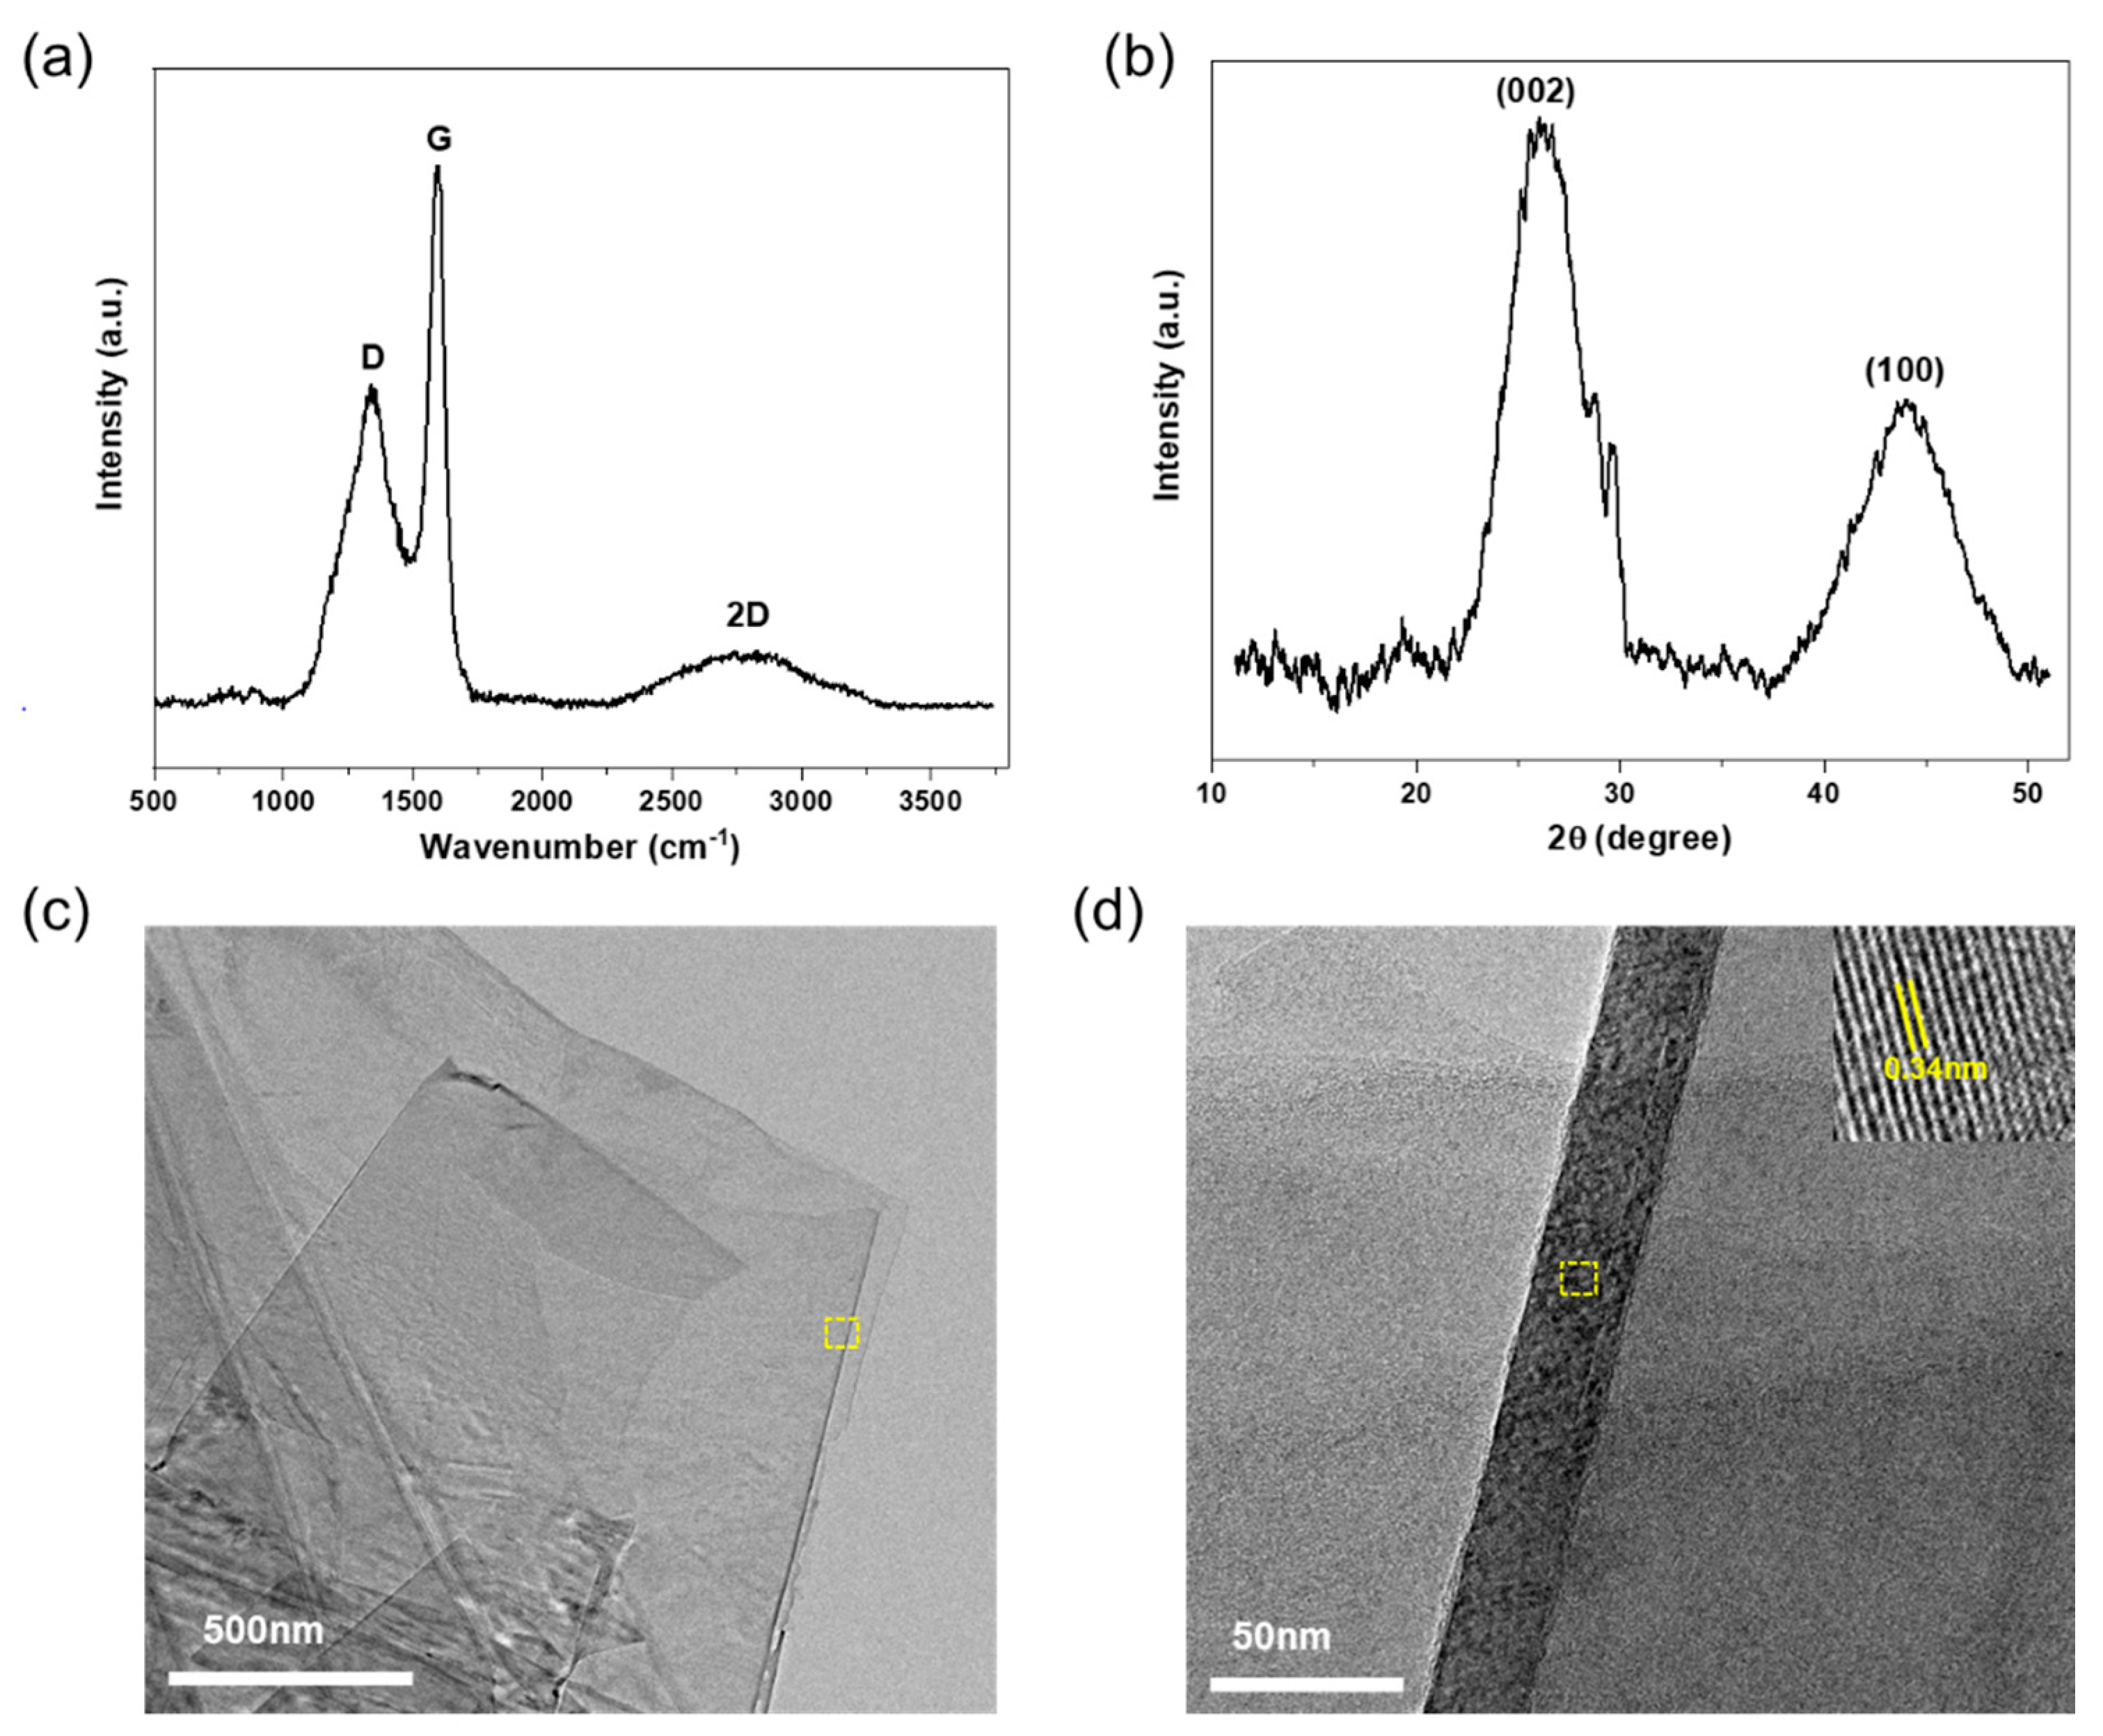
2.3.1. Thermally Reduced Graphene Oxide
2.3.2. PVA–TrGO Nanocomposites
3. Results and Discussion
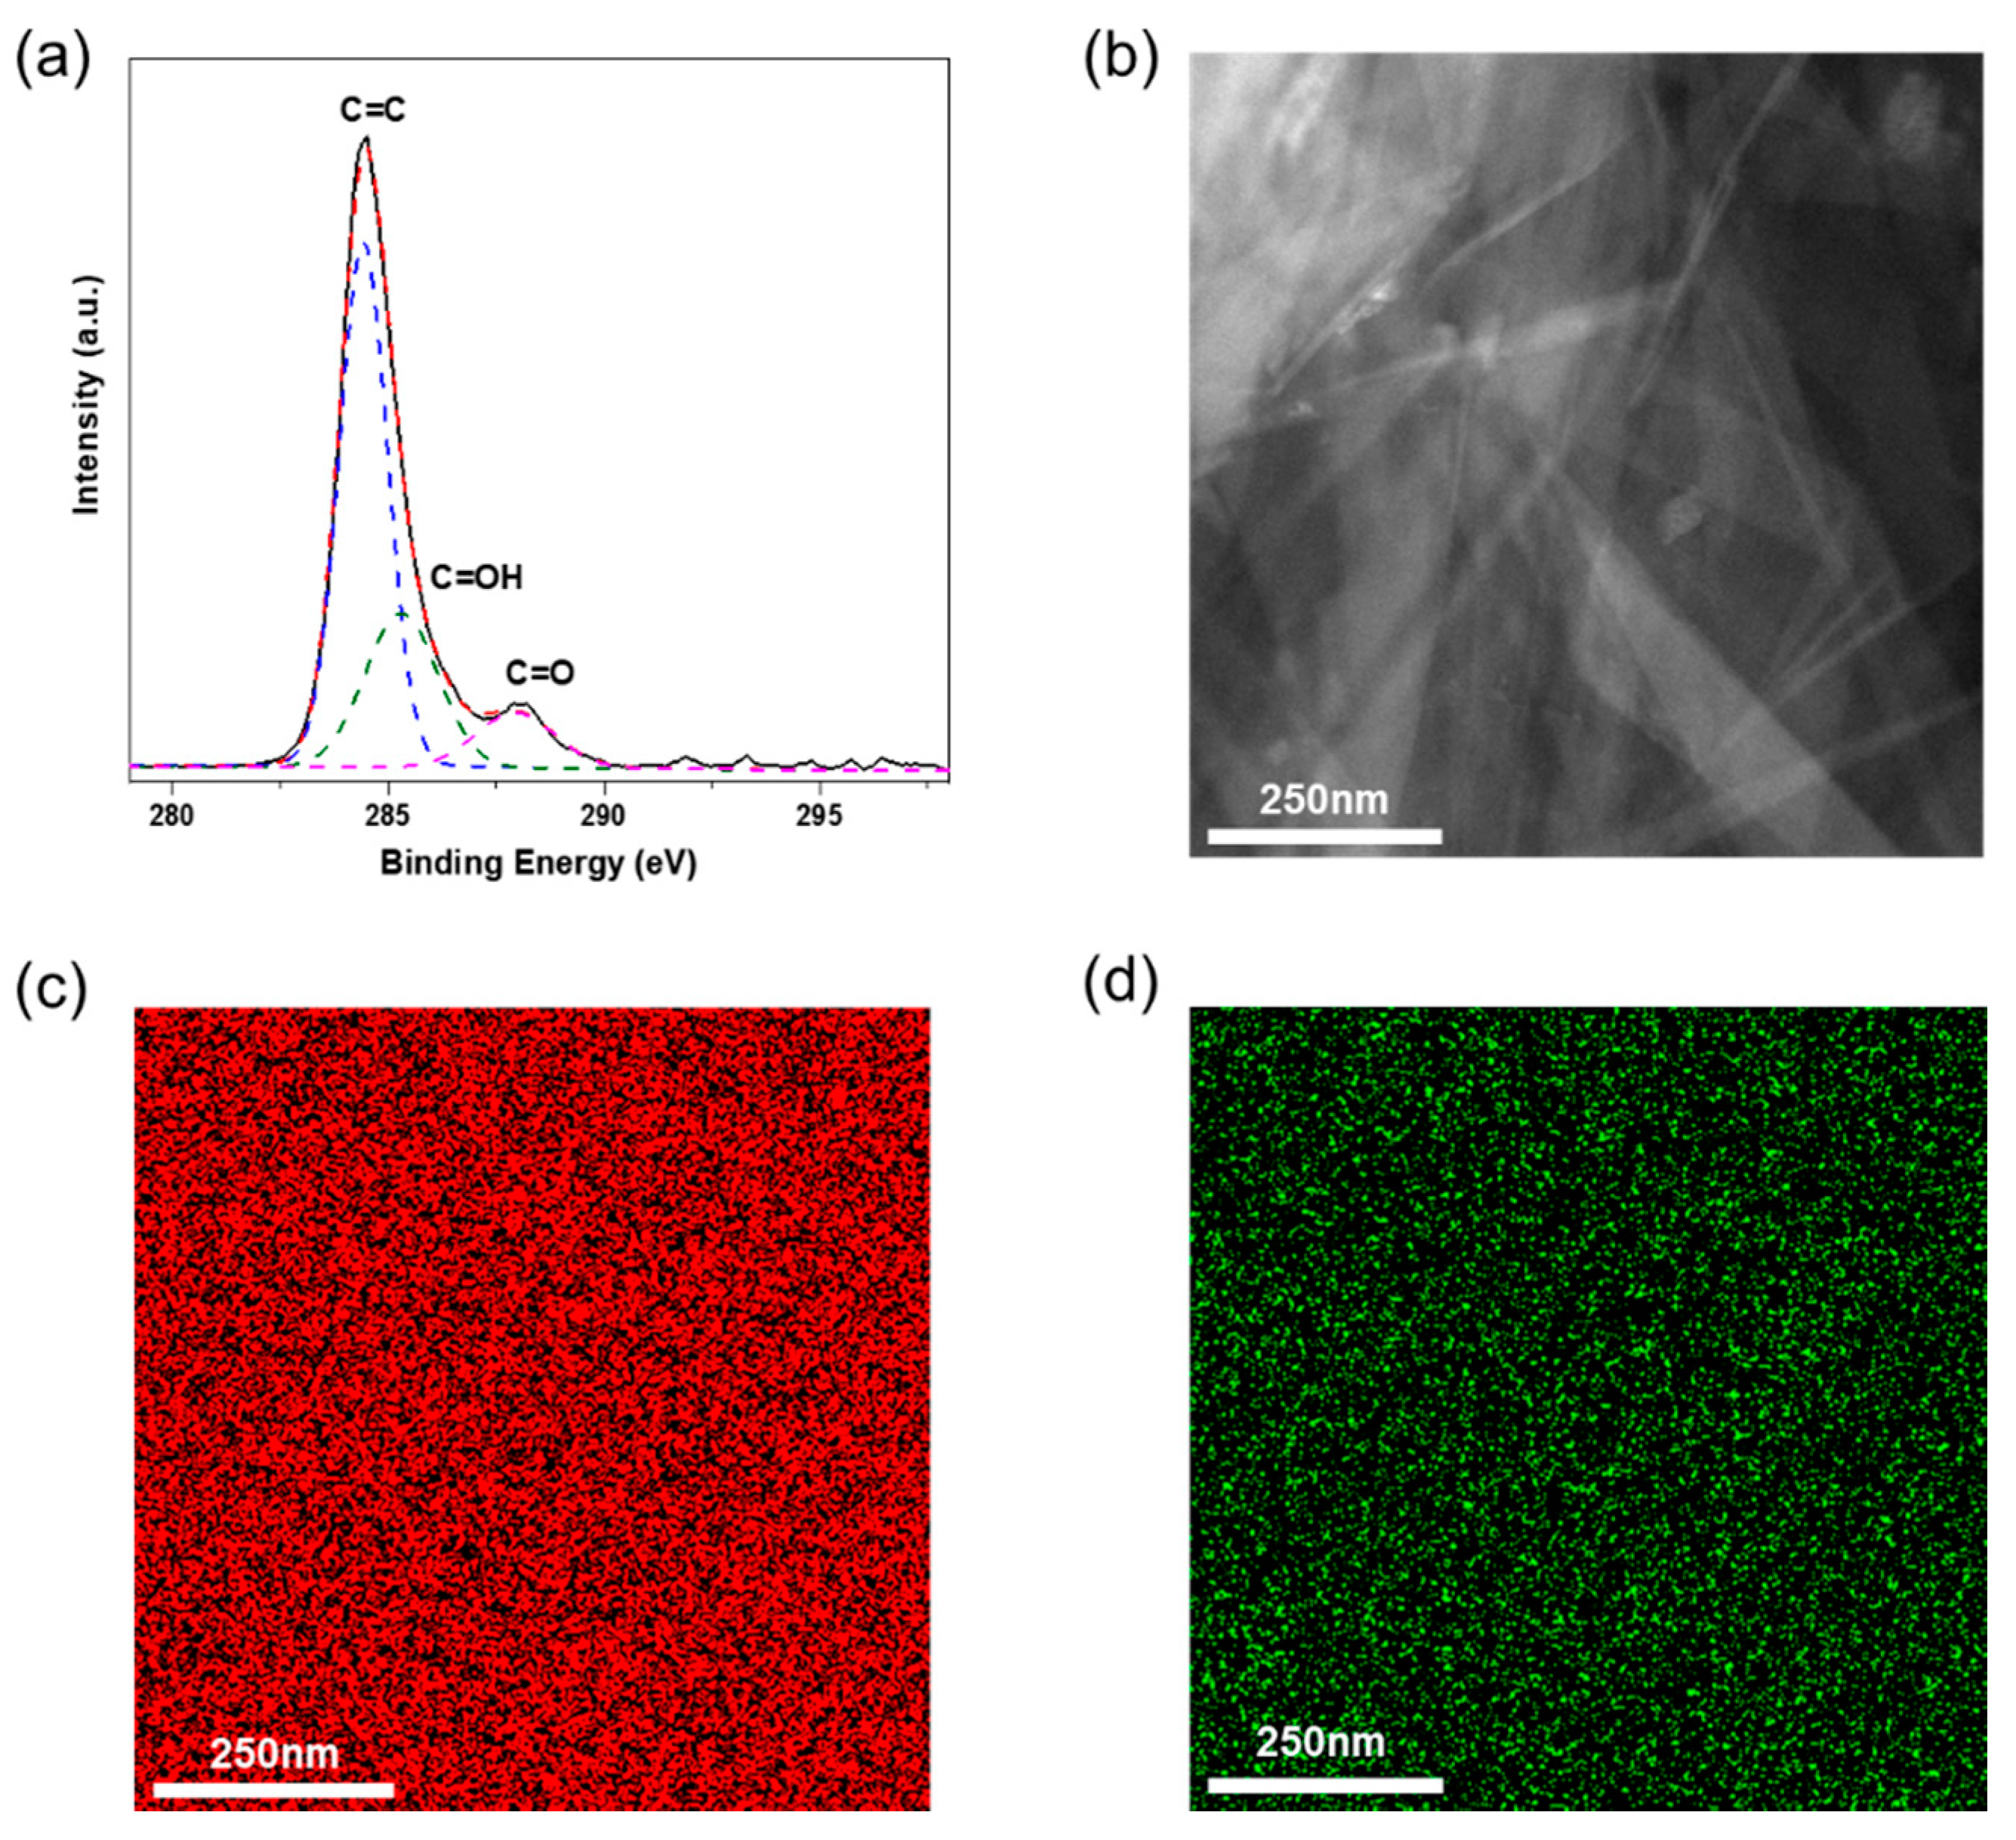
3.1. Structural and Chemical Characterization of Shellac-Derived TrGO
3.2. PVA–TRGO Nanocomposites’ Properties
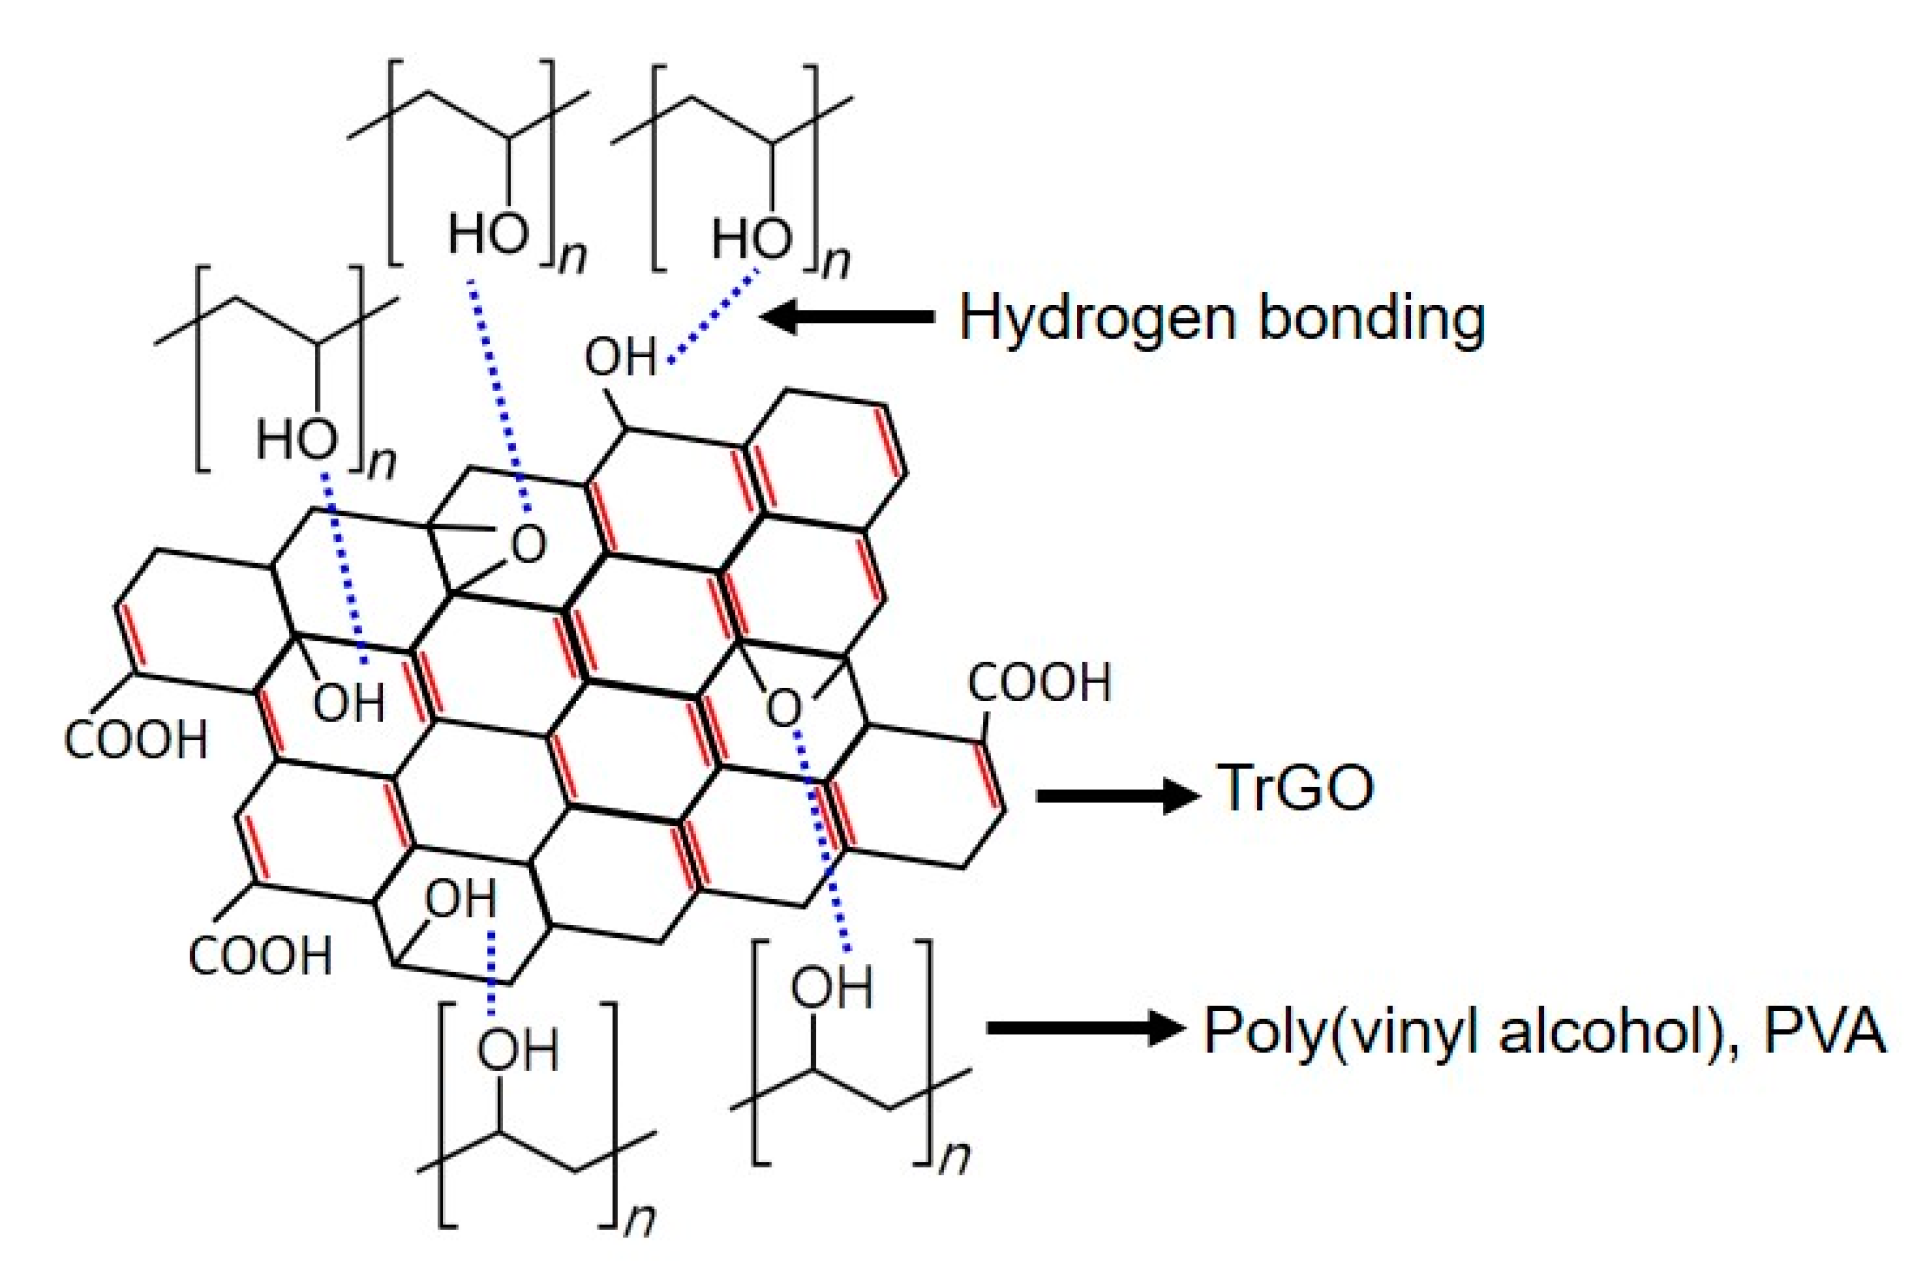
3.2.1. Structural Analysis
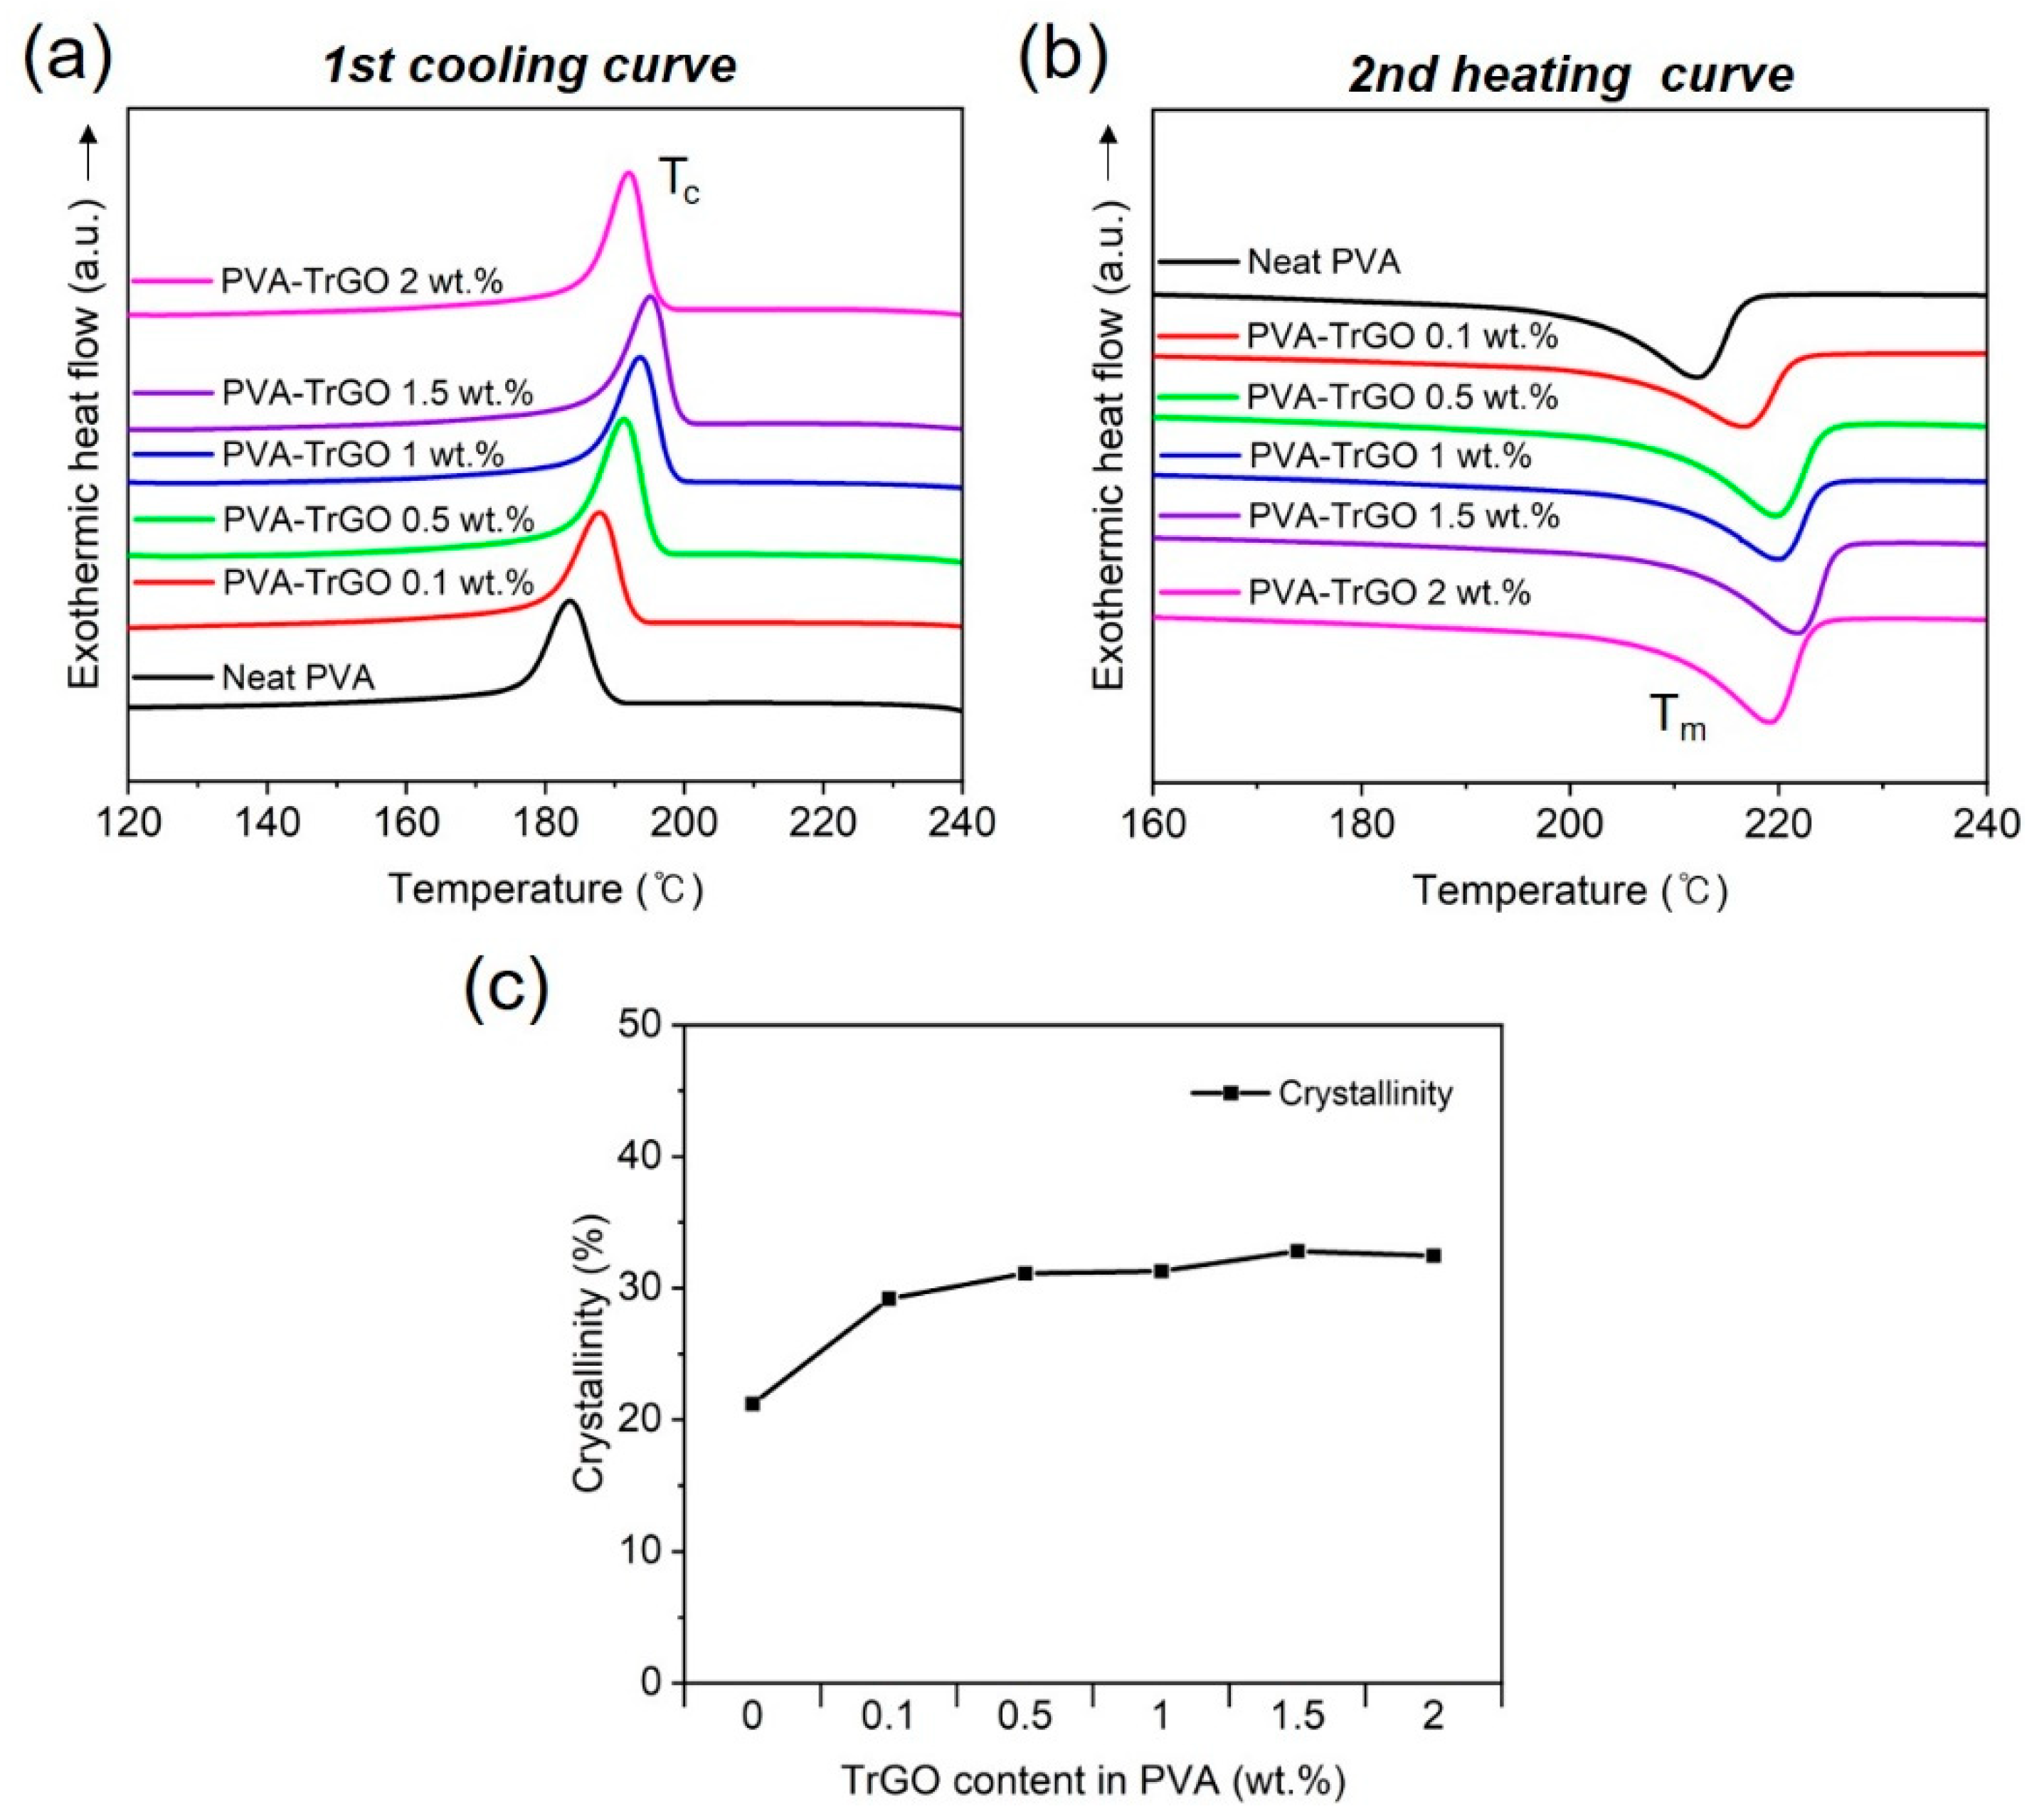
3.2.2. Thermal Properties
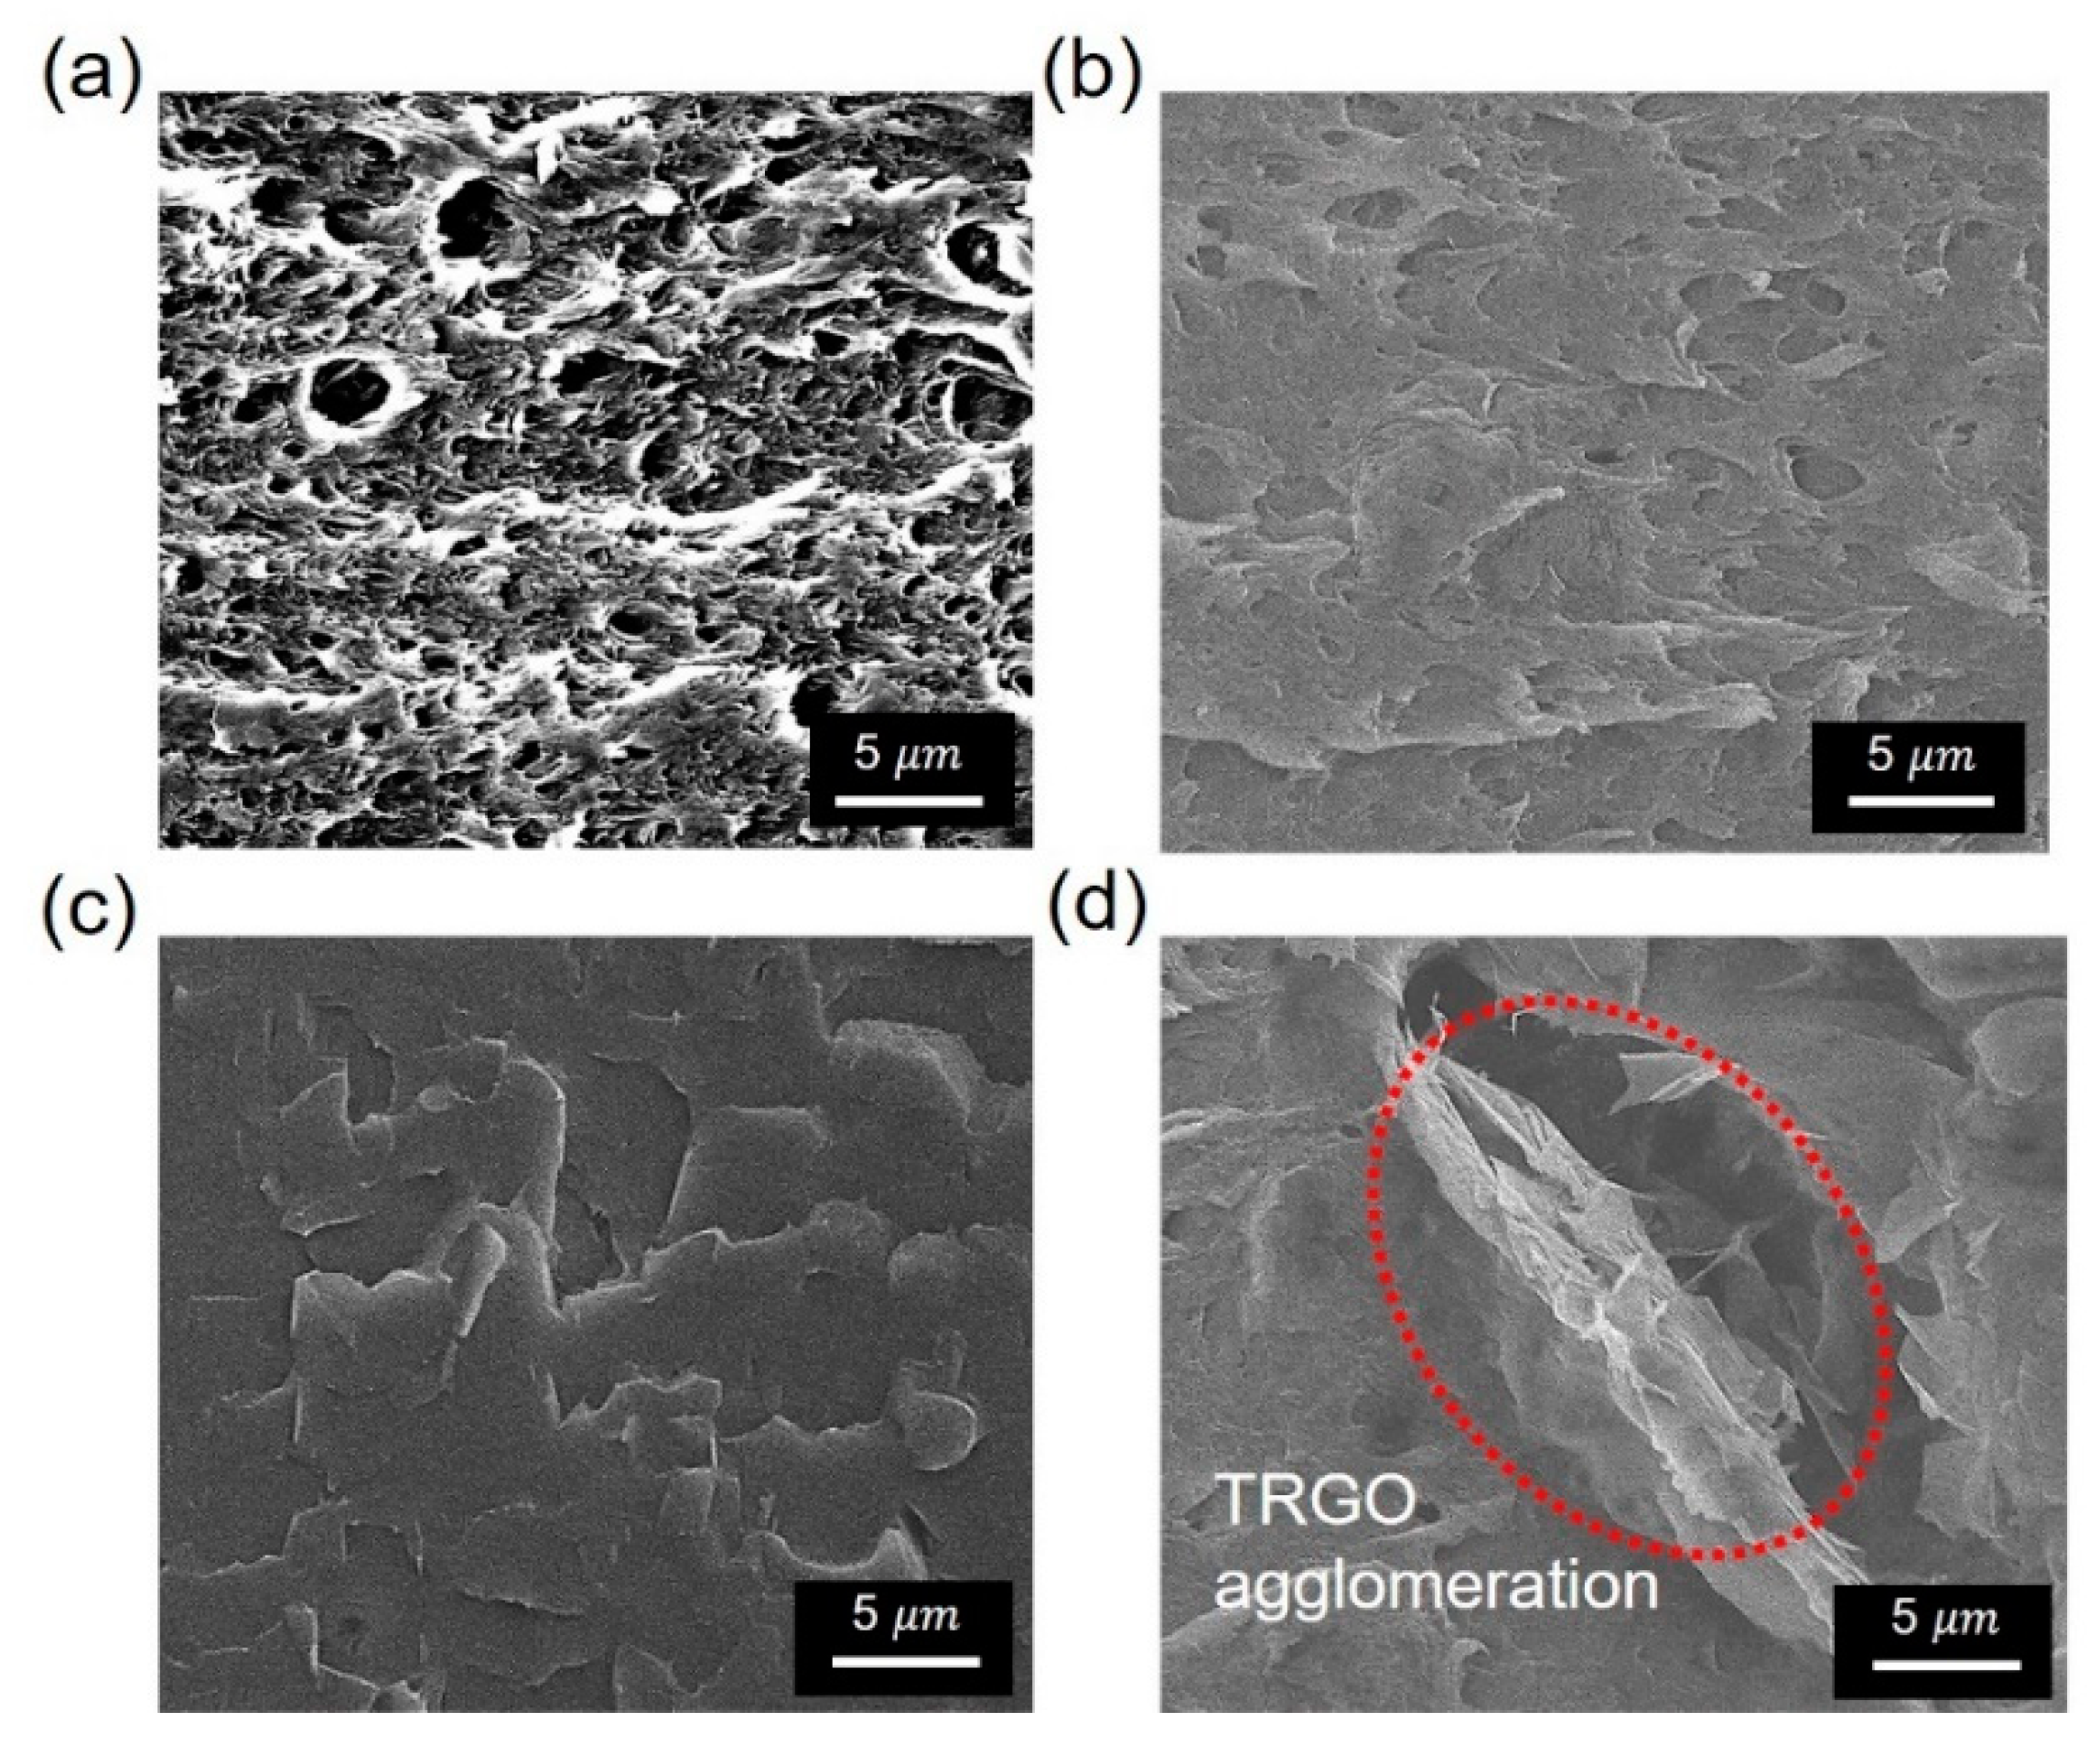
3.2.3. Morphology
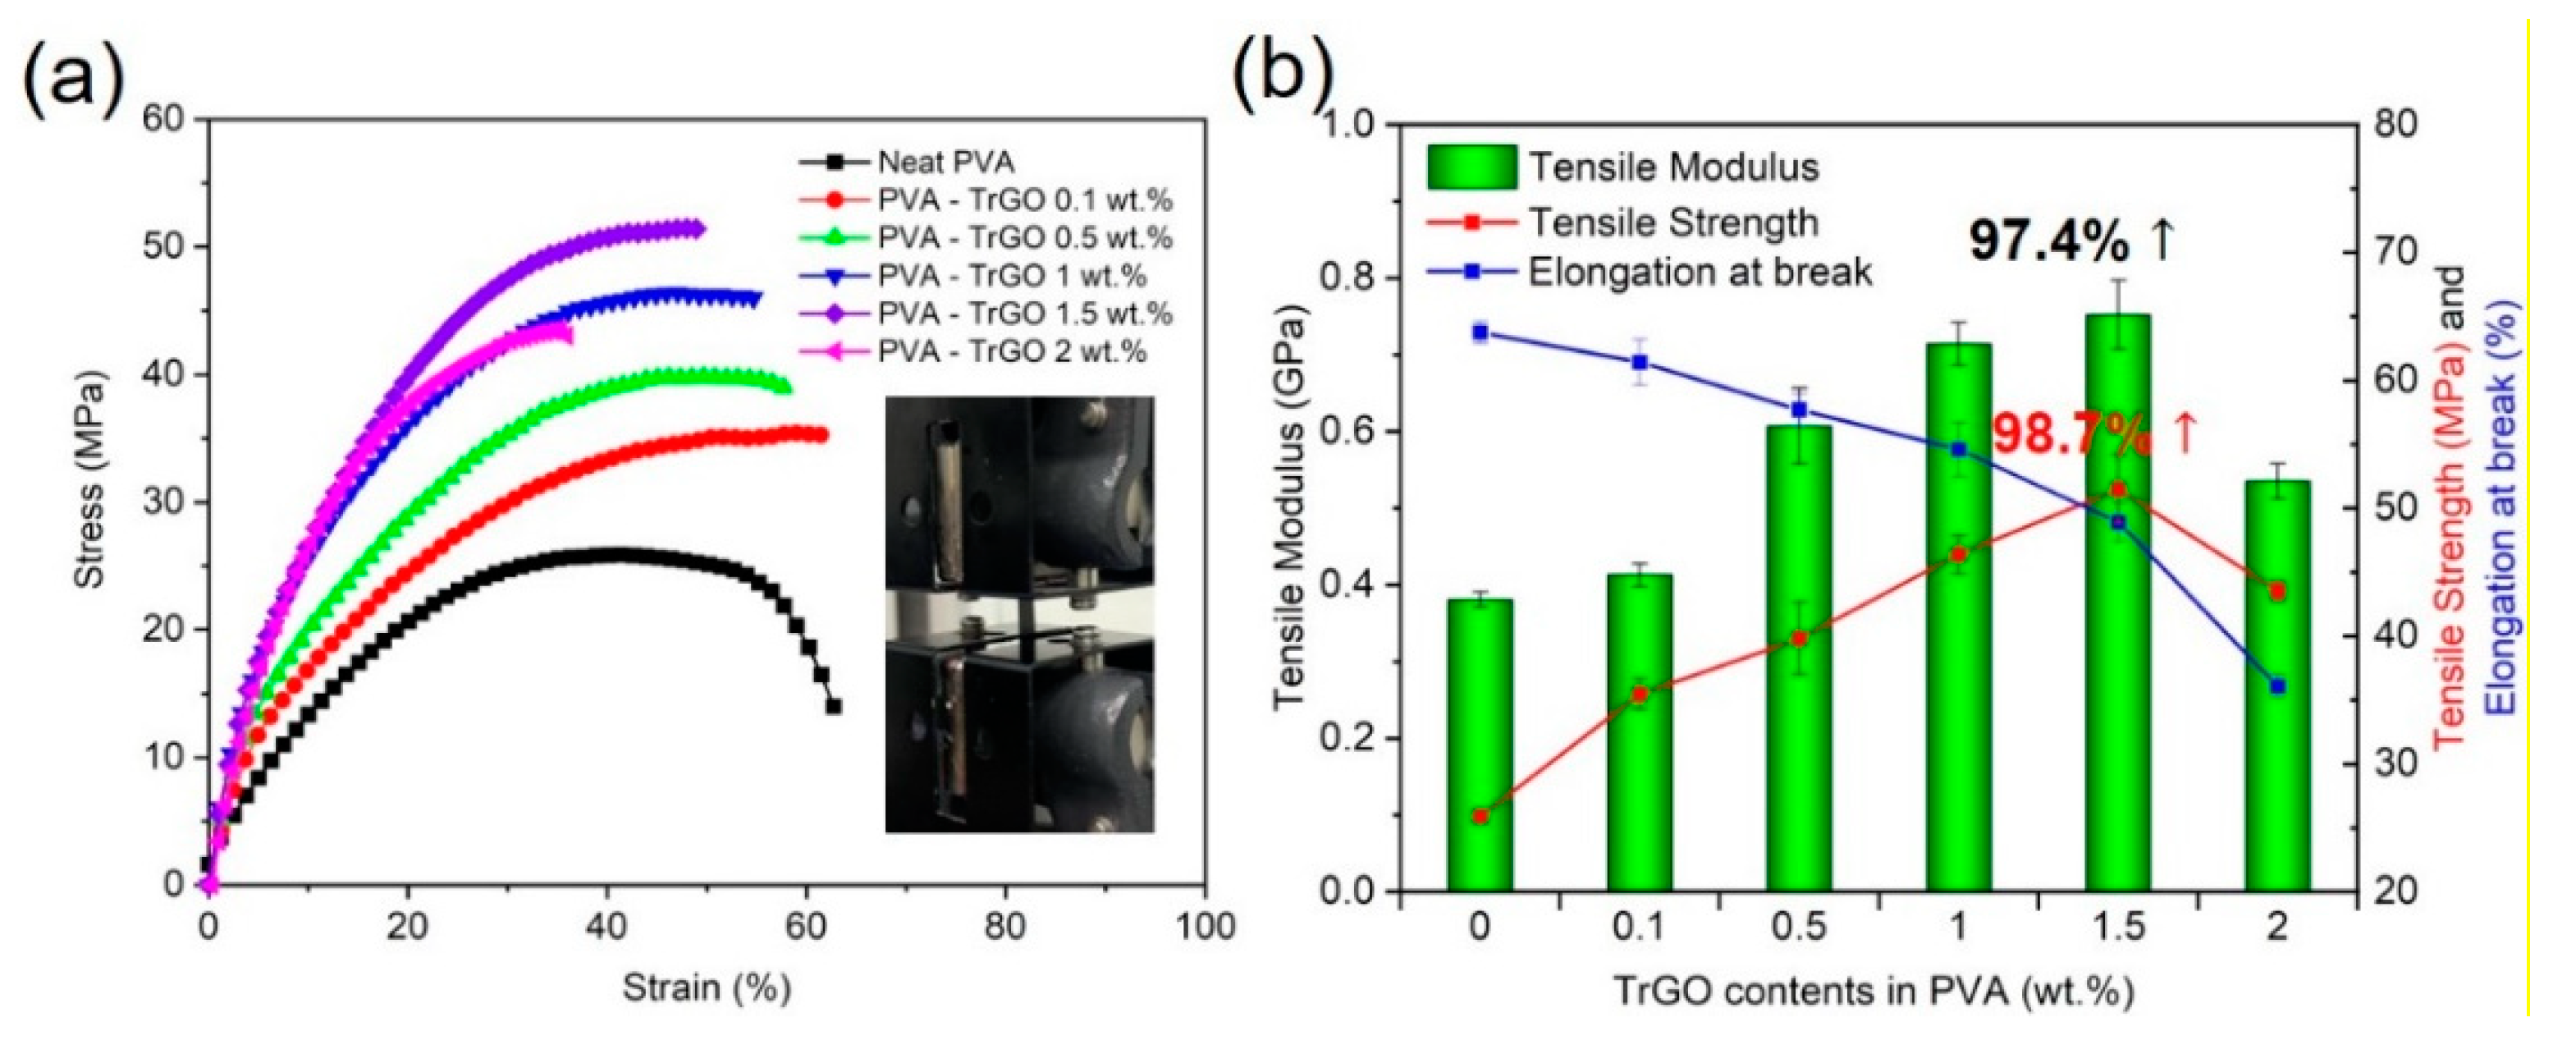
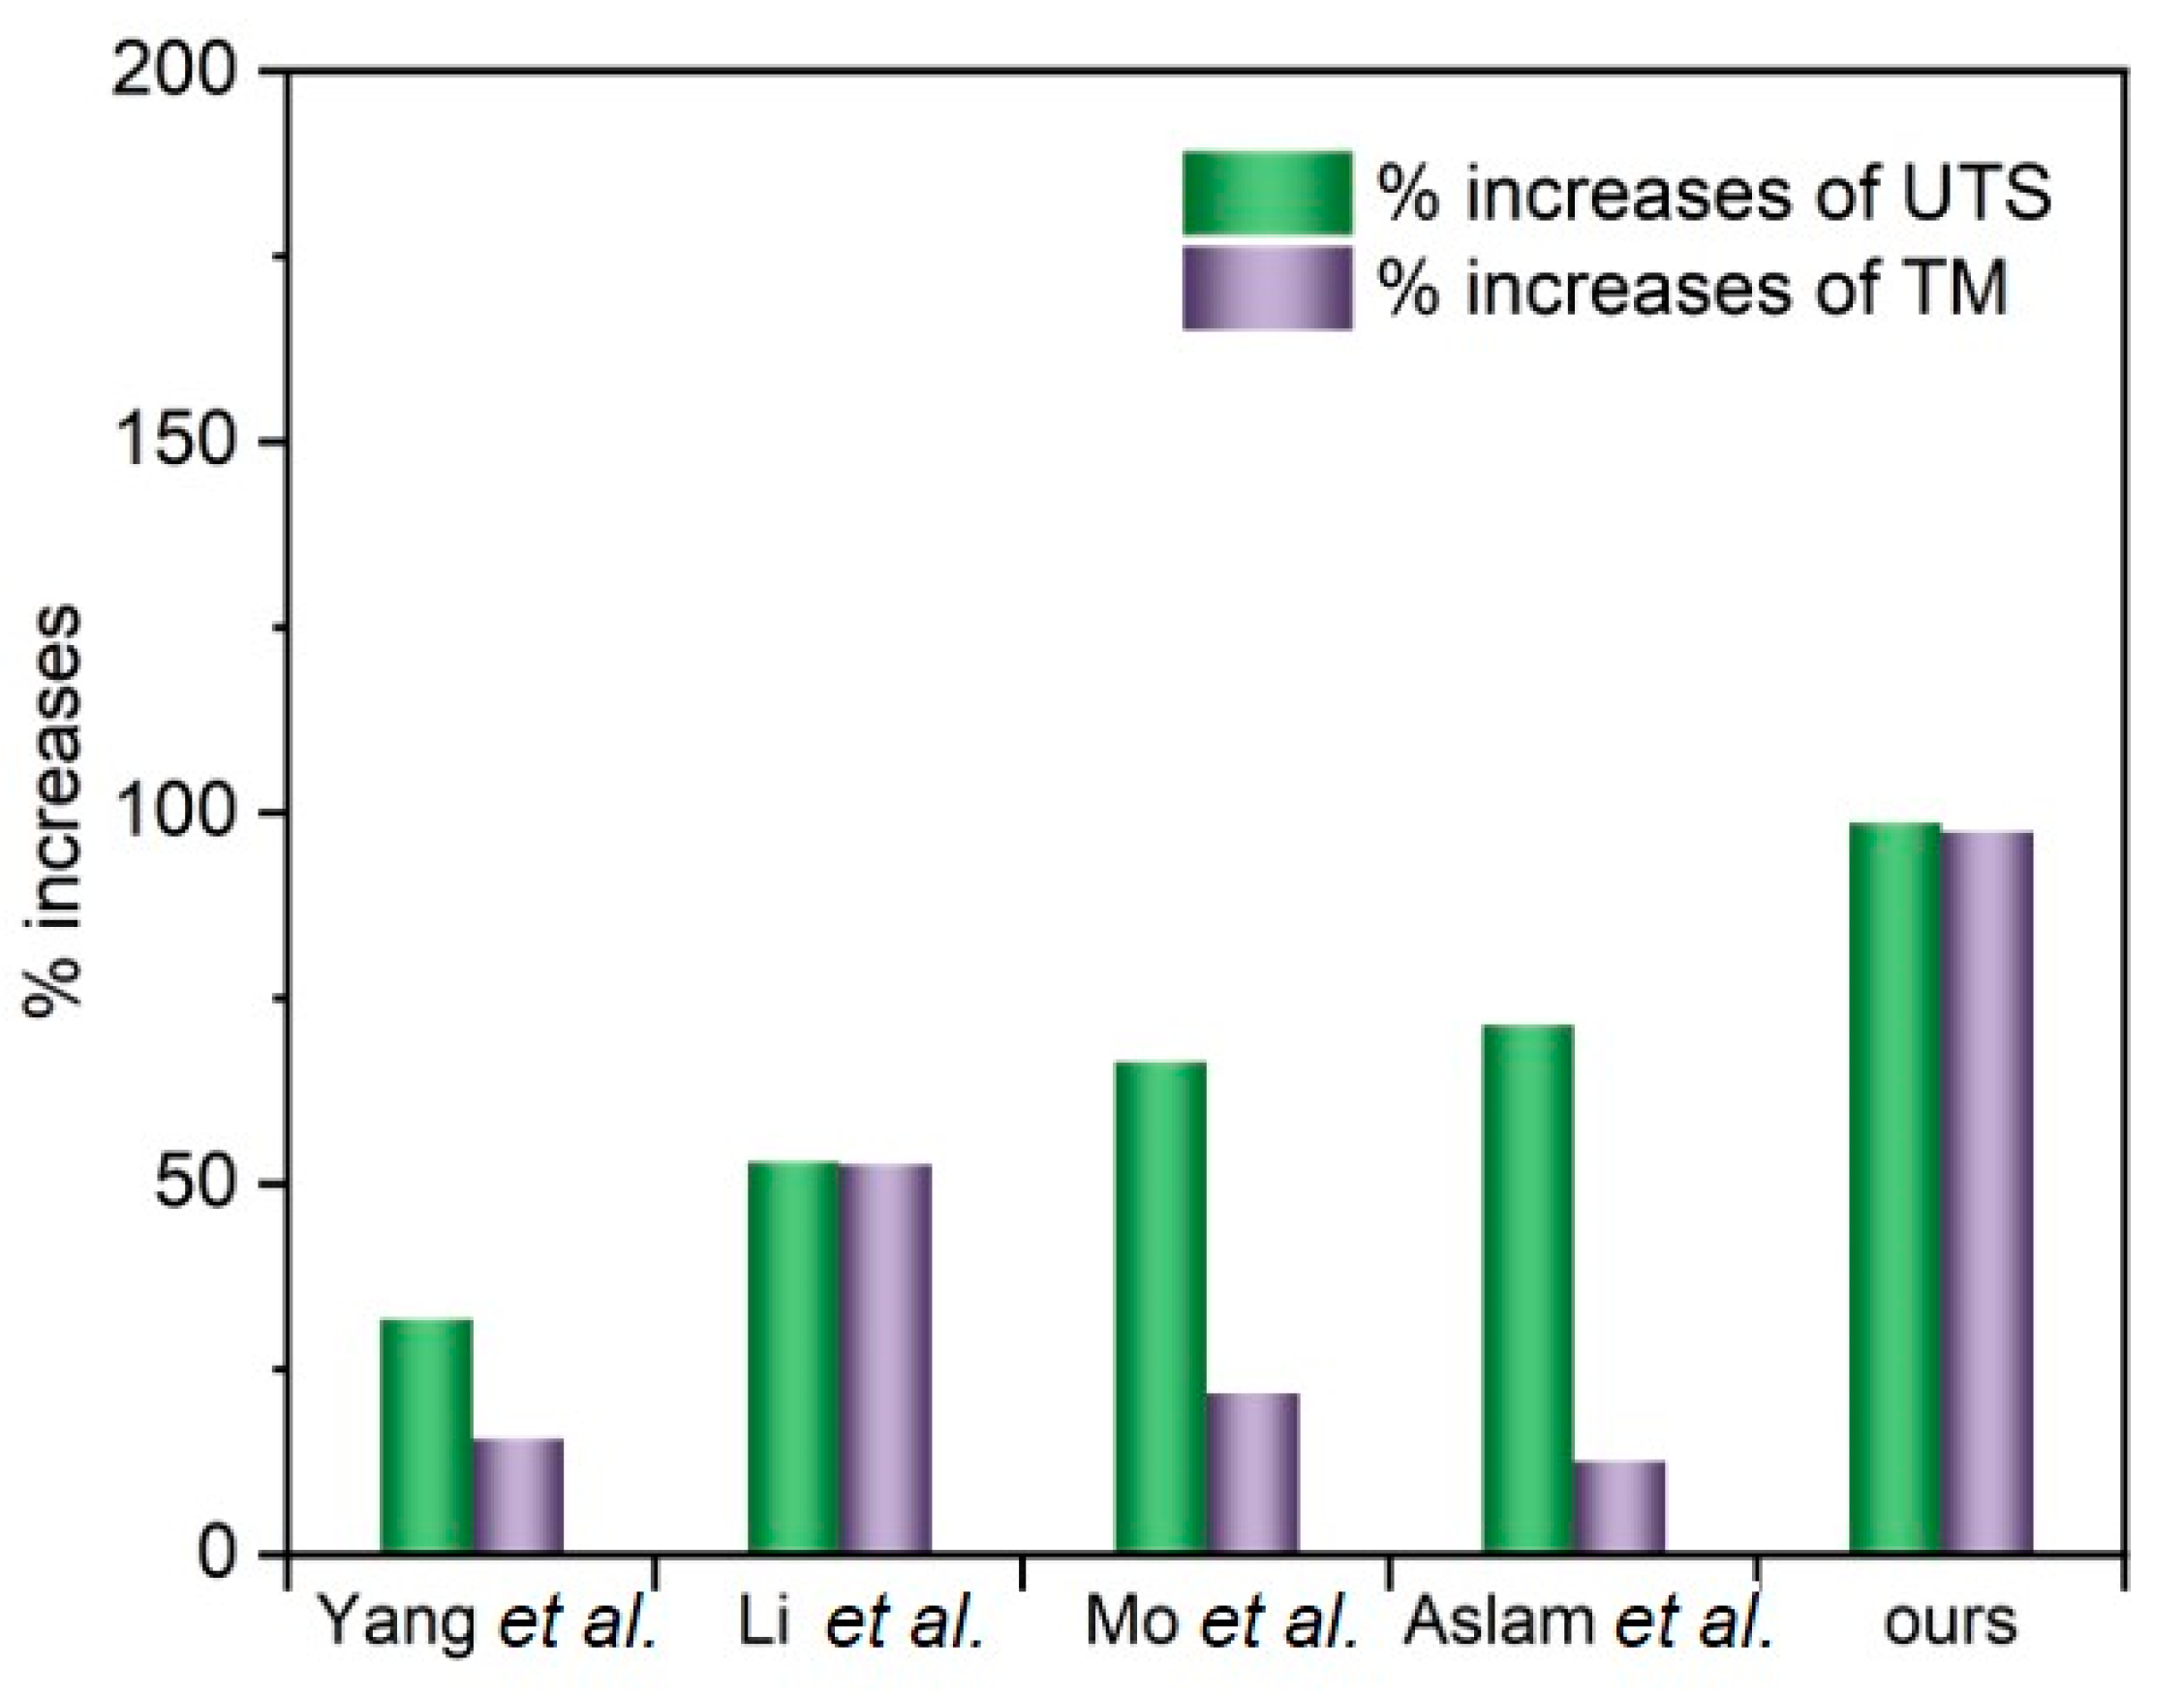
3.2.4. Mechanical Properties
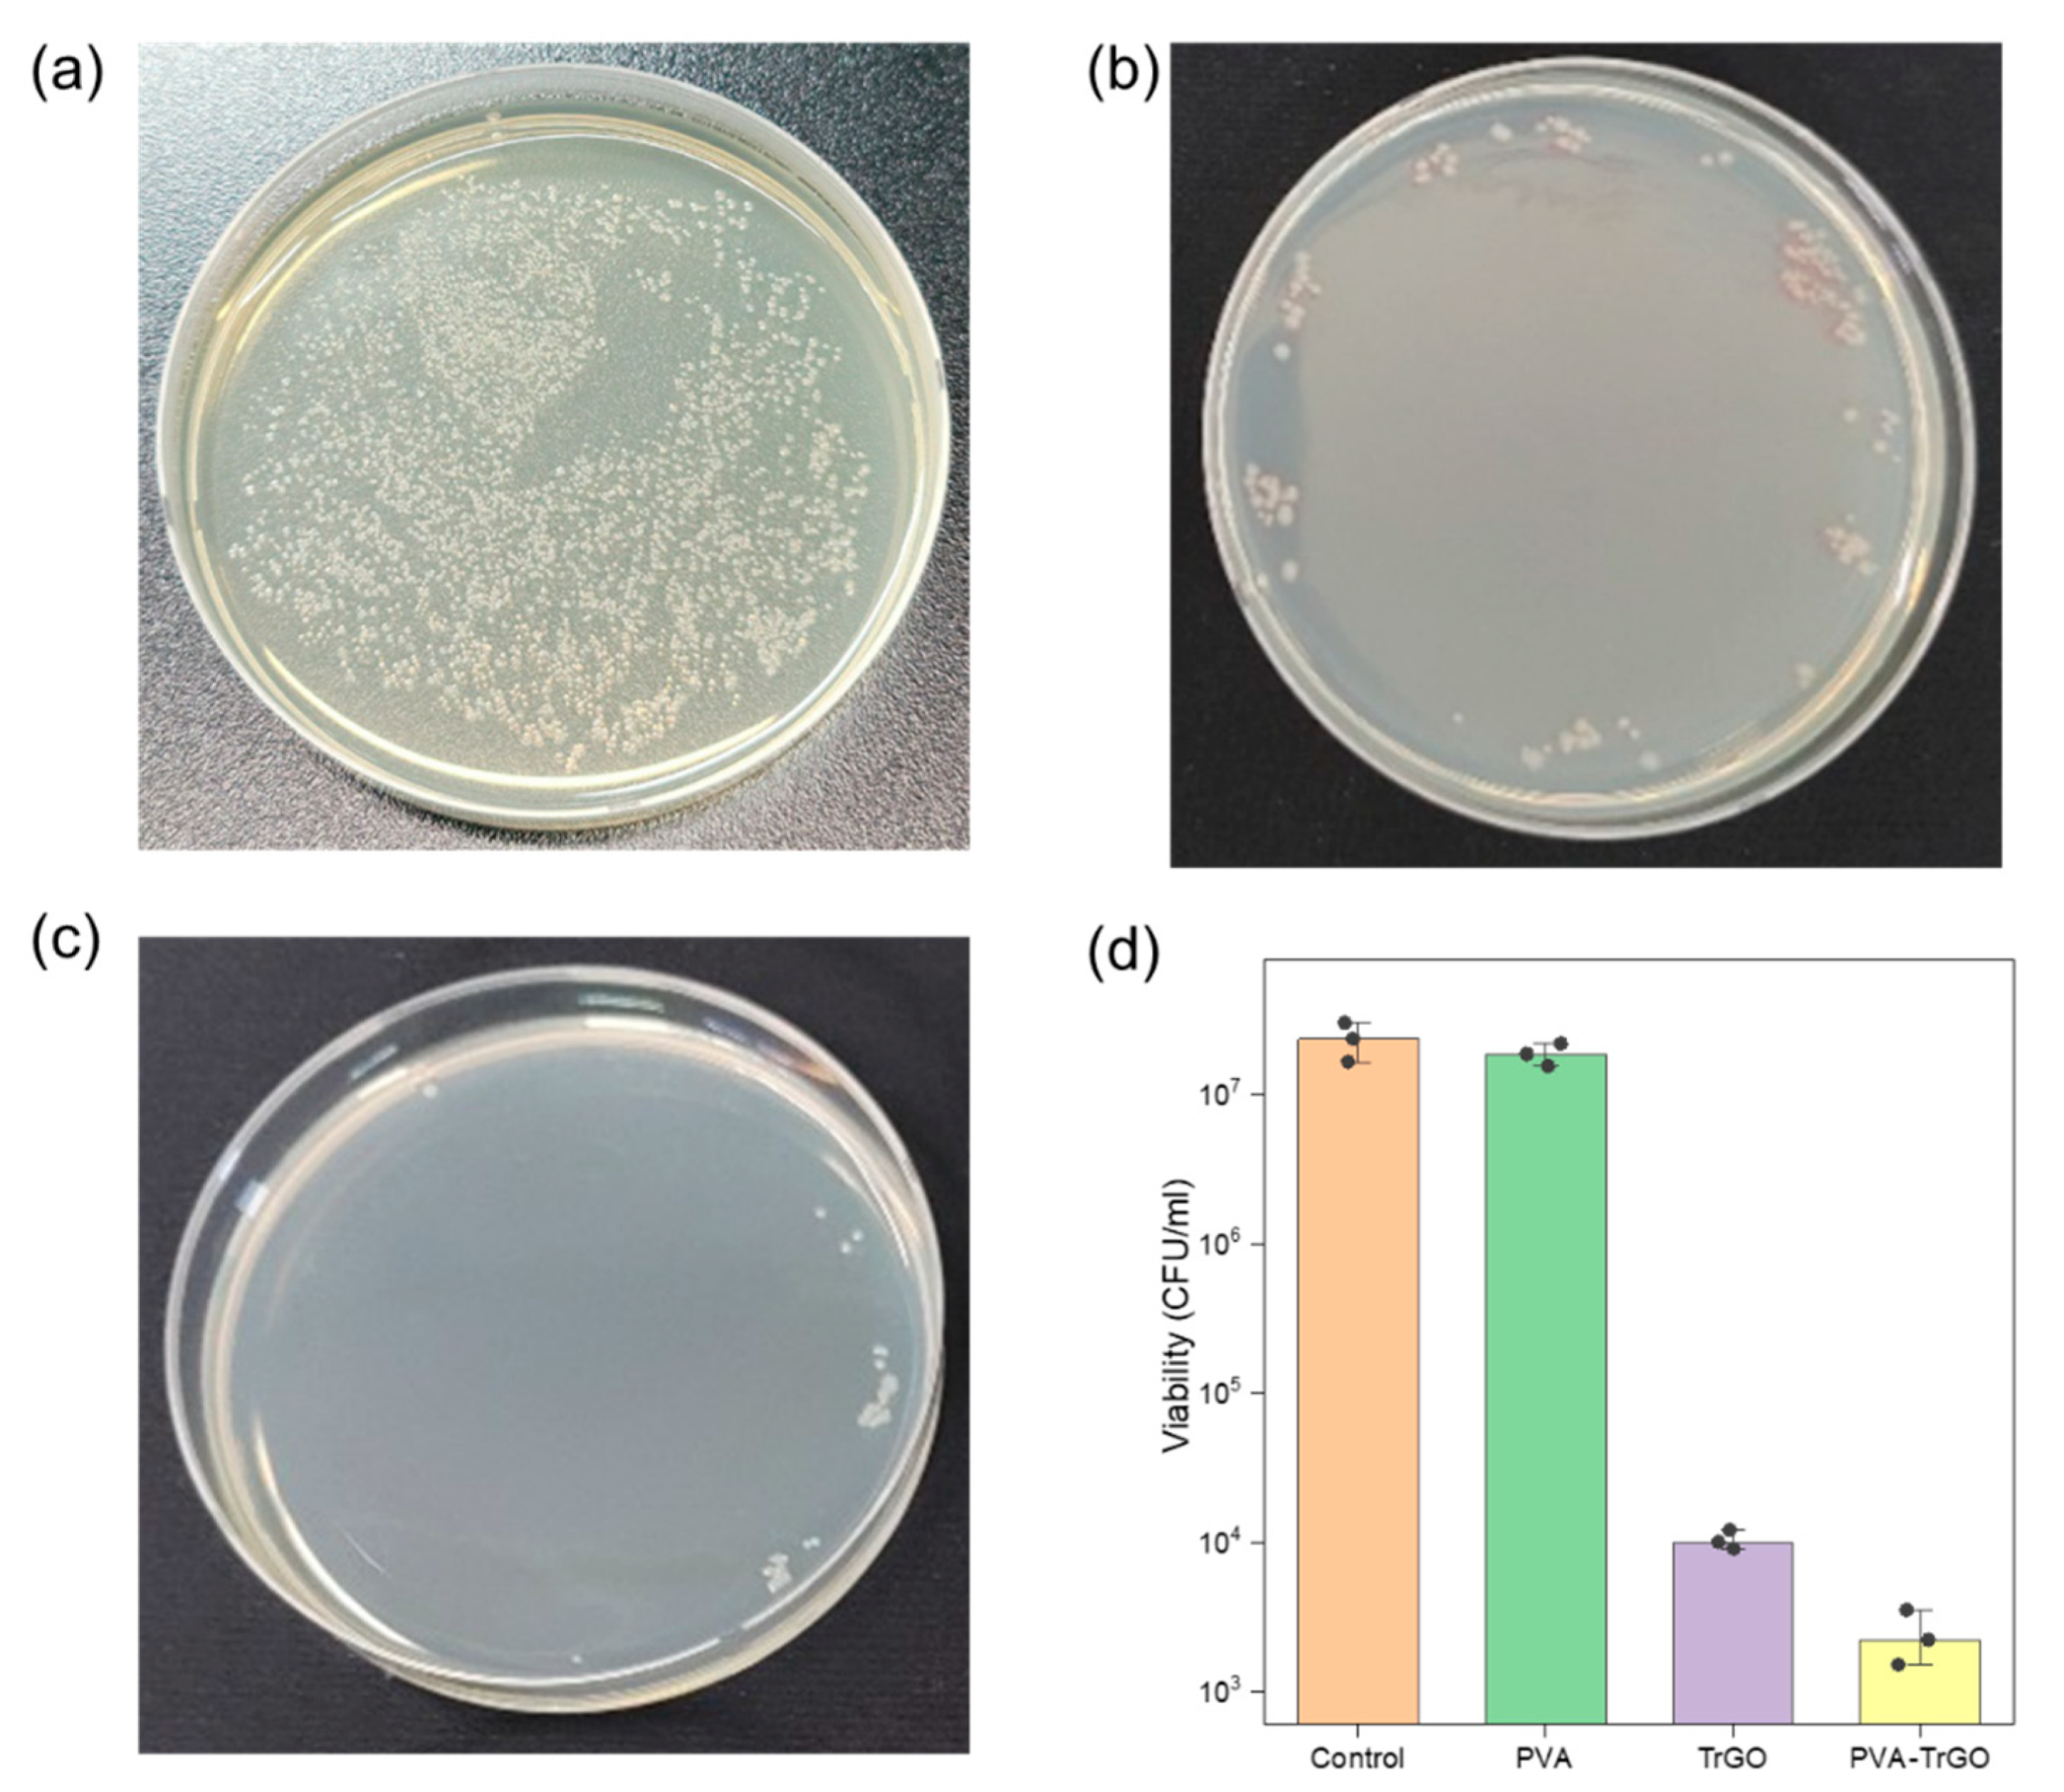
3.2.5. Antibacterial Activity
4. Conclusions
Supplementary Materials
Author Contributions
Funding
Institutional Review Board Statement
Informed Consent Statement
Data Availability Statement
Conflicts of Interest
References
- Hwang, S.H.; Kang, D.; Ruoff, R.S.; Shin, H.S.; Park, Y.B. Poly(vinyl alcohol) Reinforced and Toughenedwith Poly(dopamine)-Treated Graphene Oxide, and Its Use for Humidity Sensing. ACS Nano 2014, 8, 6739–6747. [Google Scholar] [CrossRef]
- Kashyap, S.; Pratihar, S.K.; Behera, S.K. Strong and ductile graphene oxide reinforced PVA nanocomposites. J. Alloys Compd. 2016, 684, 254–260. [Google Scholar] [CrossRef]
- Zhou, K.; Gui, Z.; Hu, Y. Facile synthesis of LDH nanoplates as reinforcing agents in PVA nanocomposites. Polym. Adv. Technol. 2017, 28, 386–392. [Google Scholar] [CrossRef]
- Yahia, I.S.; Mohammed, M.I. Facile synthesis of graphene oxide/PVA nanocomposites for laser optical limiting: Band gap analysis and dielectric constants. J. Mater. Sci. Mater. Electron. 2018, 29, 8555–8563. [Google Scholar] [CrossRef]
- Huang, D.; Wang, A. Non-covalently functionalized multiwalled carbon nanotubes by chitosan and their synergistic reinforcing effects in PVA films. RSC Adv. 2013, 3, 1210–1216. [Google Scholar] [CrossRef]
- He, Y.; Wang, X.; Wu, D.; Gong, Q.; Qiu, H.; Liu, Y.; Wu, T.; Ma, J.; Gao, J. Biodegradable amylose films reinforced by graphene oxide and polyvinyl alcohol. Mater. Chem. Phys. 2013, 142, 1–11. [Google Scholar] [CrossRef]
- Ha, H.O.; Kim, D.S. Stability Change of Poly(vinyl alcohol)-Iodine Complexes Due to Moisture Absorption. Polym. Korea 2017, 41, 507–513. [Google Scholar] [CrossRef]
- Baldino, L.; Aragón, J.; Mendoza, G.; Irusta, S.; Cardea, S.; Reverchon, E. Production, characterization and testing of antibacterial PVA membranes loaded with HA-Ag3PO4 nanoparticles, produced by SC-CO2 phase inversion. J. Chem. Technol. Biotechnol. 2019, 94, 98–108. [Google Scholar] [CrossRef]
- Wang, Z.; Zhao, S.; Hong, L.; Huang, J. Preparation and Properties of Silver-Based Cellulose/Polyvinyl Alcohol Antibacterial Materials. J. Inorg. Organomet. Polym. Mater. 2020, 30, 4382–4393. [Google Scholar] [CrossRef]
- Borriello, C.; Maria, A.D.; Jovic, N.; Montone, A.; Schwarz, M.; Antisari, M.V. Mechanochemical Exfoliation of Graphite and Its Polyvinyl Alcohol Nanocomposites with Enhanced Barrier Properties. Mater. Manuf. Process. 2009, 24, 1053–1057. [Google Scholar] [CrossRef]
- Chuang, W.Y.; Young, T.H.; Chiu, W.Y.; Lin, C.Y. The effect of polymer additives on the structure and permeability of poly(vinyl alcohol) asymmetric membranes. Polymer 2000, 41, 5633–5641. [Google Scholar] [CrossRef]
- Bernard, J.; Favier, A.; Davis, T.P.; Kowollik, C.B.; Stenzel, M.H. Synthesis of poly(vinyl alcohol) combs via MADIX/RAFT polymerization. Polymer 2006, 47, 1073–1080. [Google Scholar] [CrossRef]
- Patro, T.U.; Wagner, H.D. Layer-by-layer assembled PVA/Laponite multilayer free-standing films and their mechanical and thermal properties. Nanotechnology 2011, 22, 455706. [Google Scholar] [CrossRef]
- Zhang, T.L.X.; Sreekumar, T.V.; Kumar, S.; Moore, V.C.; Hauge, R.H.; Smalley, R.E. Poly(vinyl alcohol)/SWNT Composite Film. Nano Lett. 2003, 3, 1285–1288. [Google Scholar] [CrossRef]
- Chen, X. Preparation and property of TiO2 nanoparticle dispersed polyvinyl alcohol composite materials. J. Mater. Sci. Lett. 2002, 21, 1637–1639. [Google Scholar] [CrossRef]
- Stankovich, S.; Dikin, D.A.; Dommett, G.H.; Kohlhaas, K.M.; Zimney, E.J.; Stach, E.A.; Piner, R.D.; Nguyen, S.T.; Ruoff, R.S. Graphene-based composite materials. Nature 2006, 442, 282–286. [Google Scholar] [CrossRef] [PubMed]
- Li, W.C.X.; An, J.; Kim, S.; Nah, J.; Yang, D.; Piner, R.; Velamakanni, A.; Jung, I.; Tutuc, E.; Banerjee, S.K.; et al. Large-Area Synthesis of High-Quality and Uniform Graphene Films on Copper Foils. Science 2009, 324, 4. [Google Scholar] [CrossRef]
- Ji, X.; Xu, Y.; Zhang, W.; Cui, L.; Liu, J. Review of functionalization, structure and properties of graphene/polymer composite fibers. Compos. Part A Appl. Sci. Manuf. 2016, 87, 29–45. [Google Scholar] [CrossRef]
- Han, N.R.; Cho, J.W. Click coupled stitched graphene sheets and their polymer nanocomposites with enhanced photothermal and mechanical properties. Compos. Part A Appl. Sci. Manuf. 2016, 87, 78–85. [Google Scholar] [CrossRef]
- Huang, Y.; Qin, Y.; Zhou, Y.; Niu, H.; Yu, Z.Z.; Dong, J.Y. Polypropylene/Graphene Oxide Nanocomposites Prepared by In Situ Ziegler−Natta Polymerization. Chem. Mater. 2010, 22, 4096–4102. [Google Scholar] [CrossRef]
- Tripathi, S.N.; Rao, G.S.S.; Mathur, A.B.; Jasra, R. Polyolefin/graphene nanocomposites: A review. RSC Adv. 2017, 7, 23615–23632. [Google Scholar] [CrossRef]
- Shao, L.; Li, J.; Zhang, Y.; Gong, S.; Zhang, H.; Wang, Y. The effect of the reduction extent on the performance of graphene/poly(vinyl alcohol) composites. J. Mater. Chem. A 2014, 34, 14173–14180. [Google Scholar] [CrossRef]
- Bao, C.; Guo, Y.; Song, L.; Hu, Y. Poly(vinyl alcohol) nanocomposites based on graphene and graphite oxide: A comparative investigation of property and mechanism. J. Mater. Chem. 2011, 21, 13942–13950. [Google Scholar] [CrossRef]
- Vladu, M.I.; Głowacki, E.D.; Schwabegger, G.; Leonat, L.; Akpinar, H.Z.; Sitter, H.; Bauer, S.; Sariciftci, N.S. Natural resin shellac as a substrate and a dielectric layer for organic field-effect transistors. Green Chem. 2013, 15, 1473–1476. [Google Scholar] [CrossRef]
- Baek, S.W.; Ha, J.W.; Yoon, M.; Hwang, D.H.; Lee, J. Shellac Films as a Natural Dielectric Layer for Enhanced Electron Transport in Polymer Field-Effect Transistors. ACS Appl. Mater. Interfaces 2018, 10, 18948–18955. [Google Scholar] [CrossRef]
- Byun, S.J.; Lim, H.; Shin, G.Y.; Han, T.H.; Oh, S.H.; Ahn, J.H.; Choi, H.C.; Lee, T.W. Graphenes Converted from Polymers. J. Phys. Chem. Lett. 2011, 2, 493–497. [Google Scholar] [CrossRef]
- Joshi, S.R.; Sharma, A.; Kim, G.H.; Jang, J. Low cost synthesis of reduced graphene oxide using biopolymer for influenza virus sensor. Mater. Sci. Eng. C Mater. Biol. Appl. 2020, 108, 110465. [Google Scholar] [CrossRef]
- Joshi, S.R.; Kim, B.; Kim, S.K.; Song, W.; Park, K.; Kim, G.H.; Shin, H. Low-Cost and Fast-Response Resistive Humidity Sensor Comprising Biopolymer-Derived Carbon Thin Film and Carbon Microelectrodes. J. Electrochem. Soc. 2020, 167, 147511. [Google Scholar] [CrossRef]
- Chanda, A.; Rajkonwar, N.; Masood, K.B.; Singh, J.; Shukla, P. Study of bio-polymer derived graphene oxide-ZnO nano-composite thin films. In Proceedings of the 3rd International Conference on Condensed Matter and Applied Physics (ICC-2019), Rajasthan, India, 14–15 October 2019. [Google Scholar]
- Cho, B.G.; Joshi, S.R.; Lee, J.; Park, Y.B.; Kim, G.H. Direct growth of thermally reduced graphene oxide on carbon fiber for enhanced mechanical strength. Compos. Part B Eng. 2020, 193. [Google Scholar] [CrossRef]
- Singhbabu, Y.N.; Choudhary, S.K.; Shukla, N.; Das, S.; Sahu, R.K. Observation of large positive magneto-resistance in bubble decorated graphene oxide films derived from shellac biopolymer: A new carbon source and facile method for morphology-controlled properties. Nanoscale 2015, 7, 6510–6519. [Google Scholar] [CrossRef]
- Singhbabu, Y.N.; Sivakumar, B.; Choudhary, S.K.; Das, S.; Sahu, R.K. Corrosion-protective reduced graphene oxide coated cold rolled steel prepared using industrial setup: A study of protocol feasibility for commercial production. Surf. Coat. Technol. 2018, 349, 119–132. [Google Scholar] [CrossRef]
- Feng, H.; Cheng, R.; Zhao, X.; Duan, X.; Li, J. A loJw-temperature method to produce highly reduced graphene oxide. Nat. Commun. 2013, 4, 1539. [Google Scholar] [CrossRef]
- Wu, X.; Li, H.; Cheng, K.; Qiu, H.; Yang, J. Modified graphene/polyimide composite films with strongly enhanced thermal conductivity. Nanoscale 2019, 11, 8219–8225. [Google Scholar] [CrossRef] [PubMed]
- Stobinski, L.; Lesiak, B.; Malolepszy, A.; Mazurkiewicz, M.; Mierzwa, B.; Zemek, J.; Jiricek, P.; Bieloshapka, I. Graphene oxide and reduced graphene oxide studied by the XRD, TEM and electron spectroscopy methods. J. Electron. Spectrosc. 2014, 195, 145–154. [Google Scholar] [CrossRef]
- Aslam, M.; Kalyar, M.A.; Raza, Z.A. Polyvinyl alcohol: A review of research status and use of polyvinyl alcohol based nanocomposites. Polym. Eng. Sci. 2018, 58, 2119–2132. [Google Scholar] [CrossRef]
- Wang, T.; Li, Y.; Geng, S.; Zhou, C.; Jia, X.; Yang, F.; Zhang, L.; Ren, X.; Yang, H. Preparation of flexible reduced graphene oxide/poly(vinyl alcohol) film with superior microwave absorption properties. RSC Adv. 2015, 5, 88958–88964. [Google Scholar] [CrossRef]
- Mo, S.; Peng, L.; Yuan, C.; Zhaom, C.; Tang, W.; Ma, C.; Shen, J.; Yang, W.; Yu, Y.; Min, Y.; et al. Enhanced properties of poly(vinyl alcohol) composite films with functionalized graphene. RSC Adv. 2015, 5, 97738–97745. [Google Scholar] [CrossRef]
- Liu, K.W.Y.; Luo, F.; Lu, M.; Xiao, F.; Du, X.; Zhang, S.; Liang, L.; Lu, M. Significantly enhanced thermal conductivity in polyvinyl alcohol composites enabled by dopamine modified graphene nanoplatelets. Compos. Part A Appl. Sci. Manuf. 2019, 117, 134–143. [Google Scholar] [CrossRef]
- Li, J.; Shao, L.; Zhou, X.; Wang, Y. Fabrication of high strength PVA/rGO composite fibers by gel spinning. RSC Adv. 2014, 4, 43612–43618. [Google Scholar] [CrossRef]
- Hong, P.D.; Chen, J.H.; Wu, H.L. Solvent effect on structural change of poly(vinyl alcohol) physical gels. J. Appl. Polym. Sci. 1998, 69, 2477–2486. [Google Scholar] [CrossRef]
- Kim, S.W.; Choi, H.M. Enhancement of thermal, mechanical, and barrier properties of ethylene vinyl alcohol copolymer by incorporation of graphene nanosheets. High Perform. Polym. 2014, 27, 694–704. [Google Scholar] [CrossRef]
- Zhu, Y.; Wang, H.; Zhu, J.; Chang, L.; Ye, L. Nanoindentation and thermal study of polyvinylalcohol/graphene oxide nanocomposite film through organic/inorganic assembly. Appl. Surf. Sci. 2015, 349, 27–34. [Google Scholar] [CrossRef]
- Albert, E.L.; Abdullah, C.A.C.; Shiroshaki, Y. Synthesis and characterization of graphene oxide functionalized with magnetic nanoparticle via simple emulsion method. Results Phys. 2018, 11, 944–950. [Google Scholar] [CrossRef]
- Huang, G.; Gao, J.; Wang, X.; Liang, H.; Ge, C. How can graphene reduce the flammability of polymer nanocomposites? Mater. Lett. 2012, 66, 187–189. [Google Scholar] [CrossRef]
- Samios, D.; Lima, M.F.S. Thermodynamic behavior of deformed semicrystalline polymers at temperatures between Tg and Tm. J. Polym. Eng. 1997, 17, 14. [Google Scholar] [CrossRef]
- Garcia, I.T.S.; Samios, D. Thermomechanical behaviour of semicrystalline polymers submitted to plane-strain compression. Polymer 1998, 39, 7. [Google Scholar] [CrossRef]
- Lima, M.F.S.; Vasconcellos, M.A.Z.; Samios, D. Crystallinity changes in plastically deformed isotactic polypropylene evaluated by x-ray diffraction and differential scanning calorimetry methods. J. Polym. Sci. Part B Polym. Phys. 2002, 40, 896–903. [Google Scholar] [CrossRef]
- Yazdani, A.; Hohne, G.W.H.; Misture, S.T.; Graeve, O.A. A method to quantify crystallinity in amorphous metal alloys: A differential scanning calorimetry study. PLoS ONE 2020, 15, e0234774. [Google Scholar] [CrossRef] [PubMed]
- Park, G.T.; Chang, J.H. Comparison of Properties of PVA Nanocomposites Containing Reduced Graphene Oxide and Functionalized Graphene. Polymers 2019, 11, 450. [Google Scholar] [CrossRef] [PubMed]
- Yang, X.; Li, L.; Shang, S.; Tao, X.M. Synthesis and characterization of layer-aligned poly(vinyl alcohol)/graphene nanocomposites. Polymer 2010, 51, 3431–3435. [Google Scholar] [CrossRef]
- Aslam, M.; Kalyar, M.A.; Raza, Z.A. Fabrication of reduced graphene oxide nanosheets doped PVA composite films for tailoring their opto-mechanical properties. Appl. Phys. A 2017, 123. [Google Scholar] [CrossRef]
- Li, J.; Shao, L.; Yuan, L.; Wang, Y. A novel strategy for making poly(vinyl alcohol)/reduced graphite oxide nanocomposites by solvothermal reduction. Mater. Des. (1980-2015) 2014, 54, 520–525. [Google Scholar] [CrossRef]
- Zou, X.; Zhang, L.; Wang, Z.; Luo, Y. Mechanisms of the Antimicrobial Activities of Graphene Materials. J. Am. Chem. Soc. 2016, 138, 2064–2077. [Google Scholar] [CrossRef] [PubMed]
- Carpio, I.E.M.; Santos, C.M.; Wei, X.; Rodrigues, D.F. Toxicity of a polymer-graphene oxide composite against bacterial planktonic cells, biofilms, and mammalian cells. Nanoscale 2012, 4, 4746–4756. [Google Scholar] [CrossRef] [PubMed]
- Moghayedi, M.; Goharshadi, E.K.; Ghazvini, K.; Ahmadzadeh, H.; Ranjbaran, L.; Masoudi, R.; Ludwig, R. Kinetics and mechanism of antibacterial activity and cytotoxicity of Ag-RGO nanocomposite. Colloids Surf. B. 2017, 159, 366–374. [Google Scholar] [CrossRef]
- Sadhukhan, S.; Ghosh, T.K.; Roy, I.; Rana, D.; Bhattacharyya, A.; Saha, R.; Chattopadhyay, S.; Khatua, S.; Acharya, K.; Chattopadhyay, D. Green synthesis of cadmium oxide decorated reduced graphene oxide nanocomposites and its electrical and antibacterial properties. Mater. Sci. Eng. C Mater. Biol. Appl. 2019, 99, 696–709. [Google Scholar] [CrossRef] [PubMed]


| Band (cm−1) | Assignments |
|---|---|
| 1090 | C–O Stretching, Epoxide Groups of PVA |
| 1256 | C–H Bending |
| 1326 | O–H Bending Vibration |
| 1730 | C=O Stretching |
| 2910, 2940 | Asymmetric CH2 Stretching |
| 3000–3050 | O–H Stretching |
| TrGO Concentration (wt.%) | Tc (°C) | Tm (°C) | ∆Hm a | Χc (%) b | CI (%) c |
|---|---|---|---|---|---|
| 0 | 183.43 | 212.23 | 29.44 | 21.23 | 34.2 |
| 0.1 | 187.65 | 216.77 | 40.5 | 29.2 | 40.89 |
| 0.5 | 191.36 | 219.78 | 43.15 | 31.11 | 47.04 |
| 1 | 193.56 | 219.95 | 43.39 | 31.28 | 51.04 |
| 1.5 | 195.14 | 221.91 | 45.51 | 32.81 | 57.1 |
| 2 | 192.06 | 219.23 | 45.03 | 32.47 | 32.42 |
| TrGO Concentration (wt.%) | 5% Weight Loss Temperature, TD5% (°C) | Residual Amount at 800 °C (%) |
|---|---|---|
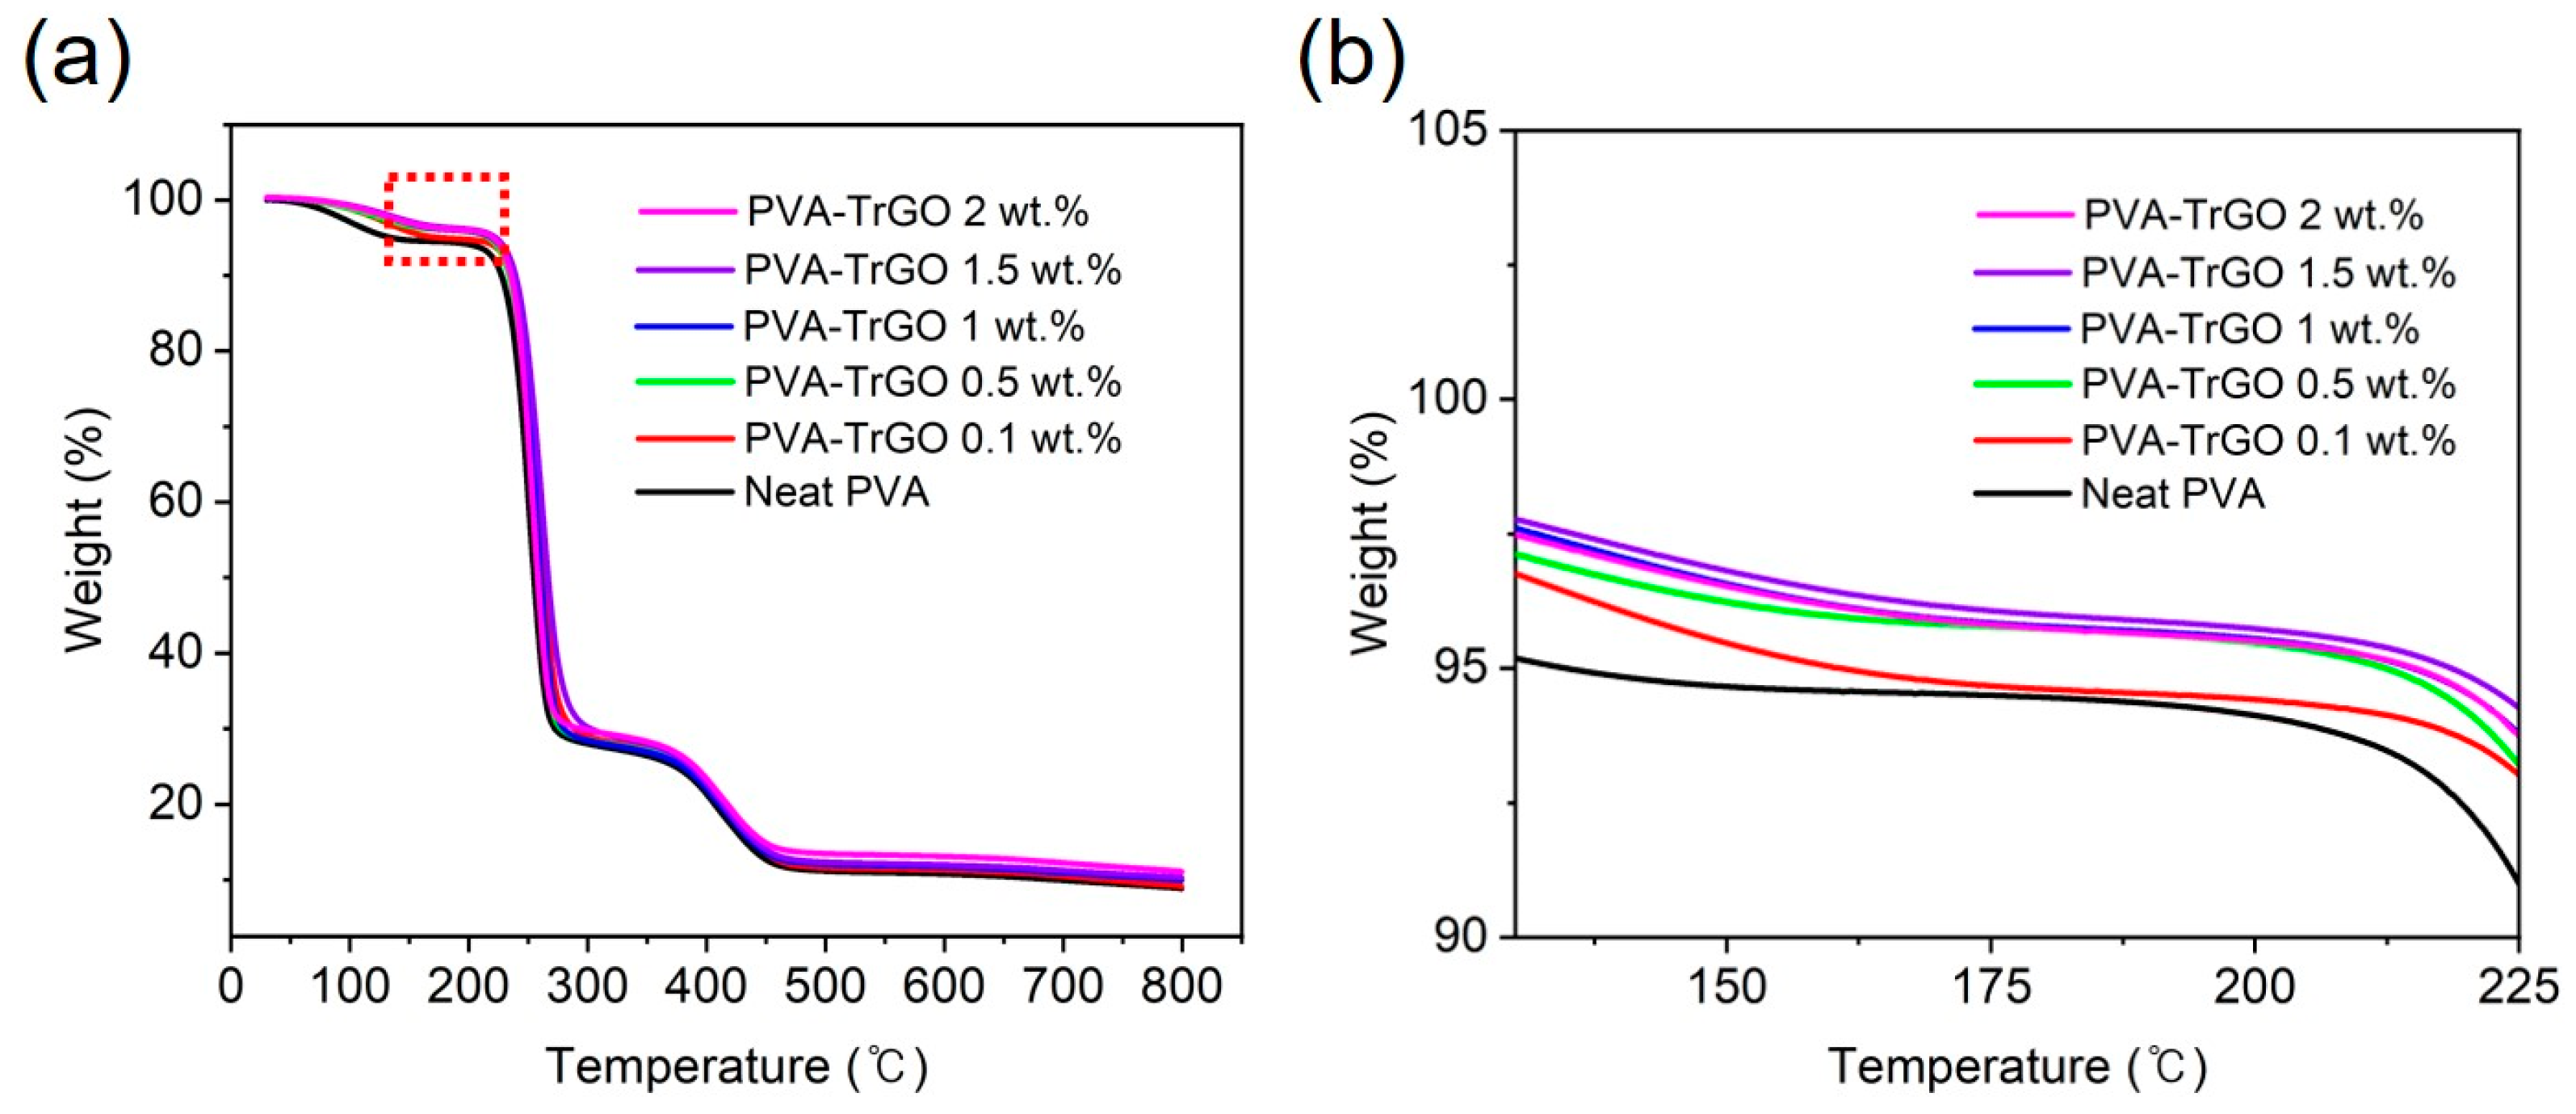
| 0 | 134.75 | 6.78 |
| 0.1 | 160.89 | 7.51 |
| 0.5 | 212.31 | 7.61 |
| 1 | 214.86 | 7.69 |
| 1.5 | 218.54 | 7.83 |
| 2 | 215.09 | 8.83 |
Publisher’s Note: MDPI stays neutral with regard to jurisdictional claims in published maps and institutional affiliations. |
© 2021 by the authors. Licensee MDPI, Basel, Switzerland. This article is an open access article distributed under the terms and conditions of the Creative Commons Attribution (CC BY) license (http://creativecommons.org/licenses/by/4.0/).
Share and Cite
Cho, B.-G.; Joshi, S.R.; Lee, S.; Kim, S.-K.; Park, Y.-B.; Kim, G.-H. Enhanced Mechanical and Antibacterial Properties of Nanocomposites Based on Poly(vinyl Alcohol) and Biopolymer-Derived Reduced Graphene Oxide. Polymers 2021, 13, 615. https://doi.org/10.3390/polym13040615
Cho B-G, Joshi SR, Lee S, Kim S-K, Park Y-B, Kim G-H. Enhanced Mechanical and Antibacterial Properties of Nanocomposites Based on Poly(vinyl Alcohol) and Biopolymer-Derived Reduced Graphene Oxide. Polymers. 2021; 13(4):615. https://doi.org/10.3390/polym13040615
Chicago/Turabian StyleCho, Beom-Gon, Shalik Ram Joshi, Seongjin Lee, Shin-Kwan Kim, Young-Bin Park, and Gun-Ho Kim. 2021. "Enhanced Mechanical and Antibacterial Properties of Nanocomposites Based on Poly(vinyl Alcohol) and Biopolymer-Derived Reduced Graphene Oxide" Polymers 13, no. 4: 615. https://doi.org/10.3390/polym13040615
APA StyleCho, B.-G., Joshi, S. R., Lee, S., Kim, S.-K., Park, Y.-B., & Kim, G.-H. (2021). Enhanced Mechanical and Antibacterial Properties of Nanocomposites Based on Poly(vinyl Alcohol) and Biopolymer-Derived Reduced Graphene Oxide. Polymers, 13(4), 615. https://doi.org/10.3390/polym13040615