
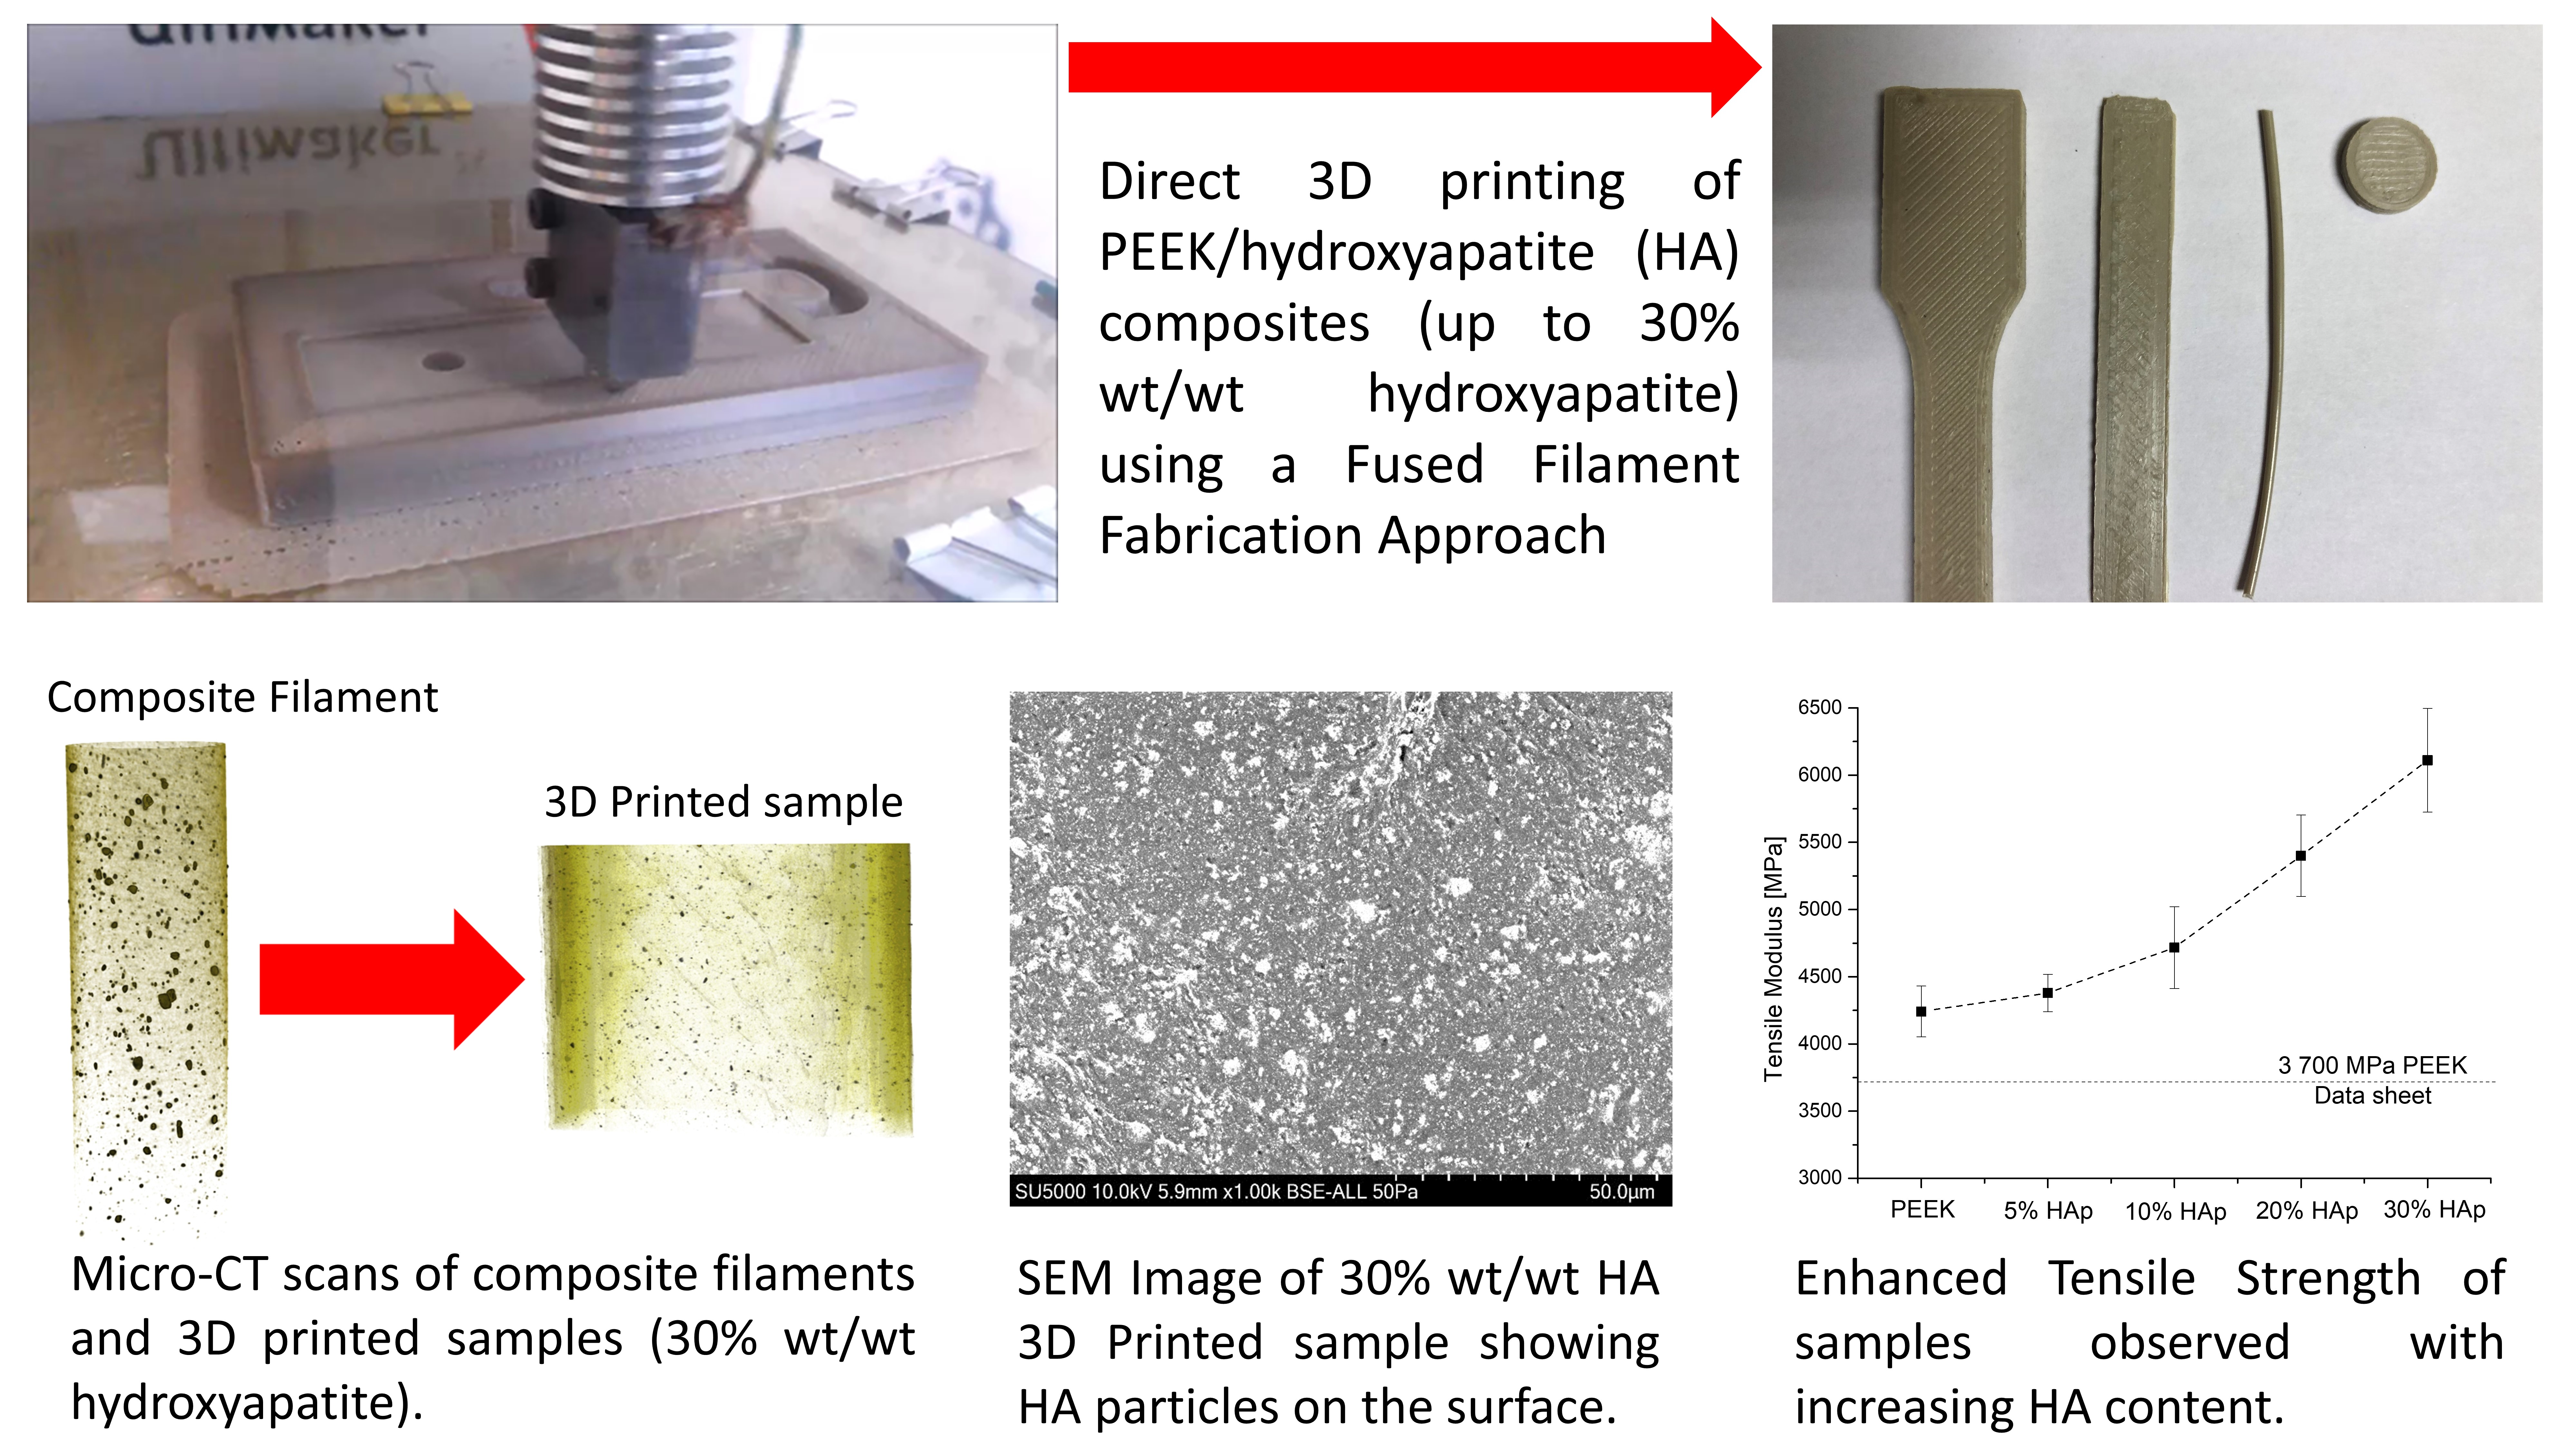
The Direct 3D Printing of Functional PEEK/Hydroxyapatite Composites via a Fused Filament Fabrication Approach


 ,
,  ,
,  , , and
Abstract

1. Introduction
2. Materials and Methods
2.1. Materials and Processing Conditions
2.2. Characterisation of the Extruded Filaments and Composite Samples
3. Results
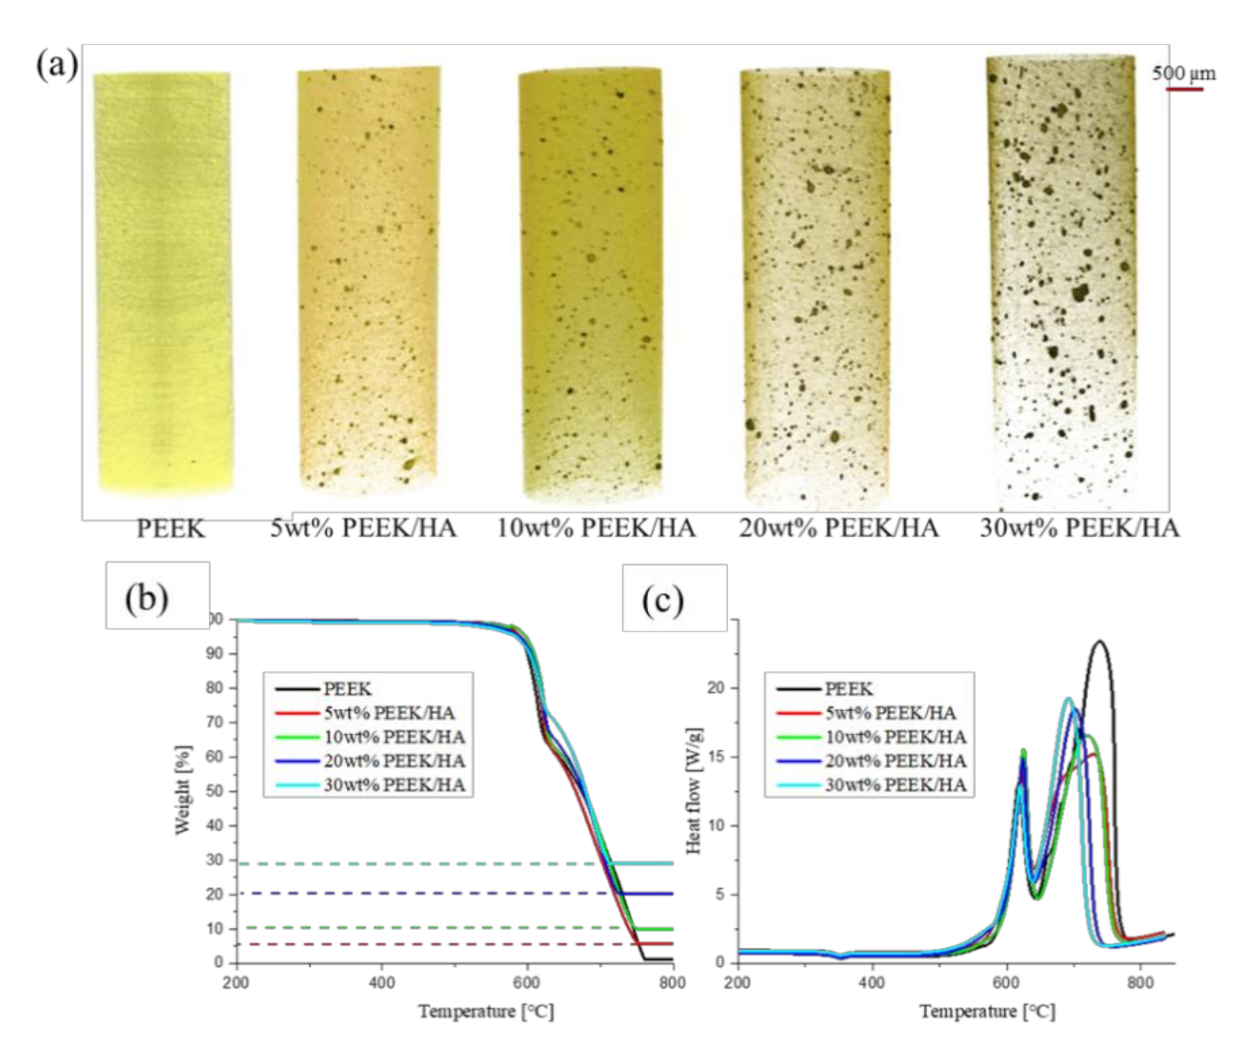
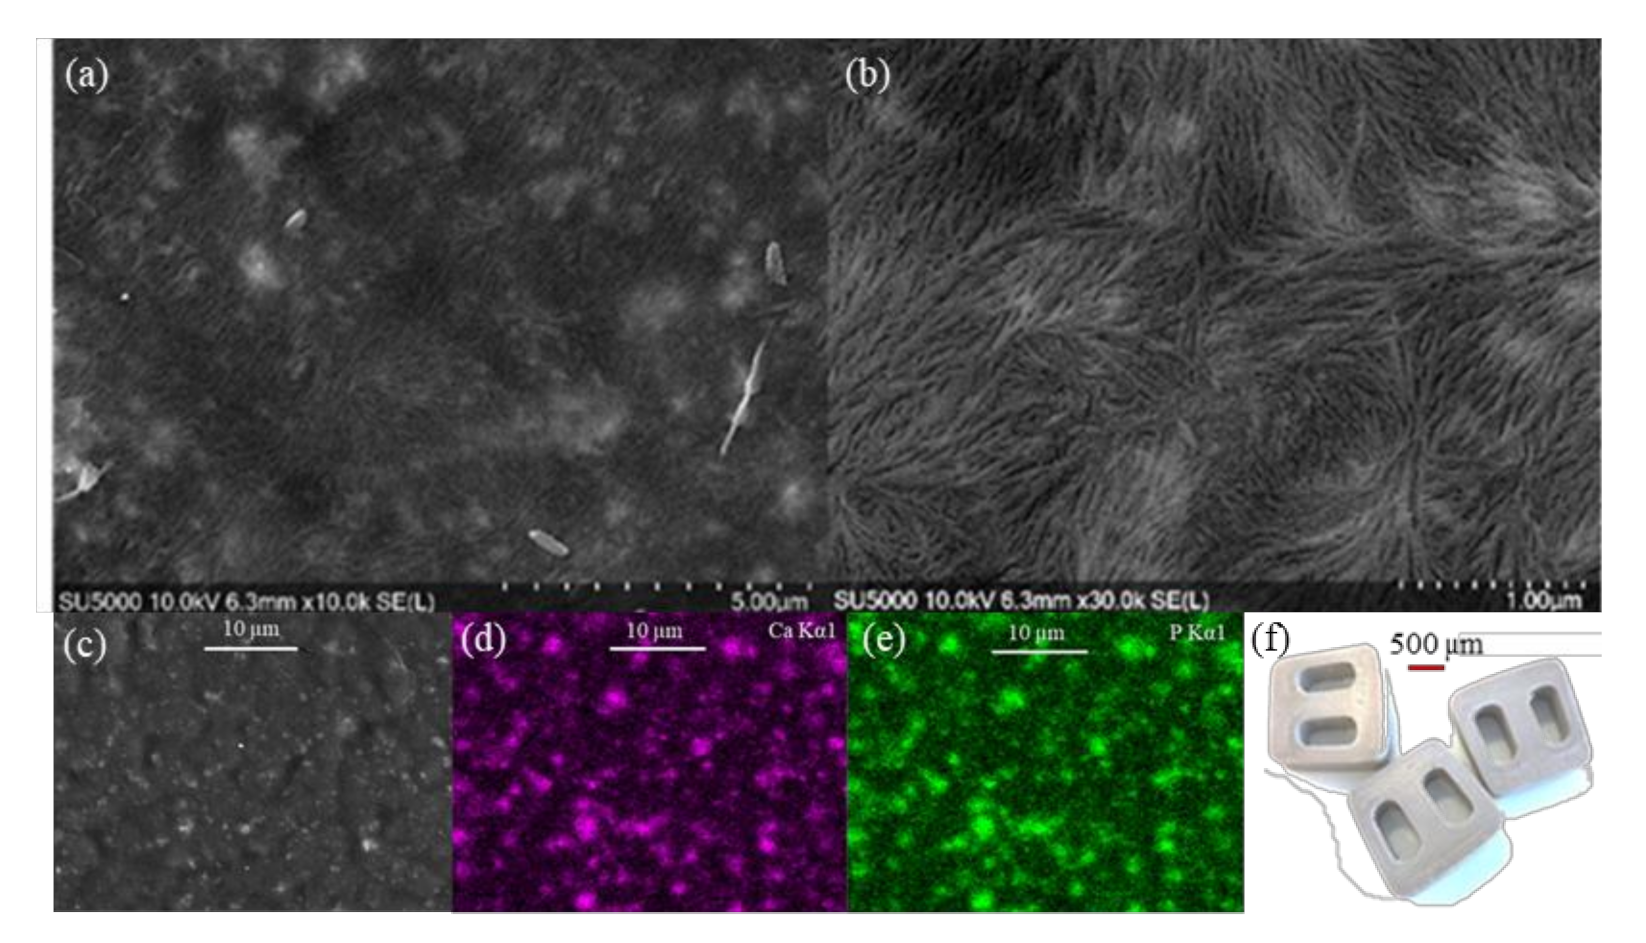
3.1. PEEK/HA Distribution
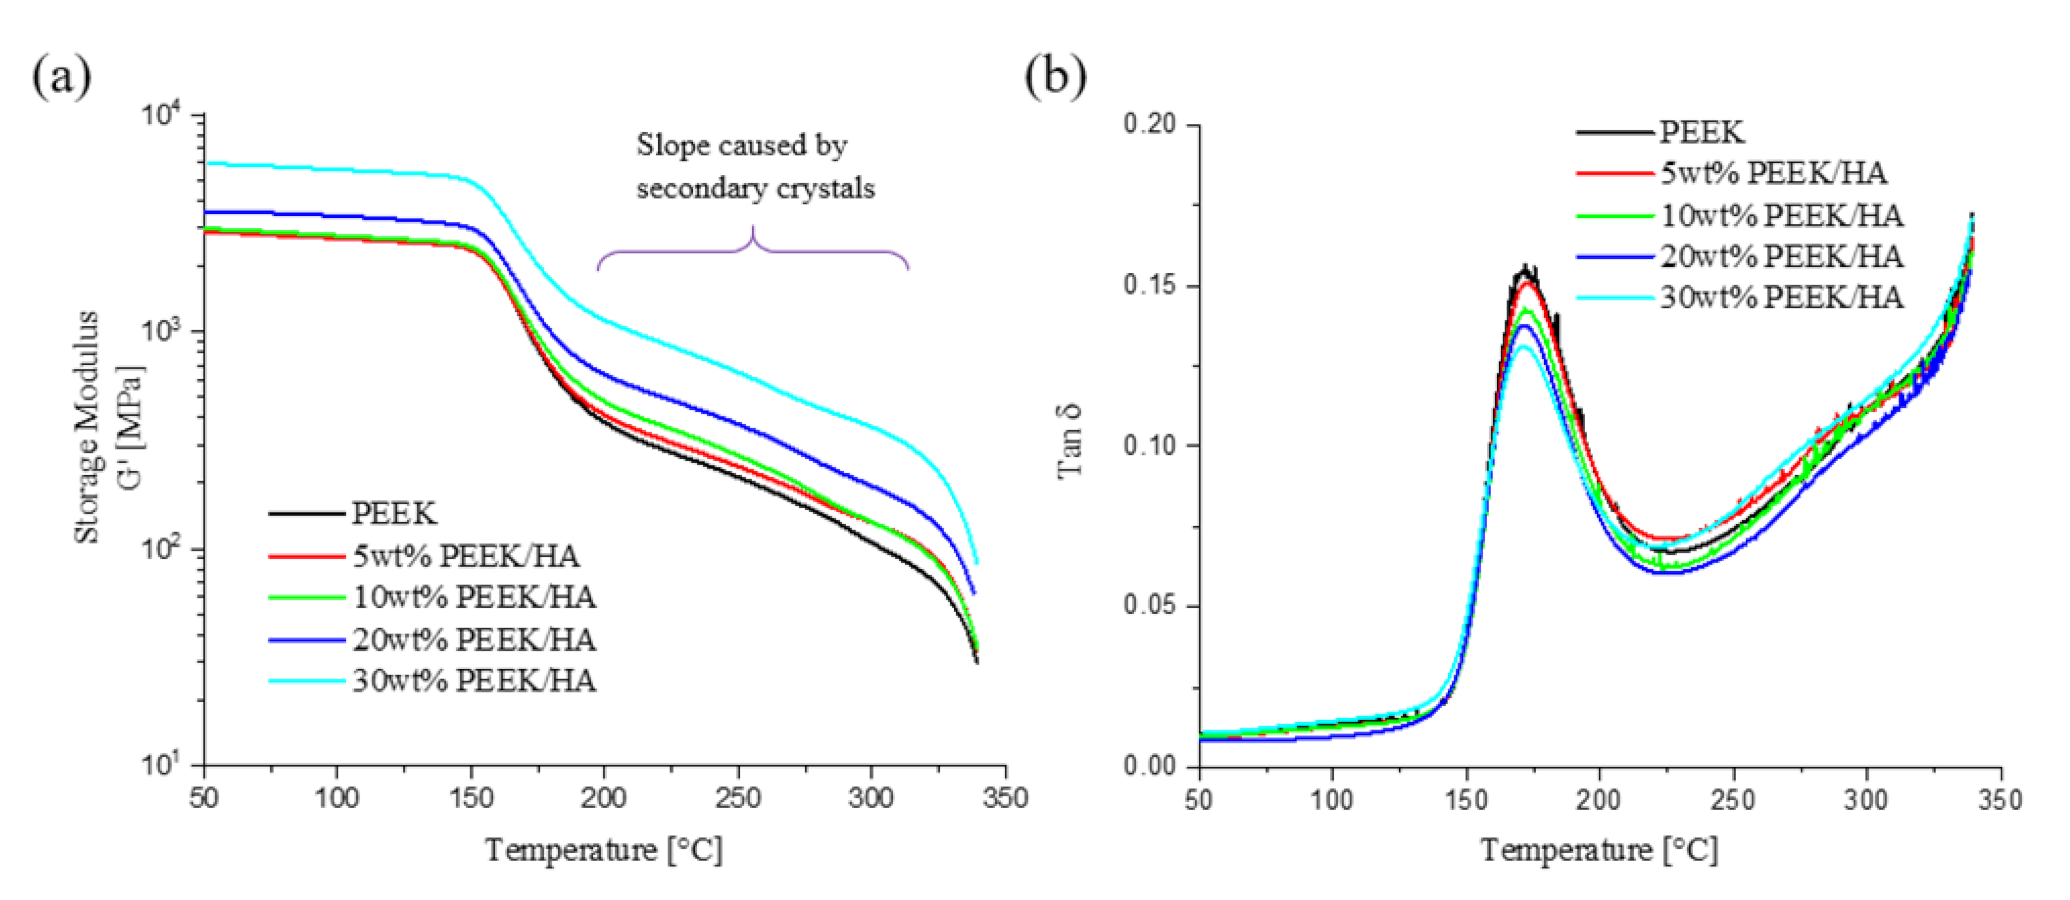
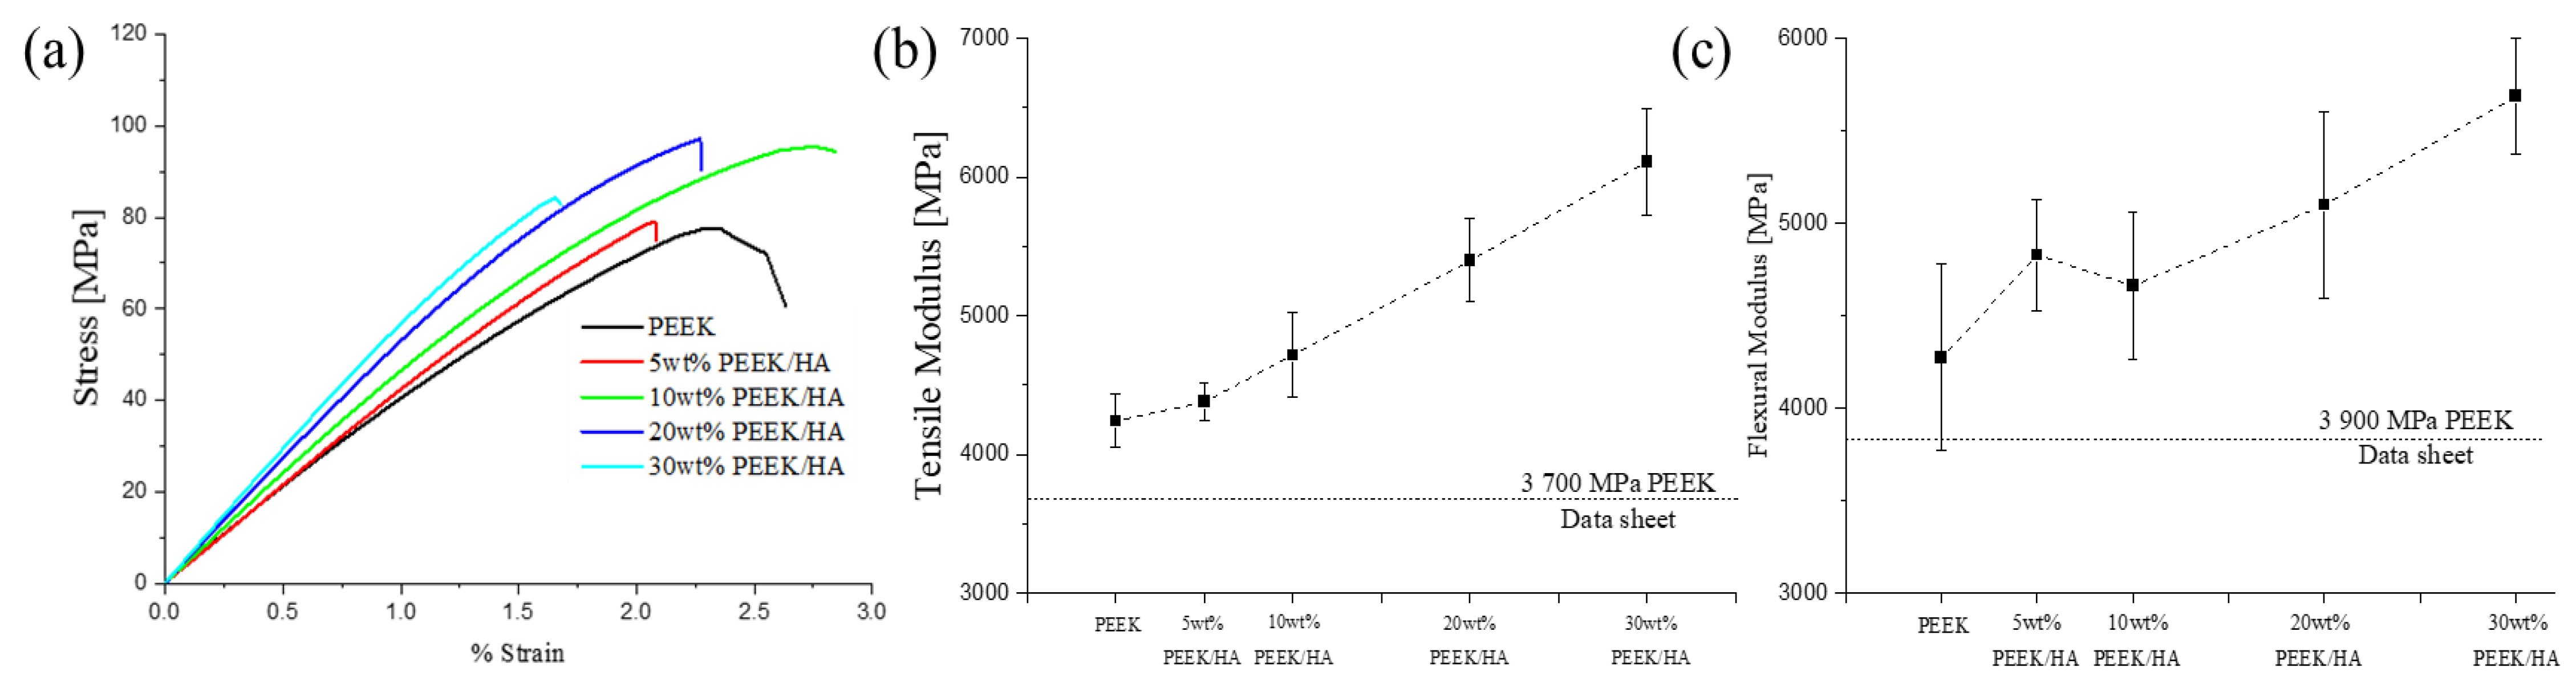
3.2. Thermal and Mechanical Properties
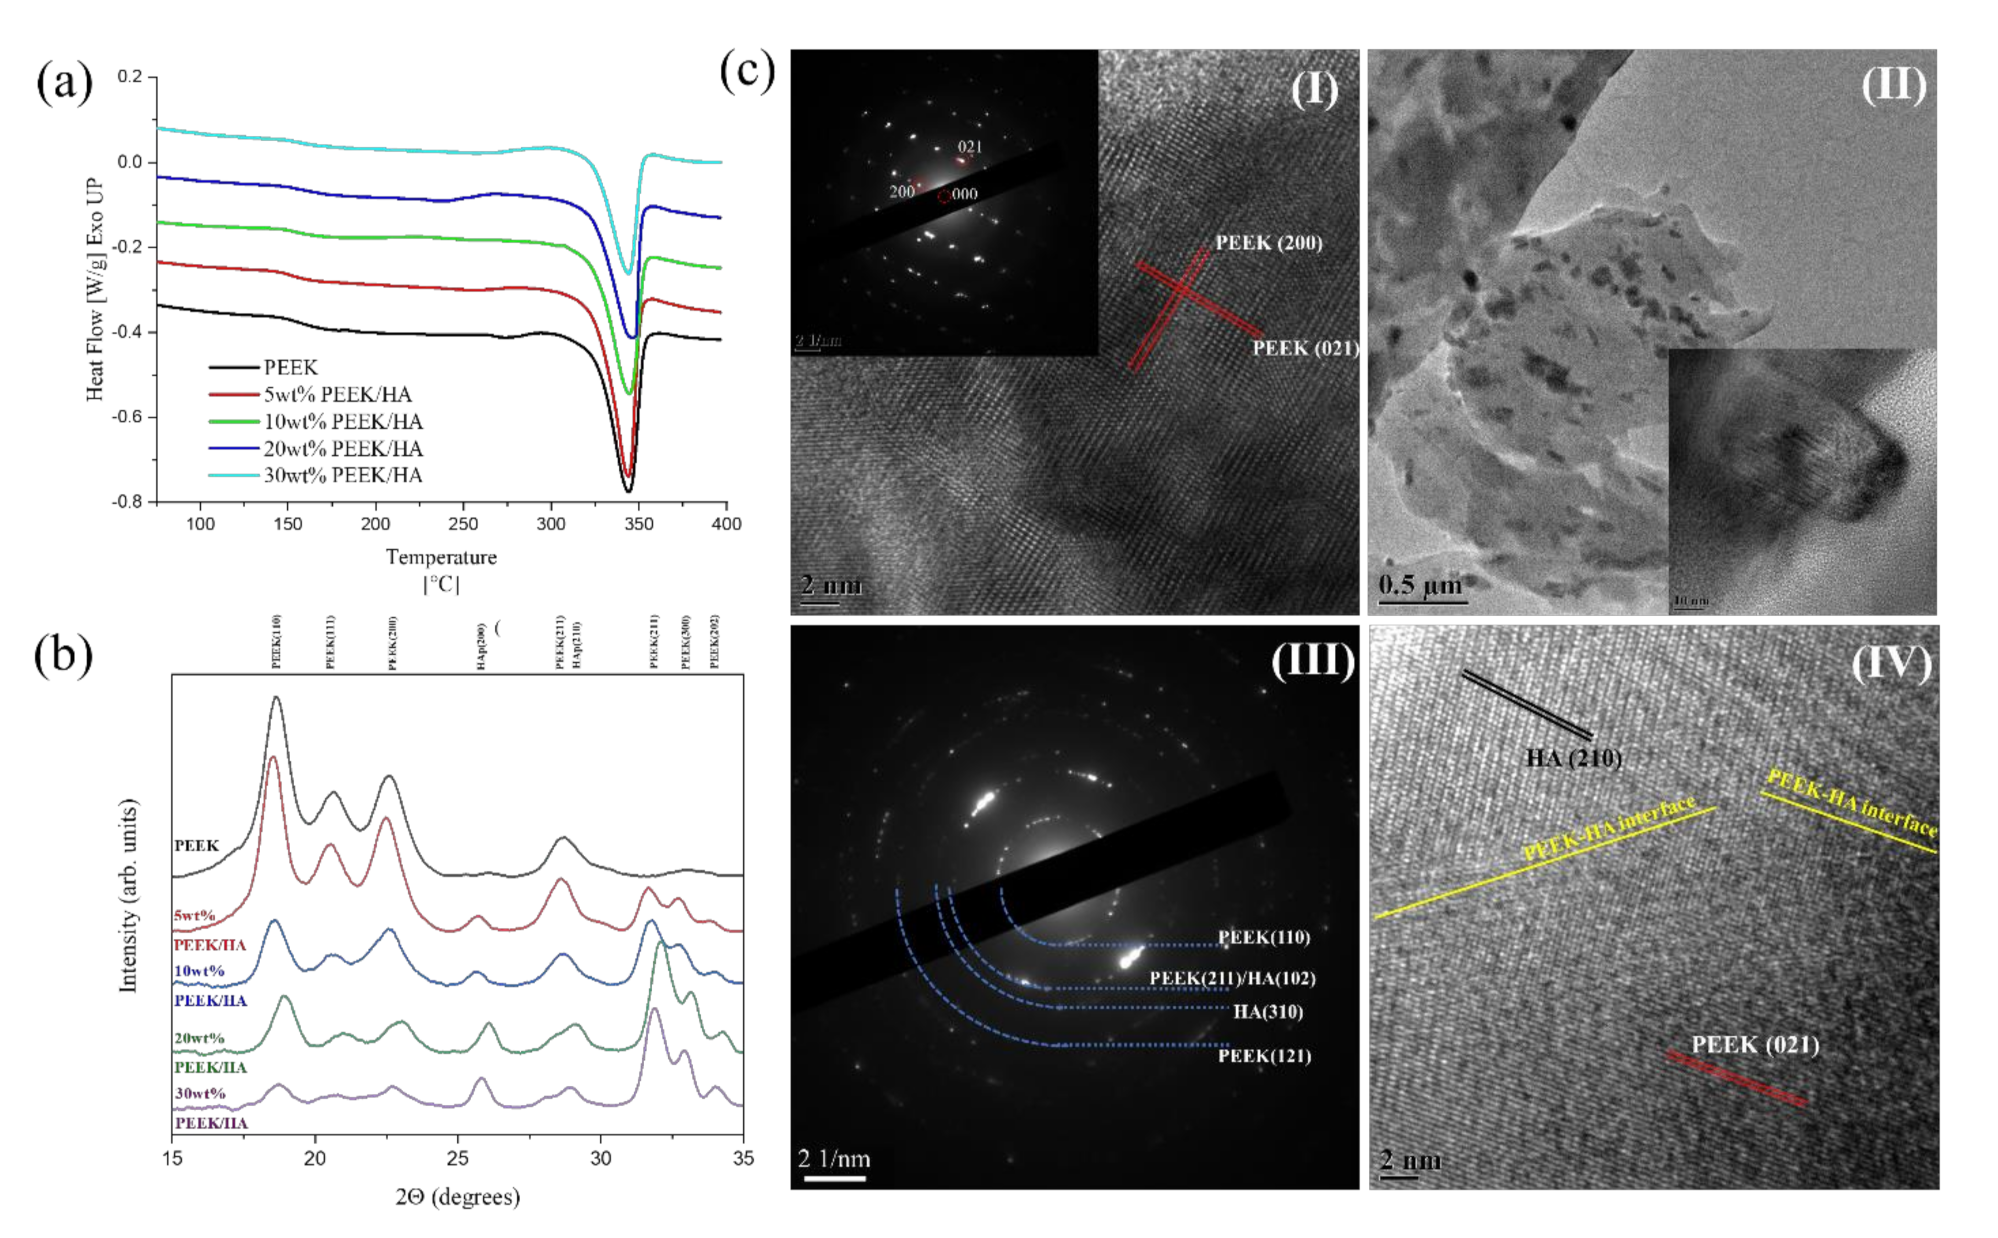
3.3. Crystallinity
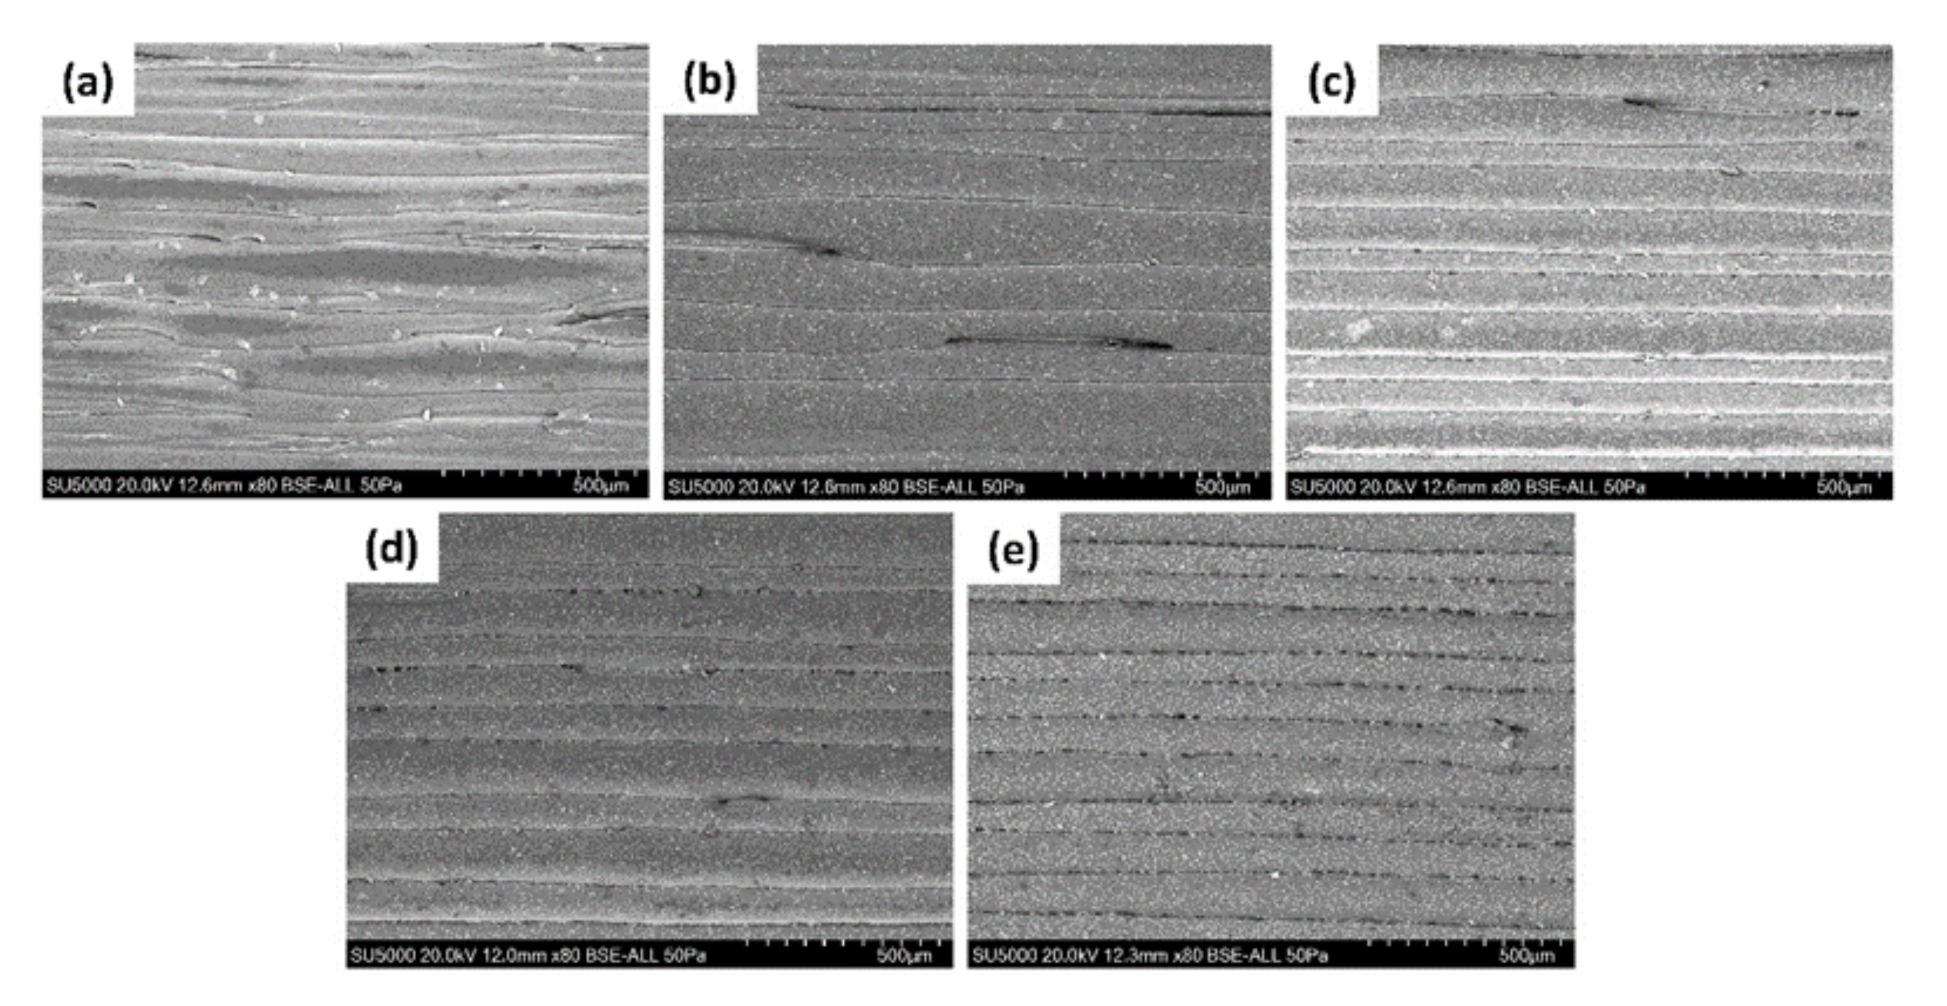
3.4. Morphology
4. Discussion
5. Conclusions
Author Contributions
Funding
Institutional Review Board Statement
Informed Consent Statement
Data Availability Statement
Conflicts of Interest
Appendix A


| Porosity—Closed Pores | ||
|---|---|---|
| Sample | Filaments [%] | 3DP Bars [%] |
| PEEK | 0.001 | 0.272 |
| 5 wt% PEEK/HA | 0.007 | 0.732 |
| 10 wt% PEEK/HA | 0.026 | 0.478 |
| 20 wt% PEEK/HA | 0.000 | 0.039 |
| 30 wt% PEEK/HA | 0.019 | 0.497 |


| Atomic Conc (%) | HA Conc wt% (PEEK/HA) | ||||
|---|---|---|---|---|---|
| 0 | 5 | 10 | 20 | 30 | |
| C | 83.8 | 81.6 | 80.5 | 76.4 | 68.1 |
| O | 16.2 | 16.9 | 16.1 | 15.5 | 20.9 |
| Ca | 0.0 | 1.0 | 2.3 | 5.5 | 7.4 |
| P | 0.0 | 0.5 | 1.1 | 2.6 | 3.5 |
References
- Berretta, S.; Evans, K.E.; Ghita, O. Processability of PEEK, a New Polymer for High Temperature Laser Sintering (HT-LS). Eur. Polym. J. 2015, 68, 243–266. [Google Scholar] [CrossRef]
- Milazzo, M.; Negrini, N.C.; Scialla, S.; Marelli, B.; Farè, S.; Danti, S.; Buehler, M.J. Additive Manufacturing Approaches for Hydroxyapatite-Reinforced Composites. Adv. Funct. Mater. 2019, 29, 1903055. [Google Scholar] [CrossRef]
- Vaezi, M.; Black, C.; Gibbs, D.M.R.; Oreffo, R.O.C.; Brady, M.; Moshrefi-Torbati, M.; Yang, S. Characterization of New PEEK/HA Composites with 3D HA Network Fabricated by Extrusion Freeforming. Molecules 2016, 21, 687. [Google Scholar] [CrossRef]
- Guzzi, E.A.; Tibbitt, M.W. Additive Manufacturing of Precision Biomaterials. Adv. Mater. 2019, 1901994, 1–24. [Google Scholar] [CrossRef] [PubMed]
- Noiset, O.; Schneider, Y.J.; Marchand-Brynaert., J. Fibronectin adsorption or/and covalent grafting on chemically modified PEEK film surfaces. Biomater. Sci. Polym. E 1999, 10, 657–677. [Google Scholar] [CrossRef] [PubMed]
- Ozeki, K.; Masuzawa, T.; Aoki, H. Fabrication of hydroxyapatite thin films on polyetheretherketone substrates using a sputtering technique. Mater. Sci. Eng. C 2017, 72, 576–582. [Google Scholar] [CrossRef]
- Lee, J.H.; Jang, H.L.; Lee, K.M.; Baek, H.R.; Jin, K.; Hong, K.S. In vitro and in vivo evaluation of the bioactivity of hydroxyapatite-coated polyetheretherketone biocomposites created by cold spray technology. Acta Biomater. 2013, 9, 6177–6187. [Google Scholar] [CrossRef]
- Yuan, B.; Cheng, Q.; Zhao, R.; Zhu, X.; Yang, X.; Yang, X.; Zhang, K.; Song, Y.; Zhang, X. Comparison of osteointegration property between PEKK and PEEK: Effects of surface structure and chemistry. Biomaterials 2018, 170, 116–126. [Google Scholar] [CrossRef]
- Almasi, D.; Iqbal, N.; Sadeghi, M.; Sudin, I.; Rafiq, M.; Kadir, A.; Kamarul, T. Preparation Methods for Improving PEEK’s Bioactivity for Orthopedic and Dental Application: A Review. Int. J. Biomater. 2016, 2016, 1–19. [Google Scholar] [CrossRef]
- Ma, R.; Guo, D. Preoperative sleep quality affects postoperative pain and function after total joint arthroplasty: A prospective cohort study. J. Orthop. Surg. Res. 2019, 14, 32. [Google Scholar] [CrossRef]
- Zhong, G.; Vaezi, M.; Mei, X.; Liu, P.; Yang, S. Strategy for Controlling the Properties of Bioactive Poly-EtherEther-Ketone/Hydroxyapatite Composites for Bone Tissue Engineering Scaffolds. ACS Omega 2019, 4, 19238–19245. [Google Scholar] [CrossRef]
- Oladapo, B.I.; Zahedi, S.A.; Ismail, S.O. 3D printing of PEEK–cHAp scaffold for medical bone implant. Bio-Des. Manuf. 2020, 4, 44–59. [Google Scholar] [CrossRef]
- Zhang, Y.; Hao, L.; Savalani, M.M.; Harris, R.A.; di Silvio, L.; Tanner, K.E. In vitro biocompatibility of hydroxyapatite-reinforced polymeric composites manufactured by selective laser sintering. J. Biomed. Mater. Res. A 2009, 91, 1018–1027. [Google Scholar] [CrossRef] [PubMed]
- Yu, S.; Hariram, P.K.; Kumar, R.; Cheang, P.; Aik, K.K. In vitro apatite formation and its growth kinetics on hydroxyapatite/polyetheretherketone biocomposites. Biomaterials 2005, 26, 2343–2352. [Google Scholar] [CrossRef] [PubMed]
- Ma, R.; Fang, L.; Luo, Z. Mechanical performance and in vivo bioactivity of functionally graded PEEK–HA biocomposite materials. J. Sol.-Gel Sci. Technol. 2014, 70, 339–345. [Google Scholar] [CrossRef]
- Baştan, F.E. Fabrication and characterization of an electrostatically bonded PEEK-hydroxyapatite composites for biomedical applications. J. Biomed. Mater. Res. 2020, 108, 2513–2527. [Google Scholar] [CrossRef] [PubMed]
- Rousseau, M.A.; Lazennec, J.Y.; Saillant, G. Circumferential arthrodesis using PEEK cages at the lumbar spine. J. Spinal. Disord. Tech. 2007, 4, 278–281. [Google Scholar] [CrossRef]
- Sun, F.; Shen, X.; Zhou, N.; Gao, Y.; Guo, Y.; Yang, X.; Wu, G. A speech bulb prosthesis for a soft palate defect with a polyetherketoneketone (PEKK) framework fabricated by multiple digital techniques: A clinical report. J. Prosthet. Dent. 2019, in press. [Google Scholar] [CrossRef] [PubMed]
- Dong, L.; Jun, F.; Hongbin, F.; Dichen, L.; Enchun, D.; Xin, X.; Ling, W.; Zheng, G. Application of 3D-printed PEEK scapula prosthesis in the treatment of scapular benign fibrous histiocytoma: A case report. J. Bone Oncol. 2018, 12, 78–82. [Google Scholar]
- Berretta, S.; Evans, K.; Ghita, O. Additive manufacture of PEEK cranial implants: Manufacturing considerations versus accuracy and mechanical performance. Mater. Des. 2018, 139, 141–152. [Google Scholar] [CrossRef]
- Yang, C.; Tian, X.; Li, D.; Cao, Y.; Zhao, F.; Shi, C. Influence of thermal processing conditions in 3D printing on the crystallinity and mechanical properties of PEEK material. J. Mater. Process. Tech. 2017, 248, 1–7. [Google Scholar] [CrossRef]
- Cicala, G.; Latteri, A.; del Curto, B.; Russo, A.L.; Recca, G.; Farè, S. Engineering thermoplastics for additive manufacturing: A critical perspective with experimental evidence to support functional applications. J. Appl. Biomater. Funct. Mater. 2017, 15, 10–18. [Google Scholar] [CrossRef]
- Han, X.; Sharma, N.; Xu, Z.; Scheideler, L.; Geis-Gerstorfer, J.; Rupp, F.; Thieringer, F.M.; Spintzyk, S.J. An In Vitro Study of Osteoblast Response on Fused-Filament Fabrication 3D Printed PEEK for Dental and Cranio-Maxillofacial Implants. J. Clin. Med. 2019, 8, 771. [Google Scholar] [CrossRef] [PubMed]
- Singh, S.; Prakash, C.; Ramakrishna, S. 3D printing of polyether-ether-ketone for biomedical application. Eur. Polym. J. 2019, 114, 234–248. [Google Scholar] [CrossRef]
- Zanjanijamm, R.; Major, I.; Lyons, J.G.; Lafont, U.; Devine, D.M. Fused Filament Fabrication of PEEK: A Review of Process-Structure-Property Relationships. Polymers 2020, 12, 1665. [Google Scholar] [CrossRef]
- Velasco-Hogan, A.; Xu, J.; Meyers, M.A. Additive Manufacturing as a Method to Design and Optimize Bioinspired Structures. Adv. Mater. 2018, 30, 1800940. [Google Scholar] [CrossRef] [PubMed]
- Golbang, A.; Harkin-Jones, E.; Wegrzyn, M.; Campbell, G.; Archer, E.; Mcilhagger, A. Production and characterization of PEEK/IF-WS2 nanocomposites for Additive Manufacturing: Simultaneous improvement in processing characteristics and material properties. Addit. Manuf. 2020, 31, 100920. [Google Scholar] [CrossRef]
- Vasconcelos, G.C.; Mazur, R.L.; Ribeiro, B.; Botelho, E.C.; Costa, M.L. Evaluation of decomposition kinetics of poly (ether-ether-ketone) by thermogravimetric analysis. Mater. Res. 2014, 1, 227–235. [Google Scholar] [CrossRef]
- Rodzeń, K.; Strachota, A.; Ribot, F.; Matejka, L.; Kovářová, J.; Trchová, M.; Slouf, M. Reactivity of the tin homolog of POSS, butylstannoxane dodecamer, in oxygen-induced crosslinking reactions with an organic polymer matrix: Study of long-time behavior. Polym. Degrad. Stab. 2015, 118, 147–166. [Google Scholar] [CrossRef]
- Papageorgiou, D.G.; Roumeli, E.; Chrissafis, K.; Lioutas, C.; Triantafyllidis, K.; Bikiaris, D.; Boccaccini, A.R. Thermal degradation kinetics and decomposition mechanism of PBSu nanocomposites with silica-nanotubes and strontium hydroxyapatite nanorods. Phys. Chem. Chem. Phys. 2014, 16, 4830–4842. [Google Scholar] [CrossRef]
- Amaral, M.; Lopes, M.A.; Silva, R.F.; Santos, D.J. Densification route and mechanical properties of Si3N4-bioglass biocomposites. Biomaterials 2002, 3, 857–862. [Google Scholar] [CrossRef]
- Rodzeń, K.; Strachota, A.; Raus, V.; Pavlova, E. Behavior of Tin-Based “Super-POSS” Incorporated in Different Bonding Situations in Hybrid Epoxy Resins. Polym. Degrad. Stab. 2017, 142, 1–20. [Google Scholar] [CrossRef]
- Strachota, B.; Strachota, A.; Horodecka, S.; Steinhart, M.; Kovářová, J.; Pavlova, E.; Ribot, F. Polyurethane nanocomposites containing the chemically active inorganic Sn-POSS cages. React. Funct. Polym. 2019, 143, 104338. [Google Scholar] [CrossRef]
- Tan, S.; Su, A.; Luo, J.; Zhou, E. Crystallization kinetics of poly(ether ether ketone) (PEEK) from its metastable melt. Polymer 1999, 40, 1223–1231. [Google Scholar] [CrossRef]
- Tardif, X.; Pignon, B.; Boyard, N.; Schmelzer, J.W.P.; Sobotka, V.; Delaunay, D.; Schick, C. Experimental study of crystallization of PolyEtherEtherKetone (PEEK) over a large temperature range using a nano-calorimeter. Polym. Test. 2014, 36, 10–19. [Google Scholar] [CrossRef]
- Wolframa, U.; Schwiedrzik, J. Post-yield and failure properties of cortical bone. Bonekey Rep. 2016, 5, 829. [Google Scholar] [CrossRef] [PubMed]
- Wall, J.C.; Chatterji, S.K.; Jeffery, J.W. Age-related changes in the density and tensile strength of human femoral cortical bone. Calcif. Tiss. Intl. 1979, 27, 105–108. [Google Scholar] [CrossRef]
- Riviere, L.; Causse, N.; Lonjon, A.; Dantras, E.; Lacabanne, C. Specific heat capacity and thermal conductivity of PEEK/Ag nanoparticles composites determined by Modulated-Temperature Differential Scanning Calorimetry. Polym. Degrad. Stab. 2016, 127, 98–104. [Google Scholar] [CrossRef]
- Wang, Y.; Chen, B.; Evans, K.; Ghita, O. A transfer learning approach for microstructure reconstruction and structure-property predictions. Sci. Rep. 2018, 8, 1–13. [Google Scholar]
- Wang, S.; Wang, J.; Liu, T.; Mo, Z.; Zhang, H.; Yang, D.; Wu, Z. The crystal structure and drawing-induced polymorphism in poly (aryl ether ketone) s, 2. Poly (ether ether ketone ketone), PEEKK. Macromol. Chem. Phys. 1997, 198, 969–982. [Google Scholar] [CrossRef]
- Wang, Y.; Beard, J.D.; Evans, K.E.; Ghita, O. Unusual crystalline morphology of poly aryl ether ketones (PAEKs). RSC Adv. 2016, 6, 3198. [Google Scholar] [CrossRef]
- Xie, Z.; Gao, M.; Lobo, A.O.; Webster, T.J. 3D Bioprinting in Tissue Engineering for Medical Applications: The Classic and the Hybrid. Polymers 2020, 12, 1717. [Google Scholar] [CrossRef] [PubMed]
- Wang, L.; Weng, L.; Song, S.; Sun, Q. Mechanical properties and microstructure of polyetheretherketone–hydroxyapatite nanocomposite materials. Mater. Lett. 2010, 64, 2201–2204. [Google Scholar] [CrossRef]
- Fan, D.; Staufer, U.; Accardo, A. Engineered 3D polymer and hydrogel microenvironments for cell culture applications. Bioengineering 2019, 6, 113. [Google Scholar] [CrossRef] [PubMed]
- Hughes, A.B.; Grover, L.M. Characterisation of a novel poly (ether ether ketone)/calcium sulphate composite for bone augmentation. Biomater. Res. 2017, 21, 1–11. [Google Scholar] [CrossRef]
- Wang, P.; Zou, B.; Xiao, H.; Ding, S.; Huang, C. Effects of printing parameters of fused deposition modeling on mechanical properties, surface quality, and microstructure of PEEK. J. Mater. Process. Technol. 2019, 271, 62–74. [Google Scholar] [CrossRef]
- Wu, W.Z.; Geng, P.; Zhao, J.; Zhang, Y.; Rosen, D.W.; Zhang, H.B. Manufacture and thermal deformation analysis of semicrystalline polymer polyether ether ketone by 3D printing. Mater. Res. Innov. 2014, 18, 12–16. [Google Scholar] [CrossRef]
- Geng, P.; Zhao, J.; Wu, W.; Wang, Y.; Wang, B.; Wang, S.; Li, G. Effect of thermal processing and heat treatment condition on 3D printing PPS properties. Polymers 2018, 10, 875. [Google Scholar] [CrossRef]
- Basgul, C.; MacDonald, D.W.; Siskey, R.; Kurtz, S.M. Thermal localization improves the interlayer adhesion and structural integrity of 3D printed PEEK lumbar spinal cages. Materialia 2020, 10, 100650. [Google Scholar] [CrossRef]
- Berretta, S.; Davies, R.; Shyng, Y.T.; Wang, Y.; Ghita, O. Fused Deposition Modelling of high temperature polymers: Exploring CNT PEEK composites. Polym. Test. 2017, 63, 251–262. [Google Scholar] [CrossRef]


| Description | Value |
|---|---|
| Nozzle diameter | 1.0 mm |
| Layer Thickness | 0.1 mm |
| Nozzle temperature | 400 ℃ |
| Building plate temperature | 280 ℃ |
| Chamber temperature | 230 ℃ |
| Printing speed | 40 mm/s |
| Raster angle | XY 45°/−45° |
| PEEK | 5 wt% | 10 wt% | 20 wt% | 30 wt% | |
|---|---|---|---|---|---|
| Tensile Modulus | 4241 ± 189 | 4379 ± 138 | 4716 ± 304 | 5400 ± 302 | 6110 ± 386 |
| UTS | 83.1 ± 6.6 | 79.5 ± 5.9 | 94.2 ± 6.1 | 87.6 ± 12.9 | 84.9 ± 7.5 |
| Tensile Yield Strain | 2.3 ± 0.2 | 2.1 ± 0.3 | 2.8 ± 0.1 | 2.3 ± 0.2 | 1.6 ± 0.1 |
| Flexural Modulus | 4274 ± 506 | 4827 ± 301 | 4663 ± 399 | 5100 ± 505 | 5686 ± 312 |
| UFS | 131 ± 8.9 | 171 ± 8.4 | 141 ± 23.0 | 141 ± 22.3 | 112 ± 5.69 |
| ΔHc | 47.618 | 44.515 | 41.791 | 37.556 | 30.547 |
| Xc*DSC (%) | 36.63 | 35.95 | 35.37 | 34.67 | 30.55 |
| Xc*XRD (%) | 44.59 | 48.57 | 49.24 | 49.91 | 46.18 |
| Grain size (nm) | 15.58 | 15.55 | 15.65 | 14.59 | 13.10 |
| Line Diameter (µm) | 120 ± 27 | 104 ± 37 | 100 ± 31 | 105 ± 27 | 94 ± 16 |
Publisher’s Note: MDPI stays neutral with regard to jurisdictional claims in published maps and institutional affiliations. |
© 2021 by the authors. Licensee MDPI, Basel, Switzerland. This article is an open access article distributed under the terms and conditions of the Creative Commons Attribution (CC BY) license (http://creativecommons.org/licenses/by/4.0/).
Share and Cite
Rodzeń, K.; Sharma, P.K.; McIlhagger, A.; Mokhtari, M.; Dave, F.; Tormey, D.; Sherlock, R.; Meenan, B.J.; Boyd, A. The Direct 3D Printing of Functional PEEK/Hydroxyapatite Composites via a Fused Filament Fabrication Approach. Polymers 2021, 13, 545. https://doi.org/10.3390/polym13040545
Rodzeń K, Sharma PK, McIlhagger A, Mokhtari M, Dave F, Tormey D, Sherlock R, Meenan BJ, Boyd A. The Direct 3D Printing of Functional PEEK/Hydroxyapatite Composites via a Fused Filament Fabrication Approach. Polymers. 2021; 13(4):545. https://doi.org/10.3390/polym13040545
Chicago/Turabian StyleRodzeń, Krzysztof, Preetam K. Sharma, Alistair McIlhagger, Mozaffar Mokhtari, Foram Dave, David Tormey, Richard Sherlock, Brian J. Meenan, and Adrian Boyd. 2021. "The Direct 3D Printing of Functional PEEK/Hydroxyapatite Composites via a Fused Filament Fabrication Approach" Polymers 13, no. 4: 545. https://doi.org/10.3390/polym13040545
APA StyleRodzeń, K., Sharma, P. K., McIlhagger, A., Mokhtari, M., Dave, F., Tormey, D., Sherlock, R., Meenan, B. J., & Boyd, A. (2021). The Direct 3D Printing of Functional PEEK/Hydroxyapatite Composites via a Fused Filament Fabrication Approach. Polymers, 13(4), 545. https://doi.org/10.3390/polym13040545