Abstract
The dielectric elastomer (DE) generator (DEG), which can convert mechanical energy to electrical energy, has attracted considerable attention in the last decade. Currently, the energy-harvesting performances of the DEG still require improvement. One major reason is that the mechanical and electrical properties of DE materials are not well coordinated. To provide guidance for producing high-performance DE materials for the DEG, the relationship between the intrinsic properties of DE materials and the energy-harvesting performances of the DEG must be revealed. In this study, a simplified but validated electromechanical model based on an actual circuit is developed to study the relationship between the intrinsic properties of DE materials and the energy-harvesting performance. Experimental verification of the model is performed, and the results indicate the validity of the proposed model, which can well predict the energy-harvesting performances. The influences of six intrinsic properties of DE materials on energy-harvesting performances is systematically studied. The results indicate that a high breakdown field strength, low conductivity and high elasticity of DE materials are the prerequisites for obtaining high energy density and conversion efficiency. DE materials with high elongation at break, high permittivity and moderate modulus can further improve the energy density and conversion efficiency of the DEG. The ratio of permittivity and the modulus of the DE should be tailored to be moderate to optimize conversion efficiency (η) of the DEG because using DE with high permittivity but extremely low modulus may lead to a reduction in η due to the occurrence of premature “loss of tension”.
1. Introduction
The dielectric elastomer transducer (DET) has been a hot area of research in recent decades due to its high flexibility, light weight, large mechanical strain, simple structure and low cost [1,2,3,4]. A typical DET device consists of a dielectric elastomer (DE) film sandwiched by two compliant electrodes [5,6]. In generator mode, the DET is called the dielectric elastomer generator (DEG), and is able to convert mechanical energy into electrical energy during the stretch-release process due to its stretching variable capacitance property. As a new type of generator, the DEG provides a simple and feasible solution for harvesting energy from nature motion sources, such as waves, tides and human movements [7,8,9,10]. Therefore, the DEG has attracted much attention in recent years [11,12,13,14,15].
The working principle of the DEG is illustrated in Figure 1. The DE film is first electrically excited under low voltage at stretched state with high capacitance. Then, the film is released, and higher voltage across the film at the released state with lower capacitance can be obtained. The harvested electrical energy in this process is called the single-cycle generated energy (ΔU), which can be calculated as follows:
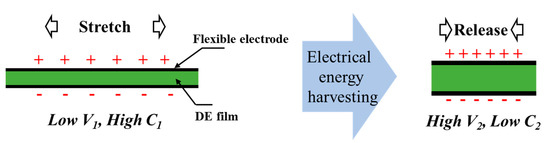
Figure 1.
Schematic diagram of the working principle of the DEG. Mechanical energy is converted into electrical energy by releasing a stretched and charged DE film.
Among them, Uout and Uin represent the input electrical energy in the stretched state and the output electric energy in the released state, respectively. C, V and the subscripts 1 and 2 represent the capacitance, voltage, the stretched state and the released state, respectively. The calculation formula of capacitance is:
where ε0 represents the vacuum permittivity; and εr, S and z, represent the relative permittivity (hereinafter referred to as permittivity), the area and the thickness of DE film, respectively. C, as well as ΔU, will be affected by the film size. Therefore, the gravimetric energy density (wm) and electromechanical conversion efficiency (η), as more important performances that avoid the influence of film shape [16], can be achieved by dividing ΔU by the mass of the DE film (m) and input mechanical work (Wmech), respectively.
Previous studies on the DEG have mainly focused on the circuit or device structure design to improve the energy-harvesting performance of the DEG based on commercial elastomers trademarked as VHB4905/10 [17,18,19,20,21,22,23]. On the other hand, some efforts have been made to prepare DE materials with high permittivity to enhance the performances of the DEG [24,25,26,27,28,29]. Ellingford et al. introduced a polar functional group into a styrene-butadiene triblock copolymer (SBS) to enhance the permittivity, but the significant charge leakage reduced the generated energy, which may have been caused by the relatively high conductivity of the modified SBS [28]. Yang et al. employed nature rubber (NR) and barium titanate (BT) as a high-elasticity DE matrix and dielectric filler, respectively, while the achieved conversion efficiency was relatively low, which may have resulted from the high modulus of the composite [26]. In these studies, the mechanical and electrical properties of the prepared materials were not well coordinated. Therefore, the energy-harvesting performances of the as-prepared DE materials were not satisfied. Therefore, to provide guidance for the preparation of high-performance DE materials for the DEG, the relationship between the intrinsic properties of DE materials and the energy-harvesting performances must be studied and revealed.
To date, scarce studies have reported the influences of the intrinsic properties of DE materials on the energy-harvesting performances of the DEG. Koh et al. established an electromechanical model to calculate the theoretical maximum energy density based on several failure mechanisms, and explored the influences of material parameters, such as Young’s modulus (Y), the product of permittivity and the square of electrical breakdown strength (Eb), on the energy density [30]. This study provides a preliminary guidance for the preparation of high-performance DE materials for the DEG, but the results on energy density calculated by this model cannot be obtained in an actual circuit. Moreover, this model does not take the mechanics/charge loss of the DE into consideration. Therefore, the simulation results differ from the experimental results [22].
Therefore, an electromechanical model based on an actual circuit is necessary to reveal the relationship between the intrinsic properties of DE materials and the energy-harvesting performance, thereby guiding the design and preparation of DE. An electromechanical model would also help to predict the theoretical energy-harvesting performances of the DEG. Based on the energy generation mechanism of the DEG, the main influencing factors involved in the energy conversion are as follows. During the electrical excitation and harvesting process, the permittivity and strain, electrical breakdown strength and the bulk conductivity influence ΔU by affecting the capacitance, bias voltage and charge loss, respectively [31,32]. Therefore, the main influencing factors involved in energy conversion include the intrinsic properties of DE and the external environment, as summarized in Figure 2 [16,30]. Among these intrinsic properties, the mechanical-related properties include the Young’s modulus, elongation at break and mechanical loss, and the electrical related properties include the permittivity, electrical breakdown strength and bulk conductivity. The external environment factor can be divided into device variables, including the stretching mode and circuit design, and the operating variables, including stretch ratio and bias voltage. It is noted that some intrinsic properties of the material limit the maximum value of the operating variable. That is, the elongation at break and the electrical breakdown strength of the DE material limit the maximum stretch ratio and the maximum bias voltage that can be applied, respectively. Therefore, the energy-harvesting performance of the DE with different elongation at break and breakdown field strength can be equivalently investigated under different stretch ratios and bias voltages, respectively. Under the premise of fixed device variables, the relationship between the intrinsic properties of DE materials and the energy-harvesting performances can be studied.
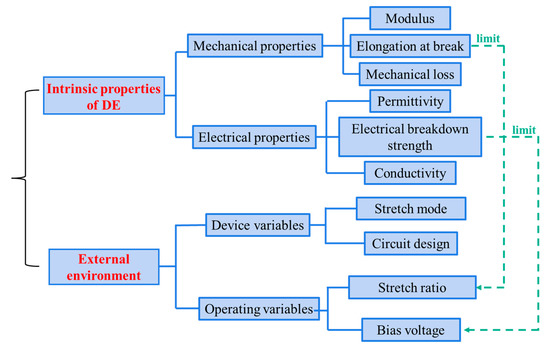
Figure 2.
Influencing factors on the energy-generation performances of the DEG.
In this study, a simplified but validated electromechanical model based on an actual circuit was developed to describe the relationship between intrinsic properties of DE material and the energy-harvesting performance. Linear elastic proposition with strain relaxation parameter was employed, and charge leakage was considered while studying the energy conversion mechanism. Experimental verification of the model was performed. The influences of six intrinsic properties of DE materials (including the modulus, elongation at break, mechanical loss property, permittivity, electrical breakdown strength and conductivity) on the energy-harvesting performances (including energy density and conversion efficiency) were systematically studied. Furthermore, guidance for the preparation of DE materials with high energy-harvesting performance was proposed. In addition, the ratio of permittivity and modulus of the DE material on the energy conversion efficiency of the DEG was discussed.
2. Modeling of DEG
2.1. Setup of Device Variables
The device variables contain the stretch mode and circuit design. The stretch modes reported in the literature have mainly included cone stretch, equibiaxial stretch and diaphragm inflatable stretch [21]. Among these stretch modes, equibiaxial stretch, a kind of uniform stretch in a plane, is the most widely used. This is because the uniformity of the thickness of the DE film can be maintained during stretching, and the highest energy-harvesting performances can be obtained under equibiaxial stretch [22,31]. Figure 3a shows a schematic diagram of equibiaxial stretch. The radius of the circular DE film before and after stretching are r0 and r, respectively. In this case, the equibiaxial stretch ratio λ is used to describe the degree of stretching, which is calculated using the formula λ = r/r0. The relationship between the stretch ratio and strain ε is λ = 1 + ε.
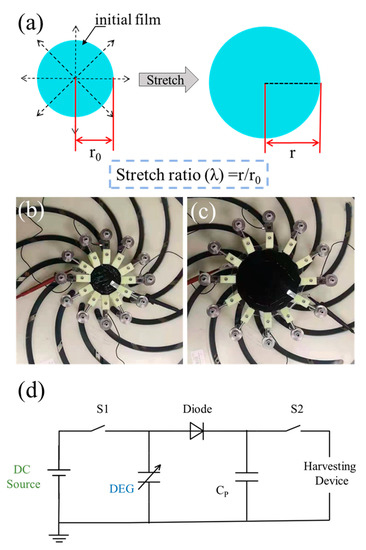
Figure 3.
(a) Schematic diagram of equibiaxial stretch. (b) Released state and (c) stretched state of homemade equibiaxial stretch device. (d) Circuit principle adopted in this study.
The circuit shown in Figure 3d was adopted according to Samuel Shian’s study [22]. The parallel transfer capacitors (CP) with the capacitance of CP = 1.3 C1 in this circuit can reduce the voltage rise caused by film releasing to prevent the film from electrical breakdown during the releasing process and ensure the completion of the cycle. The DEG energy-harvesting process was performed through the following four steps: (i) the stretching process, where the equibiaxial stretch was performed on the DE film and changed its radius from r0 to r1; (ii) the voltage boosting process, where S1 was closed, and the DC source with preset input voltage V1 was made to fully charge the DE film and CP; (iii) the releasing process, where S1 was disconnected, and the DE film was released with a charged state, during which a higher voltage V2 can be obtained across the DE and CP. Because of the existence of Maxwell stress, a “loss of tension” occurred before it releasing to r0, and the radius of DE film at the released state was rk (rk > r0); (iv) the harvesting process, where S2 was closed to release the charges across the DE film and CP.
The input mechanical work (Wmech) is equal to the difference between the work done by the stretch device on the DE film (Ws) during the stretch process and the work done by DE film on the stretching device (Wr) during the release process, that is:
where Fs, Fr and r1 represent the stretching force, restoring force and the radius of stretched state, respectively.
Both the equibiaxial stretch force and Maxwell stress perform work on the DE film during the energy-harvesting process. Figure 4 shows the schematic diagram of the Maxwell stress and equibiaxial stretch force acting on the DE film. Performing the Maxwell stress and equibiaxial stretch force from the thickness direction and horizontal direction on the DE film with an initial thickness of z0 and initial radius of r0, respectively, to make the film produce a slight deformation, the thickness becomes z0-dz, and the radius becomes r0 + dr.
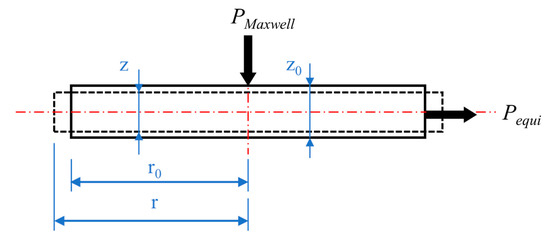
Figure 4.
Schematic diagram of the Maxwell stress and equibiaxial stretch force acting on the DE film.
Since the energy consumed by the two deformation methods is the same, the work performed by the Maxwell stress (PMaxwell) in the vertical direction is equal to the work performed by the equibiaxial stretch force (Pequi) in the horizontal direction, that is:
Assuming that the volume of the DE film remains unchanged, that is:
Combine the Equations (6) and (7):
Therefore, the effect caused by Pequi in horizontal direction is equivalent to that caused by the same magnitude of PMaxwell in the vertical direction.
During the stretching process, the stretch force applied on the circumference of the film causes the film to stretch in the radial direction and shrink in the thickness direction. At this time, the recovery force of the DE film is equal to its stretch force. Since the Maxwell stress also tends to shrink the film in the thickness direction and expand in the radial direction, the generation of the Maxwell stress caused by exerting bias voltage reduces the restoring force of the film. The input mechanical work is calculated based on the force-displacement relationship in the thickness direction. From Equation (8), during the releasing process of charged film, the restoring force is equal to equivalent Pequi in the vertical direction minus PMaxwell. The value of PMaxwell under the action of the electric field strength (E) is ε0εrE2. Therefore, during the releasing process of charged film, the vertical restoring force (Pr) of the film under the action of the electric field is:
Expressing the relationship between force and deformation in terms of Hooke’s law can simplify the model. Assuming that during the stretching process, the Pequi and the stretch ratio λ satisfy the following linear relationship:
The proportional coefficient M is called the elastic coefficient. Since the effective modulus of equibiaxial stretching is twice of Young’s modulus [33], the relationship between M and Young’s modulus is M = 2 Y (1 + ε) = 2λY, where ε represents the strain. The higher Young’s modulus of the material results in the greater elastic coefficient M, so M can also reflect the ability of a material to resist elastic deformation under the action of external force.
2.2. The Description of Mechanical Loss Behavior
Rubber is a viscoelastic material [34]. During the stretch-release process, the movement of the molecular chain of the viscoelastic material needs to overcome the internal resistance to do work, and it must convert a part of the energy into heat energy, thus causing mechanical loss. After being stretched to a certain strain, the stress of rubber gradually decreases with time, a stress relaxation phenomenon [35,36]. During the voltage boosting process, it takes time for the voltage to increase from zero to the bias voltage value. Therefore, the DE film undergoes a stretching-relaxation-release process in the energy-harvesting cycle. The stress relaxation property is used in this work to describe the mechanical loss in the conversion process. The difference in the recovery force between the end of the stretching process and the beginning of releasing process comes from two aspects: One is the decrease caused by the Maxwell stress, and the other is the decrease caused by stress relaxation. In order to simplify the model description, the stress relaxation ratio θ was introduced to describe the mechanical loss behavior of the DE (i.e., the ratio between the relaxed stress and maximum stress) [37]. A smaller θ value indicates the better elasticity. At the beginning of the release process, the reduction of the recovery force caused by stress relaxation is directly deducted from the recovery force. DE is still regarded as a linear elastic material in the stretch and release process. In this study, the viscoelasticity of DE was considered, as shown in Figure 5. In this case, the restoring force of the film during the releasing process is as follows:
where Pequi(λ) represents the Pequi under λ, and λ1 represents the stretched state ratio. In addition, λk represents the released state ratio when the recovery force of the film drops to 0 and the film cannot continue to shrink. λk can be calculated as follows:
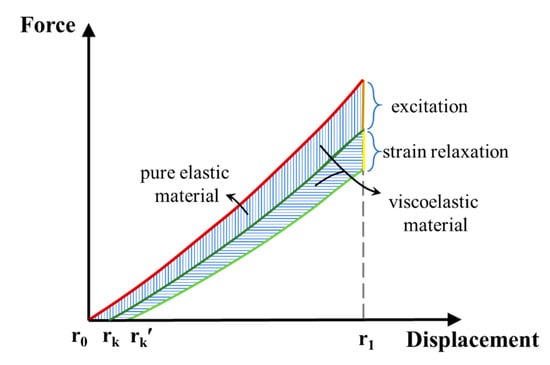
Figure 5.
Force-displacement curve of the DEG under different elasticity conditions.
2.3. The Description of Electrical Loss Behavior
Equation (14) describes the single-cycle generated energy without charge loss. However, the DE film is not an ideal insulator, so the charge will be consumed due to the tiny leakage current inside the DE. The leakage of charge is a continuous process which occurs from the charging of the DE film to the release of the charge.
Figure 6 shows the force-displacement curve under three different charge leakage conditions: (a) leakage-free condition, (b) actual condition and (c) leakage-first condition. The differences of these conditions are mainly exhibited in the release process. At the beginning of the release process (λ1, F1), since no charge has been consumed yet, the restoring force in the actual condition is equal to that in the leakage-free condition. During the release process, the continuous leakage of charge causes the voltage in the actual condition to be relatively lower than that in the leakage-free condition, that is, the Maxwell stress across the film during the actual condition is relatively low. Therefore, the restoring force in the actual condition is higher than that in the leakage-free condition. Therefore, the rk of the actual condition (marked as rk2) is smaller than the that of leakage-free condition (marked as rk1), that is, rk2 < rk1. Since the voltage and area of the film are constantly changing, other parameters, such as the stretching rate and time must be introduced in order to accurately express the charge leakage, which greatly complicates the model. To simplify the model, the charge leakage ratio δ is defined as the percentage of the leakage charge in the input charge. The higher conductivity of the DE material results in the higher leakage current. Therefore, δ is positively related to the conductivity of DE material, which is used to describe the electrical loss behavior of the material. δ can be calculated by the following formula:
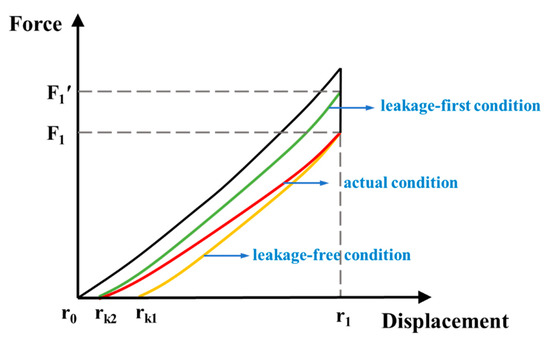
Figure 6.
Force-displacement curve of the DEG under different charge leakage conditions.
At the end of the release process, the voltage across the DE film becomes:
Therefore, the actual single-cycle generated energy that takes the electrical loss into account can be rewritten from Equation (1) as:
Under the definition of δ, the “leakage-first” condition is constructed, which means that the DE loses δ of the charge at the beginning of the process, and then the release process is performed with a constant charge. At the beginning of the release process, since no charge has been consumed yet in the actual condition, the voltage and the Maxwell stress in the actual condition are higher than that in the leakage-first condition, that is, F1 < F1′. As the film releases, the continuous leakage of the charge causes a decrease in the difference in the restoring force between the actual and leakage-first condition. Finally, when the restoring force in both cases drops to 0, the charge leakage ratio of both cases is δ, so the actual condition curve and the leakage-first condition curve intersect at the point (rk2, 0). Clearly, the release curve in the actual process is between that in the leakage-first condition and the leakage-free condition, so the average value of Wr in the leakage-first condition and leakage-free condition can be used to approximate the Wr in actual condition, which is:
2.4. The Model of Energy Harvesting Performances of DEG
By combining Equations (2) and (15), and Equations (5), (10), (12) and (16), the model on the energy-harvesting performances of the DEG can be obtained. ΔU and Wmech can be written as:
where r0, z0, M, θ, δ and εr represent the initial radius, initial thickness, elastic coefficient, stress relaxation ratio, charge leakage ratio and permittivity of DE film, respectively; and V1, λ1, λ, λk1 and λk2 represent bias voltage, stretch ratio, stretched state ratio and released state ratio without or with charge leakage, respectively. λk1 and λk2 can be obtained by:
3. Results and Discussion
3.1. Experimental Validation
Before further exploration, the actual energy-harvesting performance of the VHB4905 material was measured under a homemade test platform in Section S1.3 in the Supporting Information and then compared with simulation results to verify the accuracy of the proposed model. The materials parameters used in the simulation were obtained by the characterization of VHB4905 (see Sections S2.1–S2.5 and Table S1 in Supporting Information). The experimental and simulated energy density and electromechanical conversion efficiency of the VHB4905 material under λ1 = 2 and different V1 values are shown in Figure 7. The results show that the error between the experimental value and simulated value of the energy density and conversion efficiency was less than 15% and 20%, respectively. These favorable results verify the feasibility of the proposed model in describing the relationship between the intrinsic properties of DE material and the energy-harvesting performances of the DEG. Moreover, the results indicate that the proposed model can predict the energy-harvesting performances of the DE.
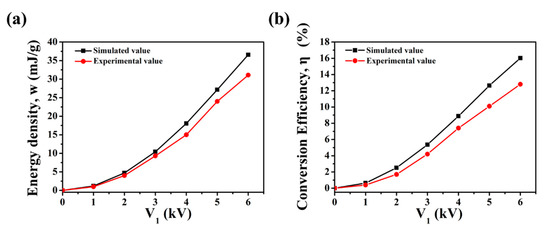
Figure 7.
The experimental and simulated (a) energy density and (b) electromechanical conversion efficiency of the VHB4905 material under λ1 = 2 and different V1 values.
It should be mentioned that the focus of this study is to establish the relationship between the intrinsic properties of materials and energy-harvesting performances, so some of the assumptions and approximations used in this model sacrifice accuracy. First, the linear elastic model with stress relaxation parameter is obviously different from the actual stretch-release process, so there is a certain error in the calculation of input mechanical work. Second, some studies have shown that the dielectric constant of the material changes with tension [38,39]. The dielectric constant was set as a constant in this model, which led to a certain error in the calculation of generated energy. The above factors will lead to an error between the model and the experimental value.
3.2. Influences of Intrinsic Properties of DE Materials on Energy-Harvesting Performance
The parameters related to the material properties in the model include the elastic coefficient M, stress relaxation ratio θ, permittivity εr, bias voltage V1, stretched state ratio λ1 and charge leakage ratio δ. As explained in Section 2, the influences of the above six variables on the simulation results correspond to the influences of the modulus, viscoelasticity, permittivity, breakdown field strength, elongation at break and conductivity on the energy-harvesting performances, respectively. The six variables were divided into two groups: V1, θ and δ as one group, and permittivity εr, elastic coefficient M and stretched state ratio λ1 as the other group. The influences of each variable on the energy-harvesting performances were studied separately.
To provide better guidance for preparing high-performance DE materials for the DEG, the values of these variables for the simulation were chosen according to experimental values. The shape of the DE film and the variables used in the simulation of energy-harvesting performances are shown in Table 1. Since the VHB material has atypical and serious viscoelasticity loss, the setting of θ value in this work refers to silicone rubber with high elasticity. The stress relaxation rate of the silicone rubber is around 0.05 to 0.10 [40]. Referring to this value, we set 0, 0.05 and 0.1, respectively, indicating no mechanical loss, high elastic material and moderate elastic material.

Table 1.
Summary of the shape of the DE film and variables in this study.
The energy-harvesting performances of DE materials under different bias voltage V1, stress relaxation ratio θ and charge leakage ratio δ. The other three variables are fixed (elastic coefficient M = 0.2 MPa, permittivity εr = 4.2, stretched state ratio λ1 = 2). Figure 8a shows the influences of the three variables above on the single-cycle generated energy ΔU. The increase in V1 greatly enhanced ΔU. The increase in V1 from 1 kV to 5 kV caused am increase in ΔU of 24 times. This is because the increase in V1 increased the work done by the Maxwell stress during the releasing process by enhancing the Maxwell stress. Thus, more mechanical energy can be converted into electrical energy. This also means that under the same film thickness, DE with higher breakdown strength can withstand a higher V1, which is able to obtain a higher ΔU. ΔU was significantly affected by charge leakage. Even a small charge leakage of 0.05 resulted in a significant decrease in ΔU of about 25%. Therefore, DE with lower conductivity can increase ΔU in the form of reducing charge leakage. The increase in θ increased the reduction of restoring force during the stress relaxation process, which increased λk as well as C2, and thus decreased ΔU. ΔU was not sensitive to stress relaxation, but the effect of θ on ΔU increased with the increase in V1. In the case of V1 = 1 kV, δ = 0.05 and θ = 0.05, ΔU decreased by 2.9%. In the case of V1 = 5 kV, δ = 0.05 and θ = 0.05, ΔU decreased by 4.3%. Although ΔU was less affected by θ, DE with lower stress relaxation characteristics can obtain higher power generation, that is to say, high elasticity is needed for the ideal DE.
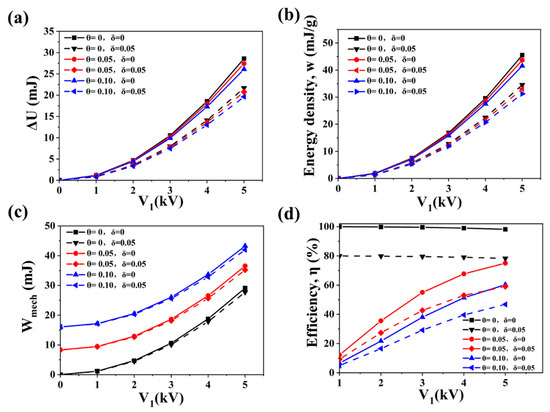
Figure 8.
Influences of bias voltage V1, stress relaxation ratio θ and charge leakage ratio δ on the energy-harvesting performances of DE materials: (a) generated energy, (b) energy density, (c) input mechanical work, (d) electromechanical conversion efficiency. The abscissa represents the bias voltage; the black, blue and red curves represent the θ = 0, 0.05, 0.1, respectively; and the solid line and the dashed line represent the δ = 0 and 0.05, respectively.
Figure 8b shows the influences of V1, θ and δ on the energy density w. The energy density was obtained by dividing ΔU by the mass of the DE in the effective working area, which reflected the energy-harvesting performance of DE per unit mass. The mass of the effective working area of DE remained unchanged under different variables. Therefore, the influences of the variables on the energy density were very similar to that on ΔU, except the scale of the ordinate was different. Similarly, the increase in V1, and the decrease of δ or θ all resulted in the increase in the energy density. Therefore, low conductivity, high breakdown strength and high elasticity are needed for DE materials with high energy density.
Figure 8c shows the variation of input mechanical work Wmech with V1, θ and δ. The increase in V1 increases the λk through enhancing the Maxwell stress, thus reduces the external work done by the film during the release process, which in turn leads to an increase in Wmech. The increase in θ greatly increases the Wmech, which reflects the energy loss caused by molecular chain rearrangement and slippage during the stretch-release process, and it is especially significant under low V1. In the case of low V1, the increase in Wmech caused by θ is much higher than that caused by the V1. This means that most of Wmech is consumed due to the viscoelastic loss, and only a small amount of Wmech has been converted into electrical energy. The increase in δ slightly reduces the Wmech. This is because the charge leakage reduces the work done by Maxwell stress, as analyzed in Section 2.3.
Figure 8d shows the influences of V1, θ and δ on the conversion efficiency η. The conversion efficiency was obtained by dividing ΔU by the input mechanical work Wmech. η decreased with the increase in δ. Compared with the condition of δ = 0, δ = 0.05 will result in a decrease in η of nearly 20%. This is because the increase in δ greatly reduces ΔU but less affects Wmech. Since the increase in θ had little effect on ΔU but largely increased Wmech, η also decreased with the increase in θ. For example, under V1 = 1 kV and δ = 0.05, more Wmech will be consumed in the viscoelastic loss by increasing θ, so the value of η drops from 79.97% (θ = 0) to 9.27% (θ = 0.05), and further reduces to 4.93% (θ = 0.1). This shows that using low elastic materials at low bias voltages is an inefficient way of harvesting energy. The change of η with V1 varied with the value of θ. In the case of θ = 0, no energy was consumed in the mechanical loss, and η decreased slightly with the increase in V1. In the case of θ ≠ 0, a large amount of the mechanical work was consumed in the mechanical loss, and the increase in V1 enlarged the Maxwell stress, thus increasing the proportion of the work done by the Maxwell stress to Wmech during the conversion process, so the η was improved. The value of η gradually increased from 4.93% (V1 = 1 kV, δ = 0.05, θ = 0.1) to 46.79% (V1 = 5 kV, δ = 0.05, θ = 0.1). Therefore, the high breakdown strength, high elasticity and low conductivity of the material are of great significance for achieving high η.
Figure 9 shows the energy-harvesting performances of DE materials with different elastic coefficient M, permittivity εr and stretched state ratio λ1 under different V1 values. It is noticed that the black “Reference” curve represents the DE with the fitting conditions of εr = 4.2, M = 0.2 MPa, λ1 = 2; the red “M = 0.1 MPa” curve represents the DE with the fitting conditions of εr = 4.2, M = 0.1 MPa, λ1 = 2; the bule “εr = 8.4” curve represents the DE with the fitting conditions of εr = 8.4, M = 0.2 MPa, λ1 = 2; amd the green “λ1 = 3” curve represents the DE with the fitting conditions of εr = 4.2, M = 0.2 MPa, λ1 = 3. The other two variables were fixed (θ = 0.05, δ = 0.05).
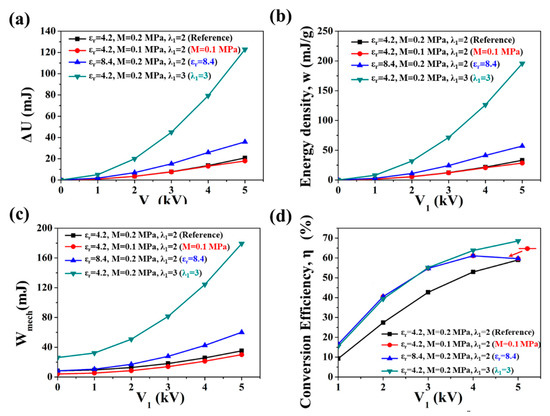
Figure 9.
Influences of elastic coefficient M, permittivity εr and stretched state ratio λ1 on the energy-harvesting performances of materials with under different V1: (a) generated energy, (b) energy density, (c) input mechanical work, (d) electromechanical conversion efficiency. The black “Reference” curve represents the material with fitting conditions of εr = 4.2, M = 0.2 MPa, λ1 = 2; the red curve represents the material with fitting conditions of εr = 4.2, M = 0.1 MPa, λ1 = 2; the blue curve represents the material with fitting conditions of εr = 8.4, M = 0.2 MPa, λ1 = 2; the green curve represents the material with fitting conditions of εr = 4.2, M = 0.2 MPa, λ1 = 3.
Figure 9a shows the influences of M, εr and λ1 on ΔU under different V1 values. Since the increase in both εr and λ1 increased the Maxwell stress, and the increase in λ1 also enlarged the stretch displacement, ΔU increased with the increase in εr, and greatly increased with the increase in λ1. The simulation results show that under V1 = 5 kV, the increase in εr to 2 times that of the reference sample caused the increase in ΔU from 20.77 mJ (Reference) to 35.84 mJ (εr = 8.4), an increase of 72.6%. The increase in λ1 from 2 to 3 caused the increase in ΔU from 20.77 mJ (Reference) to 122.84 mJ (λ1 = 3), an increase of 491%. On the other hand, the decrease in M led to a slight decrease in ΔU under low V1, but when ΔU reached V1 = 5 kV, the decrease in M by half caused the decrease in ΔU from 20.77 mJ (Reference) to 17.92 mJ (M = 0.1 MPa), a decrease of 13.8%. This is because the decrease in M had no effect on Maxwell stress, but it reduced the recovery force, which increased λk as well as the released state capacitance C2, thus reducing ΔU.
Figure 9b shows the influences of M, εr and λ1 on the energy density w under different V1 values. Similar to Figure 8b, the influences of variables on w was very similar to that on ΔU, except that the scale of the ordinate was different. Therefore, the energy density increased with the increase in εr, λ1 and M. The simulation results show that the material with the properties of θ = 0.05, δ = 0.05, εr = 4.2, M = 0.2 MPa, and λ1 = 3 can obtain a theoretical energy density of up to 195.61 mJ/g under V1 = 5 kV.
Figure 9c shows the influences of M, εr and λ1 on Wmech under different V1 values. The simulation results indicate that Wmech increased with the increase in M, εr and λ1. The reduction in M reduced the useless work due to the viscoelastic loss, thus reducing Wmech. For example, in the case of V1 = 5 kV, Wmech reduced from 35.20 mJ (Reference) to 30.04 mJ (M = 0.1 MPa), a decrease of 14.7%. The increase in εr indicatesan increase in Maxwell stress, which significantly increased Wmech. Except for the increase in the work done by the Maxwell stress, the increase in λ1 also increased the mechanical loss, and thus largely increased Wmech. In the case of V1 = 5 kV, the increase in εr to 2 times that of the reference sample caused the increase in Wmech from 35.20 mJ (Reference) to 60.08 mJ (εr = 8.4), an increase of 70.7%. The increase in λ1 from 2 to 3 caused the increase in Wmech from 35.20 mJ (Reference) to 179.20 mJ (λ1 = 3), an increase of 409%.
Figure 9d shows the influences of M, εr and λ1 on η under different V1 values. Increasing λ1 can effectively improve η, especially under low V1. In the case of V1 = 1 kV, η increases from 9.27% (Reference) to 15.48% (λ1 = 3), an increase of 66.9%. In the case of V1 = 5 kV, η increases from 59.00% (Reference) to 68.55% (λ1 = 3), an increase of 16.2%. Interestingly, the blue and red curves almost overlapped, which shows that the influence of reducing M by half on η had the equivalent effect as that of increasing εr by two-fold. The M and εr values in the fitting condition of the blue curve (M = 0.2 MPa, εr = 8.4) were twice those in red curve (M = 0.1 MPa, εr = 4.2). Through extracting M or εr, Equations (19) and (20) can be rewritten to Equations (21) and (22), respectively, from which λk1 and λk2 are equal in the two conditions under any V1 value.
Similarly, through extracting M or εr, Equations (17) and (18) can be rewritten as Equations (23) and (24), respectively.
Therefore, the ΔU and Wmech in the fitting condition of blue curve was twice of these in red curve under any V1, respectively. Thus, the value of η was the same under the two conditions. In this case, the two curves in the η graph vs. the V1 graph completely coincide. In addition, the η in these two fitting conditions first increased and then decreased with the increase in V1, reaching a maximum value of 61.11% at V1 = 4 kV. This indicates that DE with too high εr or too low M is not conducive to obtain high η under high working voltage since a premature “loss of tension” may occur [31]. Therefore, it is necessary to balance the relationship between Eb and εr or M when designing high-η materials: Under low E (lower than 32 kV/mm), it is suggested to enhance εr or reduce the modulus to improve η. Under high E (higher than 32 kV/mm), the ratio of εr and M of the DE should be tailored to optimize η, and the recommended εr/M value of the DE should be between 20/MPa and 40/MPa.
The results indicate that the ΔU and w were greatly affected by a small amount of charge leakage, but were not sensitive to mechanical loss property, so they could be significantly improved by increasing the insulation performance of the DE material. Wmech was less affected by charge leakage but was quite sensitive to mechanical loss. In addition, ΔU and w can be further enhanced with the increase in λ1 and εr. Appropriately reducing M is beneficial to improve η, but excessively low M will cause the reduction in η under high V1 since a premature “loss of tension” may occur. Since the reduction of the modulus and the increase in εr have equivalent effects on η, DE materials with high εr should have a moderate modulus. The recommended εr/M value of DE should be between 20/MPa and 40/MPa.
To sum up, high breakdown field strength, low conductivity and high elasticity of DE materials are the prerequisites for obtaining high energy density and conversion efficiency. DE materials with high elongation at break, high permittivity and moderate modulus can further improve the energy density and conversion efficiency of the DEG.
4. Conclusions
Herein, an electromechanical model of DEG was established to reveal the relationship between the intrinsic properties of DE materials and energy-harvesting performances. The good agreement between the simulation and experimental results was verified, indicating that this coupling model can well predict the energy-harvesting performance of the material under the preset conditions. By tailoring the fitting condition in the model, the relationship between the intrinsic properties of DE materials (including the modulus, elongation at break, mechanical loss property, permittivity, breakdown field strength and conductivity) and the energy-harvesting performances (including the energy density and conversion efficiency) of the DEG was revealed. The results indicate that DE materials with high breakdown field strength, low conductivity and high elasticity are the prerequisites for achieving high energy density and high conversion efficiency of the DEG. In addition, DE materials with high elongation at break, high permittivity and moderate modulus can further improve the energy density and conversion efficiency of the DEG.
Supplementary Materials
The following are available online at https://www.mdpi.com/article/10.3390/polym13234202/s1, Figure S1: Test platform contains equibiaxial stretching device, force/displacement sensor, digital electrometer, DC source and PC, Figure S2: Simulation of the elastic coefficient M of VHB4905 material. The slope of linear fitting curve of M = 0.2 MPa is adopted in simulation of the energy harvesting performances of VHB4905, Figure S3: The relationship between stress relaxation of VHB material and relaxation time under uniaxial strain of 100%. Stress relaxation ratio when time equal to 5s, that is θ = 0.35 is adopted in simulation of the energy harvesting performances of VHB4905, Figure S4: Permittivity vs. frequency graph of VHB4905. Permittivity under 100 Hz of εr = 4.2 is adopted in simulation of the energy harvesting performances of VHB4905, Figure S5: Calculated charge leakage ratio δ under different V1. Average value of δ is adopted in simulation of the energy harvesting performances of VHB4905, Table S1: Summary of value of DE film shape and variables in simulation of the energy harvesting performances of VHB4905.
Author Contributions
Conceptualization, Y.J. and M.T.; methodology, Y.J. and H.Y.; formal analysis, Y.J. and Y.L.; investigation, Y.J., Y.L. and N.N.; data curation, Y.L.; writing—original draft preparation, Y.J.; writing—review and editing, N.N.; supervision, L.Z., N.N. and M.T. All authors have read and agreed to the published version of the manuscript.
Funding
The authors are grateful for the financial support from the National Natural Science Foundation of China (Grant No. 51525301) and the Talent Cultivation of State Key Laboratory of Organic-Inorganic Composites (Nos. OIC-D2021002).
Institutional Review Board Statement
Not applicable.
Informed Consent Statement
Not applicable.
Data Availability Statement
The data presented in this study are available on request from the corresponding author.
Acknowledgments
The authors are grateful for the financial support from the National Natural Science Foundation of China (Grant No. 51525301) and the Talent Cultivation of State Key Laboratory of Organic-Inorganic Composites (Nos. OIC-D2021002).
Conflicts of Interest
The authors declare no conflict of interest.
References
- Osmani, B.; Seifi, S.; Park, H.S.; Leung, V.; Topper, T.; Muller, B. Nanomechanical probing of thin-film dielectric elastomer transducers. Appl. Phys. Lett. 2017, 111, 093104. [Google Scholar] [CrossRef] [Green Version]
- Brochu, P.; Pei, Q. Advances in dielectric elastomers for actuators and artificial muscles. Macromol. Rapid Commun. 2010, 31, 10–36. [Google Scholar] [CrossRef] [PubMed]
- Liu, X.; Sun, H.; Liu, S.; Jiang, Y.; Yu, B.; Ning, N.; Tian, M.; Zhang, L. Mechanical, dielectric and actuated properties of carboxyl grafted silicone elastomer composites containing epoxy-functionalized TiO2 filler. Chem. Eng. J. 2020, 393, 124791. [Google Scholar] [CrossRef]
- Chu, B.; Zhou, X.; Ren, K.; Neese, B.; Lin, M.; Wang, Q.; Bauer, F.; Zhang, Q. A dielectric polymer with high electric energy density and fast discharge speed. Science 2006, 313, 334–336. [Google Scholar] [CrossRef] [PubMed]
- Pelrine, R.E.; Kornbluh, R.D.; Joseph, J.P. Electrostriction of polymer dielectrics with compliant electrodes as a means of actuation. Sens. Actuators A Phys. 1998, 64, 77–85. [Google Scholar] [CrossRef]
- Carpi, F.; Anderson, I.; Bauer, S.; Frediani, G.; Gallone, G.; Gei, M.; Graaf, C.; Jean-Mistral, C.; Kaal, W.; Kofod, G.; et al. Standards for dielectric elastomer transducers. Smart Mater. Struct. 2015, 24, 105025. [Google Scholar] [CrossRef] [Green Version]
- Pelrine, R.; Kornbluh, R.; Eckerle, J.; Jeuck, P.; Oh, S.J.; Pei, Q.B.; Stanford, S. Dielectric elastomers: Generator mode fundamentals and applications. In Smart Structures and Materials 2001: Electroactive Polymer Actuators and Devices; BarCohen, Y., Ed.; Spie-Int Soc Optical Engineering: Bellingham, WA, USA, 2001; Volume 4329, pp. 148–156. [Google Scholar]
- Maas, J.; Graf, C. Dielectric elastomers for hydro power harvesting. Smart Mater. Struct. 2012, 21, 064006. [Google Scholar] [CrossRef]
- Kornbluh, R.D.; Pelrine, R.; Prahlad, H.; Wong-Foy, A.; McCoy, B.; Kim, S.; Eckerle, J.; Low, T. Dielectric elastomers: Stretching the capabilities of energy harvesting. MRS Bull. 2012, 37, 246–253. [Google Scholar] [CrossRef]
- Goudar, V.; Potkonjak, M. Dielectric Elastomer Generators for Foot Plantar Pressure Based Energy Scavenging. In Proceedings of the 11th IEEE Sensors Conference, Taipei, Taiwan, 28–31 October 2012; pp. 1001–1004. [Google Scholar]
- Bortot, E.; Gei, M. Harvesting energy with load-driven dielectric elastomer annular membranes deforming out-of-plane. Extrem. Mech. Lett. 2015, 5, 62–73. [Google Scholar] [CrossRef]
- Chen, S.E.; Deng, L.; He, Z.C.; Li, E.; Li, G.Y. Temperature effect on the performance of a dissipative dielectric elastomer generator with failure modes. Smart Mater. Struct. 2016, 25, 55017. [Google Scholar] [CrossRef]
- Zhang, C.L.; Lai, Z.H.; Rao, X.X.; Zhang, J.W.; Yurchenko, D. Energy harvesting from a novel contact-type dielectric elastomer generator. Energy Convers. Manag. 2020, 205, 112351. [Google Scholar] [CrossRef]
- Zhang, C.L.; Lai, Z.H.; Zhang, G.Q.; Yurchenko, D. Energy harvesting from a dynamic vibro-impact dielectric elastomer generator subjected to rotational excitations. Nonlinear Dyn. 2020, 102, 1271–1284. [Google Scholar] [CrossRef]
- Moretti, G.; Righi, M.; Vertechy, R.; Fontana, M. Fabrication and Test of an Inflated Circular Diaphragm Dielectric Elastomer Generator Based on PDMS Rubber Composite. Polymers 2017, 9, 283. [Google Scholar] [CrossRef] [PubMed] [Green Version]
- Jiang, Y.; Liu, S.; Zhong, M.; Zhang, L.; Ning, N.; Tian, M. Optimizing energy harvesting performance of cone dielectric elastomer generator based on VHB elastomer. Nano Energy 2020, 71, 104606. [Google Scholar] [CrossRef]
- McKay, T.; O’Brien, B.; Calius, E.; Anderson, I. Self-priming dielectric elastomer generators. Smart Mater. Struct. 2010, 19, 055025. [Google Scholar] [CrossRef]
- Wang, H.; Zhu, Y.; Wang, L.; Zhao, J. Experimental investigation on energy conversion for dielectric electroactive polymer generator. J. Intell. Mater. Syst. Struct. 2012, 23, 885–895. [Google Scholar]
- Wang, H.; Wang, C.; Yuan, T. On the energy conversion and efficiency of a dielectric electroactive polymer generator. Appl. Phys. Lett. 2012, 101, 033904. [Google Scholar] [CrossRef]
- McKay, T.; O’Brien, B.; Calius, E.; Anderson, I. An integrated, self-priming dielectric elastomer generator. Appl. Phys. Lett. 2010, 97, 062911. [Google Scholar] [CrossRef] [Green Version]
- Moretti, G.; Rosset, S.; Vertechy, R.; Anderson, I.; Fontana, M. A Review of Dielectric Elastomer Generator Systems. Adv. Intell. Syst. 2020, 2, 2000125. [Google Scholar] [CrossRef]
- Shian, S.; Huang, J.; Zhu, S.; Clarke, D.R. Optimizing the electrical energy conversion cycle of dielectric elastomer generators. Adv. Mater. 2014, 26, 6617–6621. [Google Scholar] [CrossRef]
- Fan, P.; Chen, H. Optimizing the Energy Harvesting Cycle of a Dissipative Dielectric Elastomer Generator for Performance Improvement. Polymers 2018, 10, 1341. [Google Scholar] [CrossRef] [Green Version]
- Yin, G.; Yang, Y.; Song, F.; Renard, C.; Dang, Z.; Shi, C.; Wang, D. Dielectric elastomer generator with improved energy density and conversion efficiency based on polyurethane composites. ACS Appl. Mater. Interfaces 2017, 9, 5237–5243. [Google Scholar] [CrossRef]
- Pan, C.; Markvicka, E.J.; Malakooti, M.H.; Yan, J.; Hu, L.; Matyjaszewski, K.; Majidi, C. A Liquid-Metal-Elastomer Nanocomposite for Stretchable Dielectric Materials. Adv. Mater. 2019, 31, e1900663. [Google Scholar] [CrossRef] [PubMed]
- Yang, D.; Xu, Y.; Ruan, M.; Xiao, Z.; Guo, W.; Wang, H.; Zhang, L. Improved electric energy density and conversion efficiency of natural rubber composites as dielectric elastomer generators. AIP Adv. 2019, 9, 025035. [Google Scholar] [CrossRef] [Green Version]
- Yang, Y.; Gao, Z.; Yang, M.; Zheng, M.; Wang, D.; Zha, J.; Wen, Y.; Dang, Z. Enhanced energy conversion efficiency in the surface modified BaTiO3 nanoparticles/polyurethane nanocomposites for potential dielectric elastomer generators. Nano Energy 2019, 59, 363–371. [Google Scholar] [CrossRef]
- Ellingford, C.; Zhang, R.; Wemyss, A.M.; Zhang, Y.; Brown, O.B.; Zhou, H.; Keogh, P.; Bowen, C.; Wan, C. Self-Healing Dielectric Elastomers for Damage-Tolerant Actuation and Energy Harvesting. ACS Appl. Mater. Interfaces 2020, 12, 7595–7604. [Google Scholar] [CrossRef] [PubMed]
- Zhang, L.; Song, F.L.; Lin, X.; Wang, D.R. High-dielectric-permittivity silicone rubbers incorporated with polydopamine-modified ceramics and their potential application as dielectric elastomer generator. Mater. Chem. Phys. 2020, 241, 7. [Google Scholar] [CrossRef]
- Koh, S.J.A.; Keplinger, C.; Li, T.; Bauer, S.; Suo, Z. Dielectric elastomer generators: How much energy can be converted? IEEE/ASME Trans. Mechatron. 2011, 16, 33–41. [Google Scholar] [CrossRef]
- Koh, S.J.A.; Zhao, X.; Suo, Z. Maximal energy that can be converted by a dielectric elastomer generator. Appl. Phys. Lett. 2009, 94, 262902. [Google Scholar] [CrossRef] [Green Version]
- Foo, C.C.; Koh, S.J.A.; Keplinger, C.; Kaltseis, R.; Bauer, S.; Suo, Z. Performance of dissipative dielectric elastomer generators. J. Appl. Phys. 2012, 111, 094107. [Google Scholar]
- Eilaghi, A.; Flanagan, J.G.; Tertinegg, I.; Simmons, C.A.; Brodland, G.W.; Ethier, C.R. Biaxial mechanical testing of human sclera. J. Biomech. 2010, 43, 1696–1701. [Google Scholar] [PubMed]
- Ehabe, E.; Bonfils, F.; Aymard, C.; Akinlabi, A.K.; Sainte Beuve, J. Modelling of Mooney viscosity relaxation in natural rubber. Polym. Test. 2005, 24, 620–627. [Google Scholar] [CrossRef]
- Oman, S.; Nagode, M. Observation of the relation between uniaxial creep and stress relaxation of filled rubber. Mater. Des. 2014, 60, 451–457. [Google Scholar]
- TuanDung, N.; Li, J.; Sun, L.; DanhQuang, T.; Xuan, F. Viscoelasticity Modeling of Dielectric Elastomers by Kelvin Voigt-Generalized Maxwell Model. Polymers 2021, 13, 2203. [Google Scholar]
- Carniel, E.L.; Fontanella, C.G.; Stefanini, C.; Natali, A.N. A procedure for the computational investigation of stress-relaxation phenomena. Mech. Time-Depend. Mater. 2013, 17, 25–38. [Google Scholar] [CrossRef]
- Kofod, G. The static actuation of dielectric elastomer actuators: How does pre-stretch improve actuation? J. Phys. D Appl. Phys. 2008, 41, 215405. [Google Scholar] [CrossRef]
- Vu-Cong, T.; Jean-Mistral, C.; Sylvestre, A. Impact of the nature of the compliant electrodes on the dielectric constant of acrylic and silicone electroactive polymers. Smart Mater. Struct. 2012, 21, 105036. [Google Scholar] [CrossRef]
- Cha, H.-S.; Yu, B.; Lee, Y.-K. Changes in stress relaxation property and softness of soft denture lining materials after cyclic loading. Dent. Mater. 2011, 27, 291–297. [Google Scholar] [CrossRef] [PubMed]
Publisher’s Note: MDPI stays neutral with regard to jurisdictional claims in published maps and institutional affiliations. |
© 2021 by the authors. Licensee MDPI, Basel, Switzerland. This article is an open access article distributed under the terms and conditions of the Creative Commons Attribution (CC BY) license (https://creativecommons.org/licenses/by/4.0/).