
Synthesis and Characterization of Activated Carbon Fibers Derived from Linear Low-Density Polyethylene Fibers Stabilized at a Low Temperature


Abstract

1. Introduction
2. Experiment Details
2.1. Materials and Methods
2.2. Characterizations
3. Results and Discussion
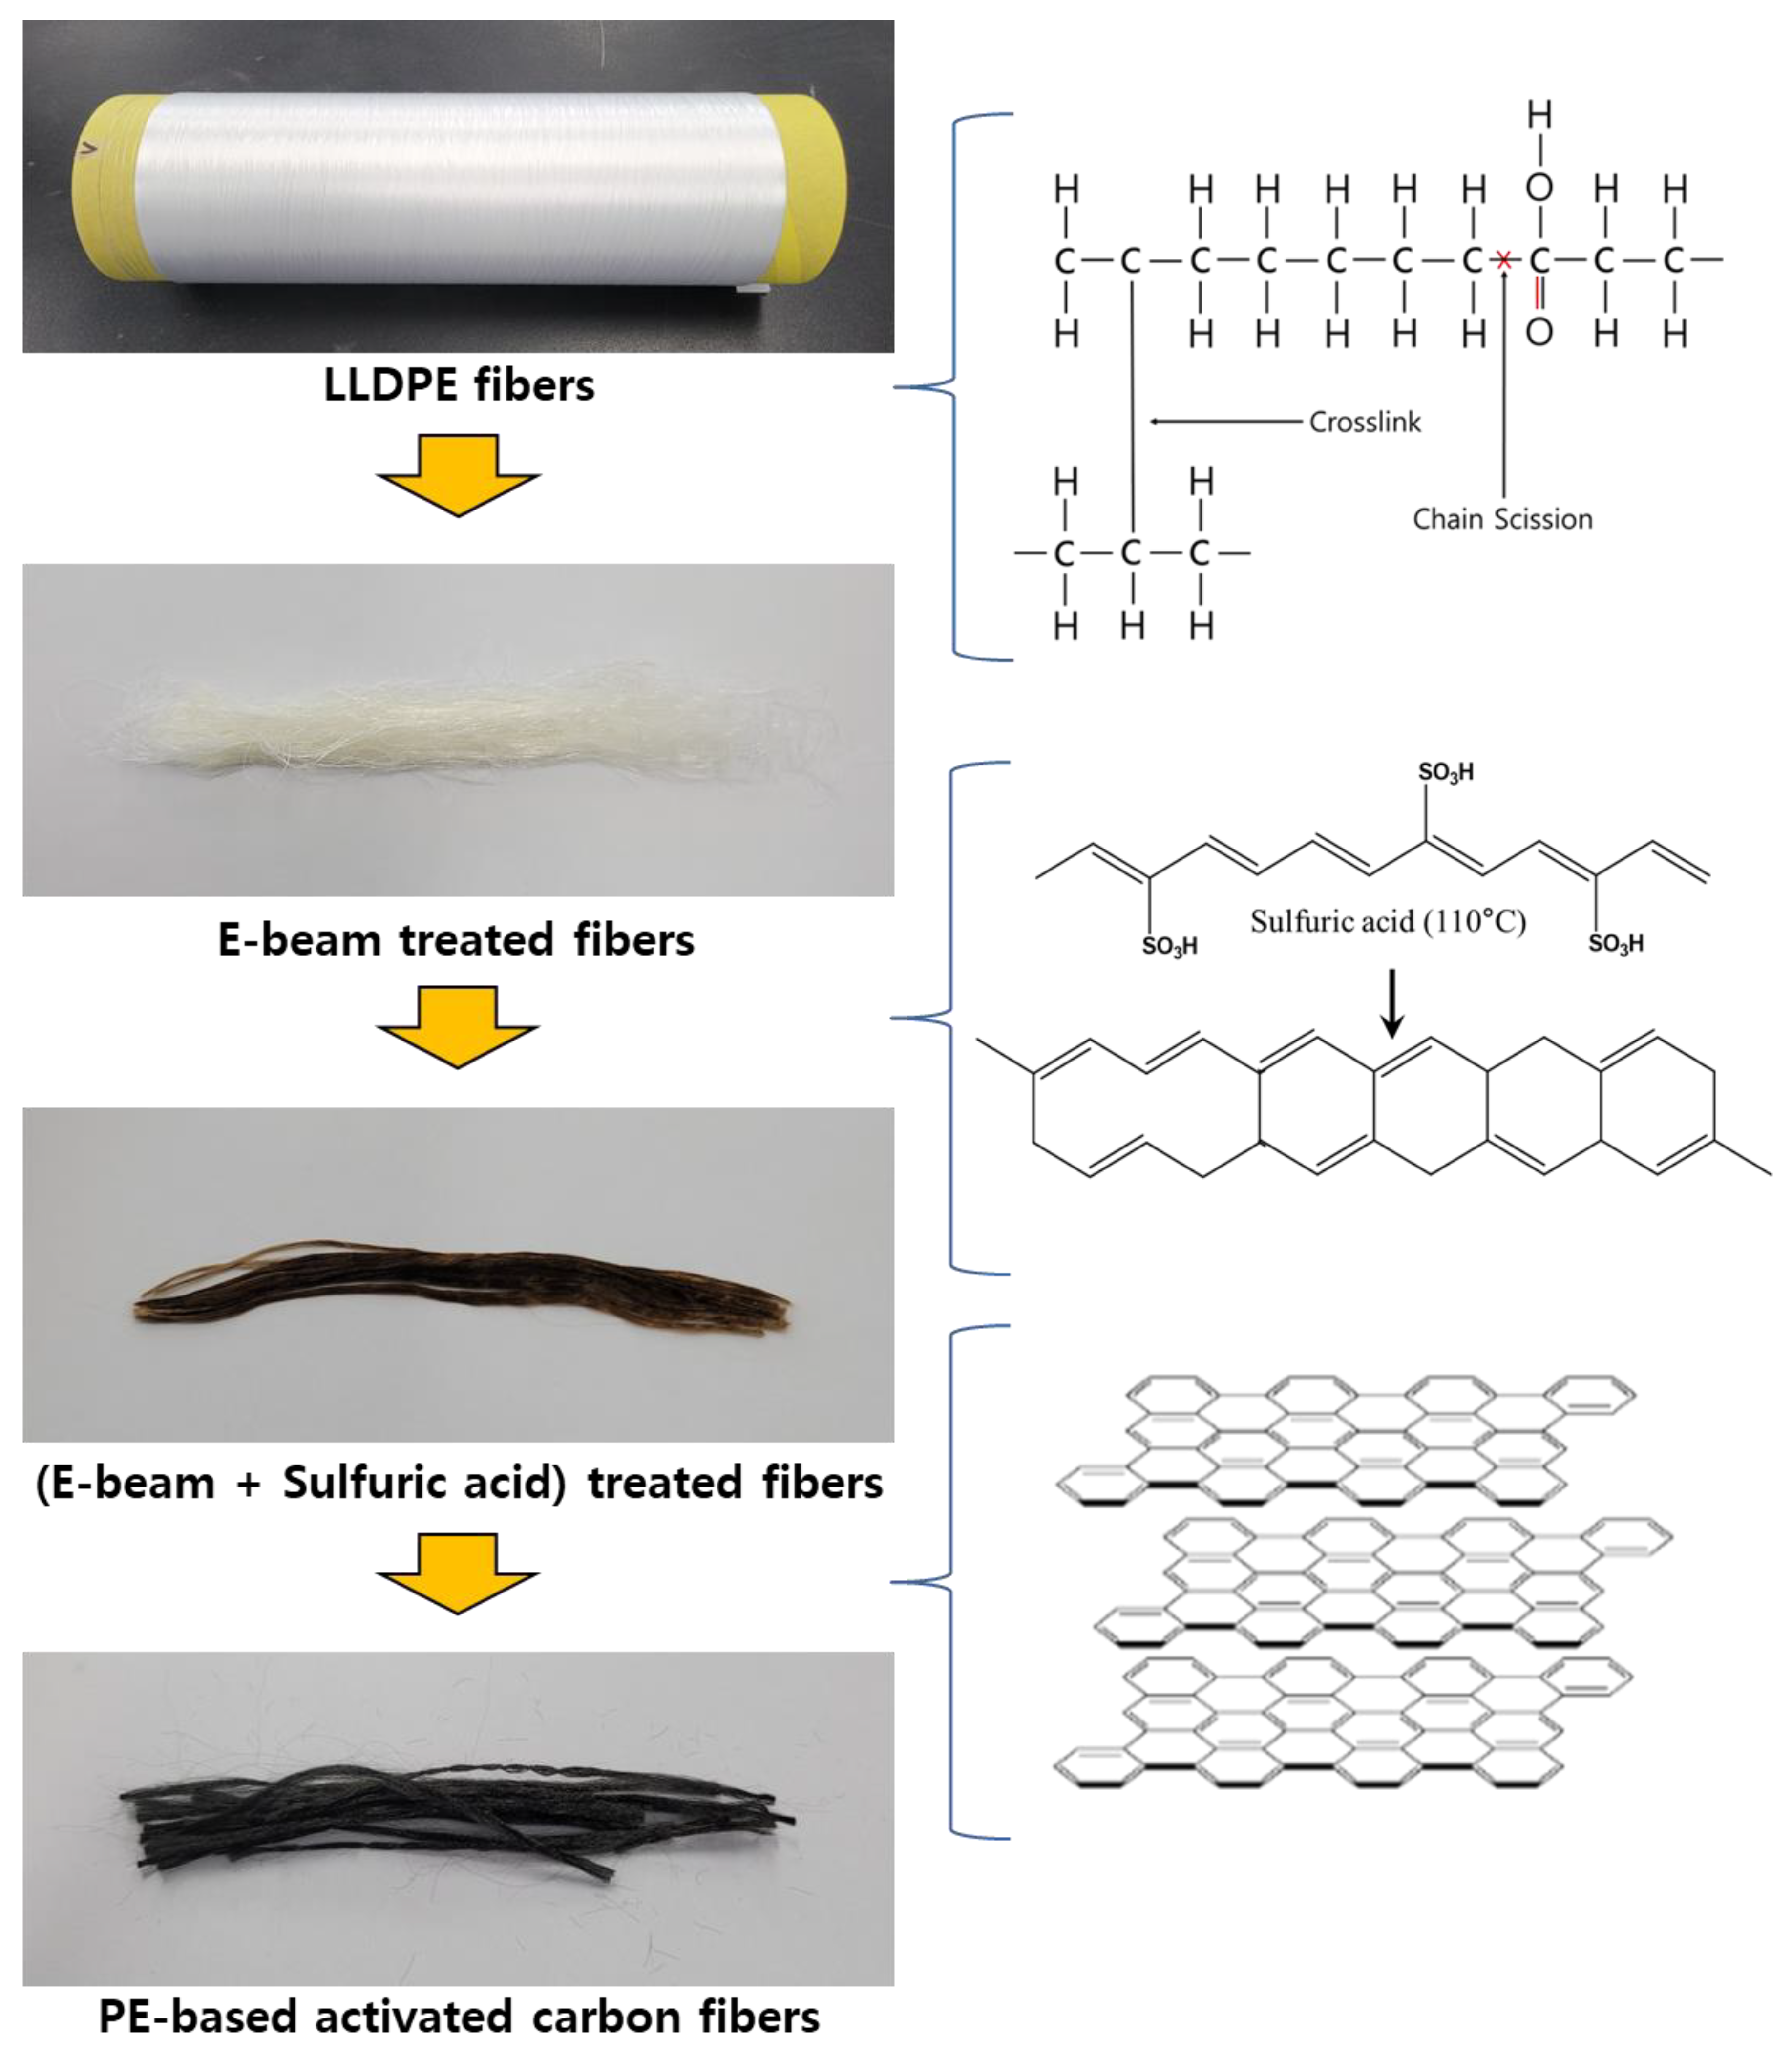
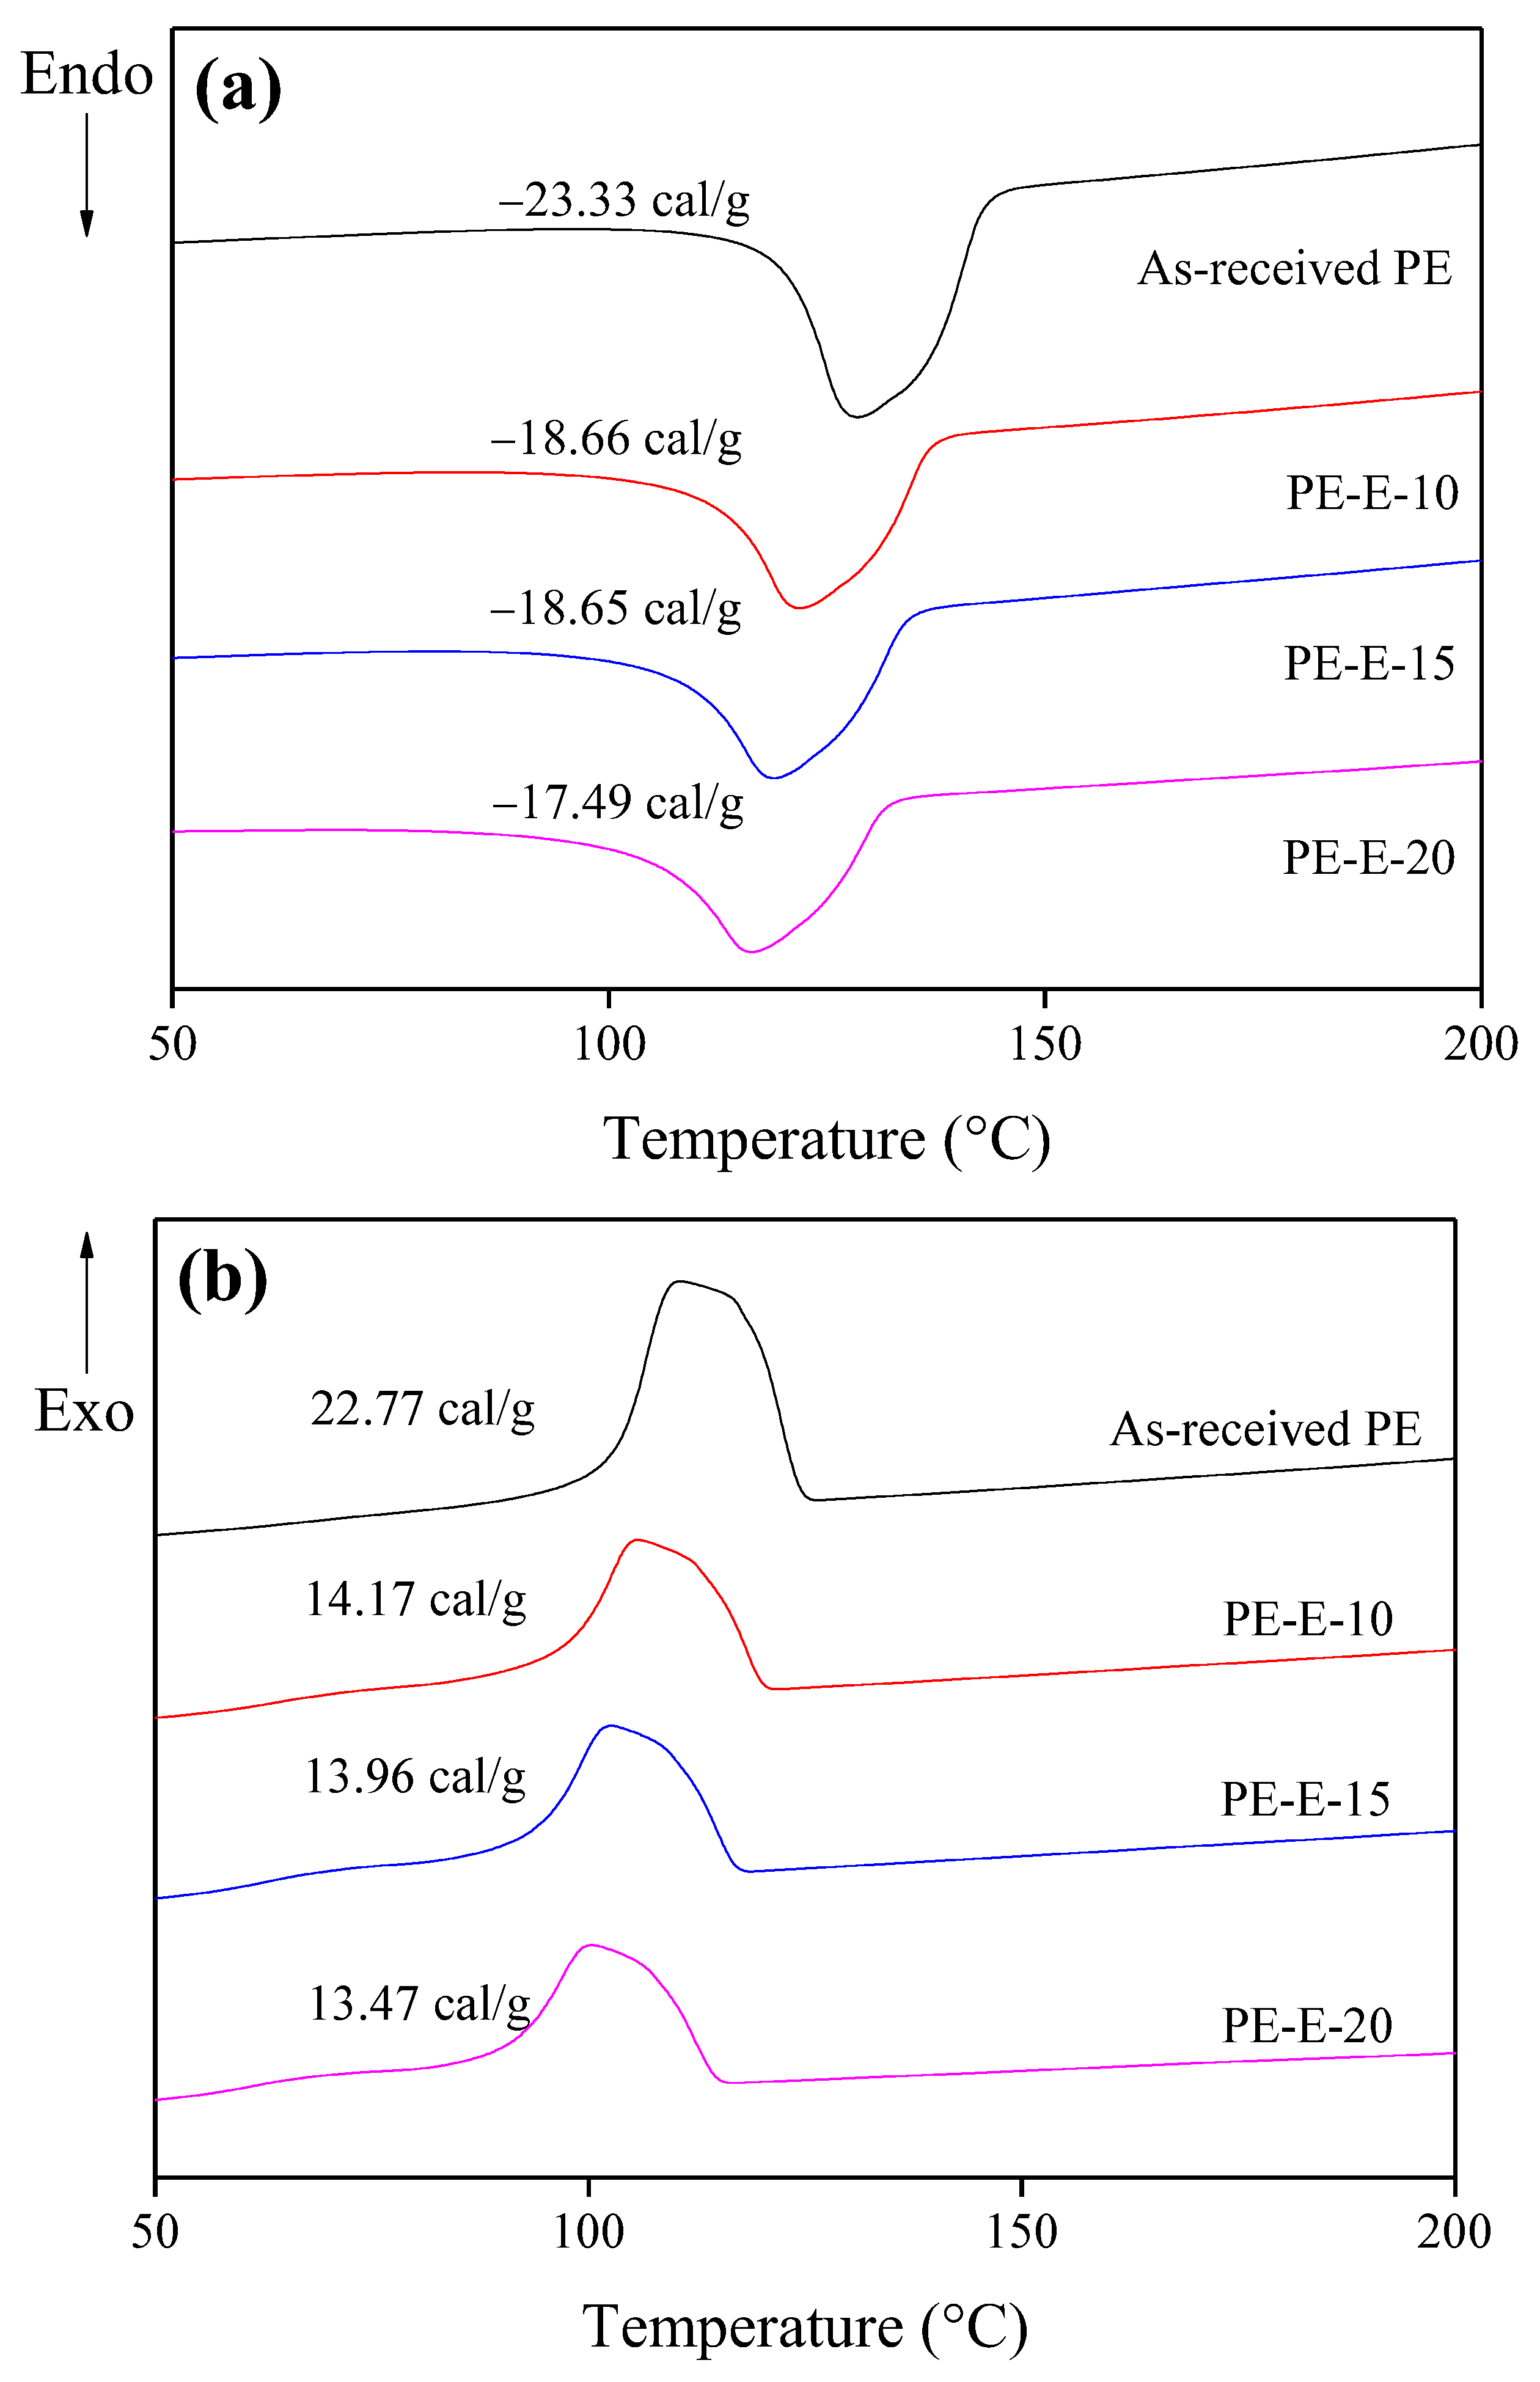
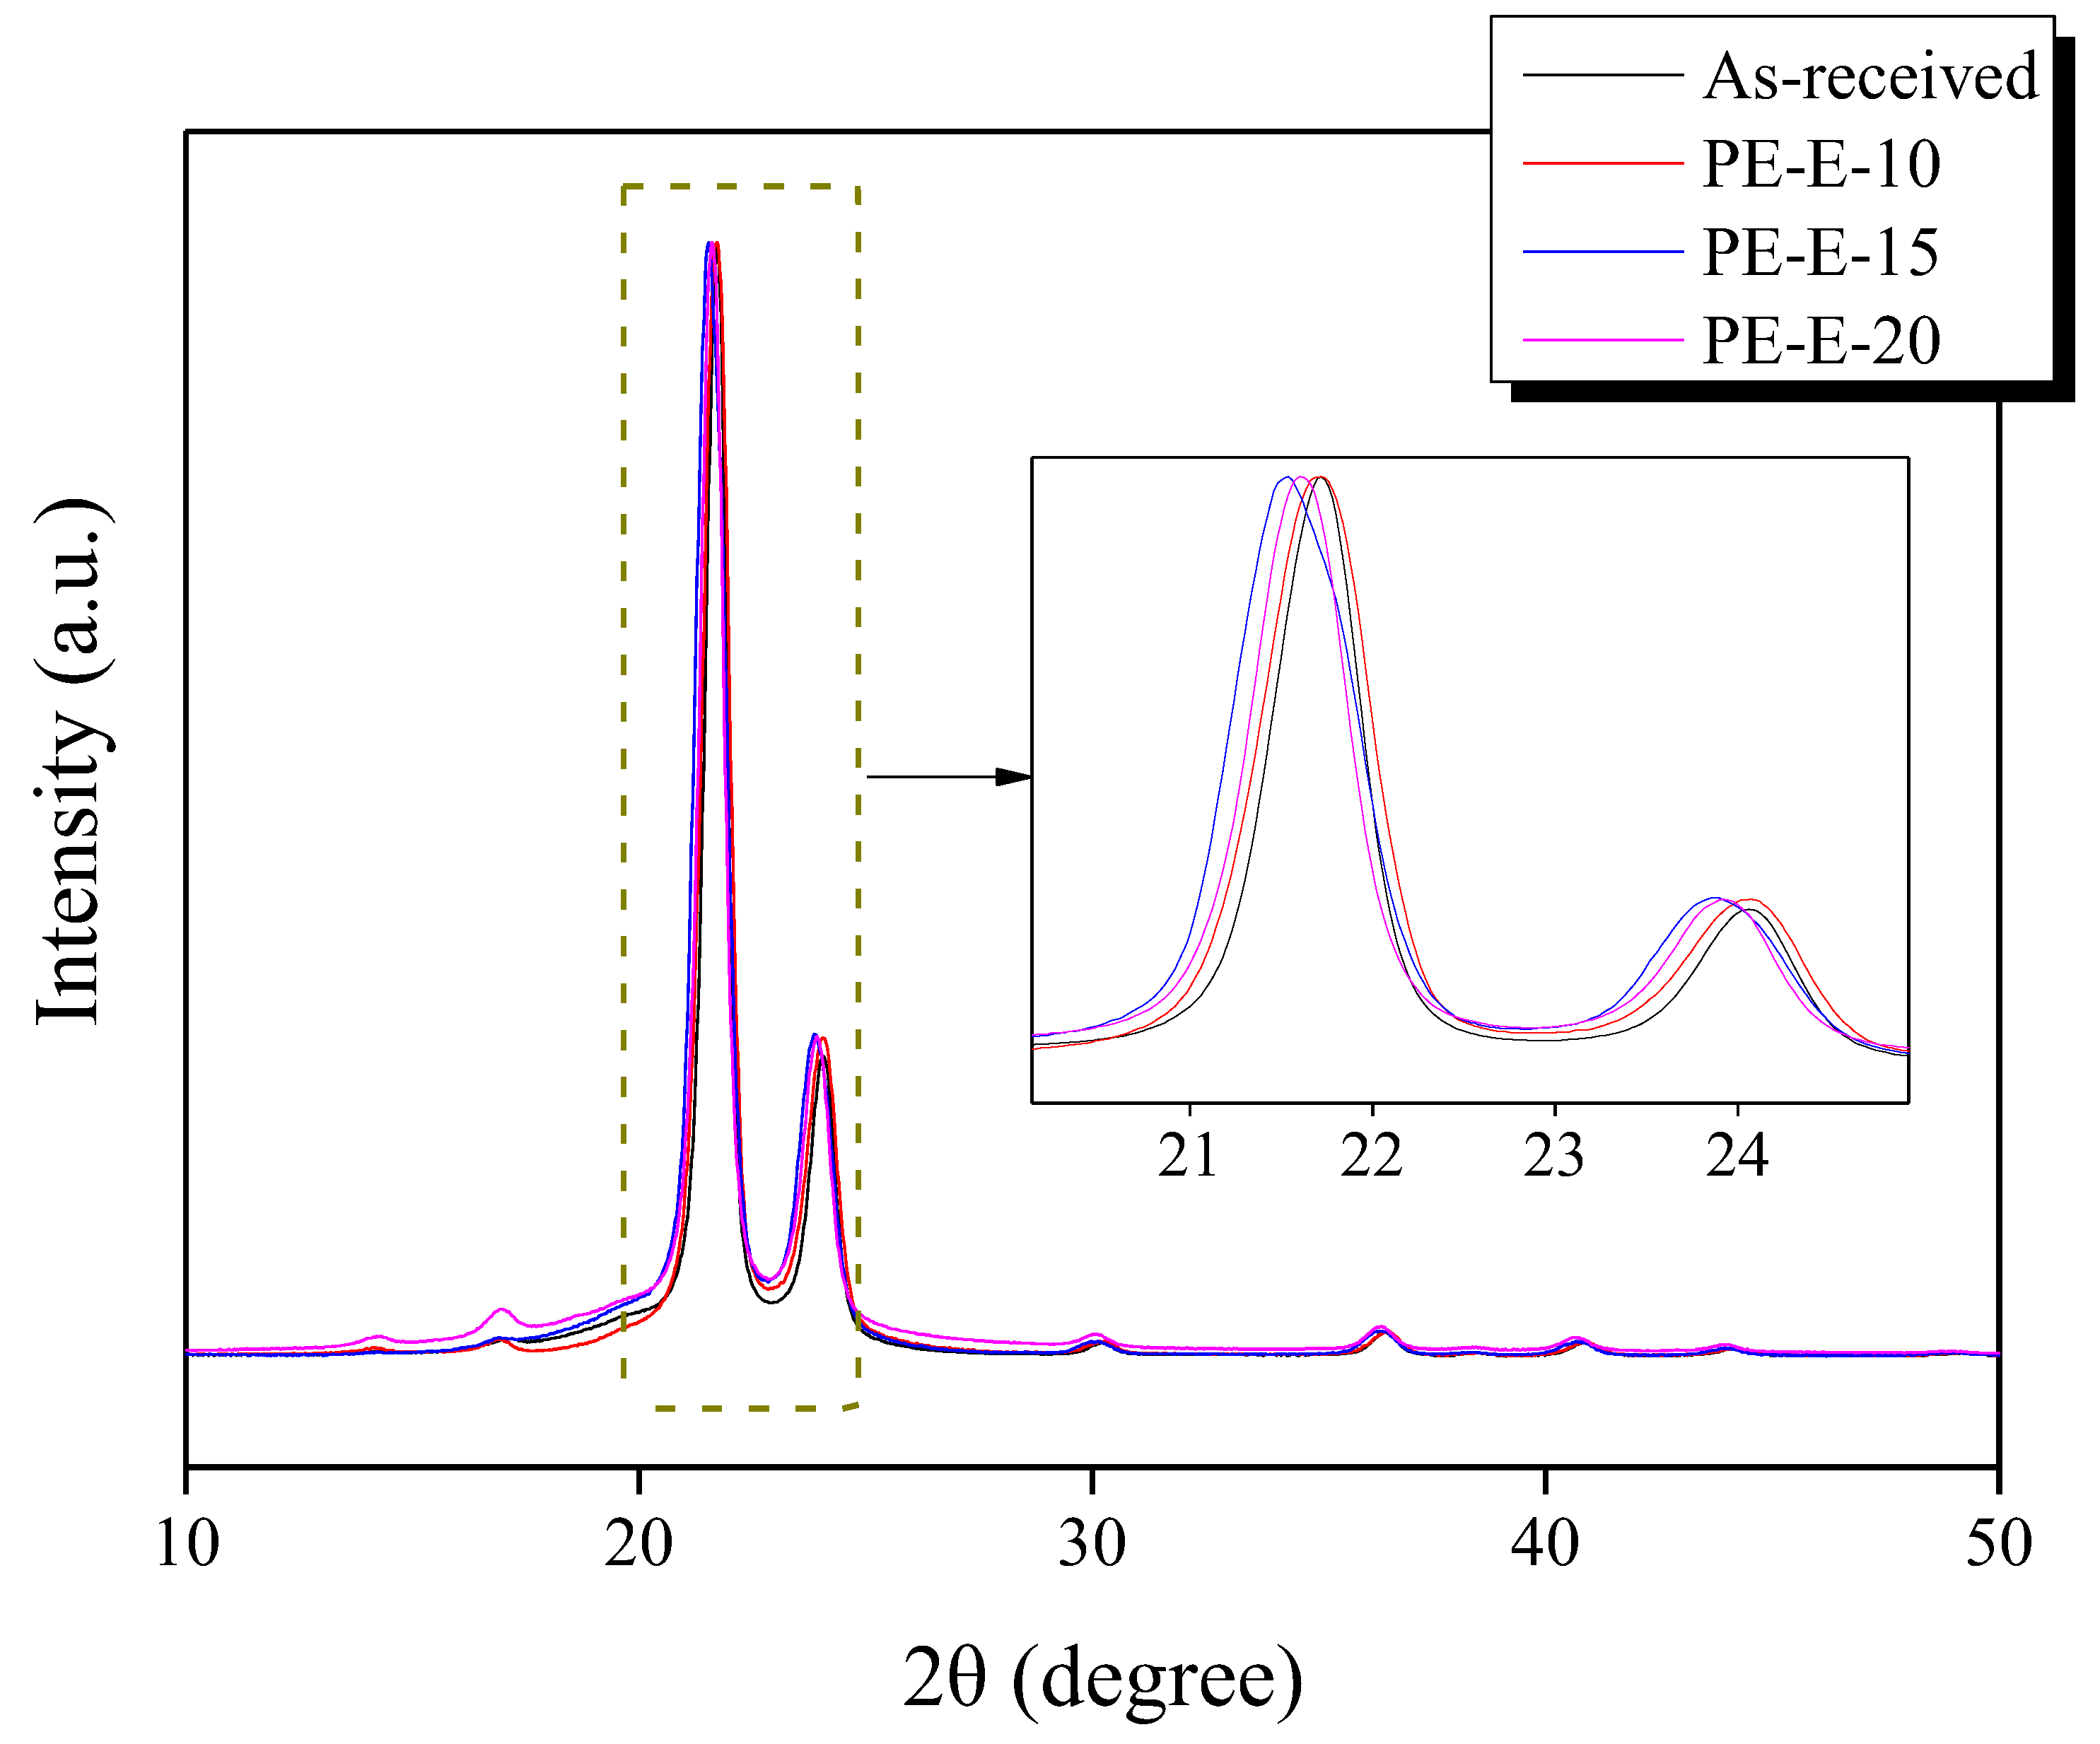
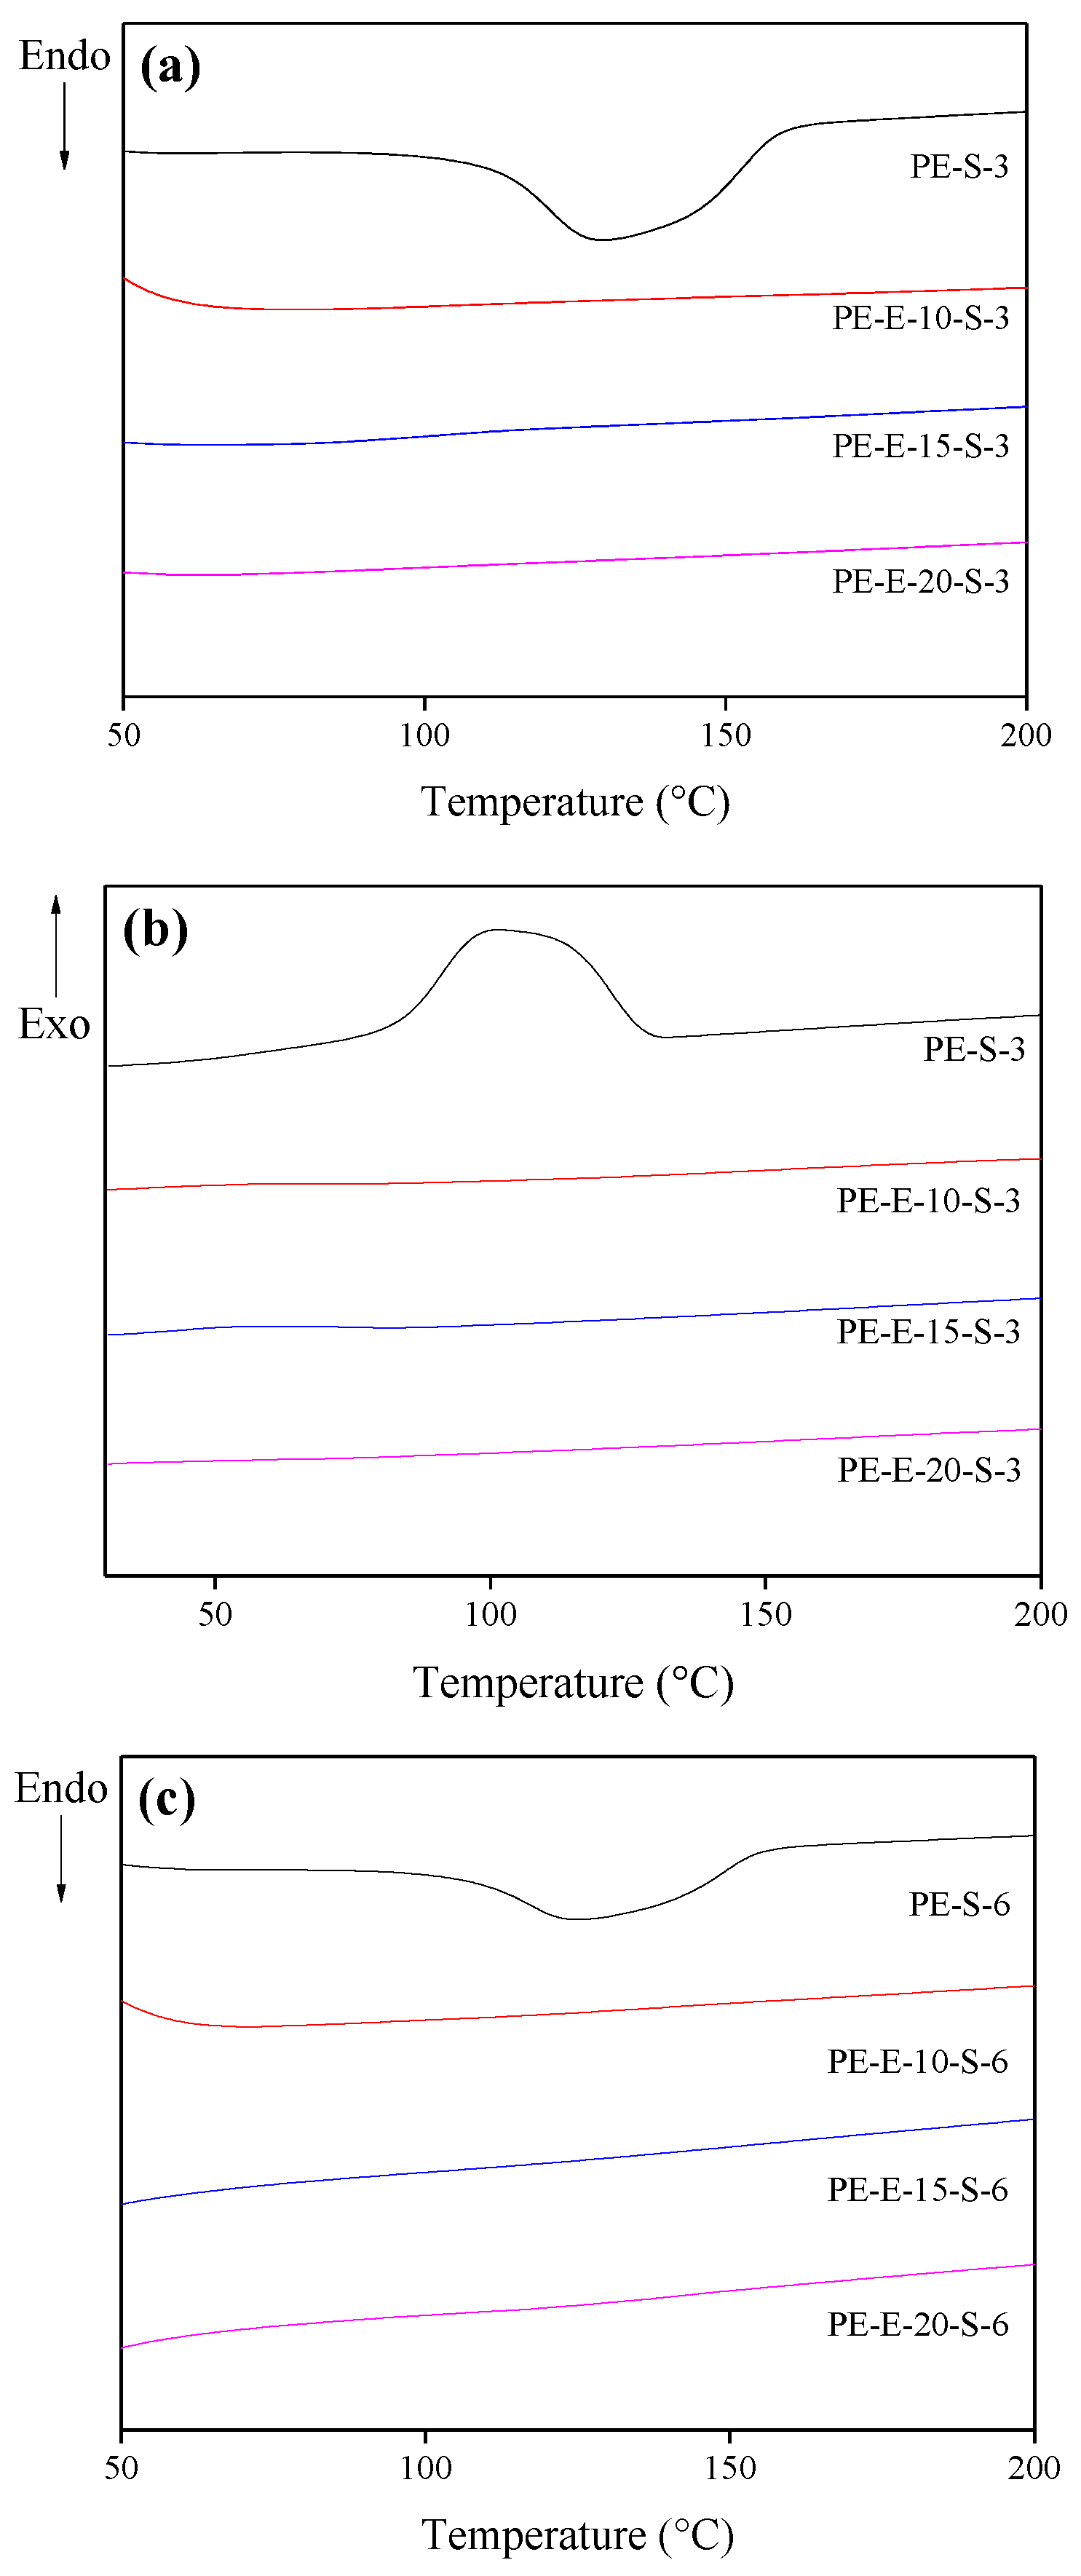
3.1. Primary Crosslinking of Precursor Fibers
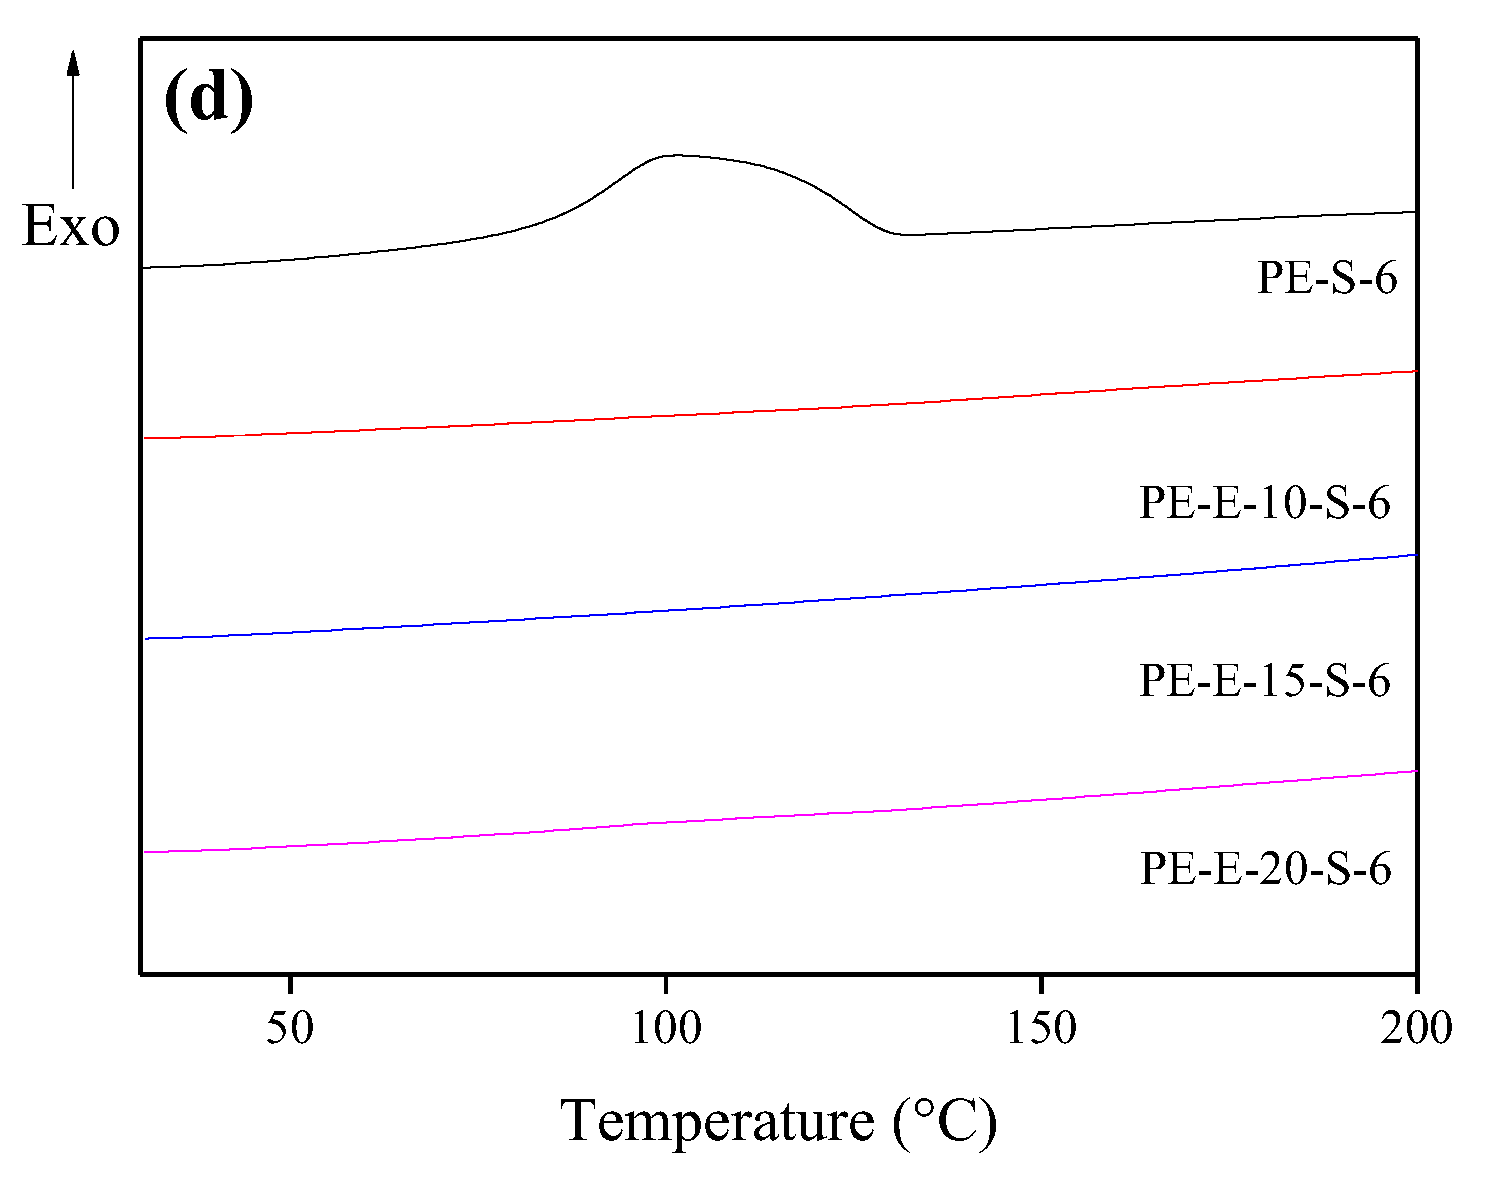
3.2. Second Crosslinking in Sulfuric Acid
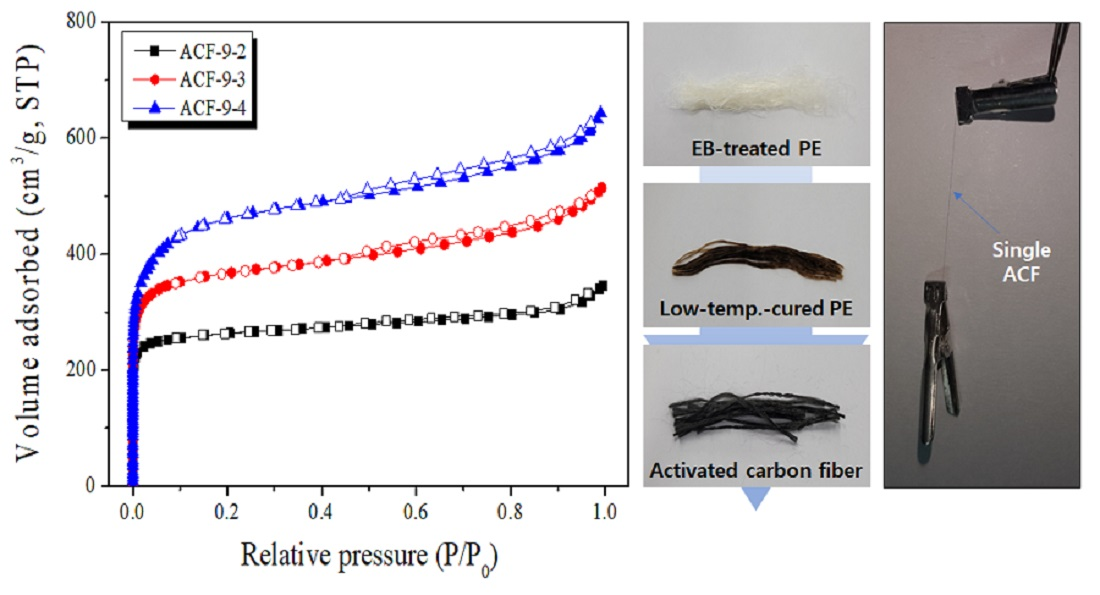
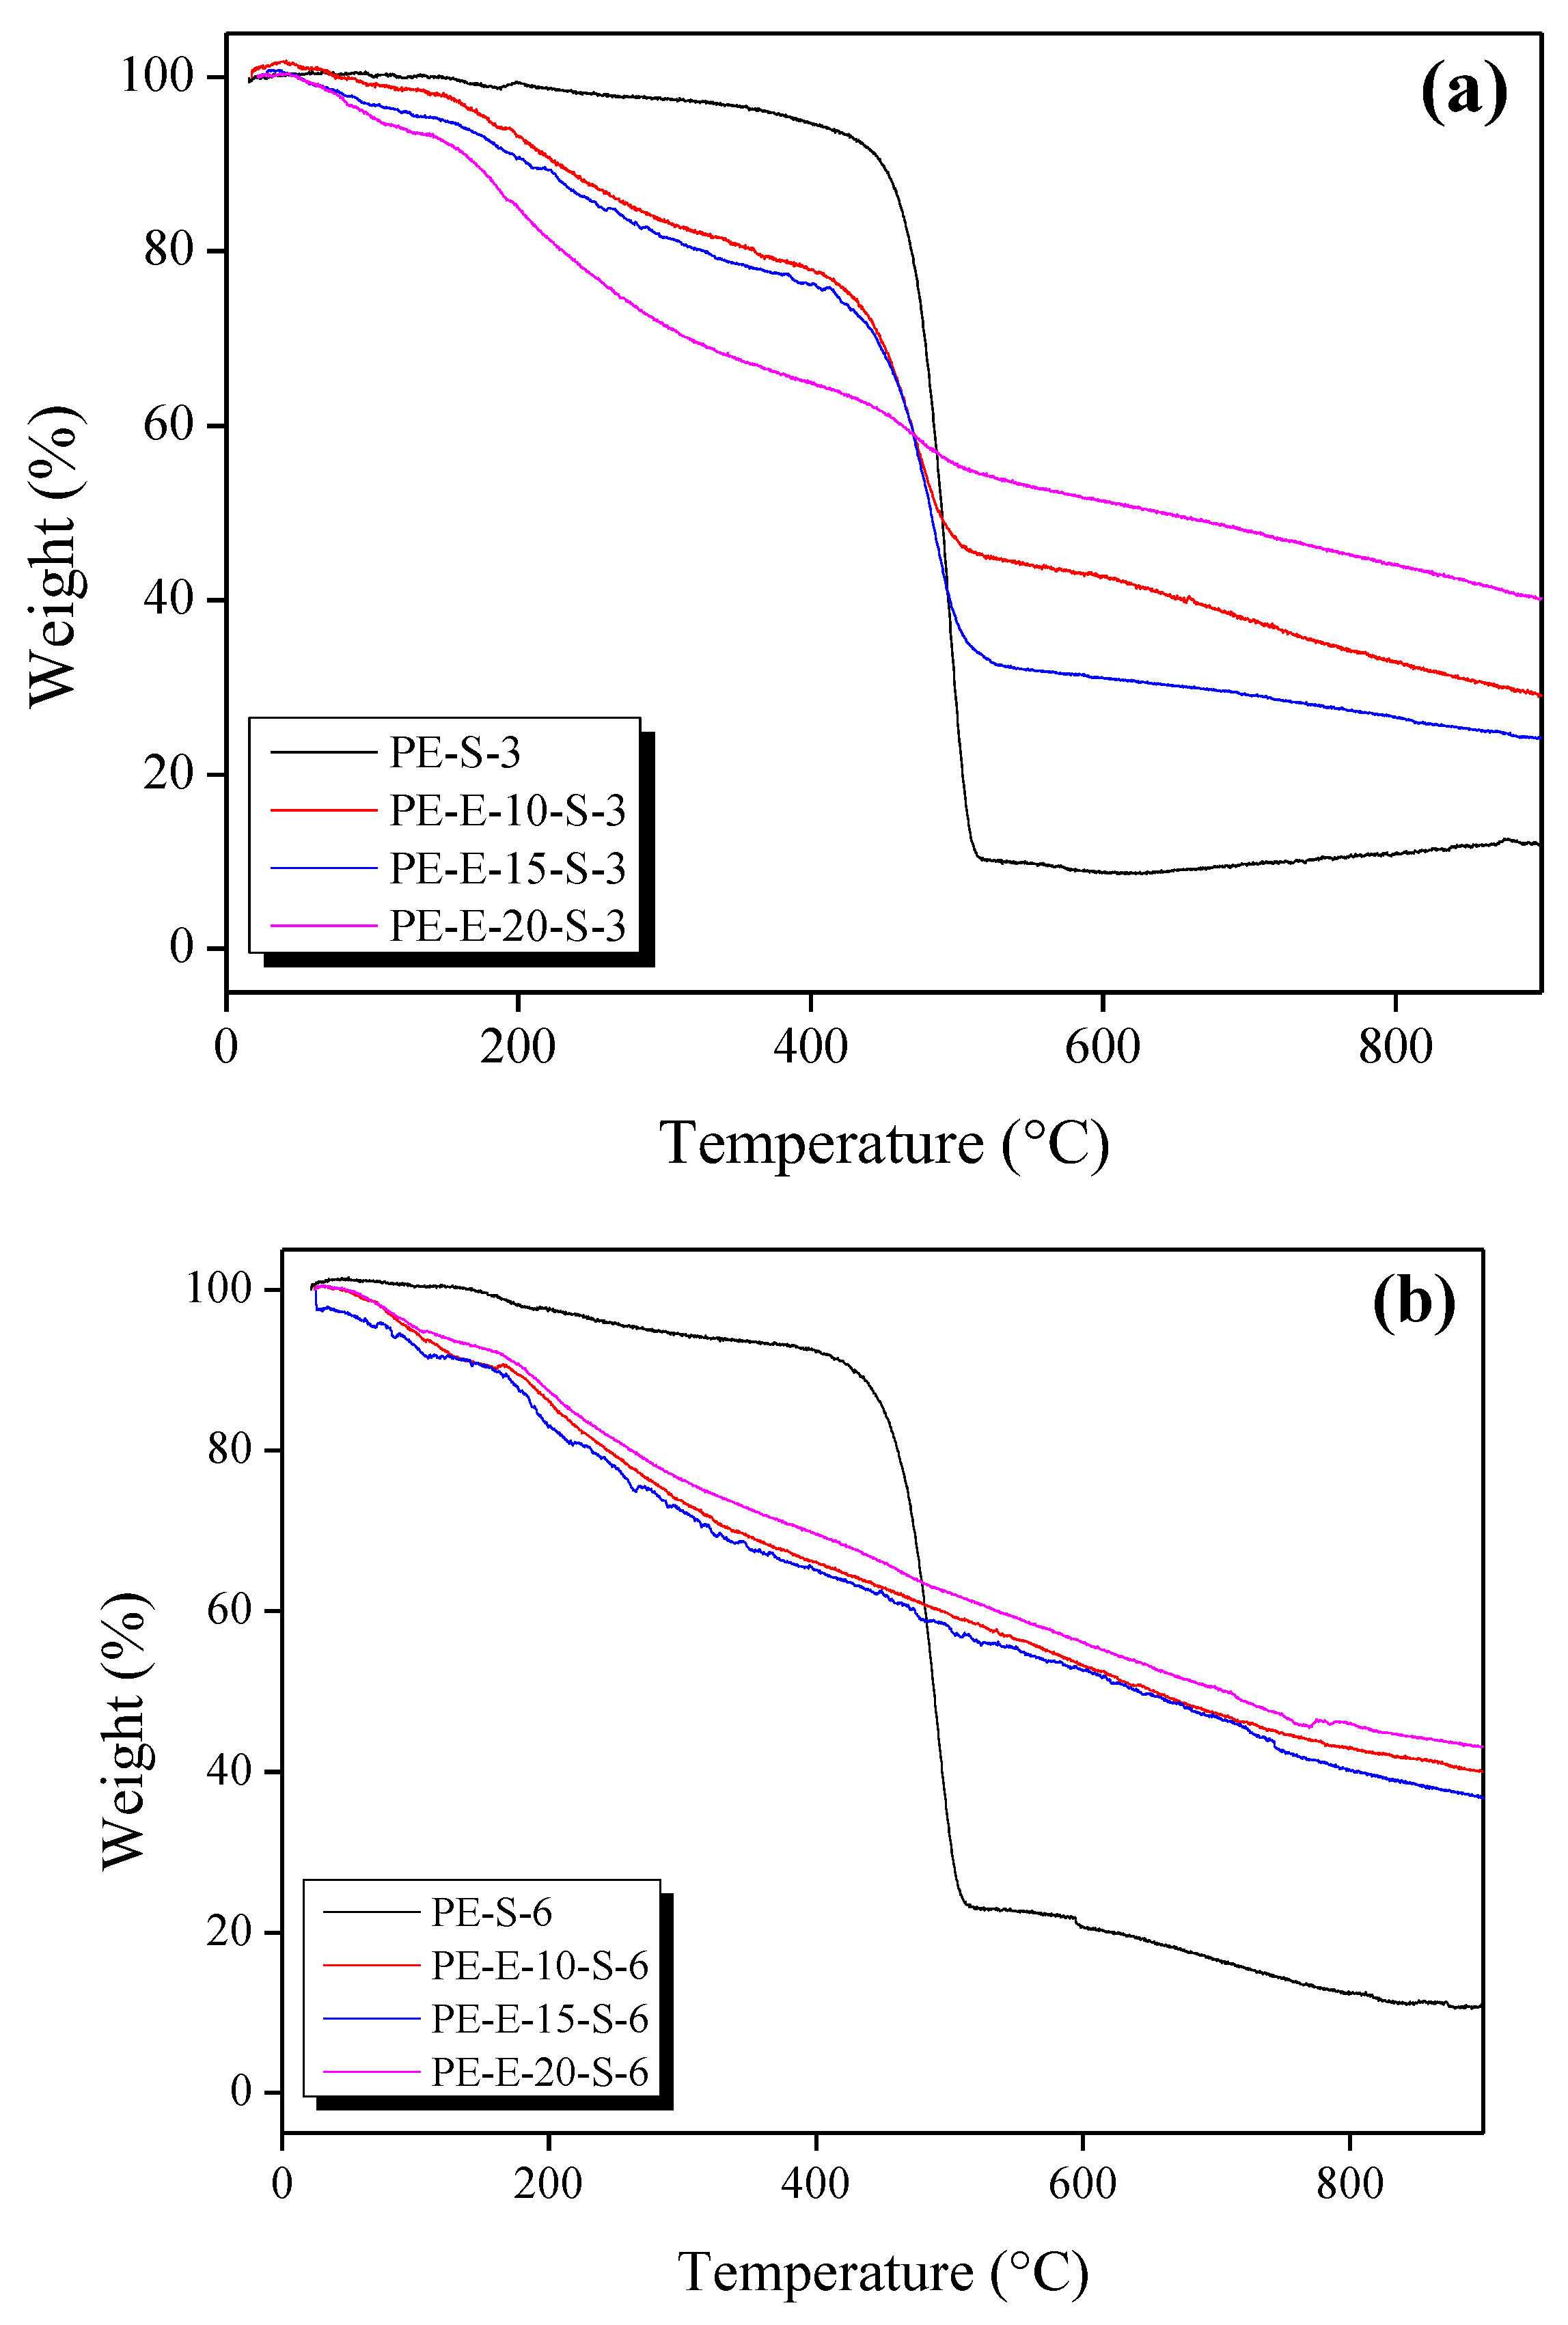
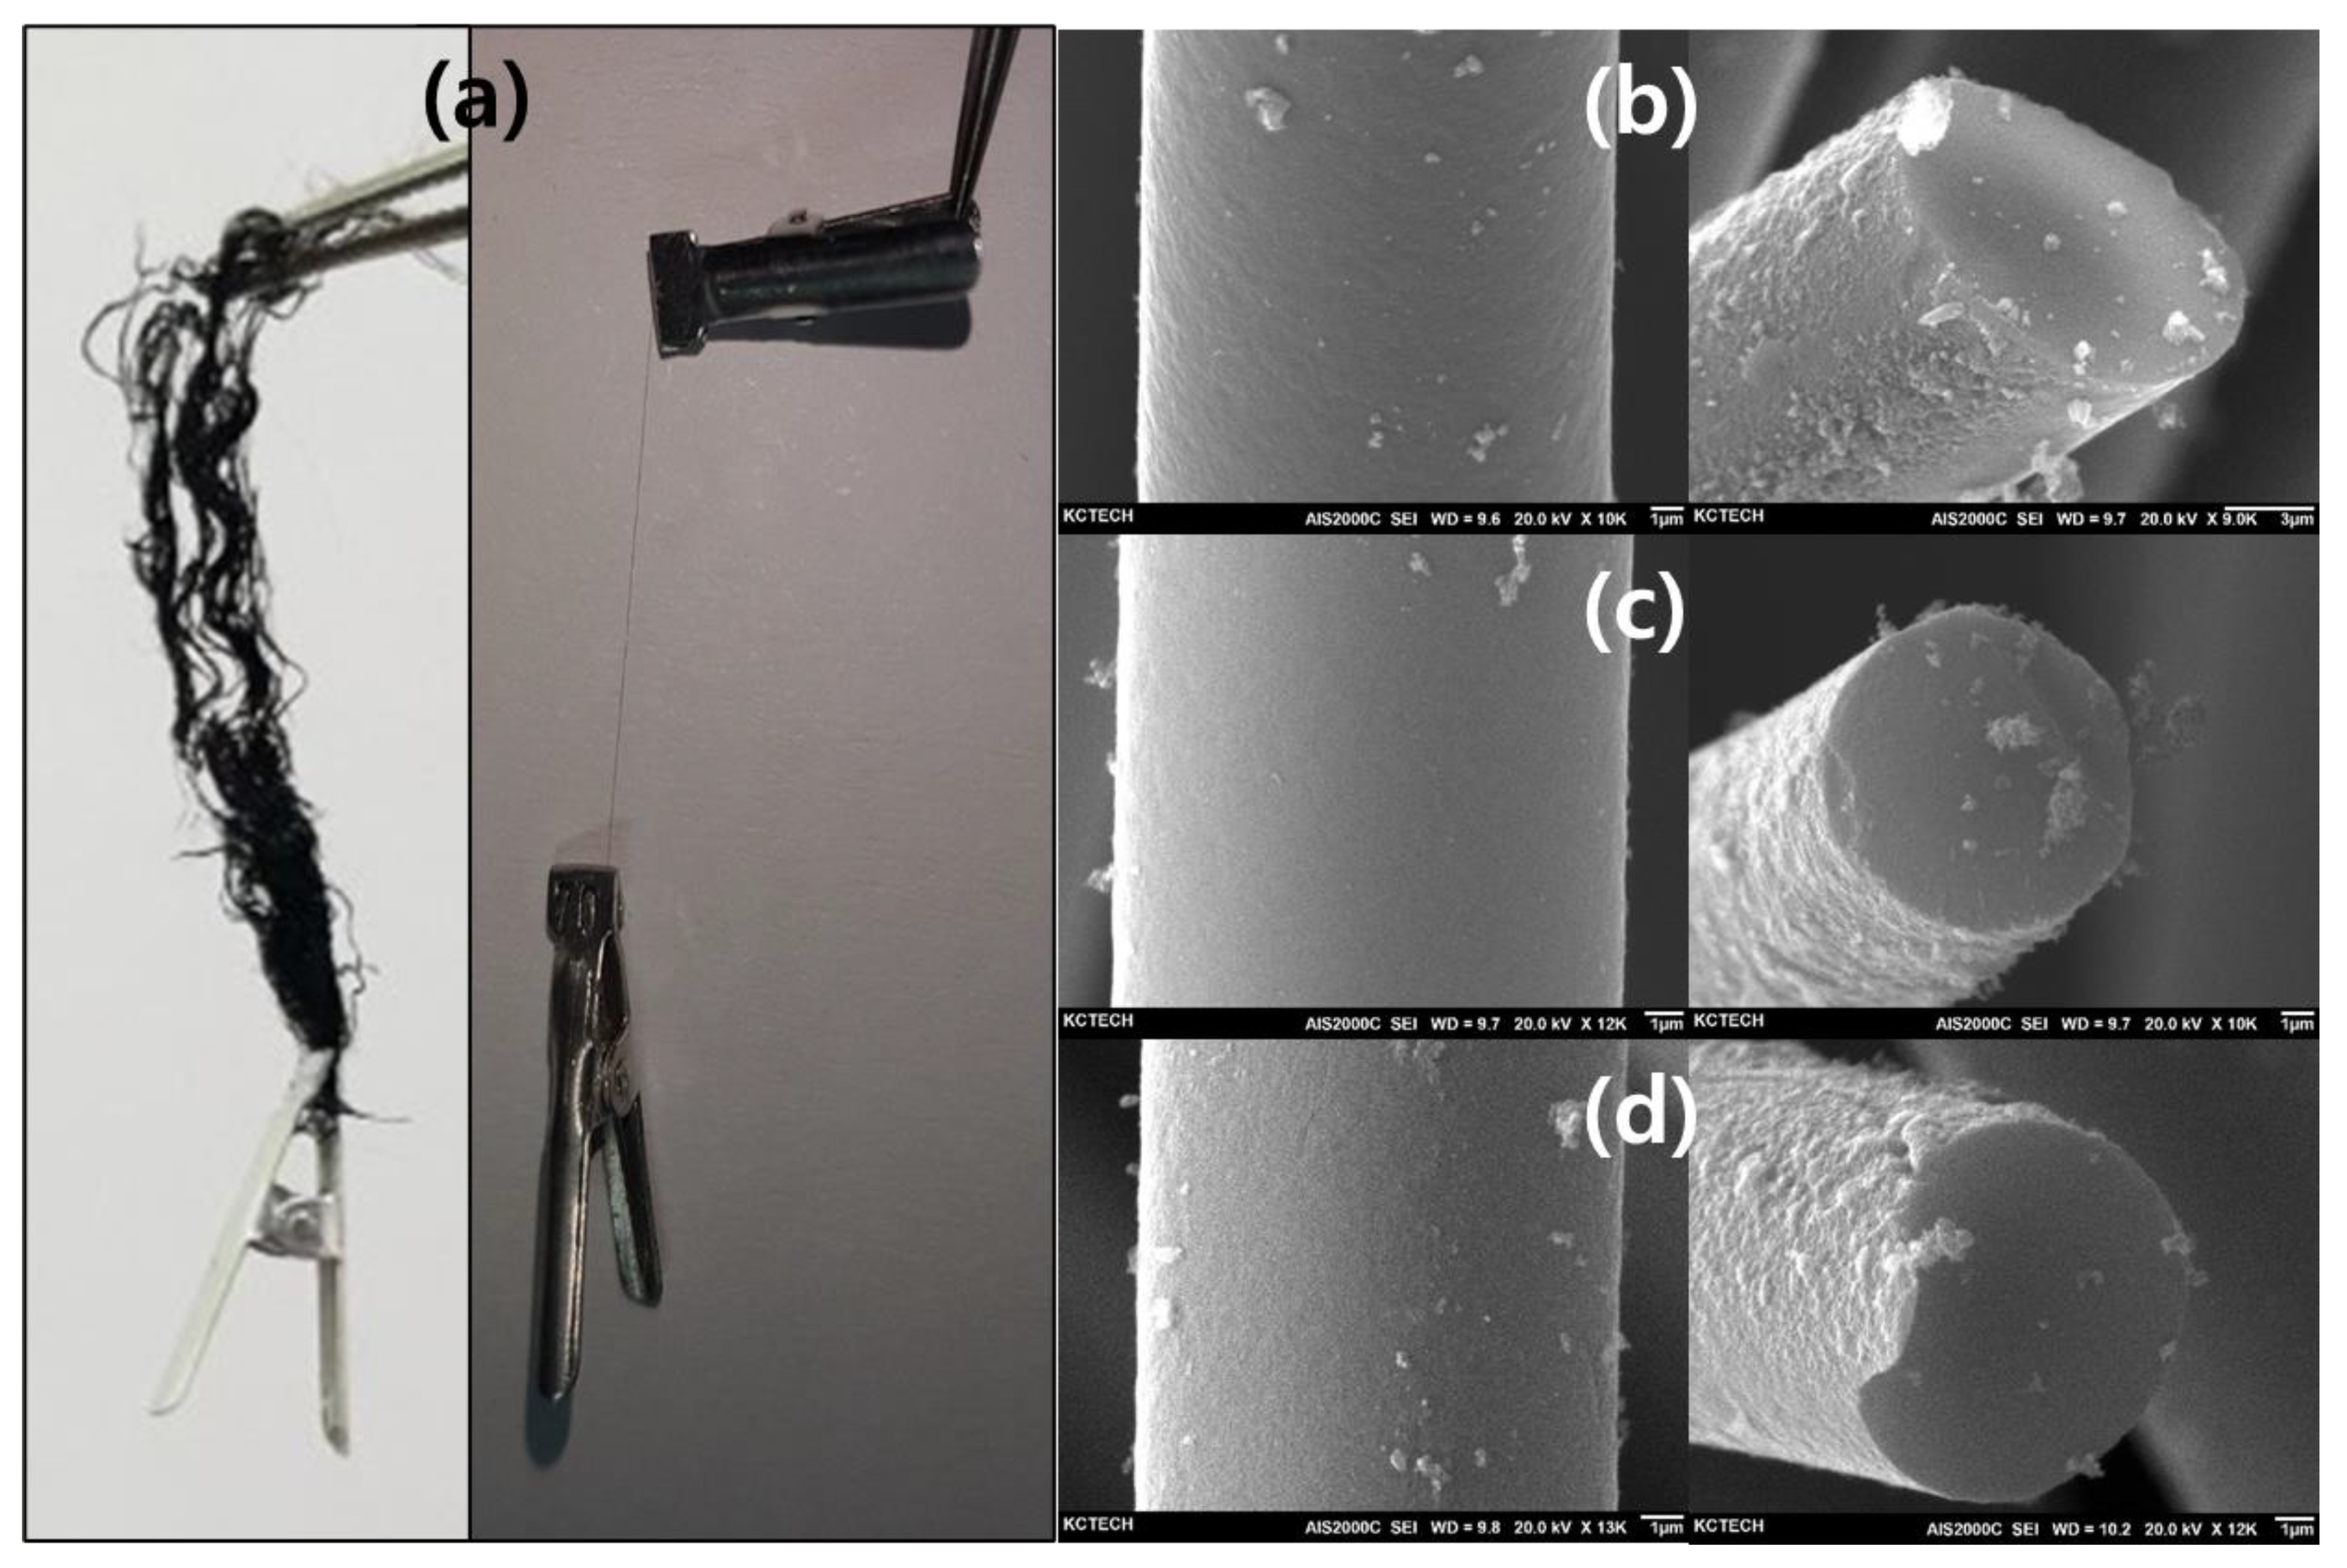
3.3. Microstructure, Optic Image, and Morphology of Activated Carbon Fibers
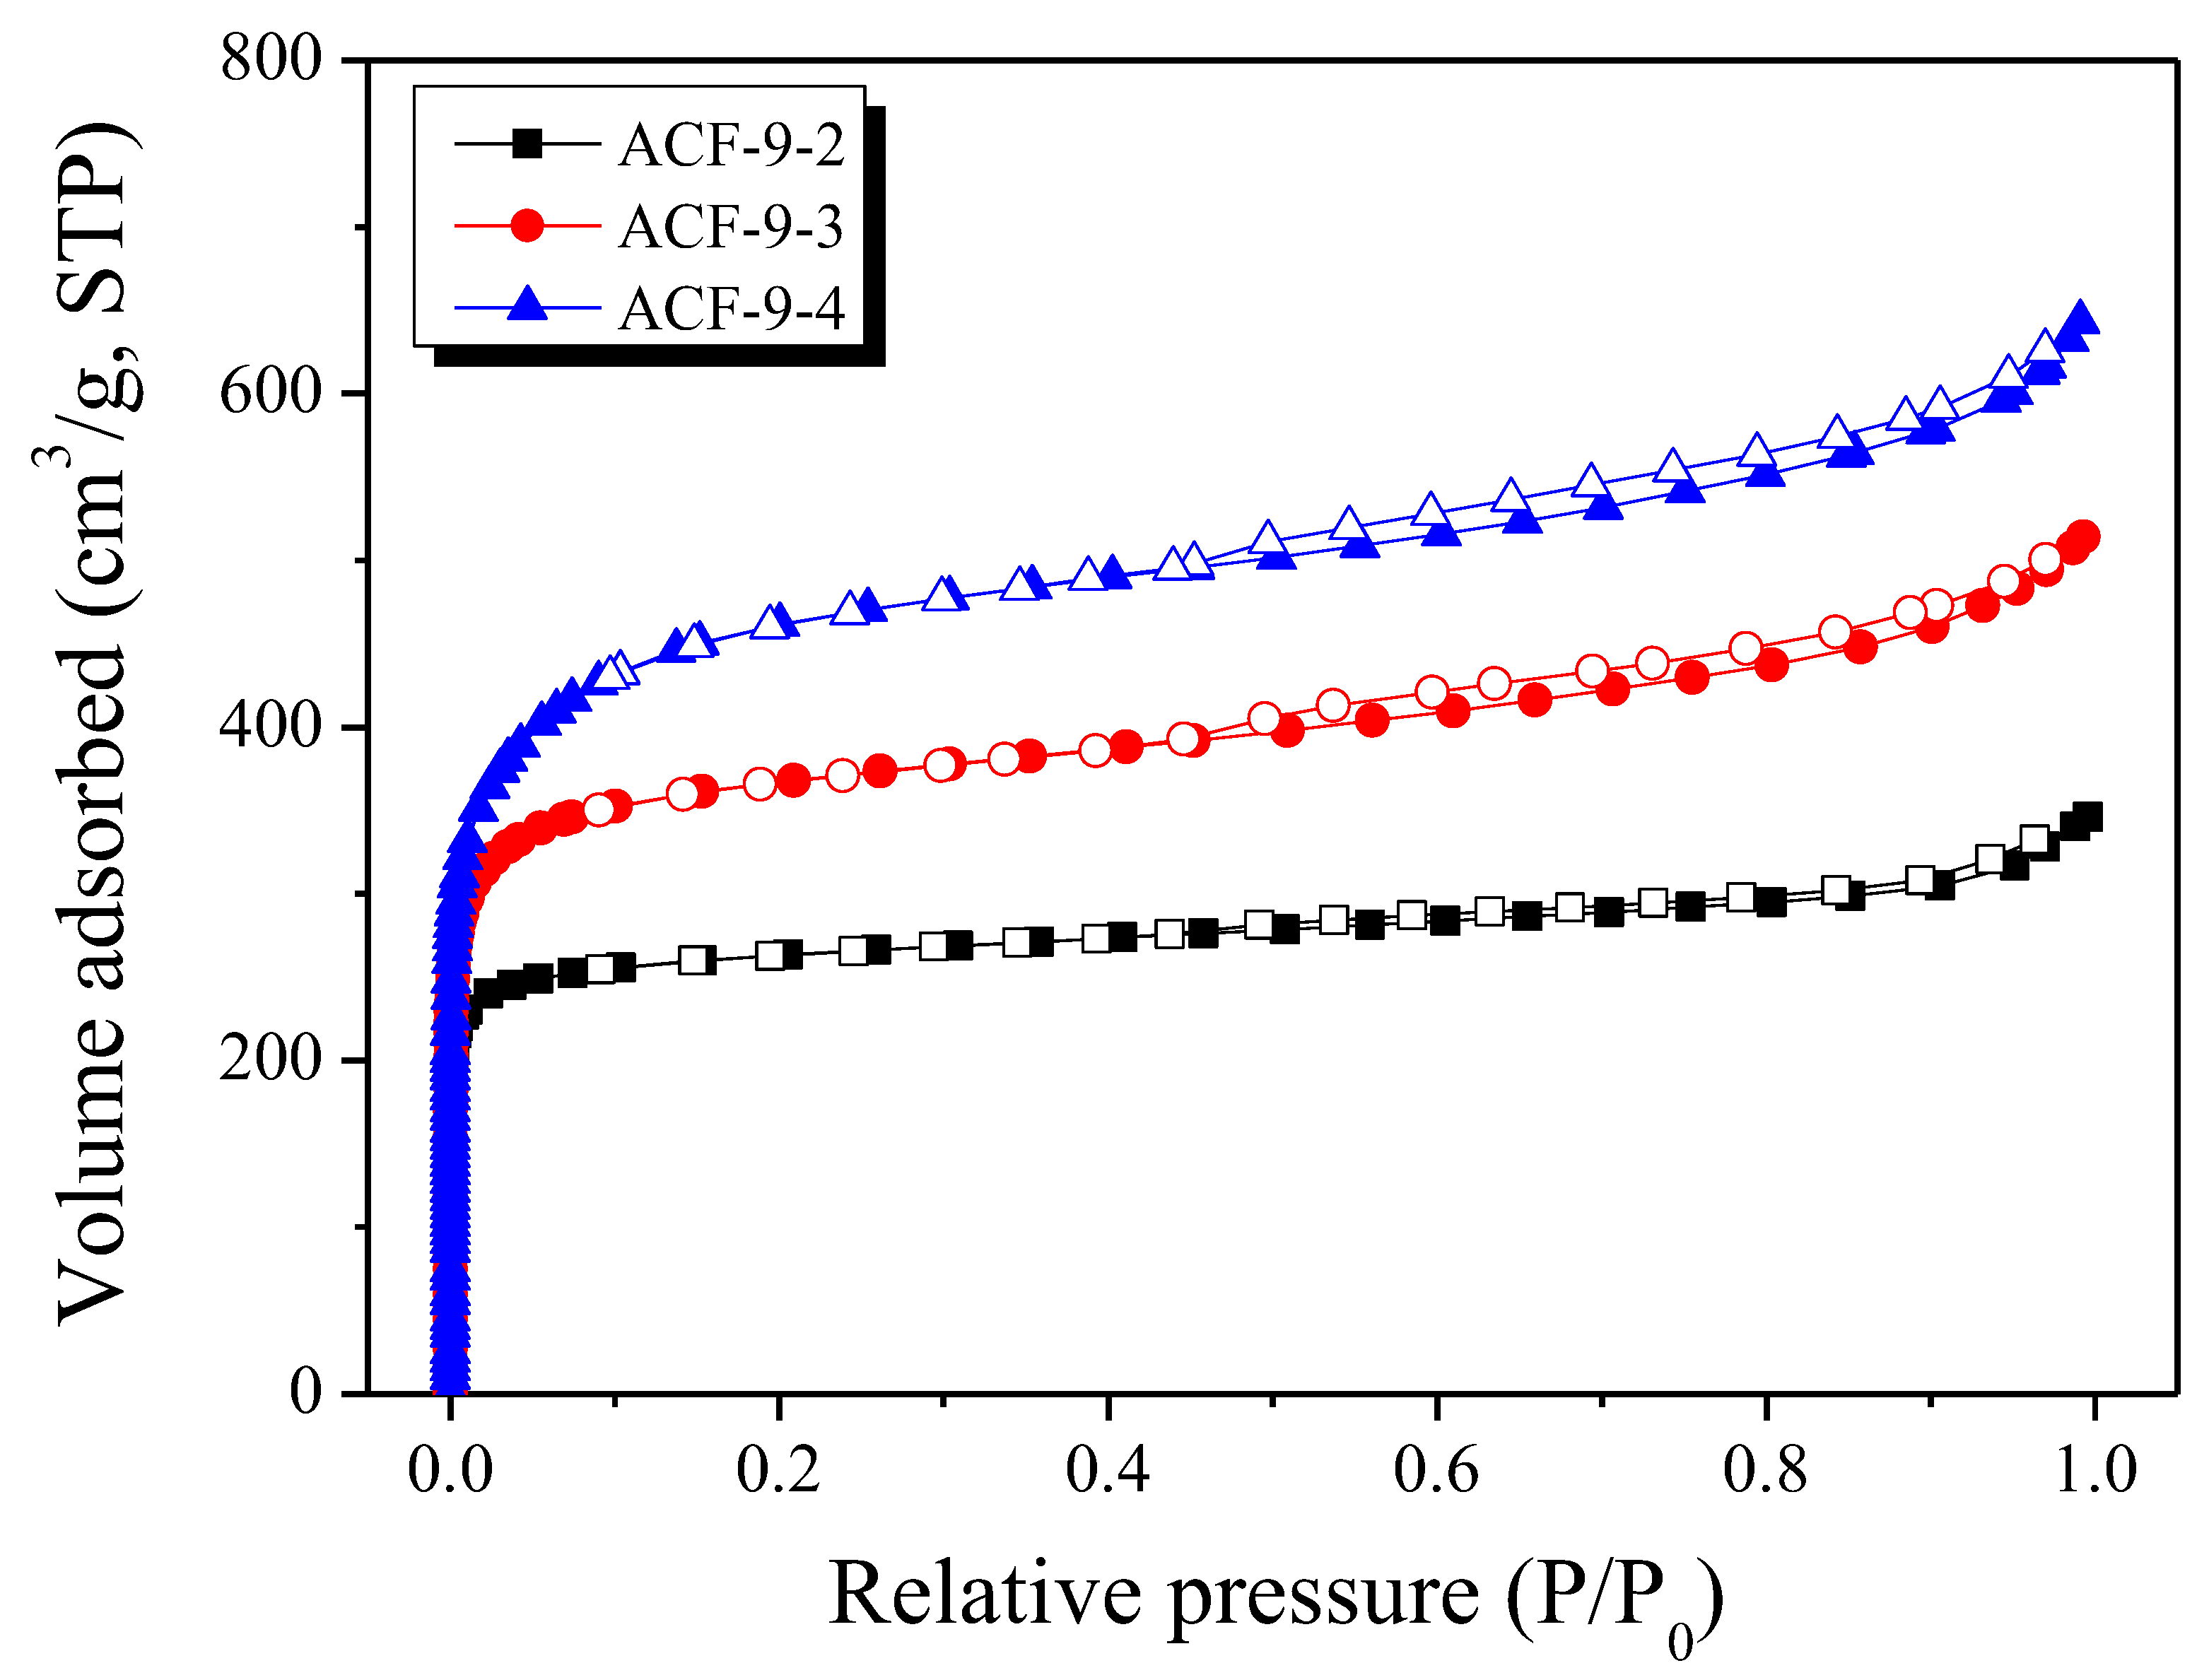
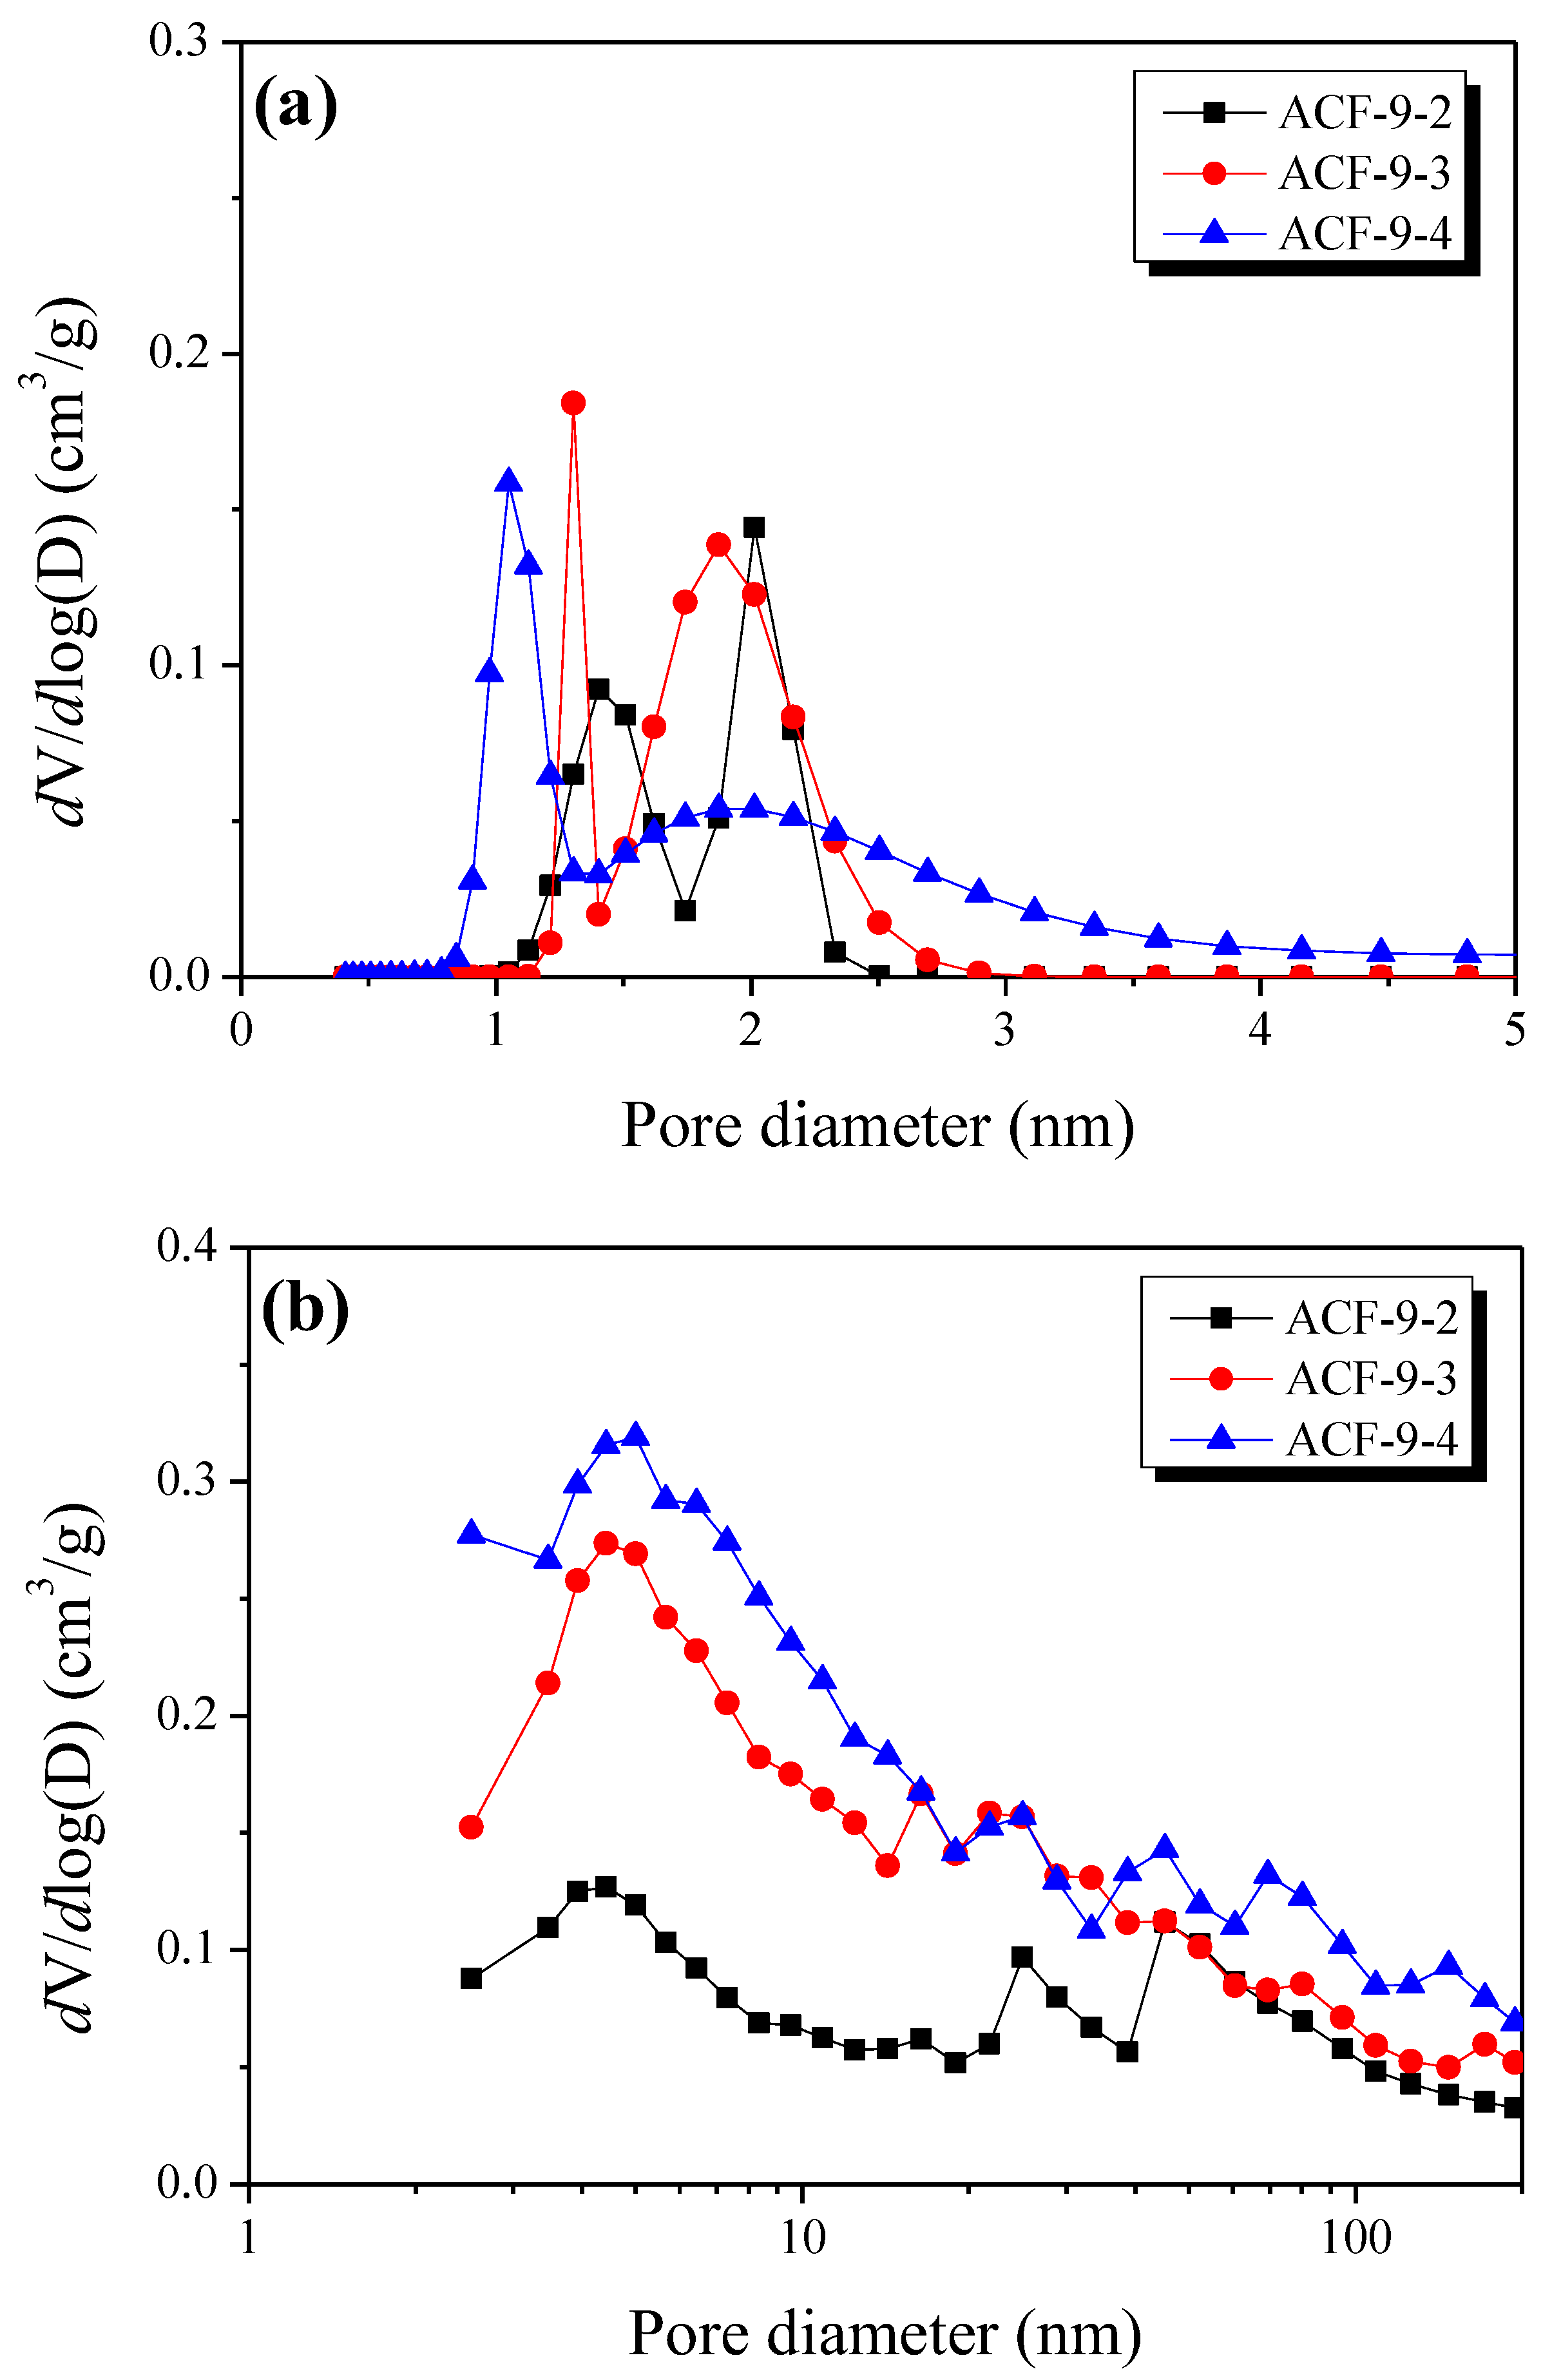
3.4. Pore Characteristics of LLDPE-Based Activated Carbon Fibers
4. Conclusions
Author Contributions
Funding
Institutional Review Board Statement
Informed Consent Statement
Data Availability Statement
Acknowledgments
Conflicts of Interest
References
- Suzuki, M. Activated carbon fiber: Fundamentals and applications. Carbon 1994, 32, 577–586. [Google Scholar] [CrossRef]
- Ko, T.-H.; Chiranairadul, P.; Lu, C.-K.; Lin, C.-H. The effects of activation by carbon dioxide on the mechanical properties and structure of PAN-based activated carbon fibers. Carbon 1992, 30, 647–655. [Google Scholar] [CrossRef]
- Lee, H.M.; Kim, H.G.; Kang, S.J.; Park, S.J.; An, K.H.; Kim, B.J. Effects of pore structures on electrochemical behaviors of polyacrylonitrile (PAN)-based activated carbon nanofibers. J. Ind. Eng. Chem. 2015, 21, 736–740. [Google Scholar] [CrossRef]
- Derbyshire, F.; Andrews, R.; Jacques, D.; Jagtoyen, M.; Kimber, G.; Rantell, T. Synthesis of isotropic carbon fibers and activated carbon fibers from pitch precursors. Fuel 2001, 80, 345–356. [Google Scholar] [CrossRef]
- Hina, K.; Zou, H.; Qian, W.; Zuo, D.; Yi, C. Preparation and performance comparison of cellulose-based activated carbon fibres. Cellulose 2018, 25, 607–617. [Google Scholar] [CrossRef]
- Yusof, N.; Ismail, A.F. Post spinning and pyrolysis processes of polyacrylonitrile (PAN)-based carbon fiber and activated carbon fiber: A review. J. Anal. Appl. Pyrolysis 2012, 93, 1–13. [Google Scholar] [CrossRef]
- Teng, H.; Wang, S.C. Preparation of porous carbons from phenol—Formaldehyde resins. Carbon 2000, 38, 817–824. [Google Scholar] [CrossRef]
- Williams, P.; Reed, A. Development of activated carbon pore structure via physical and chemical activation of biomass fibre waste. Biomass Bioenergy 2006, 30, 144–152. [Google Scholar] [CrossRef]
- Gbewonyo, S.; Xiu, S.; Shahbazi, A.; Zhang, L. Low thermal conductivity carbon material from electrospinning and subsequent chemical activation. Carbon Lett. 2020, 30, 289–296. [Google Scholar] [CrossRef]
- Maciá-Agulló, J.A.; Moore, B.C.; Cazorla-Amorós, D.; Linares-Solano, A. Activation of coal tar pitch carbon fibres: Physical activation vs. chemical activation. Carbon 2004, 42, 1367–1370. [Google Scholar] [CrossRef]
- Kim, M.I.; Im, J.S.; Cho, J.H.; Lee, Y.S.; Kim, S. Preparation of pitch-based activated carbon with surface-treated fyash for SO2 gas removal. Carbon Lett. 2020, 30, 381–387. [Google Scholar] [CrossRef]
- Kim, B.K.; Ryu, S.K.; Kim, B.J.; Park, S.J. Roles of acid-base interactions in hydrogen chloride removal by activated carbon fibers. J. Ind. Eng. Chem. 2006, 12, 121–126. [Google Scholar]
- Kim, M.-J.; Kim, K.H.; Kim, Y.; Yoo, B.; Lee, Y.-S. Volatile organic compounds (VOCs) removal using ACFs with electroless plating CuO as catalysts. Carbon Lett. 2020, 30, 675–682. [Google Scholar] [CrossRef]
- Lee, H.-M.; Kim, K.-W.; Park, Y.-K.; An, K.-H.; Park, S.-J.; Kim, B.-J. Activated Carbons from Thermoplastic Precursors and Their Energy Storage Applications. Nanomaterials 2019, 9, 896. [Google Scholar] [CrossRef] [PubMed]
- Hassan, M.F.; Sabri, M.A.; Fazal, H.; Hafeez, A.; Shezad, N.; Hussain, M. Recent trends in activated carbon fibers production from various precursors and applications—A comparative review. J. Anal. Appl. Pyrolysis 2020, 145, 104715. [Google Scholar] [CrossRef]
- Yahya, M.A.; Al-Qodah, Z.; Ngah, C.W.Z. Agricultural bio-waste materials as potential sustainable precursors used for activated carbon production: A review. Renew. Sustain. Energy Rev. 2015, 46, 218–235. [Google Scholar] [CrossRef]
- Wortberg, G.; De Palmenaer, A.; Beckers, M.; Seide, G.; Gries, T. Polyethylene-Based Carbon Fibers by the Use of Sulphonation for Stabilization. Fibers 2015, 3, 373–379. [Google Scholar] [CrossRef]
- Kim, K.W.; Lee, H.M.; Kim, B.S.; Hwang, S.H.; Kwac, L.K.; An, K.H.; Kim, B.J. Preparation and thermal properties of polyethylene-based carbonized fibers. Carbon Lett. 2015, 16, 62–66. [Google Scholar] [CrossRef]
- Tretinnikov, O.N.; Ogata, S.; Ikada, Y. Surface crosslinking of polyethylene by electron beam irradiation in air. Polymer 1998, 39, 6115–6120. [Google Scholar] [CrossRef]
- Bremner, T.; Rudin, A. Peroxide modification of linear low-density polyethylene: A comparison of dialkyl peroxides. J. Appl. Polym. Sci. 1993, 49, 785–798. [Google Scholar] [CrossRef]
- Azizi, H.; Barzin, J.; Morshedian, J. Silane crosslinking of polyethylene: The effects of EVA, ATH and Sb2O3 on properties of the production in continuous grafting of LDPE. Express Polym. Lett. 2007, 1, 378–384. [Google Scholar] [CrossRef][Green Version]
- Li, C.; Zhu, H.; Salim, N.V.; Fox, B.L.; Hameed, N. Preparation of microporous carbon materials via in-depth sulfonation and stabilization of polyethylene. Polym. Degrad. Stab. 2016, 134, 272–283. [Google Scholar] [CrossRef]
- Liu, S.-Q.; Gong, W.-G.; Zheng, B.-C. The Effect of Peroxide Cross-Linking on the Properties of Low-Density Polyethylene. J. Macromol. Sci. Phys. 2014, 53, 67–77. [Google Scholar] [CrossRef]
- Kim, M.J.; Song, E.J.; Kim, K.H.; Choi, S.S.; Lee, Y.-S. The textural and chemical changes in ACFs with E-beam and their influence on the detection of nerve agent simulant gases. J. Ind. Eng. Chem. 2019, 79, 465–472. [Google Scholar] [CrossRef]
- Kang, S.-H.; Kim, K.-W.; Kim, B.-J. Carbon Fibers from High-Density Polyethylene Using a Hybrid Cross-Linking Technique. Polymers 2021, 13, 2157. [Google Scholar] [CrossRef]
- Brunauer, S.; Emmett, P.H.; Teller, E. Adsorption of Gases in Multimolecular Layers. J. Am. Chem. Soc. 1938, 60, 309–319. [Google Scholar] [CrossRef]
- Kierlik, E.; Rosinberg, M.L. Free-energy density functional for the inhomogeneous hard-sphere fluid: Application to interfacial adsorption. Phys. Rev. A 1990, 42, 3382–3387. [Google Scholar] [CrossRef] [PubMed]
- Barrett, E.P.; Joyner, L.G.; Halenda, P.P. The Determination of Pore Volume and Area Distributions in Porous Substances. I. Computations from Nitrogen Isotherms. J. Am. Chem. Soc. 1951, 73, 373–380. [Google Scholar] [CrossRef]
- Lee, H.-M.; Lee, B.-H.; Kim, J.-H.; An, K.-H.; Park, S.-J.; Kim, B.-J. Determination of the optimum porosity for 2-CEES adsorption by activated carbon fiber from various precursors. Carbon Lett. 2019, 29, 649–654. [Google Scholar] [CrossRef]
- Wang, H.; Zhu, T.; Fan, X.; Na, H. Adsorption and desorption of small molecule volatile organic compounds over carbide-derived carbon. Carbon 2014, 67, 712–720. [Google Scholar] [CrossRef]


| Sample Name | Crosslinking Conditions | Sample Name | Activation Conditions | ||||
|---|---|---|---|---|---|---|---|
| E-Beam | Sulfuric Acid | Temp. | Time | ||||
| PE-E-10-S-3 PE-E-10-S-6 | 1.5 MeV | 1000 kGy | 110 °C | 30, 60 min | - | - | - |
| PE-E-15-S-3 PE-E-15-S-6 | 1500 kGy | ACF-9-2 * ACF-9-3 * ACF-9-4 * | 900 °C | 20 to 40 min | |||
| PE-E-20-S-3 PE-E-20-S-6 | 2000 kGy | - | - | - | |||
| Sample Name | 110 Peak | 200 Peak | ||||||
|---|---|---|---|---|---|---|---|---|
| 2θ | FWHM (2θ) | d110 (Å) | L110 (Å) | 2θ | FWHM (2θ) | d200 (Å) | L200 (Å) | |
| As-received | 21.70 | 0.59 | 4.09 | 136.46 | 24.03 | 0.70 | 3.70 | 116.12 |
| PE-E-10 | 21.69 | 0.71 | 4.09 | 114.06 | 24.02 | 0.81 | 3.70 | 99.94 |
| PE-E-15 | 21.57 | 0.78 | 4.12 | 103.74 | 23.88 | 0.88 | 3.72 | 92.13 |
| PE-E-20 | 21.60 | 0.65 | 4.11 | 125.16 | 23.90 | 0.76 | 3.72 | 107.54 |
| Step | Sample Name | 002 Peak | 10l Peak | ||||
|---|---|---|---|---|---|---|---|
| 2θ | d002 (Å) | Lc (Å) | 2θ | d10l (Å) | La (Å) | ||
| Carbonization | PE-E-15-S-3 | 22.46 | 3.96 | 9.04 | 44.33 | 2.04 | 17.76 |
| PE-E-15-S-6 | 22.34 | 3.98 | 9.25 | 44.52 | 2.03 | 17.48 | |
| Activation | ACF-9-2 | 22.50 | 3.95 | 9.70 | 44.80 | 2.02 | 30.40 |
| Sample Name | SBET (m2/g) | VTotal (cm3/g) | VMicro (cm3/g) | VMeso (cm3/g) | Yield (%) |
|---|---|---|---|---|---|
| ACF-9-2 | 1040 | 0.53 | 0.37 | 0.16 | 55.2 |
| ACF-9-3 | 1420 | 0.79 | 0.49 | 0.30 | 36.4 |
| ACF-9-4 | 1750 | 0.99 | 0.60 | 0.39 | 10.0 |
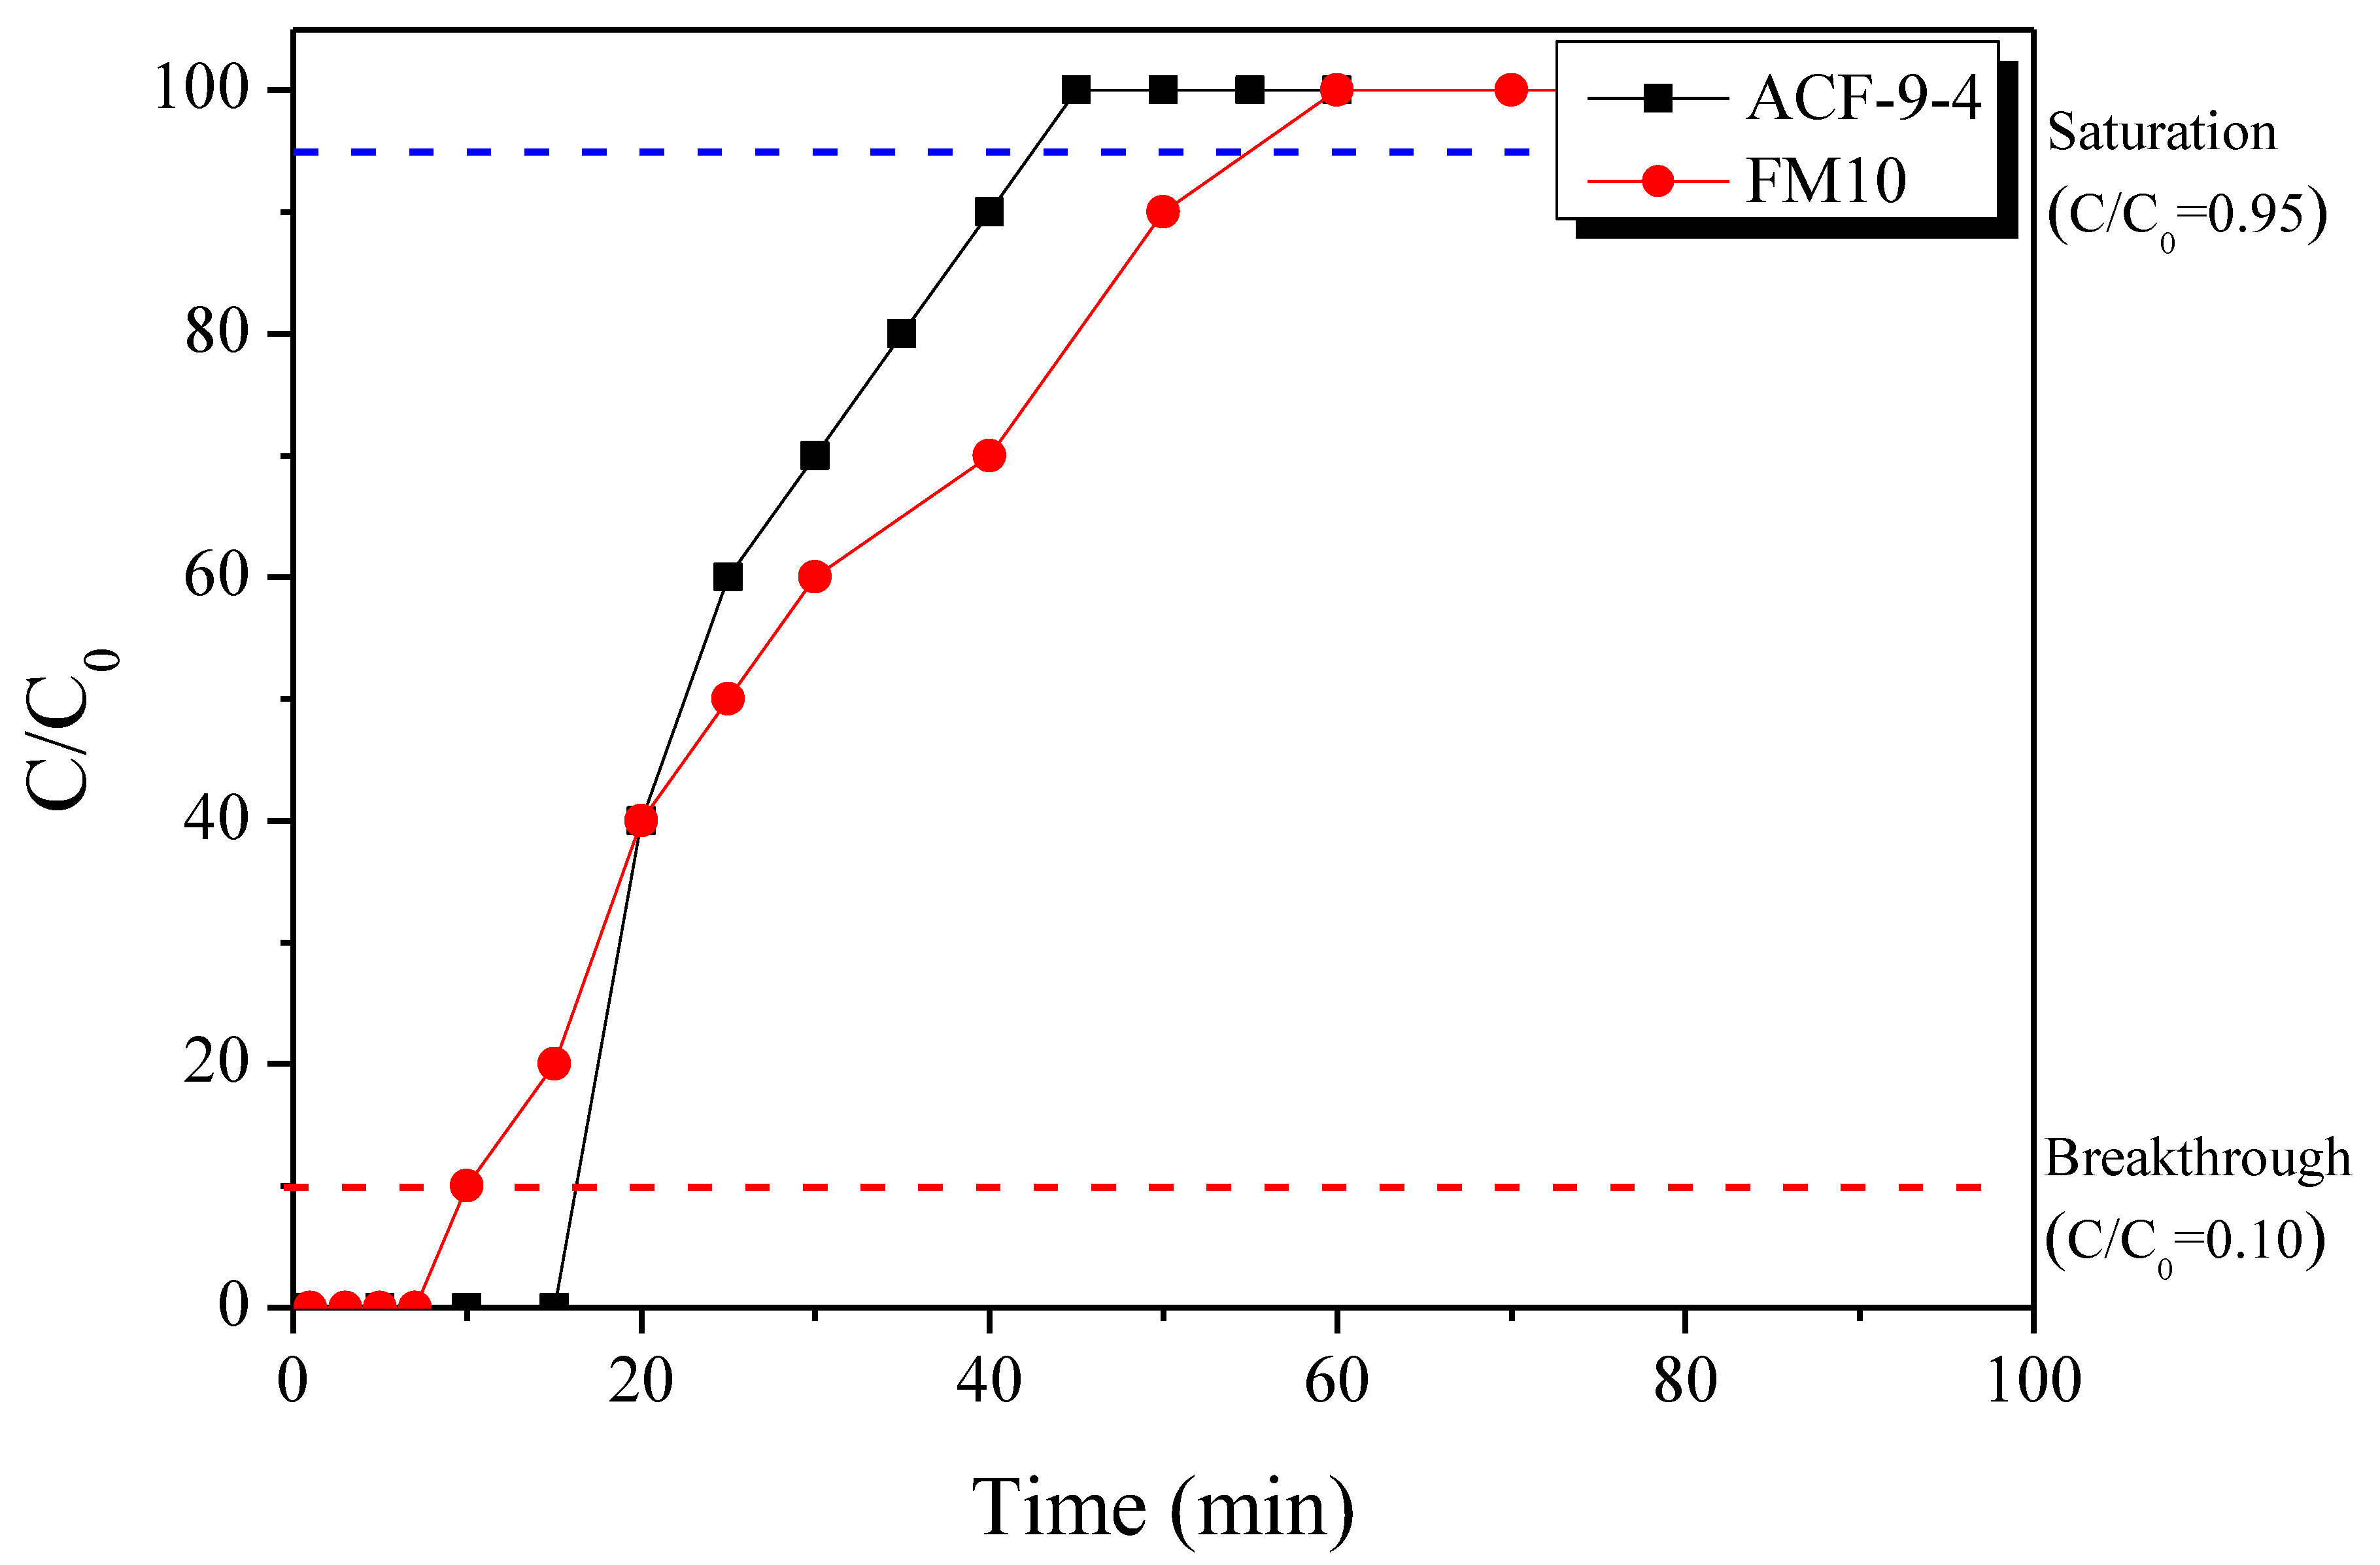
| Gas | Breakthrough | Saturation | |||
|---|---|---|---|---|---|
| Time (min) | Adsorption Capacity (mg/g) | Adsorption Capacity/Micropore Volume (mg/cm3) | Time (min) | Adsorption Capacity (mg/g) | |
| ACF-9-4 | 16.2 | 1.27 | 2.12 | 42.5 | 1.98 |
| FM10 | 10.0 | 0.77 | 1.75 | 55.1 | 2.20 |
Publisher’s Note: MDPI stays neutral with regard to jurisdictional claims in published maps and institutional affiliations. |
© 2021 by the authors. Licensee MDPI, Basel, Switzerland. This article is an open access article distributed under the terms and conditions of the Creative Commons Attribution (CC BY) license (https://creativecommons.org/licenses/by/4.0/).
Share and Cite
Kim, K.-W.; Lee, H.-M.; Kang, S.-H.; Kim, B.-J. Synthesis and Characterization of Activated Carbon Fibers Derived from Linear Low-Density Polyethylene Fibers Stabilized at a Low Temperature. Polymers 2021, 13, 3918. https://doi.org/10.3390/polym13223918
Kim K-W, Lee H-M, Kang S-H, Kim B-J. Synthesis and Characterization of Activated Carbon Fibers Derived from Linear Low-Density Polyethylene Fibers Stabilized at a Low Temperature. Polymers. 2021; 13(22):3918. https://doi.org/10.3390/polym13223918
Chicago/Turabian StyleKim, Kwan-Woo, Hye-Min Lee, Seong-Hyun Kang, and Byung-Joo Kim. 2021. "Synthesis and Characterization of Activated Carbon Fibers Derived from Linear Low-Density Polyethylene Fibers Stabilized at a Low Temperature" Polymers 13, no. 22: 3918. https://doi.org/10.3390/polym13223918
APA StyleKim, K.-W., Lee, H.-M., Kang, S.-H., & Kim, B.-J. (2021). Synthesis and Characterization of Activated Carbon Fibers Derived from Linear Low-Density Polyethylene Fibers Stabilized at a Low Temperature. Polymers, 13(22), 3918. https://doi.org/10.3390/polym13223918