
Fe, N-Doped Metal Organic Framework Prepared by the Calcination of Iron Chelated Polyimines as the Cathode-Catalyst of Proton Exchange Membrane Fuel Cells

 ,
,  ,
,  and
and
Abstract
:
1. Introduction
2. Materials and Methods
2.1. Materials
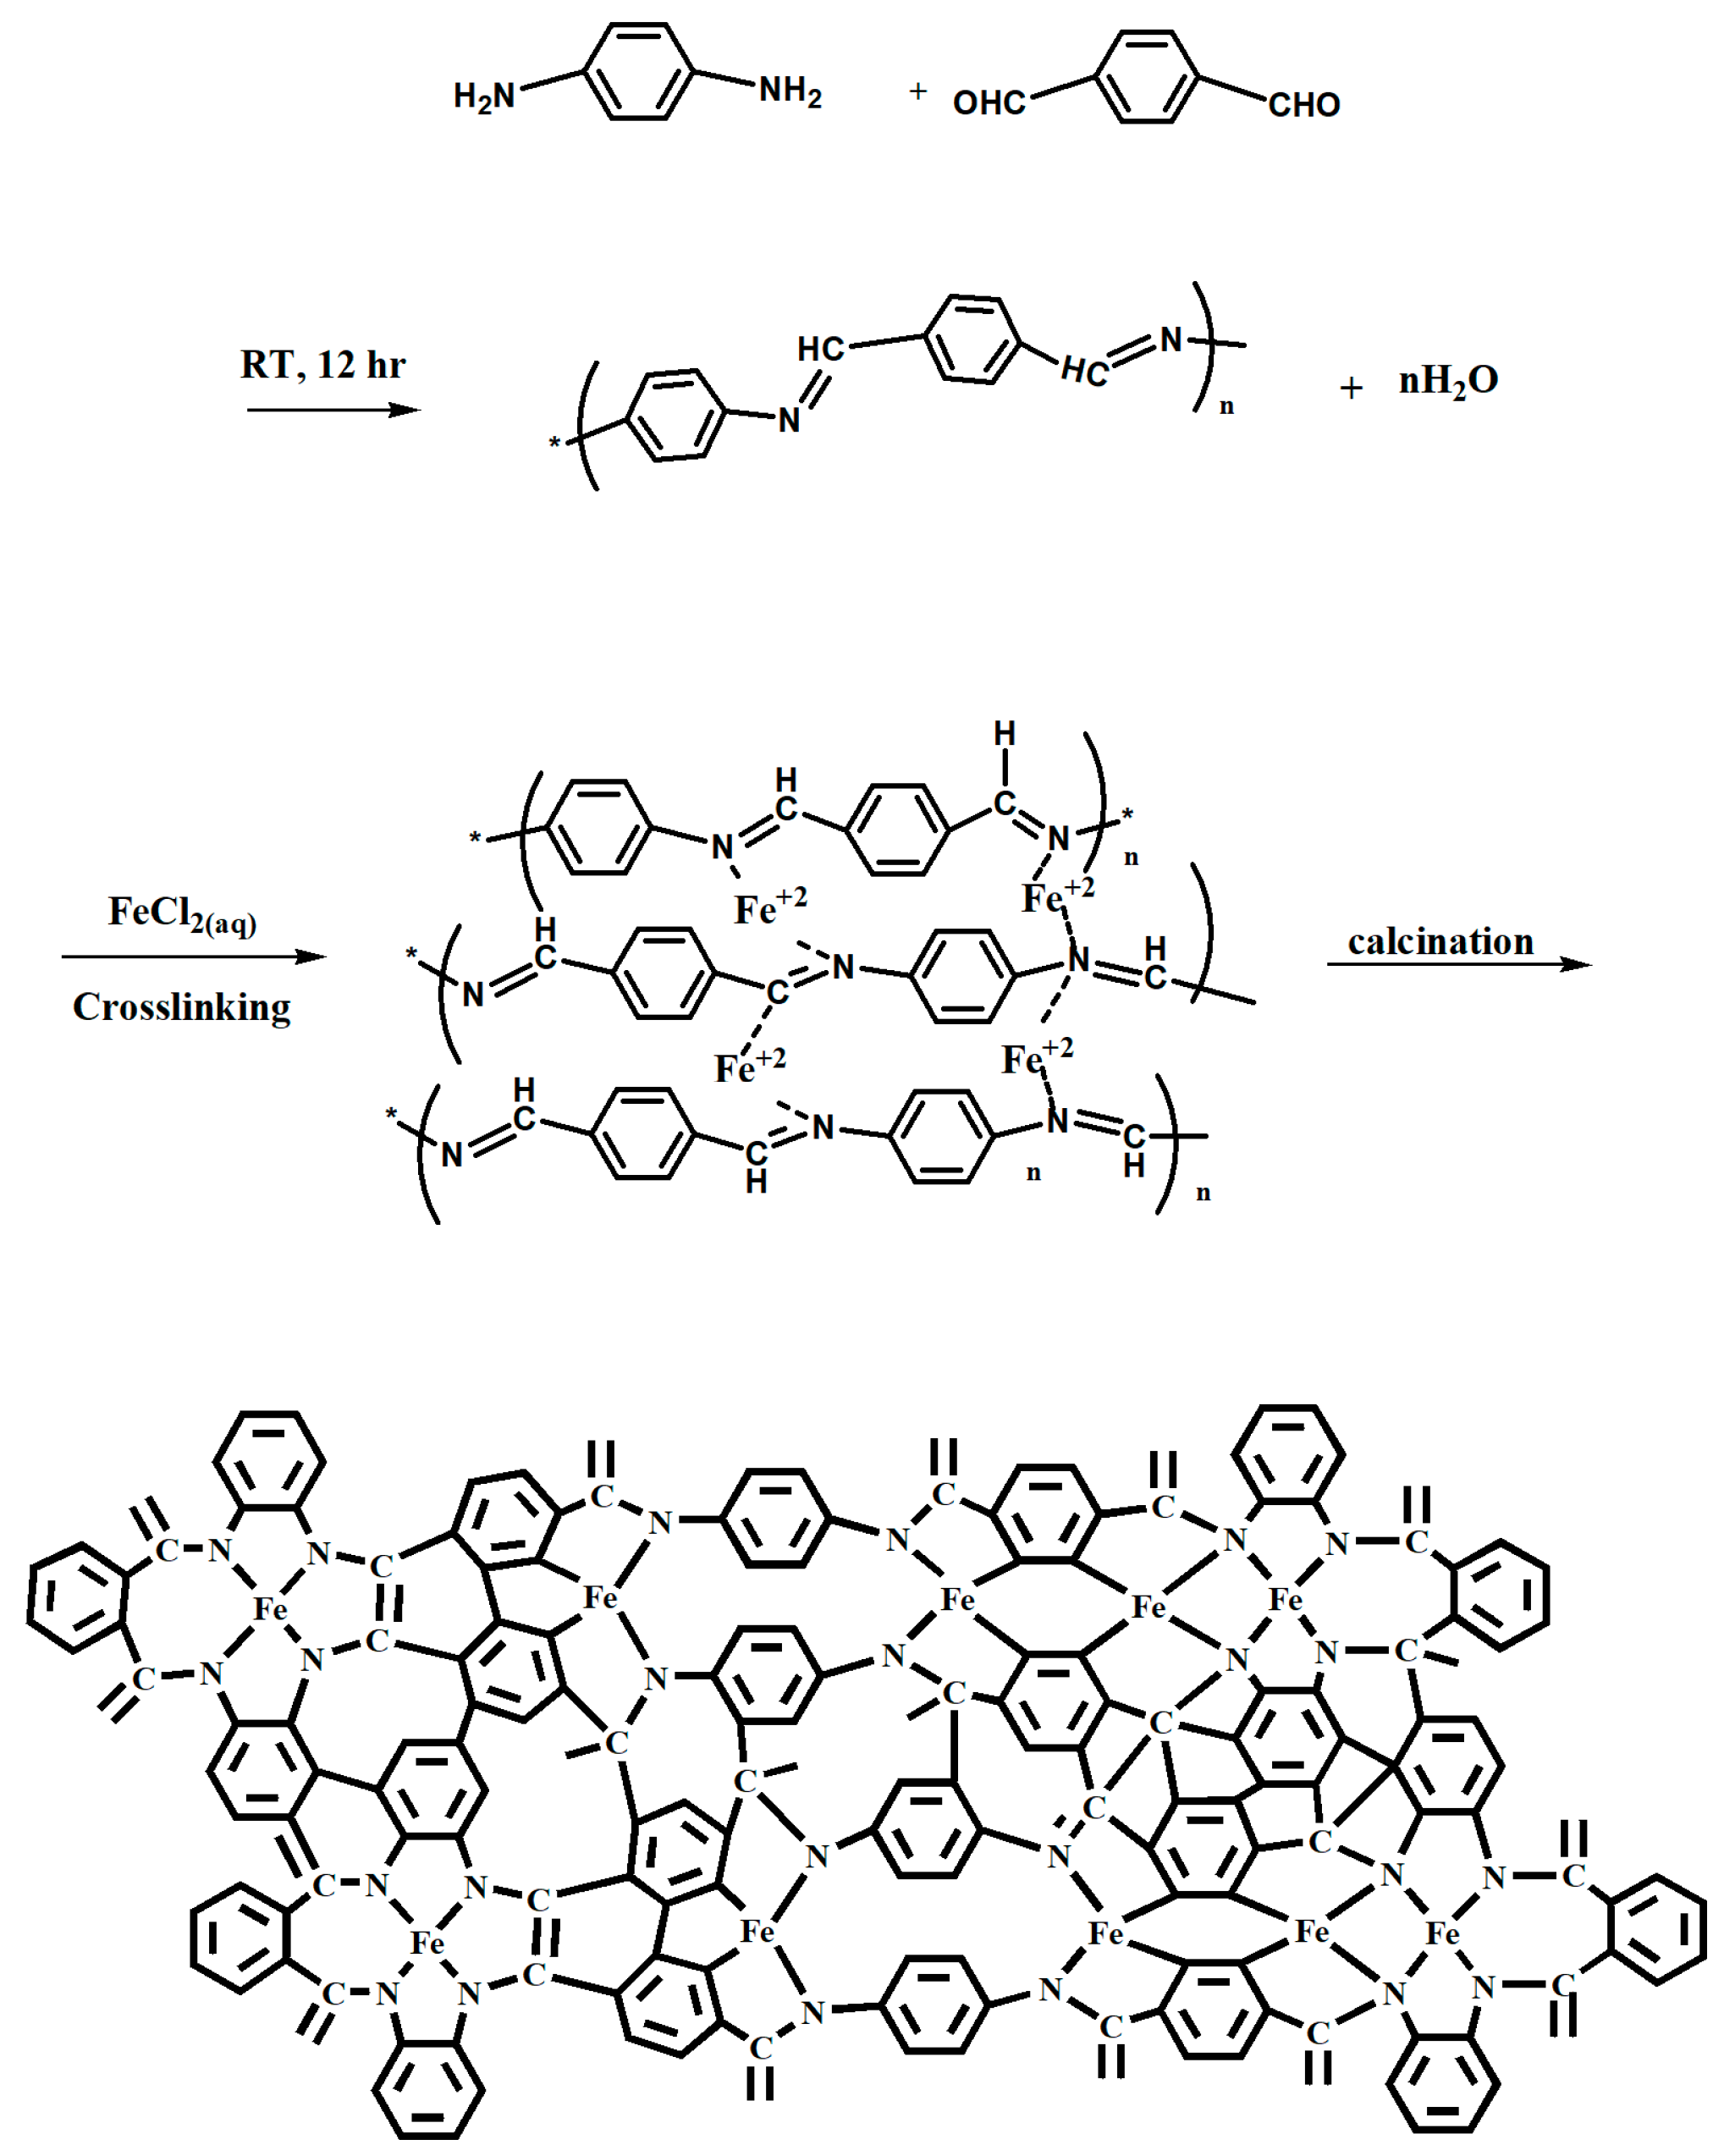
2.2. Preparation of FeNC Catalyst
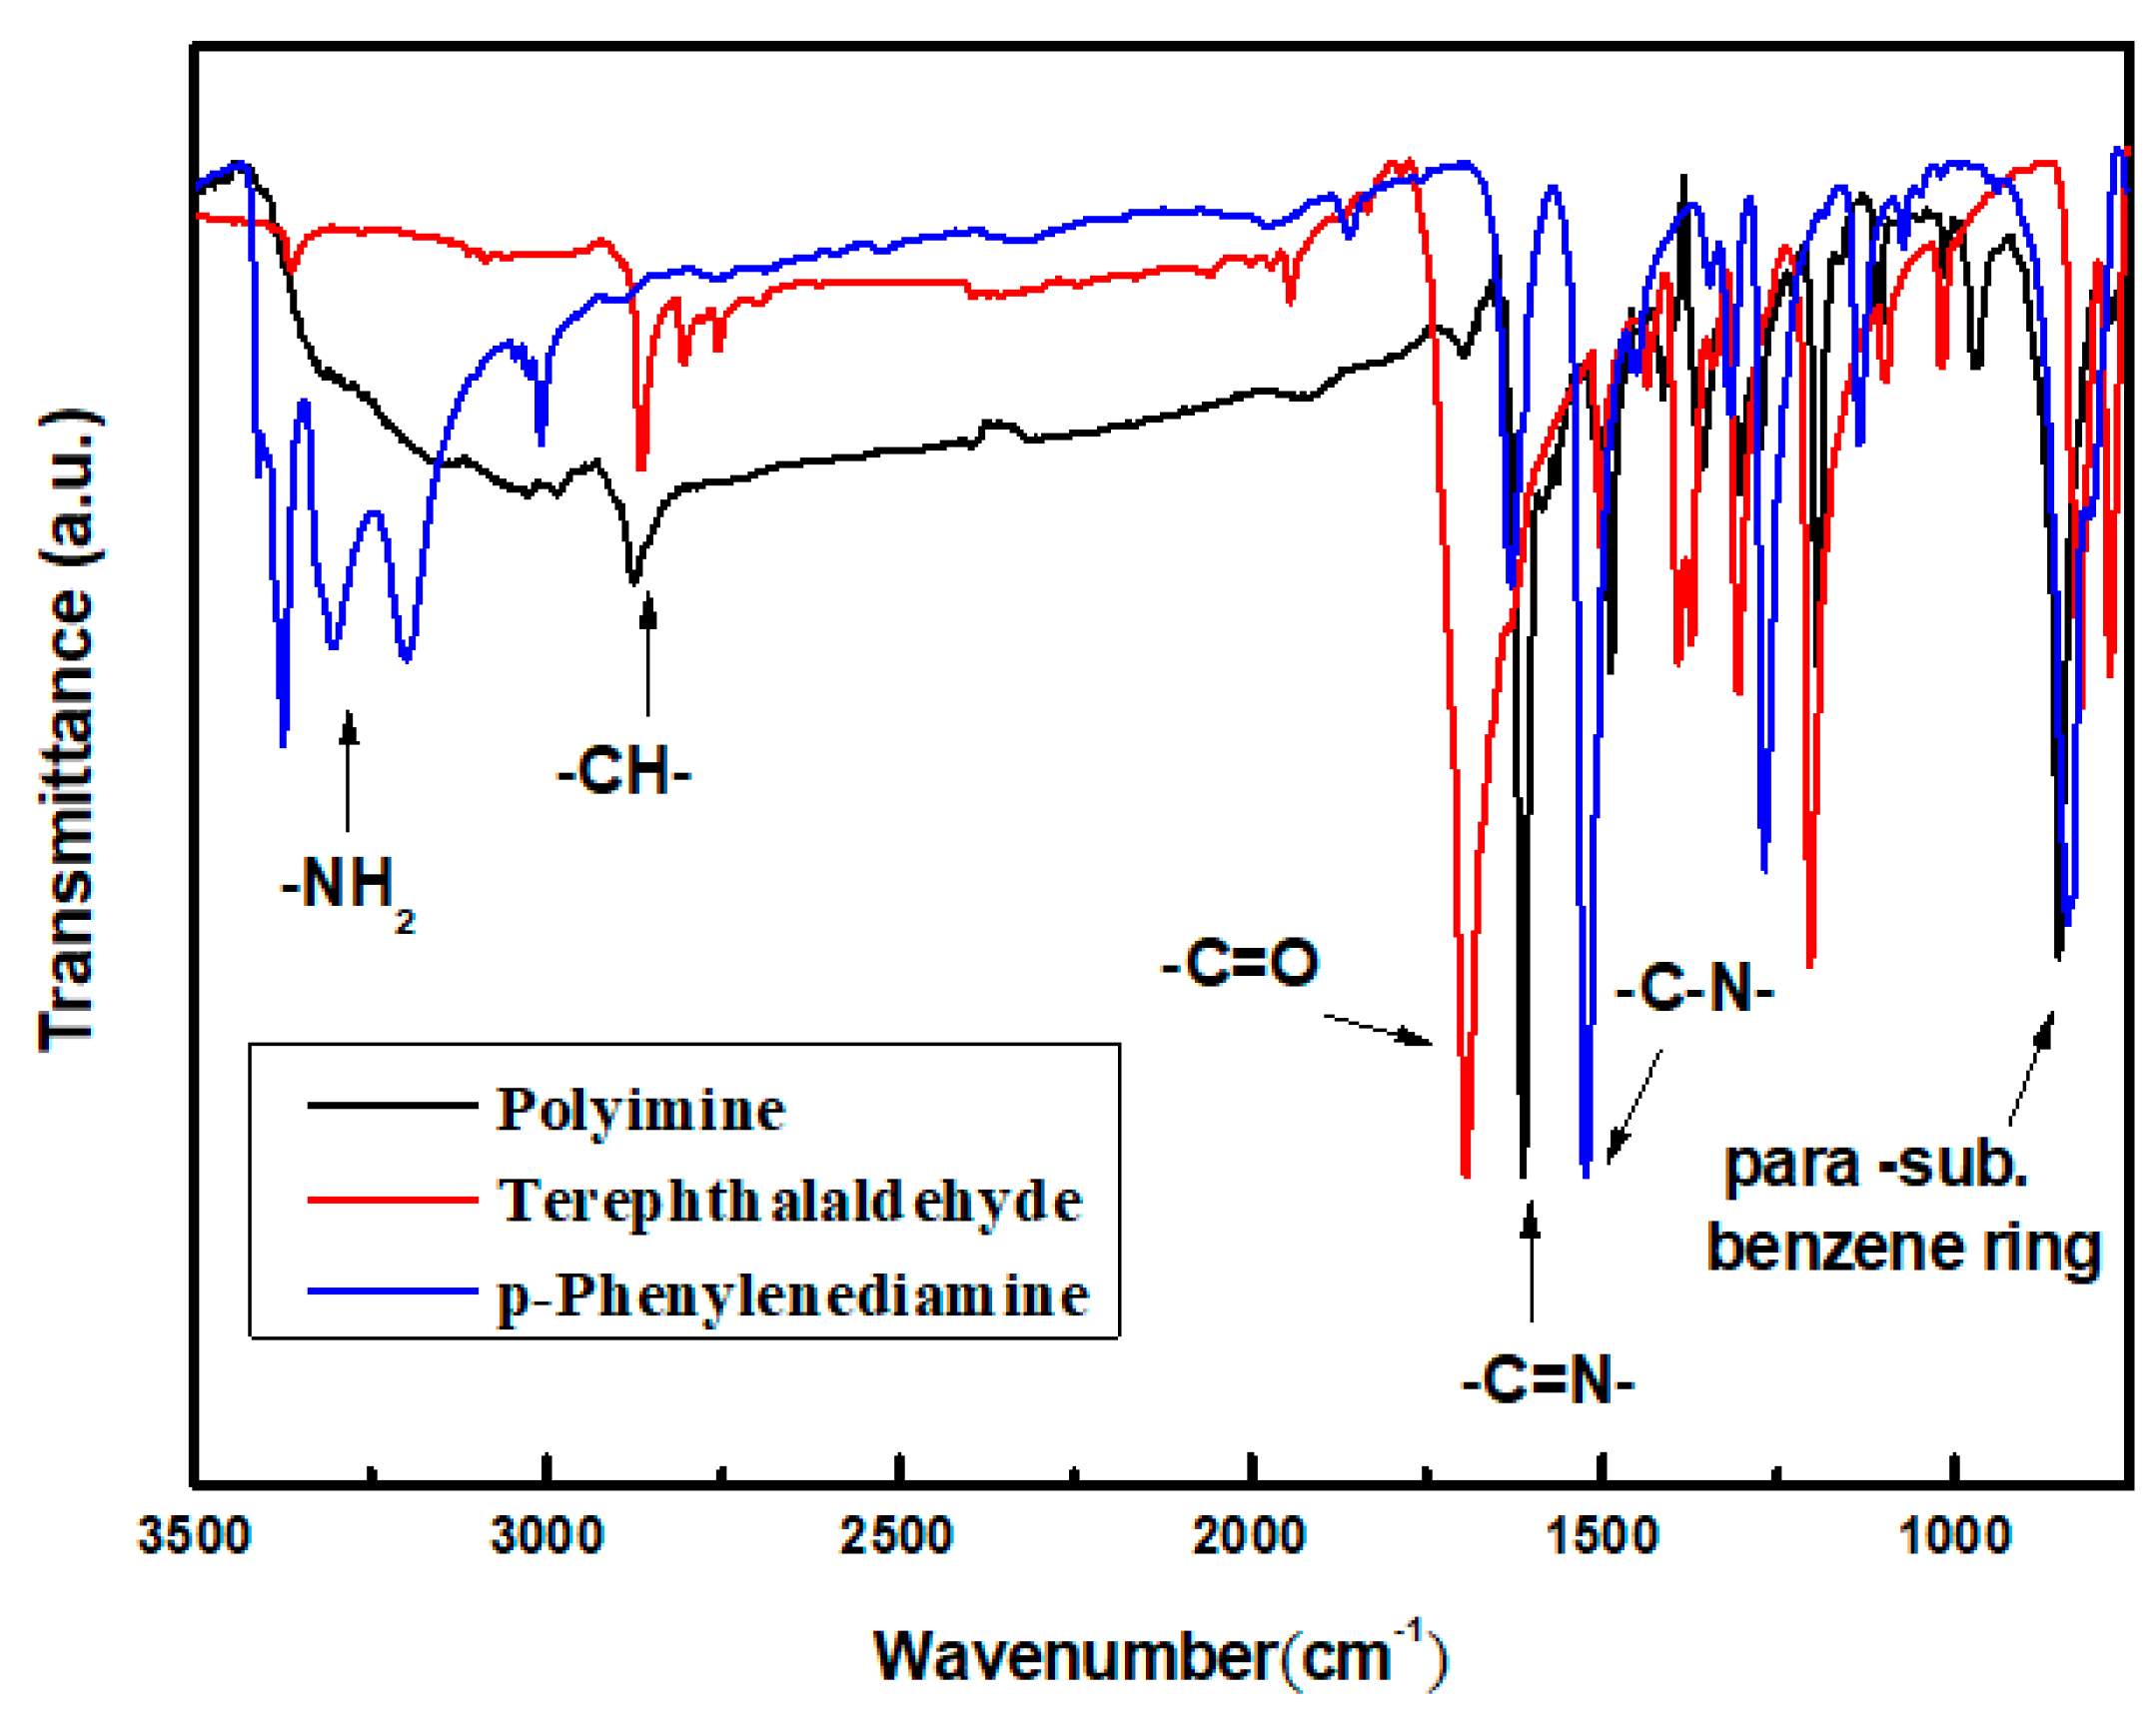
2.3. FTIR Spectroscopy
2.4. X-ray Photoelectron Spectroscopy (XPS)
2.5. Wide Angle X-ray Diffraction: Powder X-ray Diffraction (WXRD)
2.6. Scanning Electronic Microscopy (SEM)
2.7. Transmission Electronic Microscopy (TEM)
2.8. Surface Area and Pore Size Measurement (BET Method)
2.9. Electrochemical Characterization
2.9.1. Current–Potential Polarization-Linear Scan Voltammetry (LSV)
2.9.2. MEA Preparation
2.9.3. Single-Cell Performance Testing
3. Results
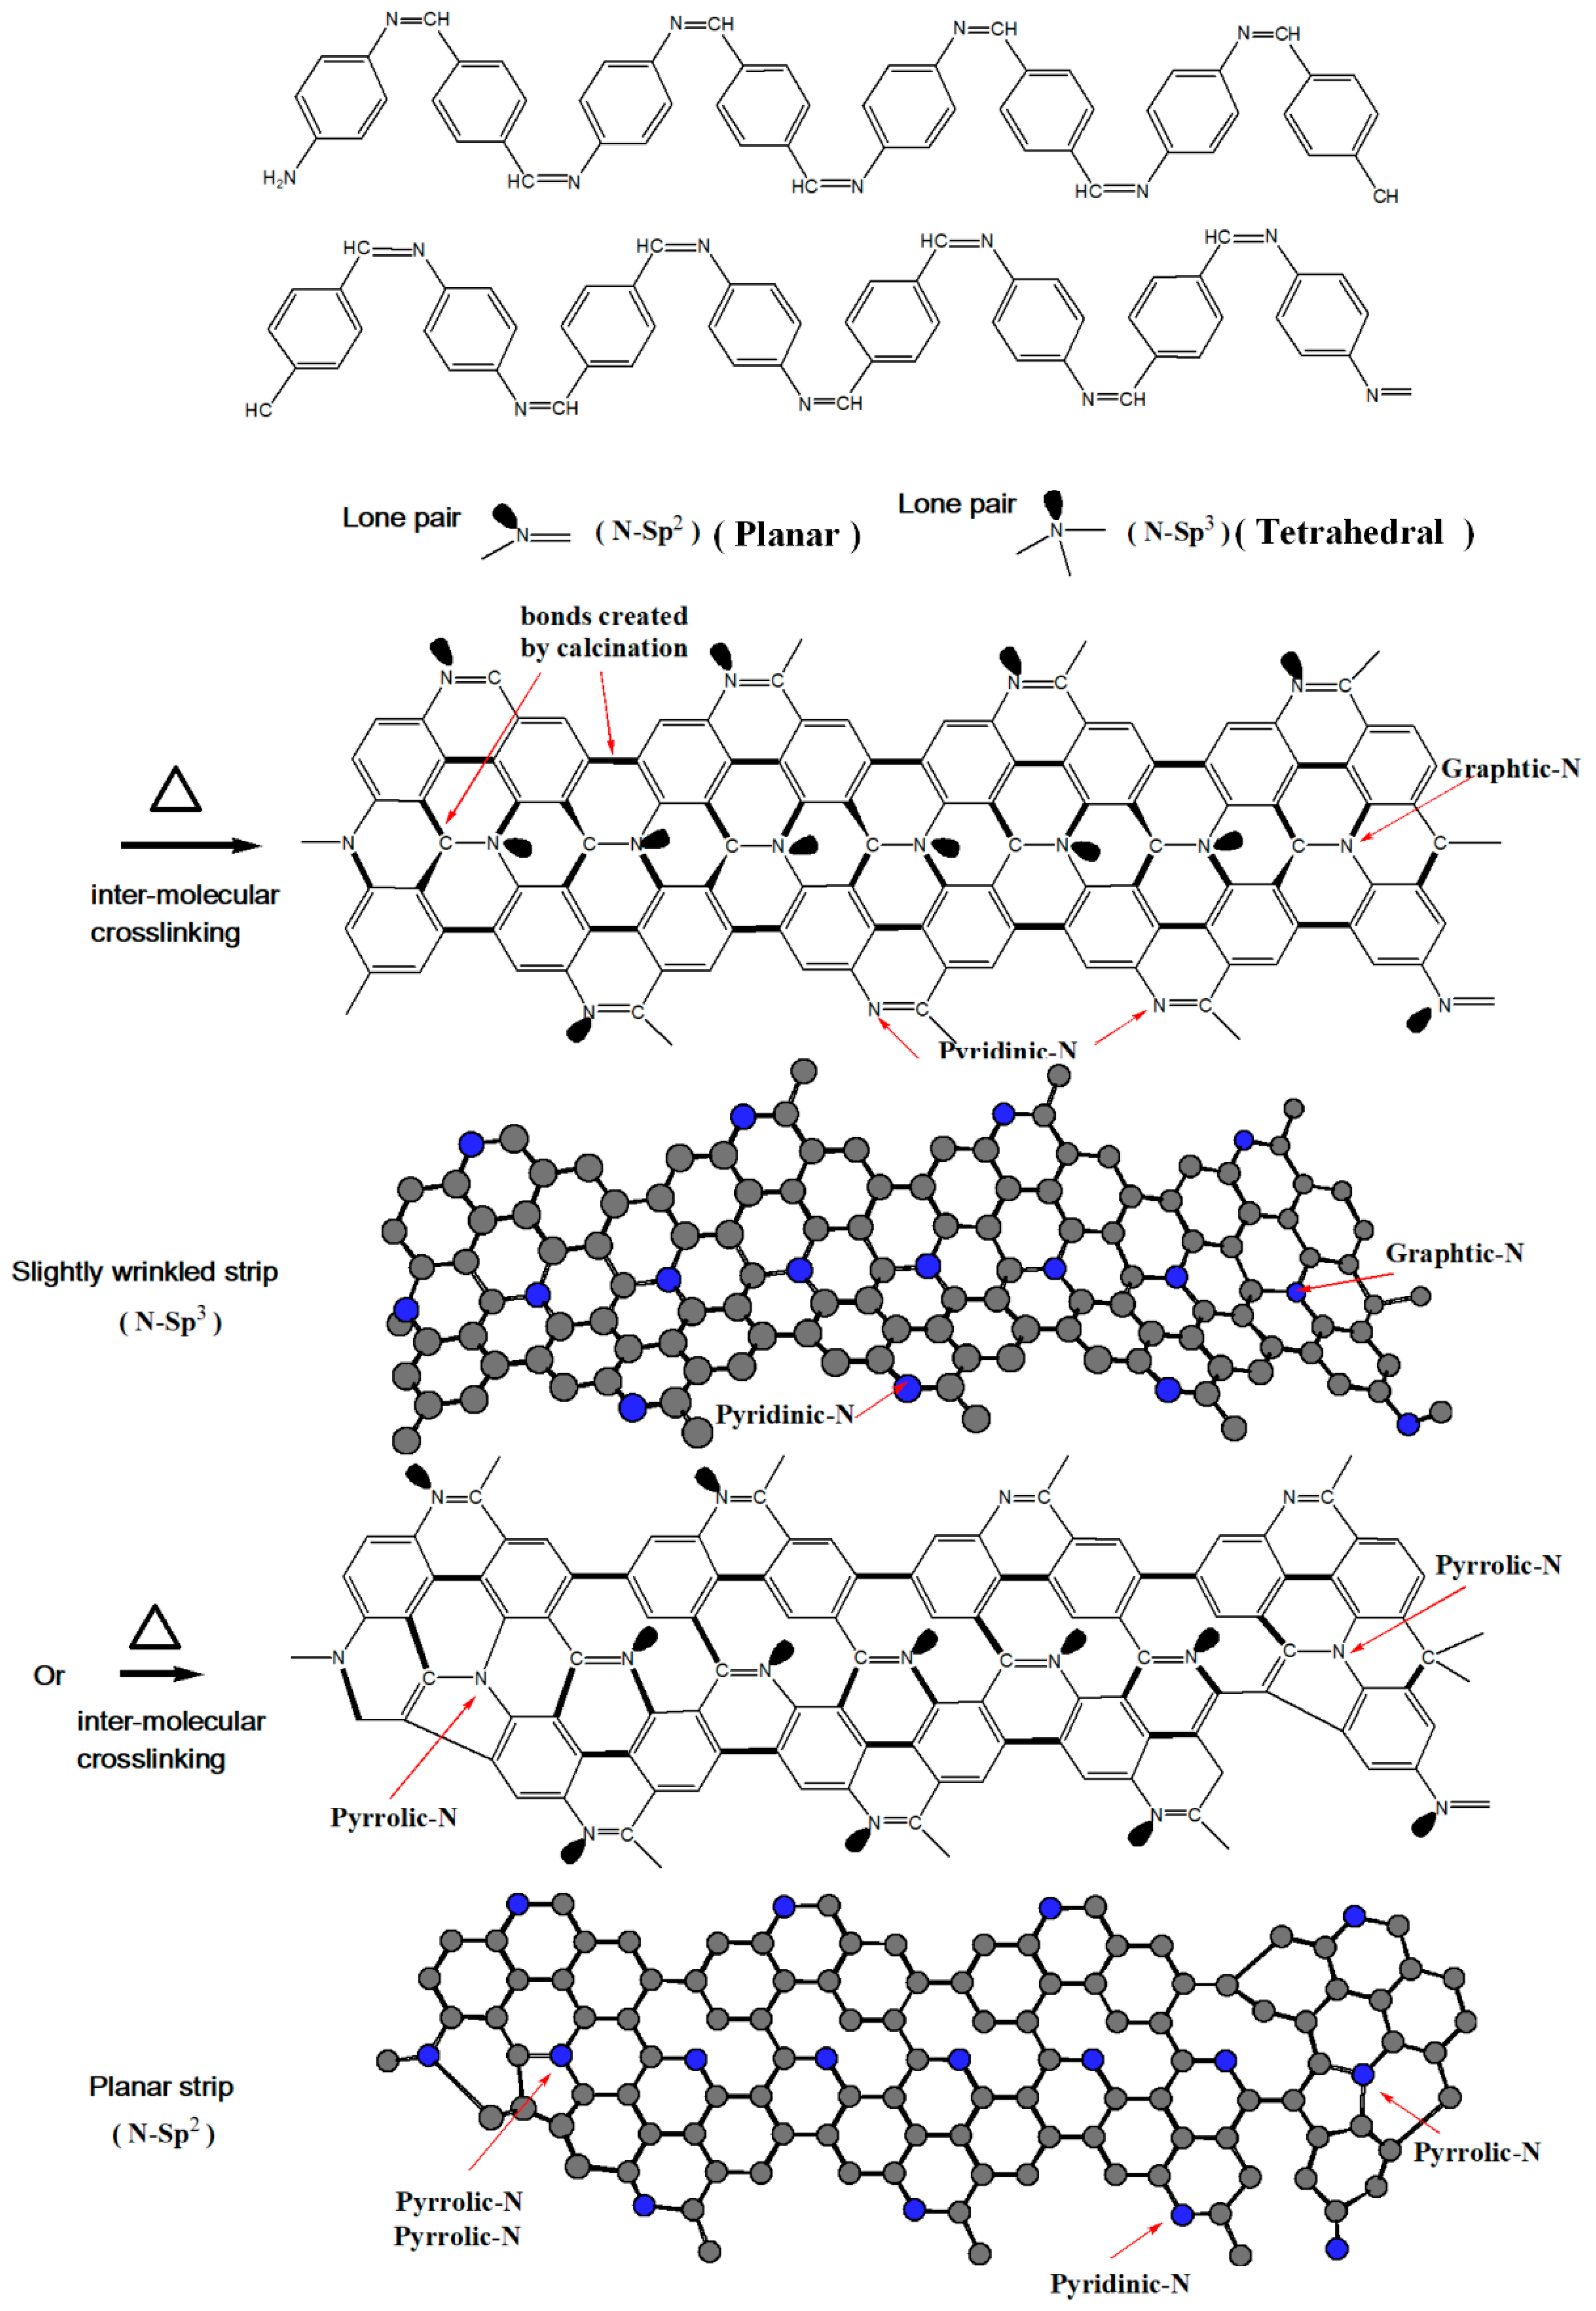
3.1. FTIR Spectra
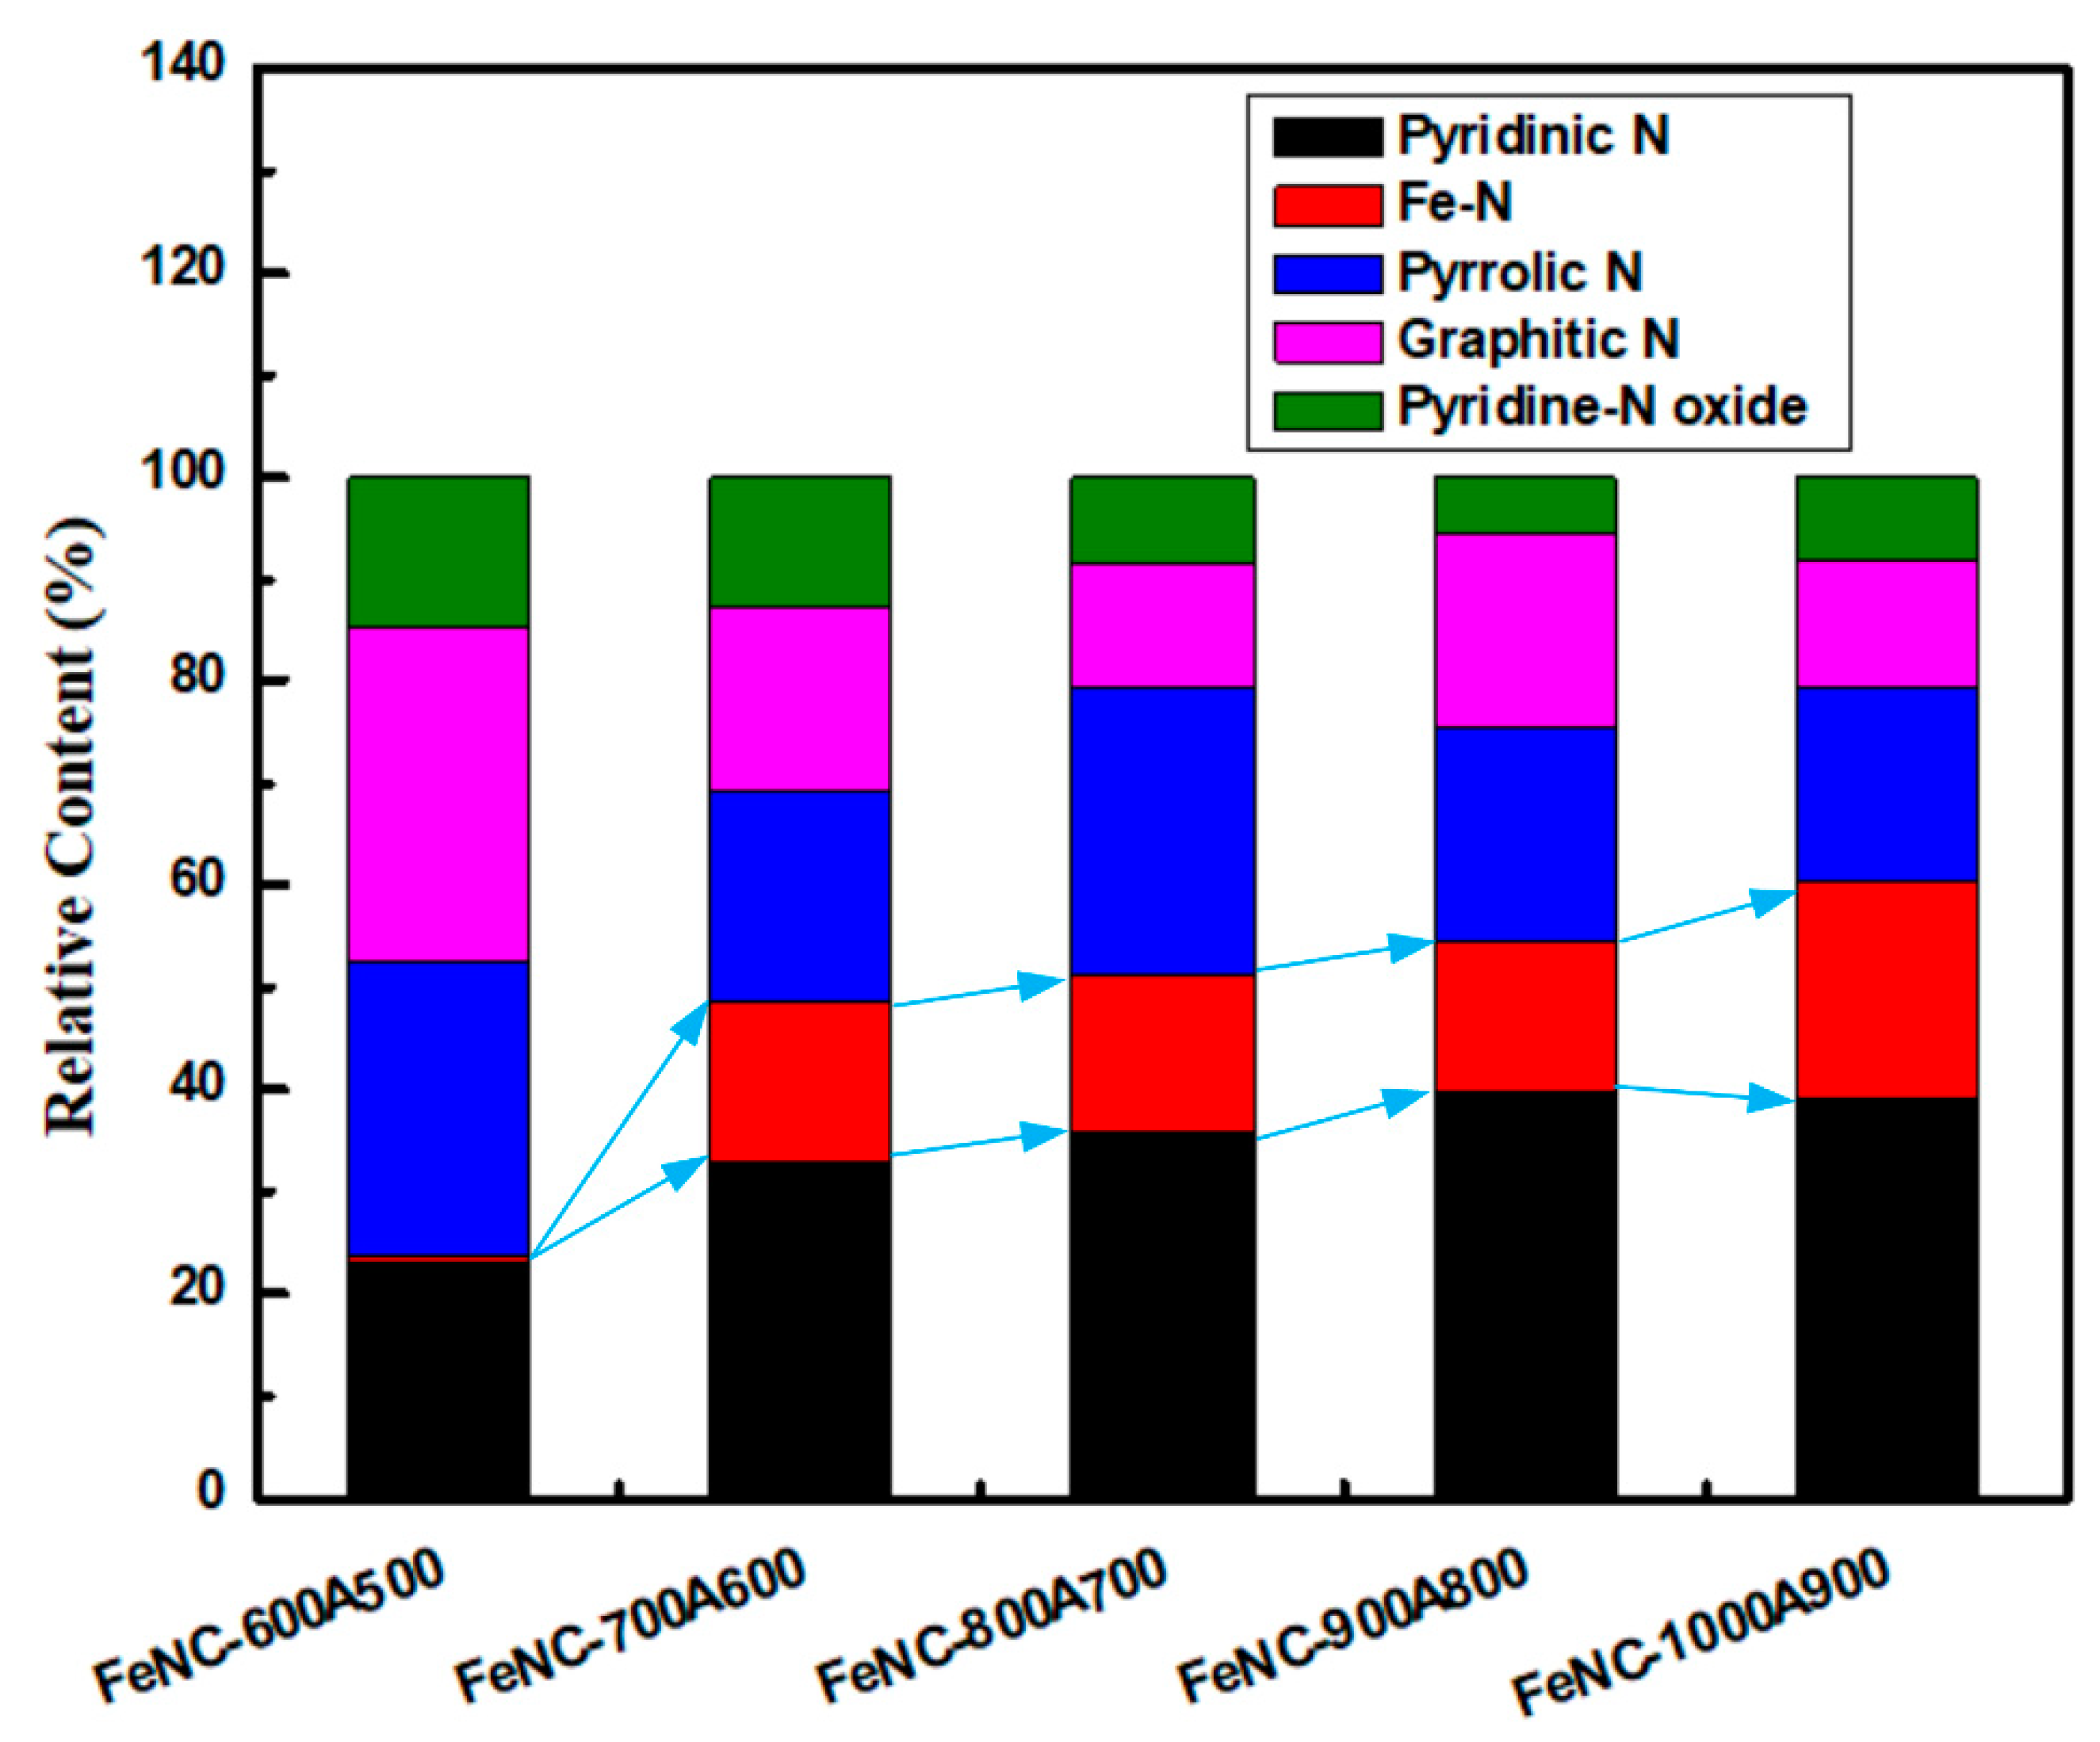
3.2. XPS
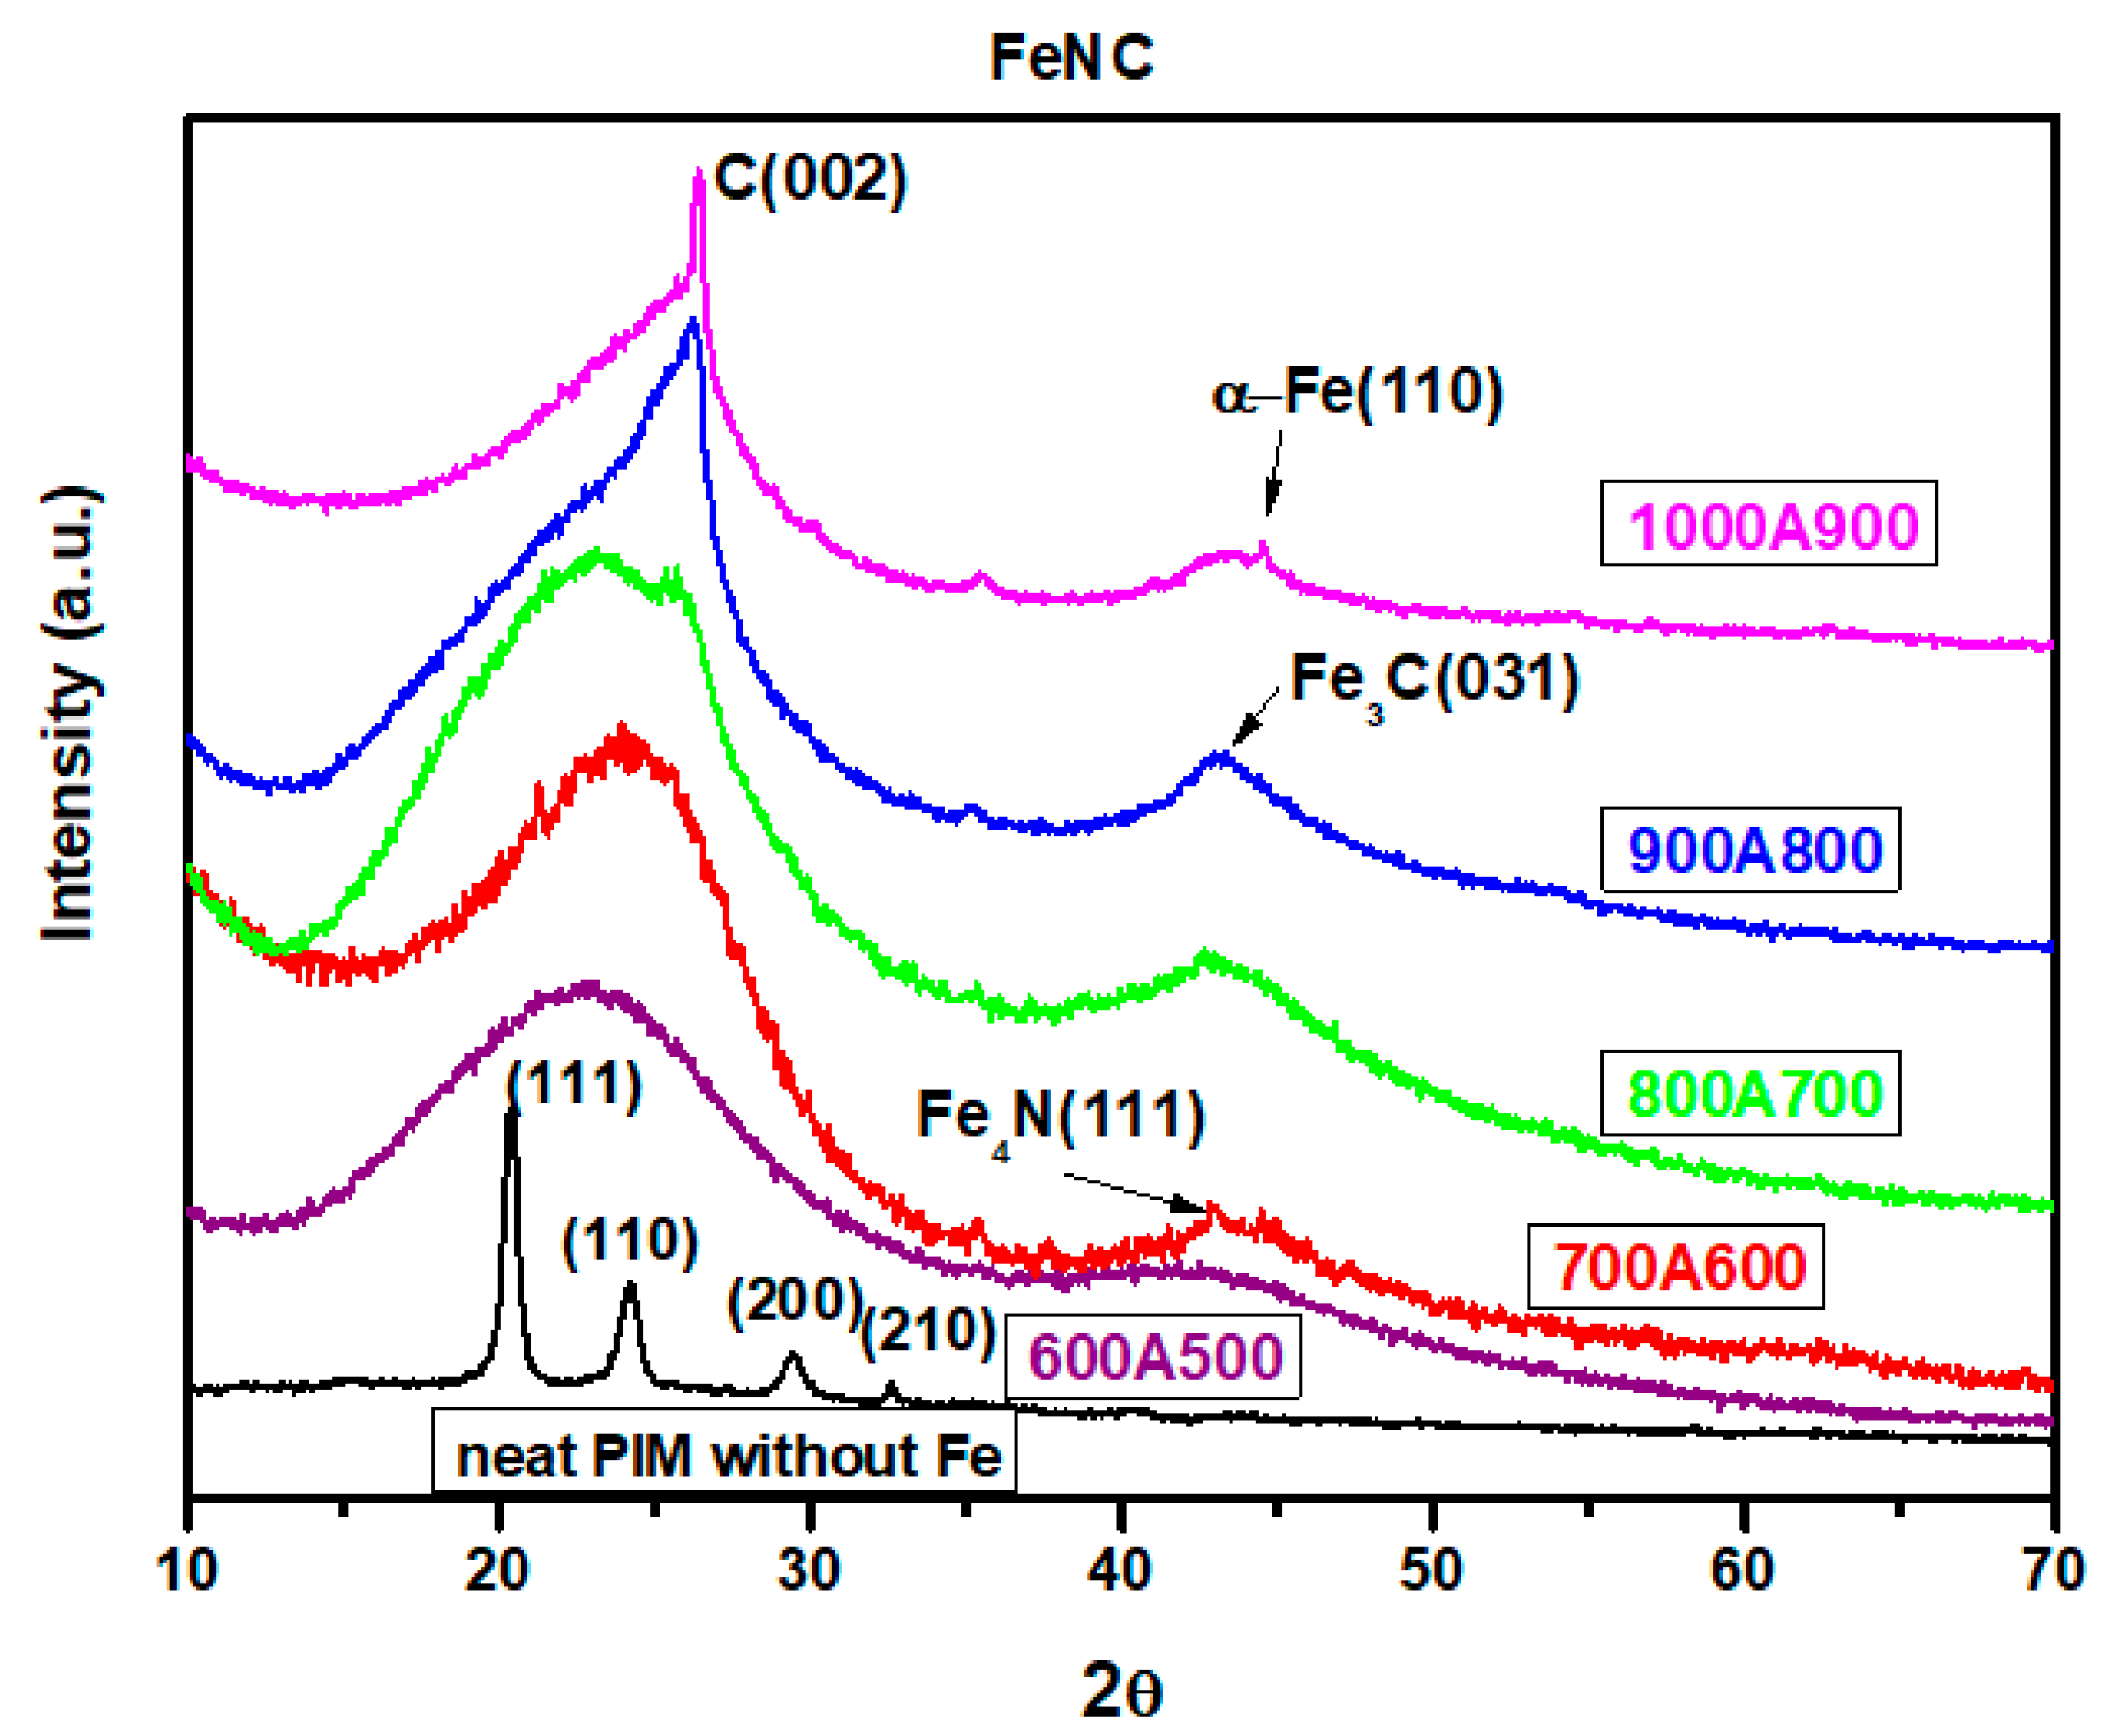
3.3. XRD
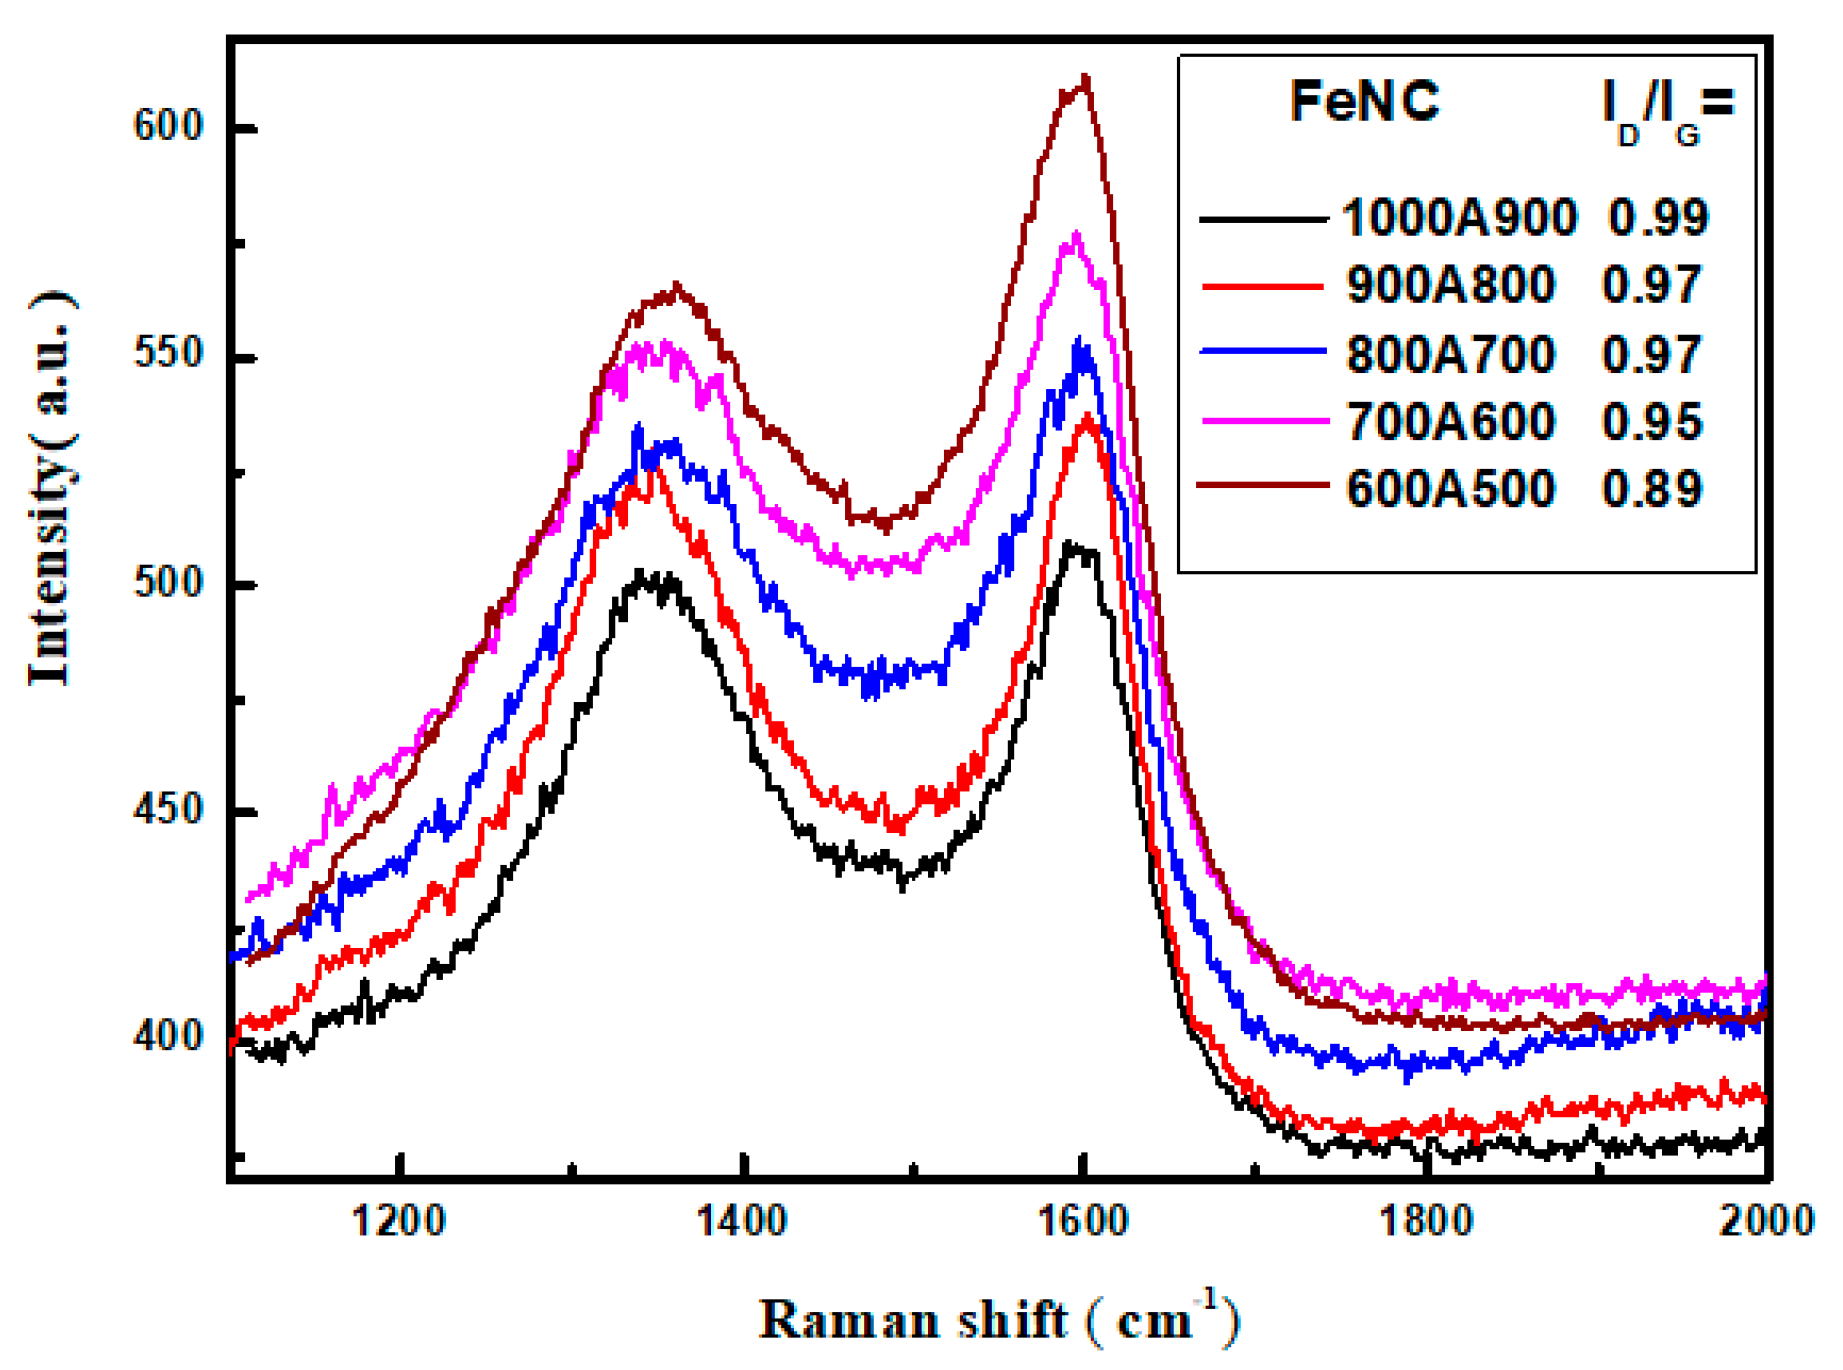
3.4. Raman Spectroscopy
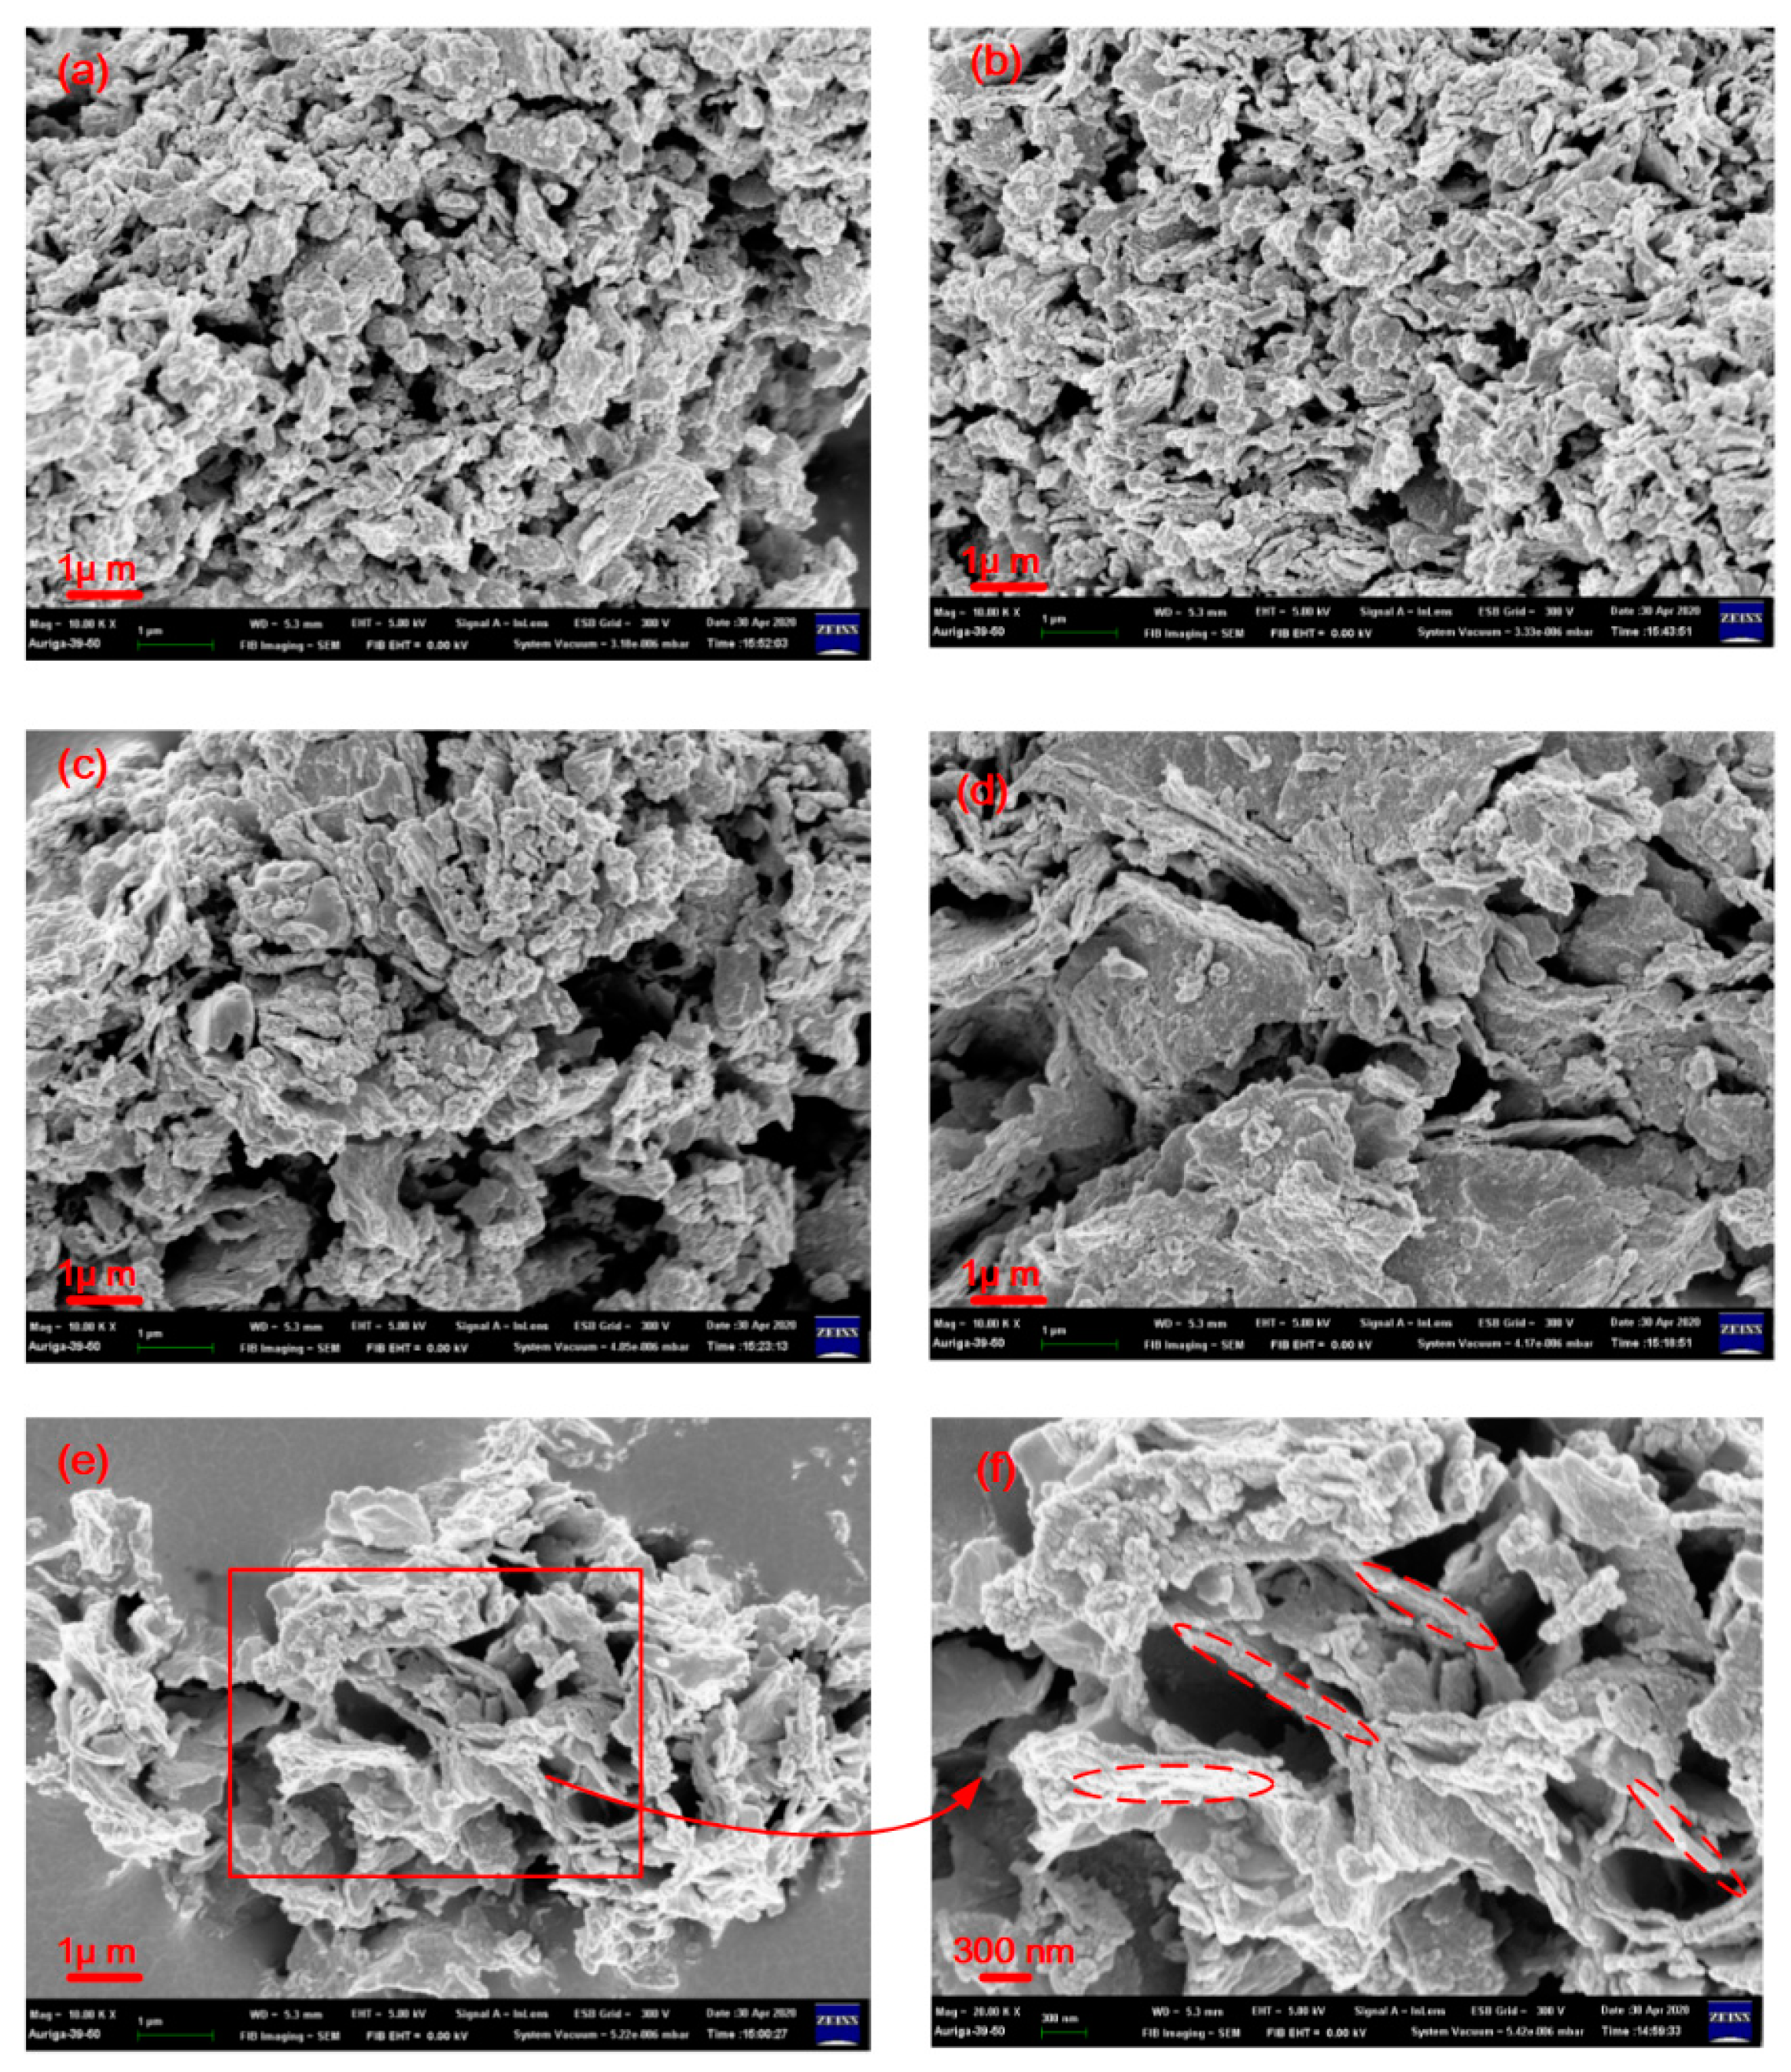
3.5. SEM
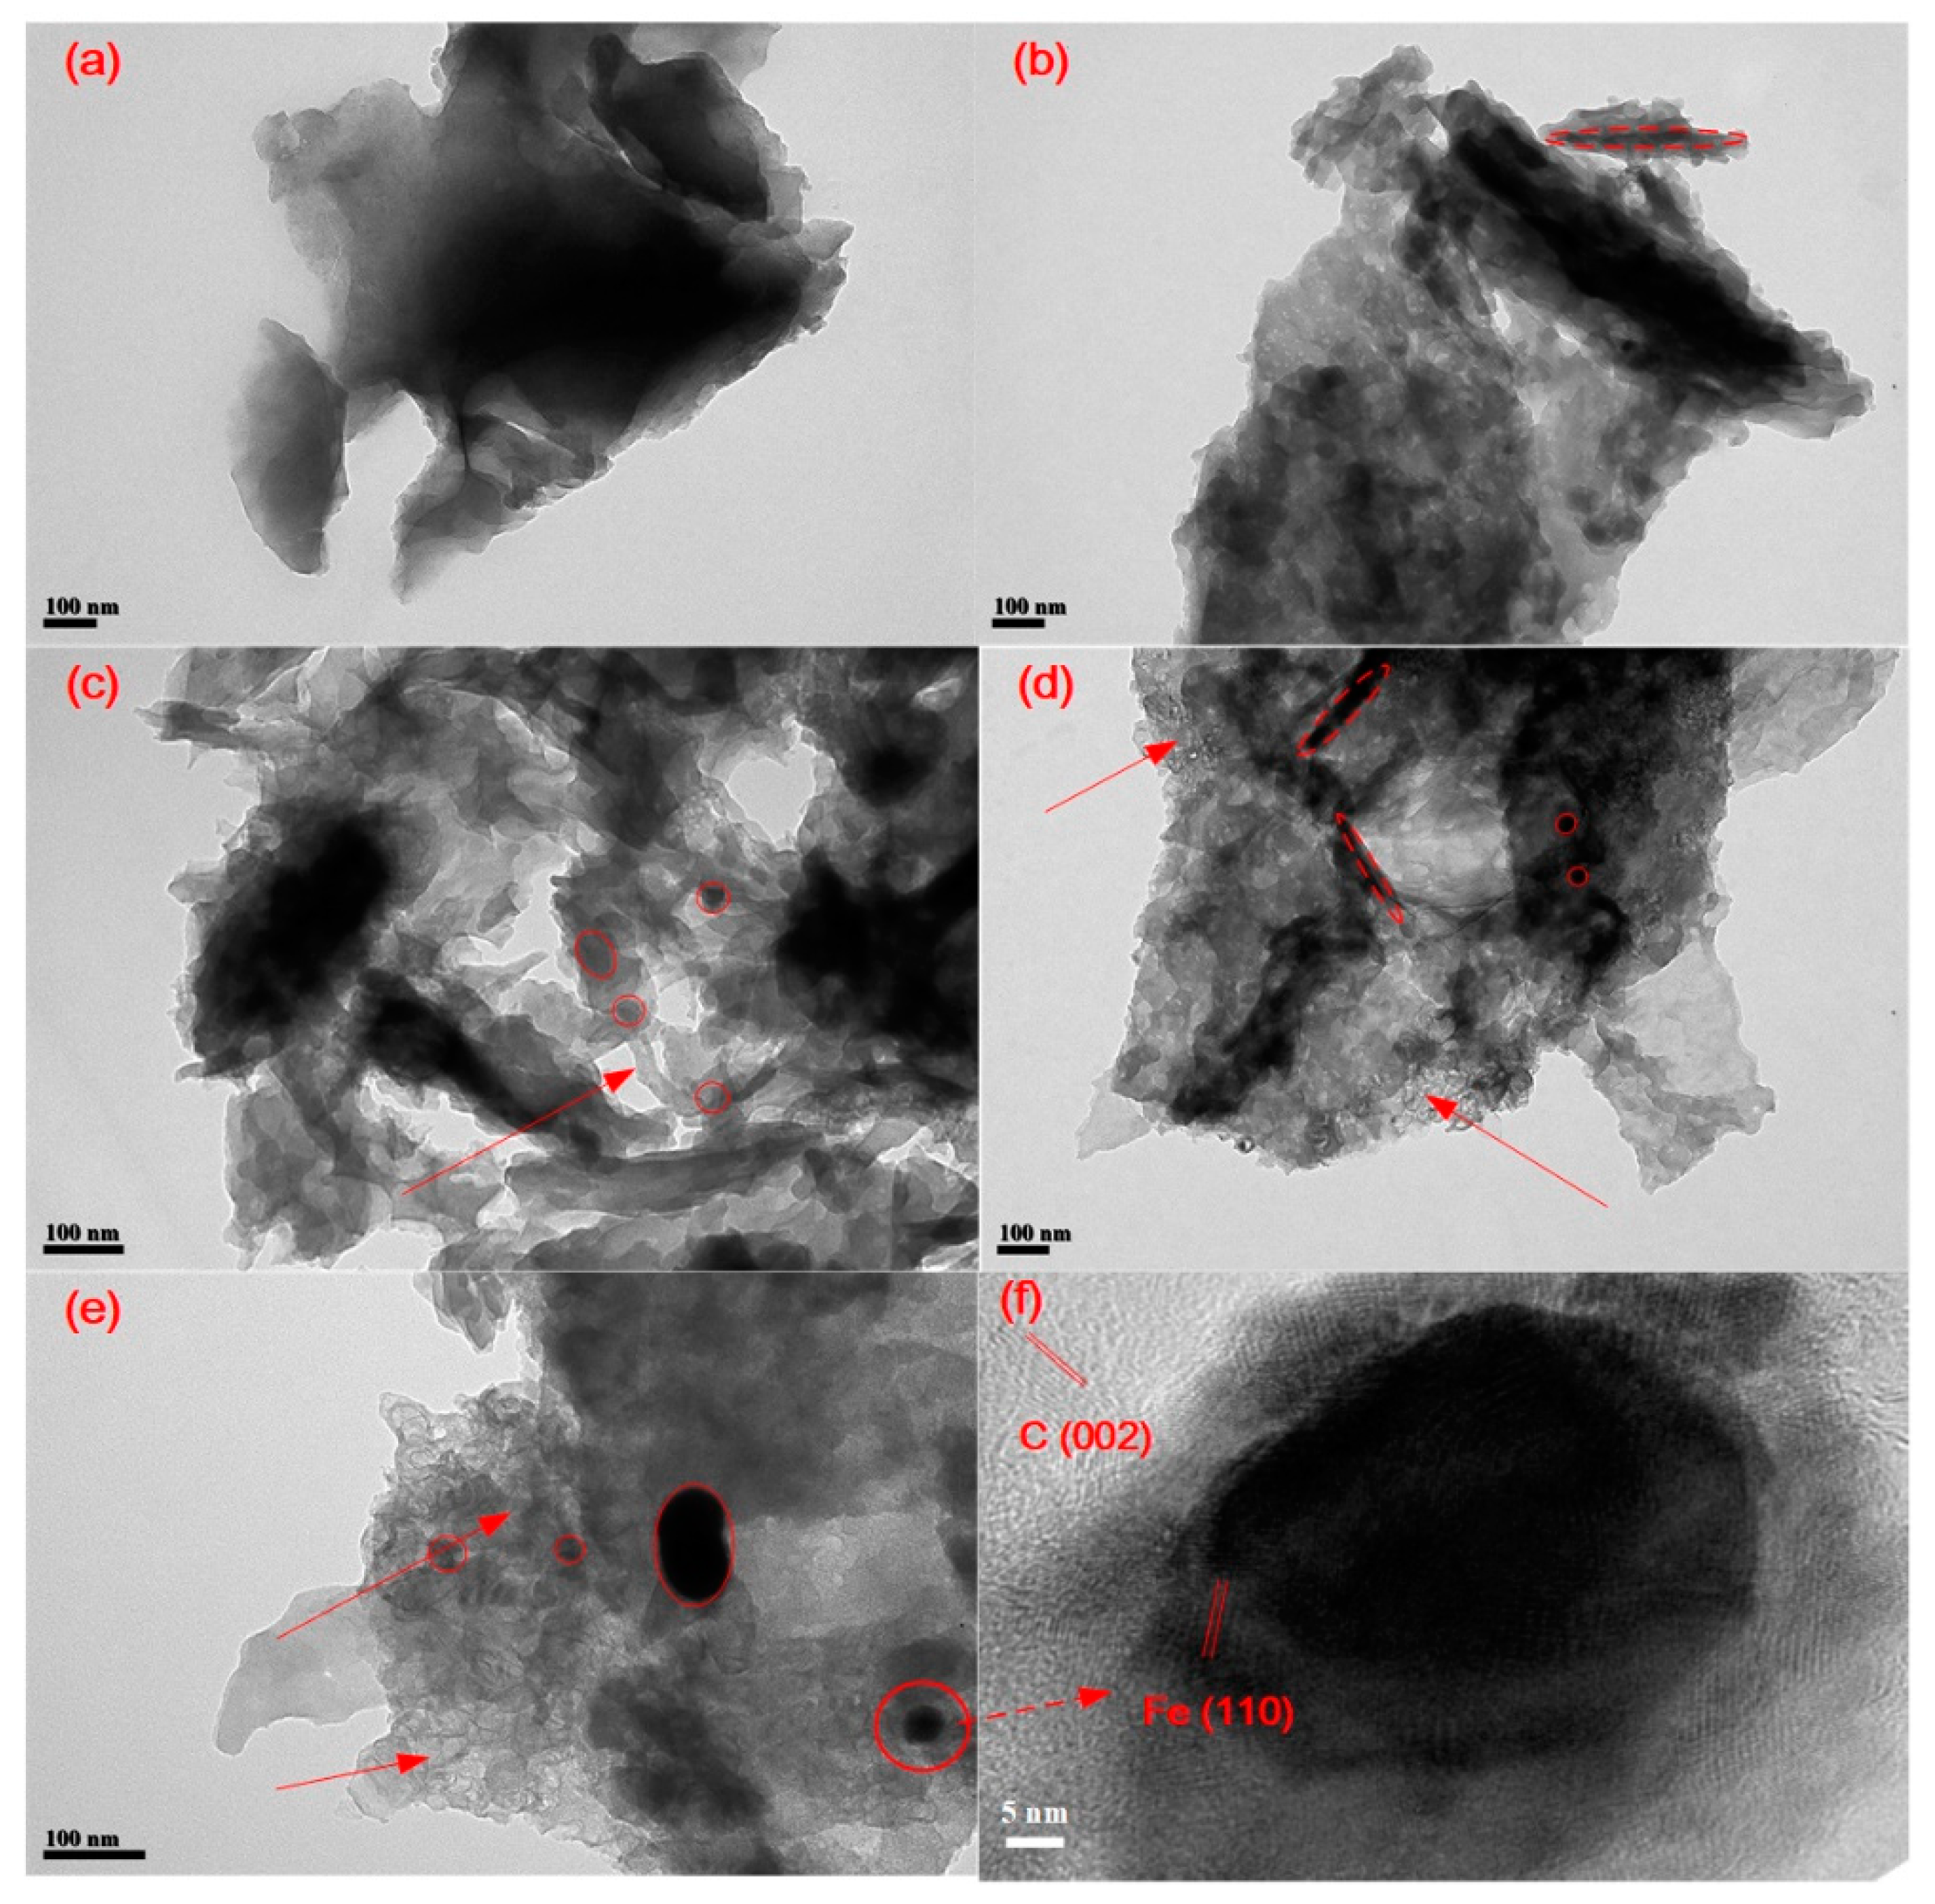
3.6. TEM
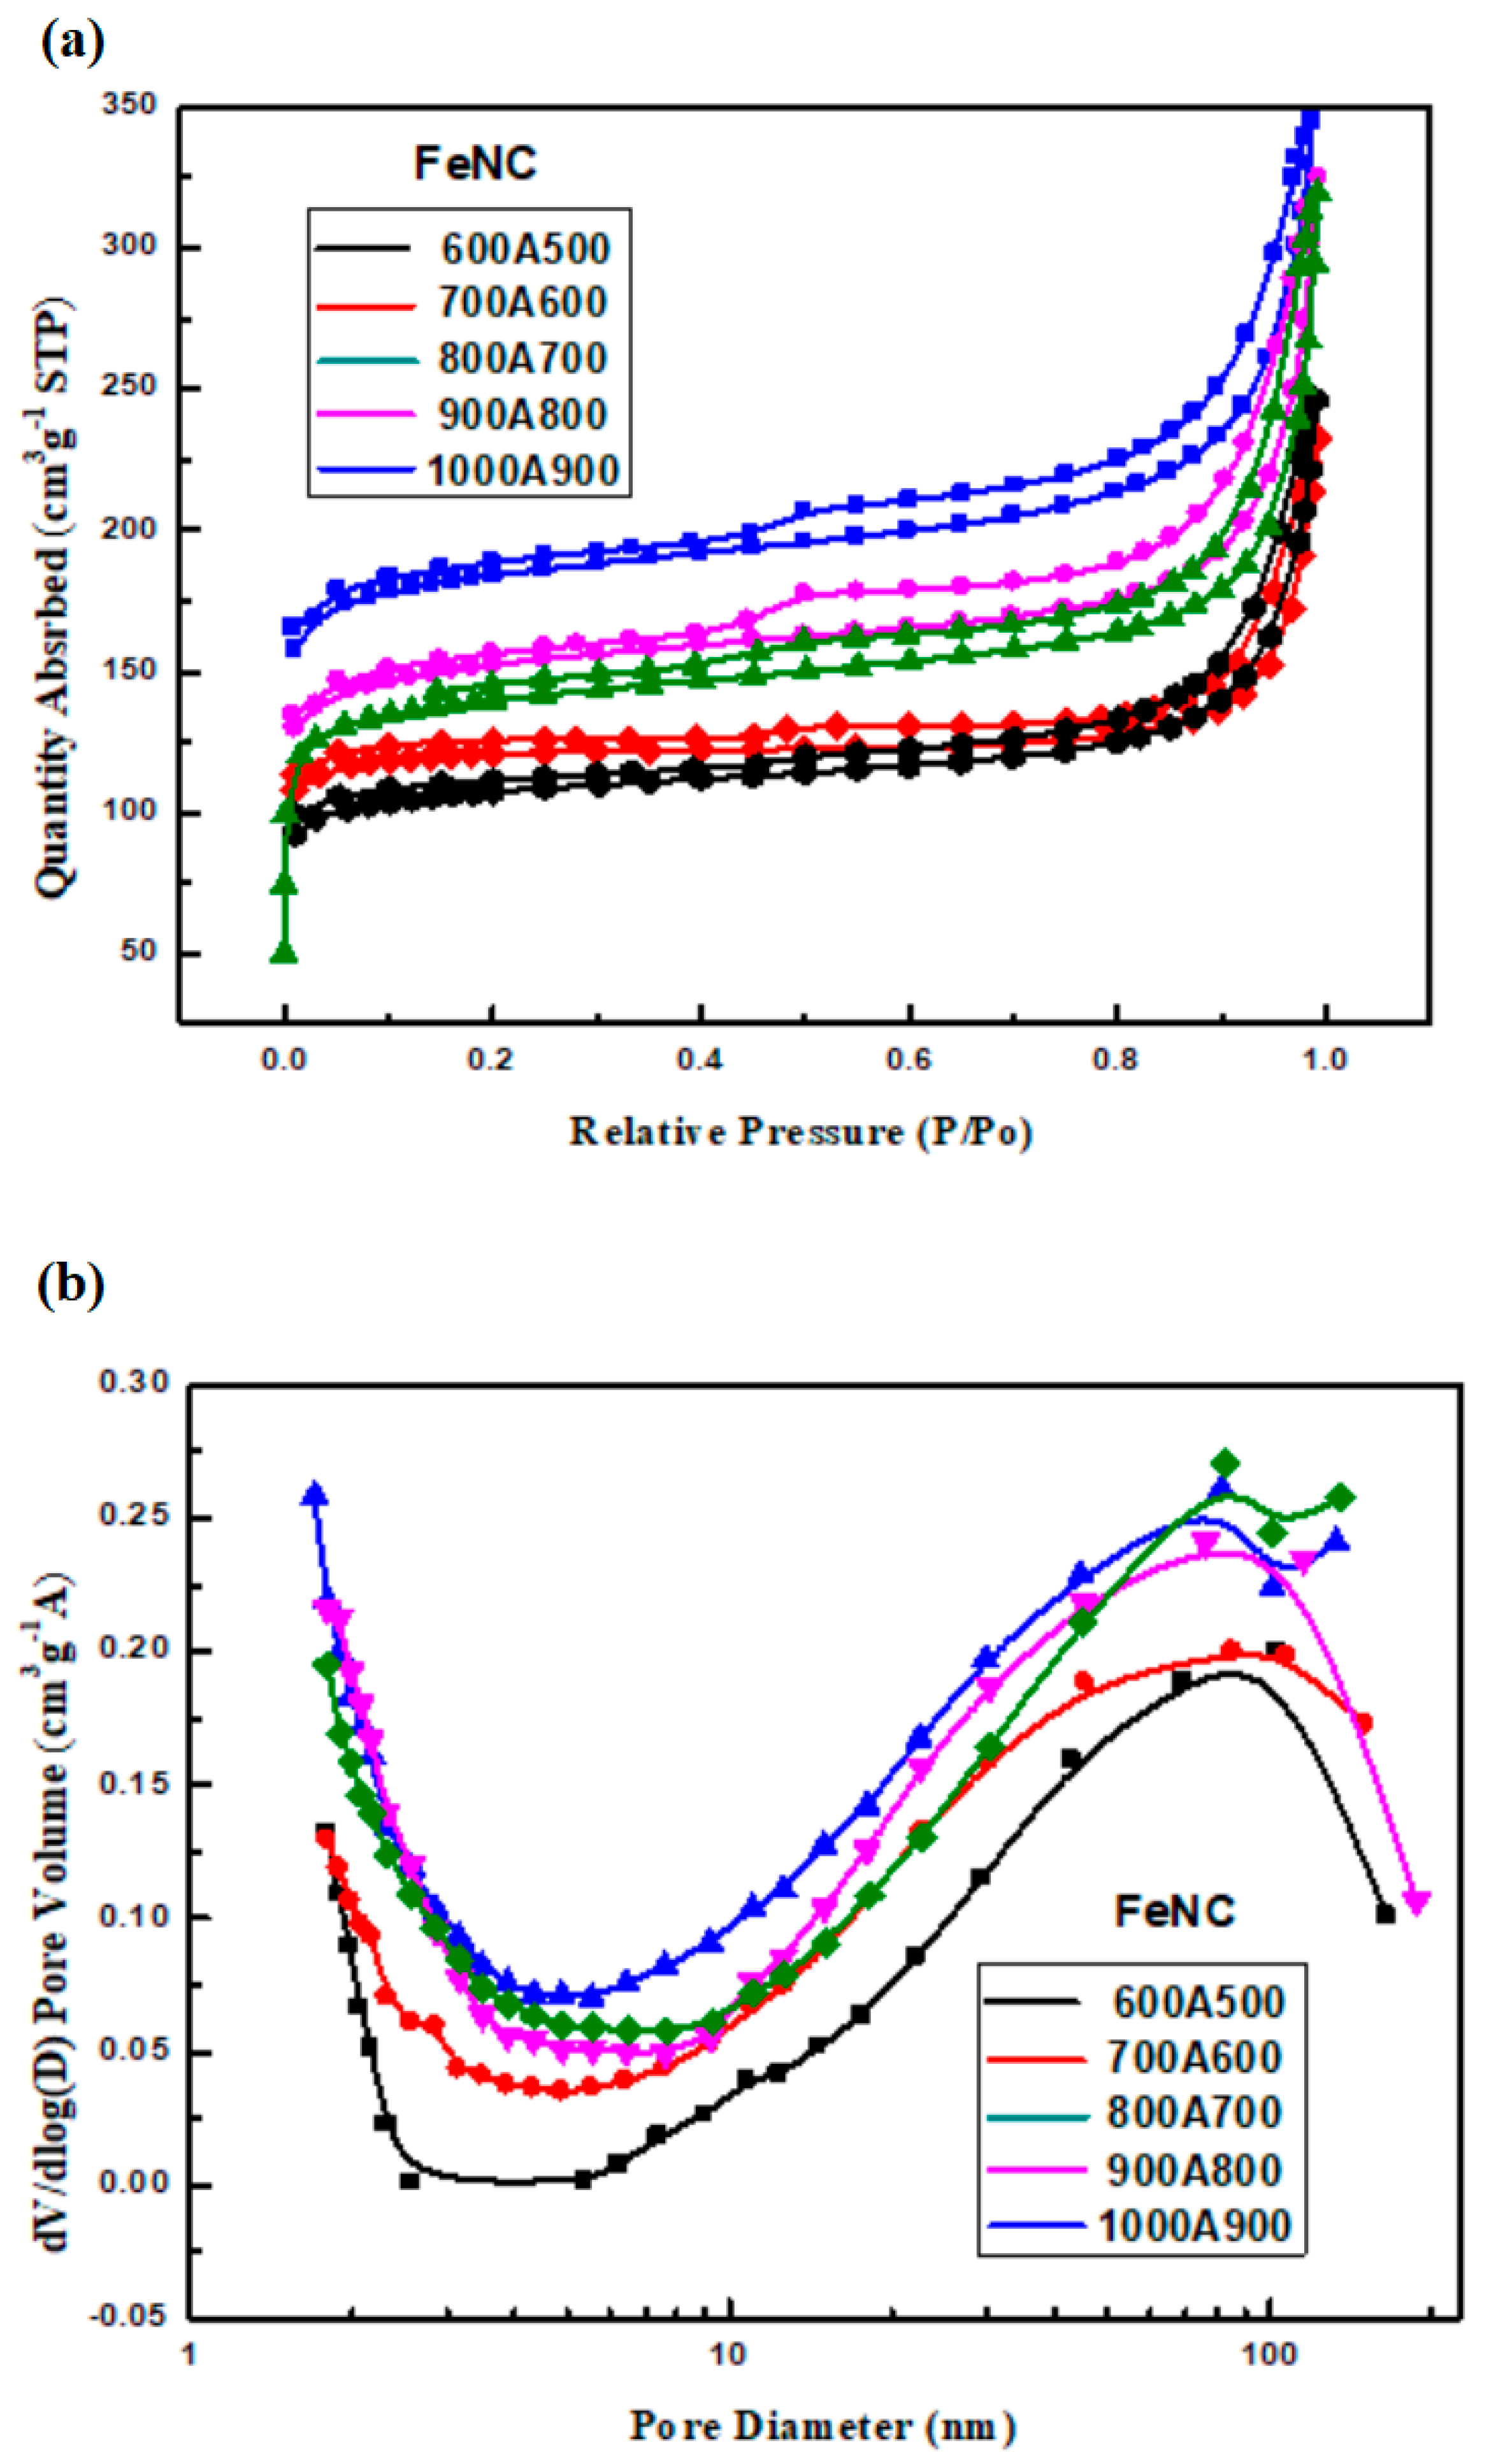
3.7. BET Surface Area
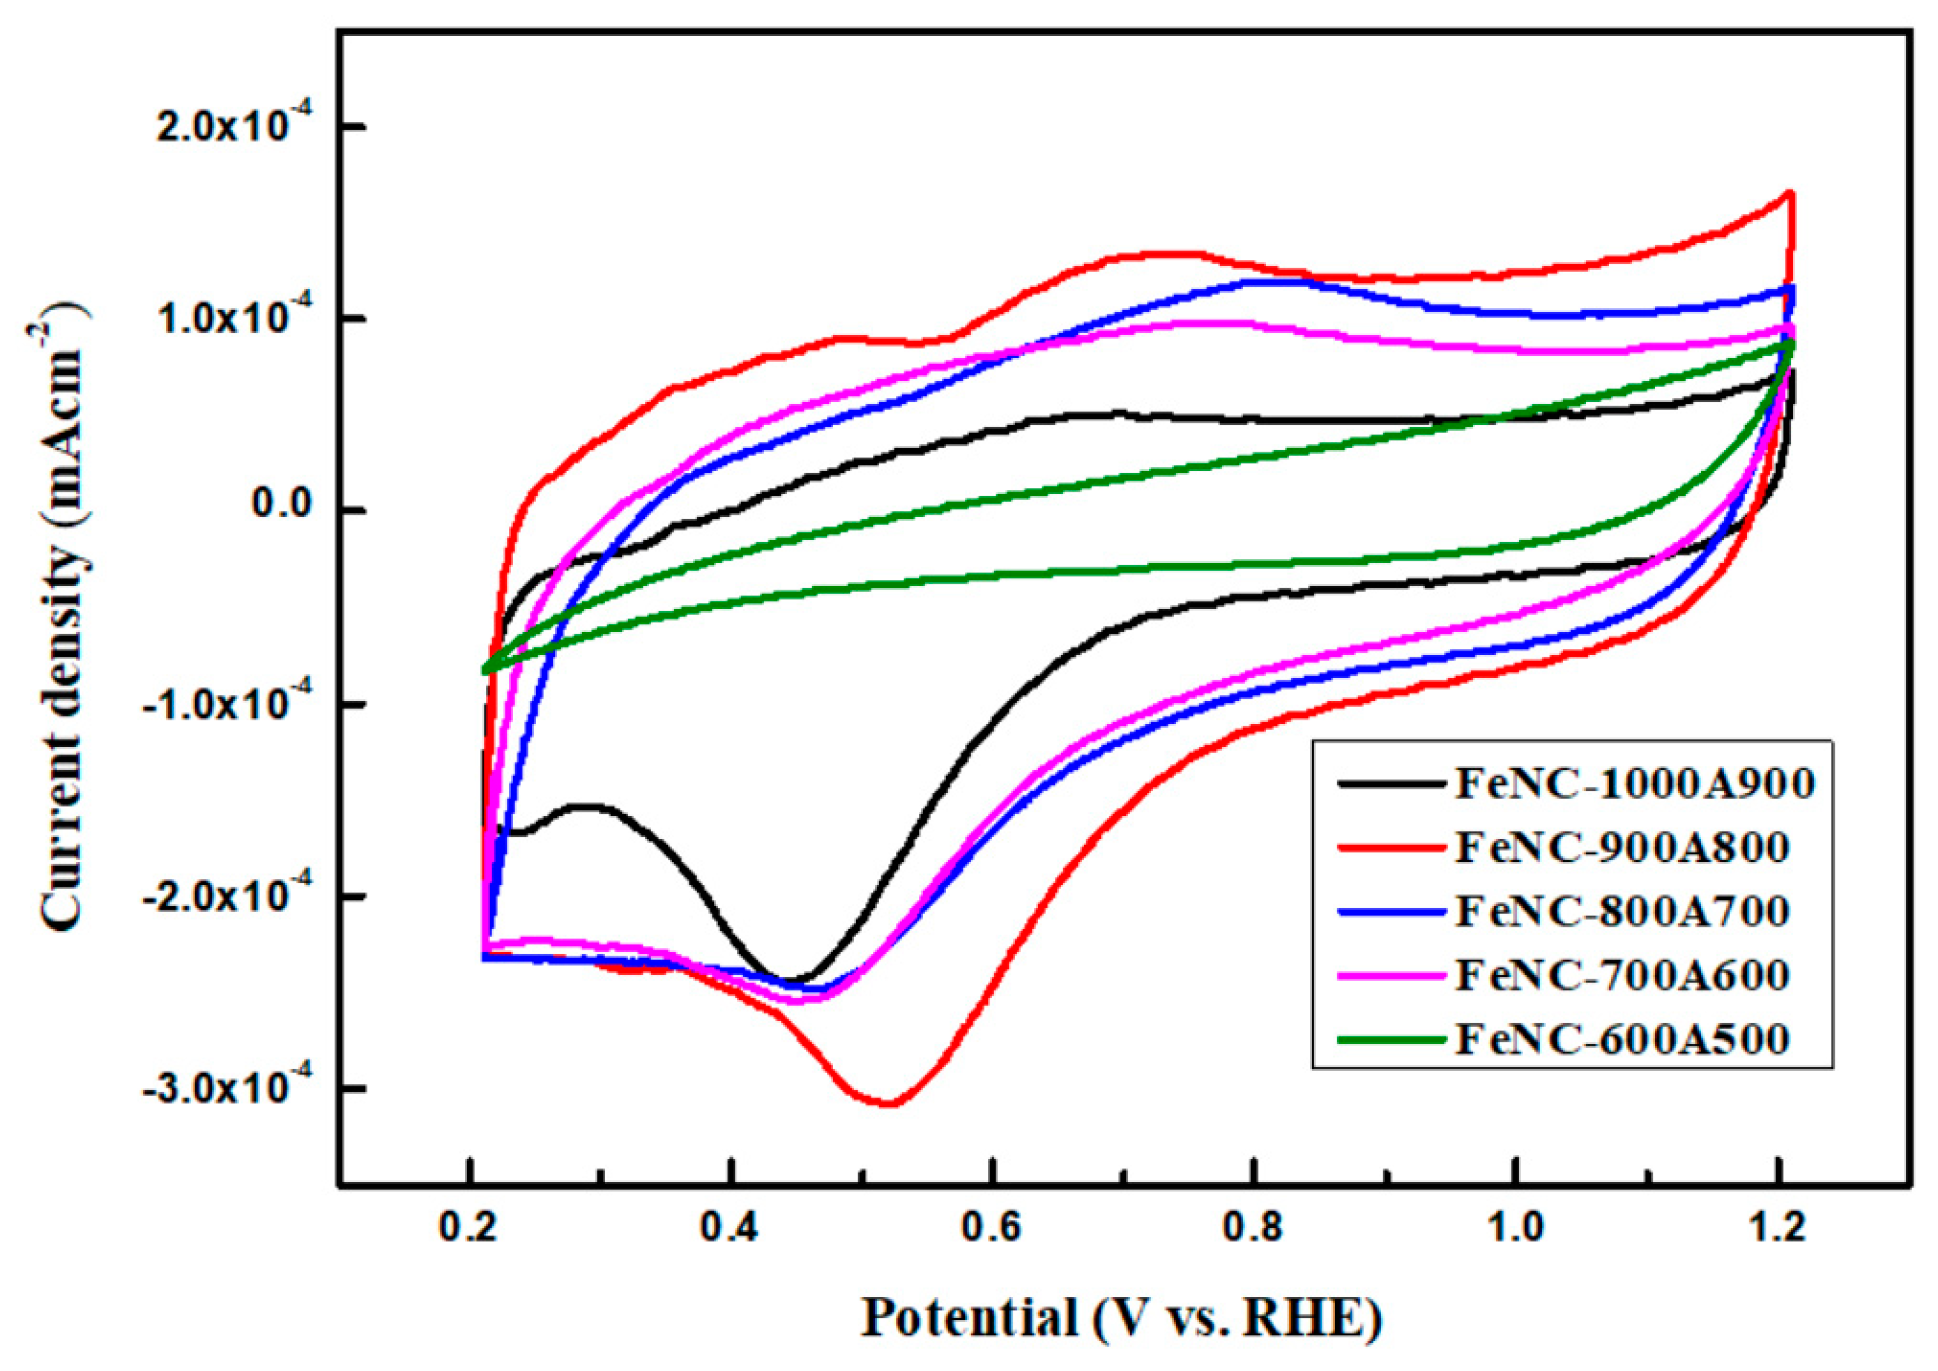
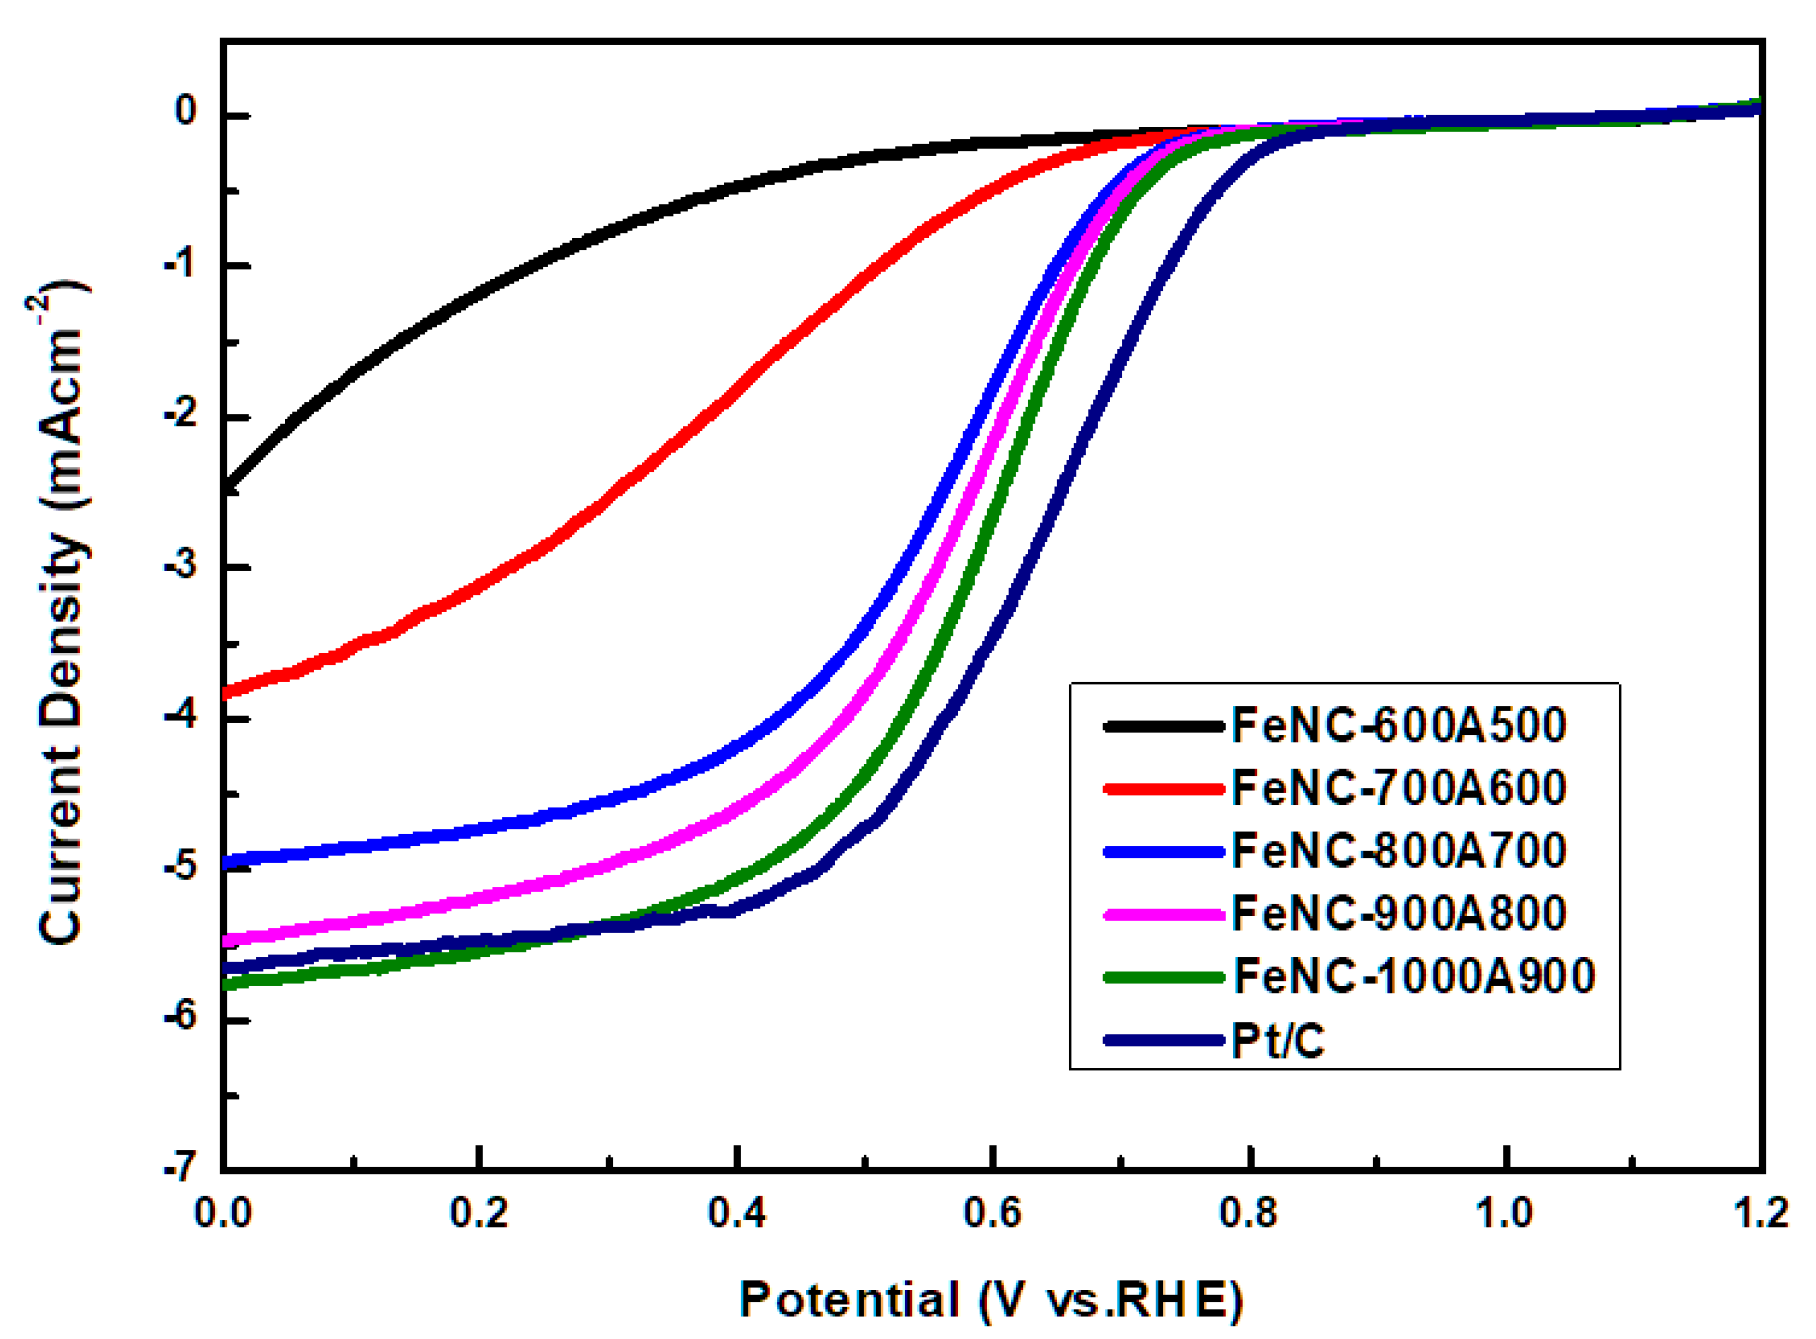
3.8. CV and LSV Curve
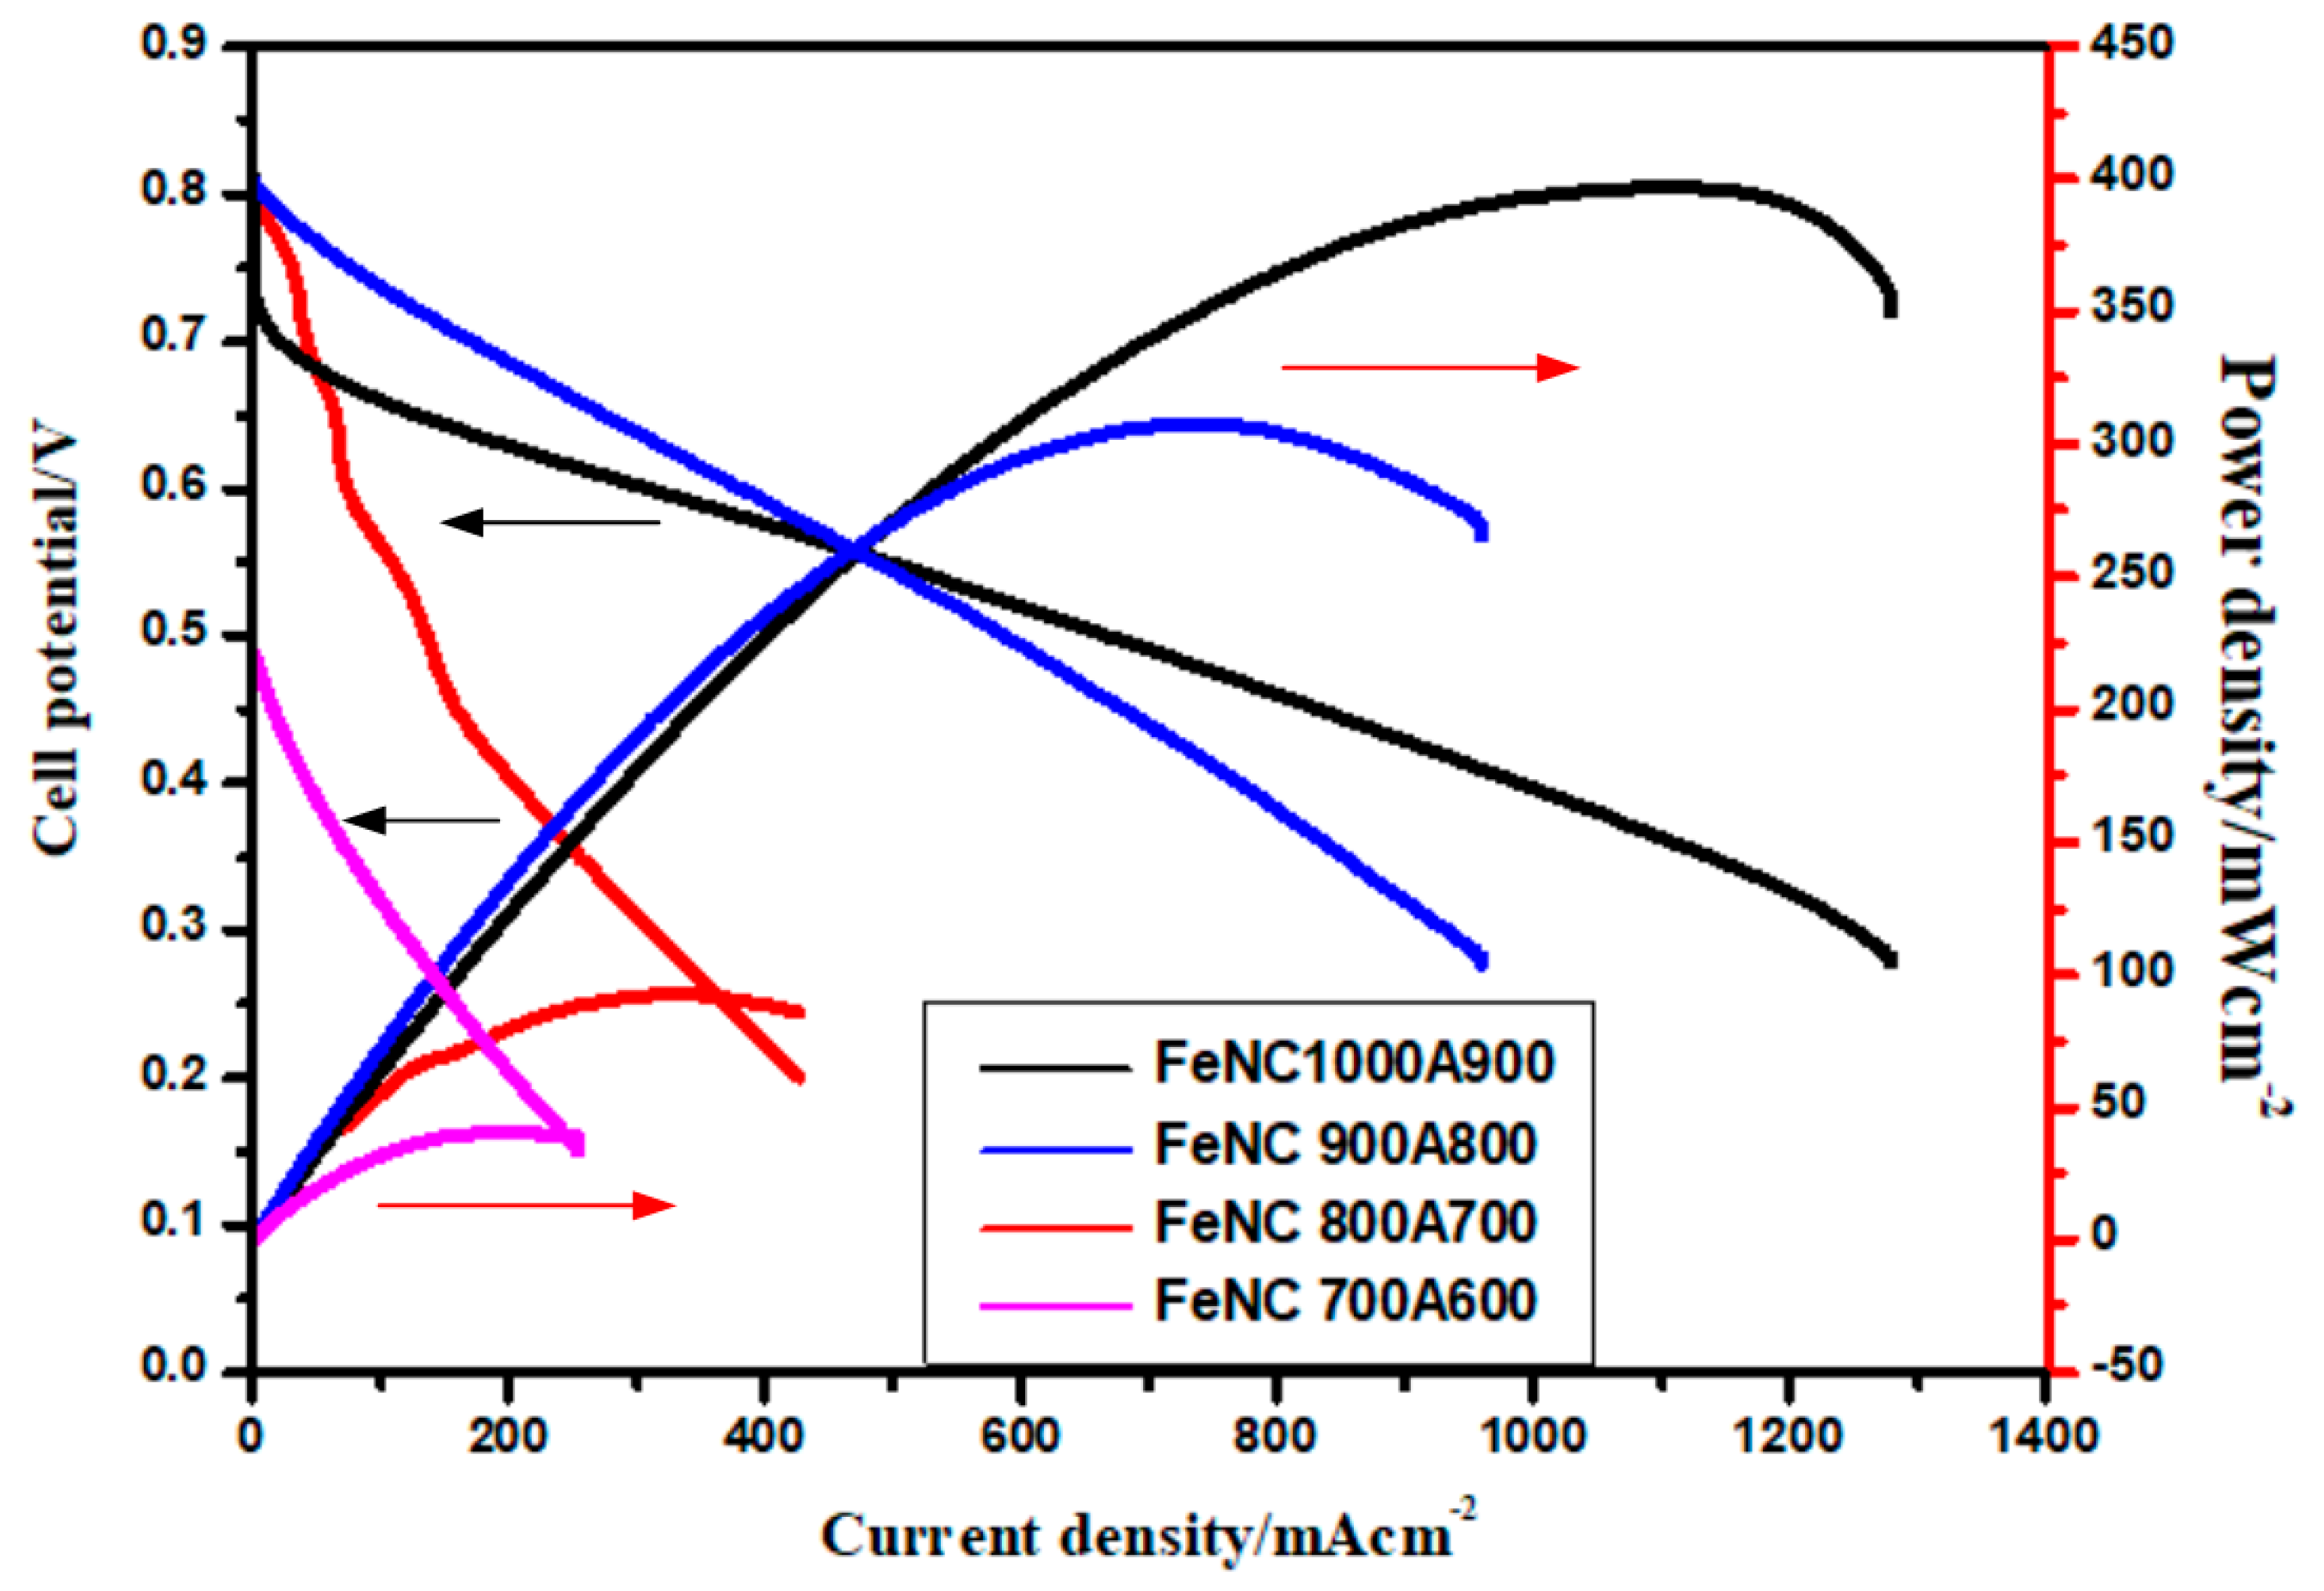
3.9. Single Cell Testing
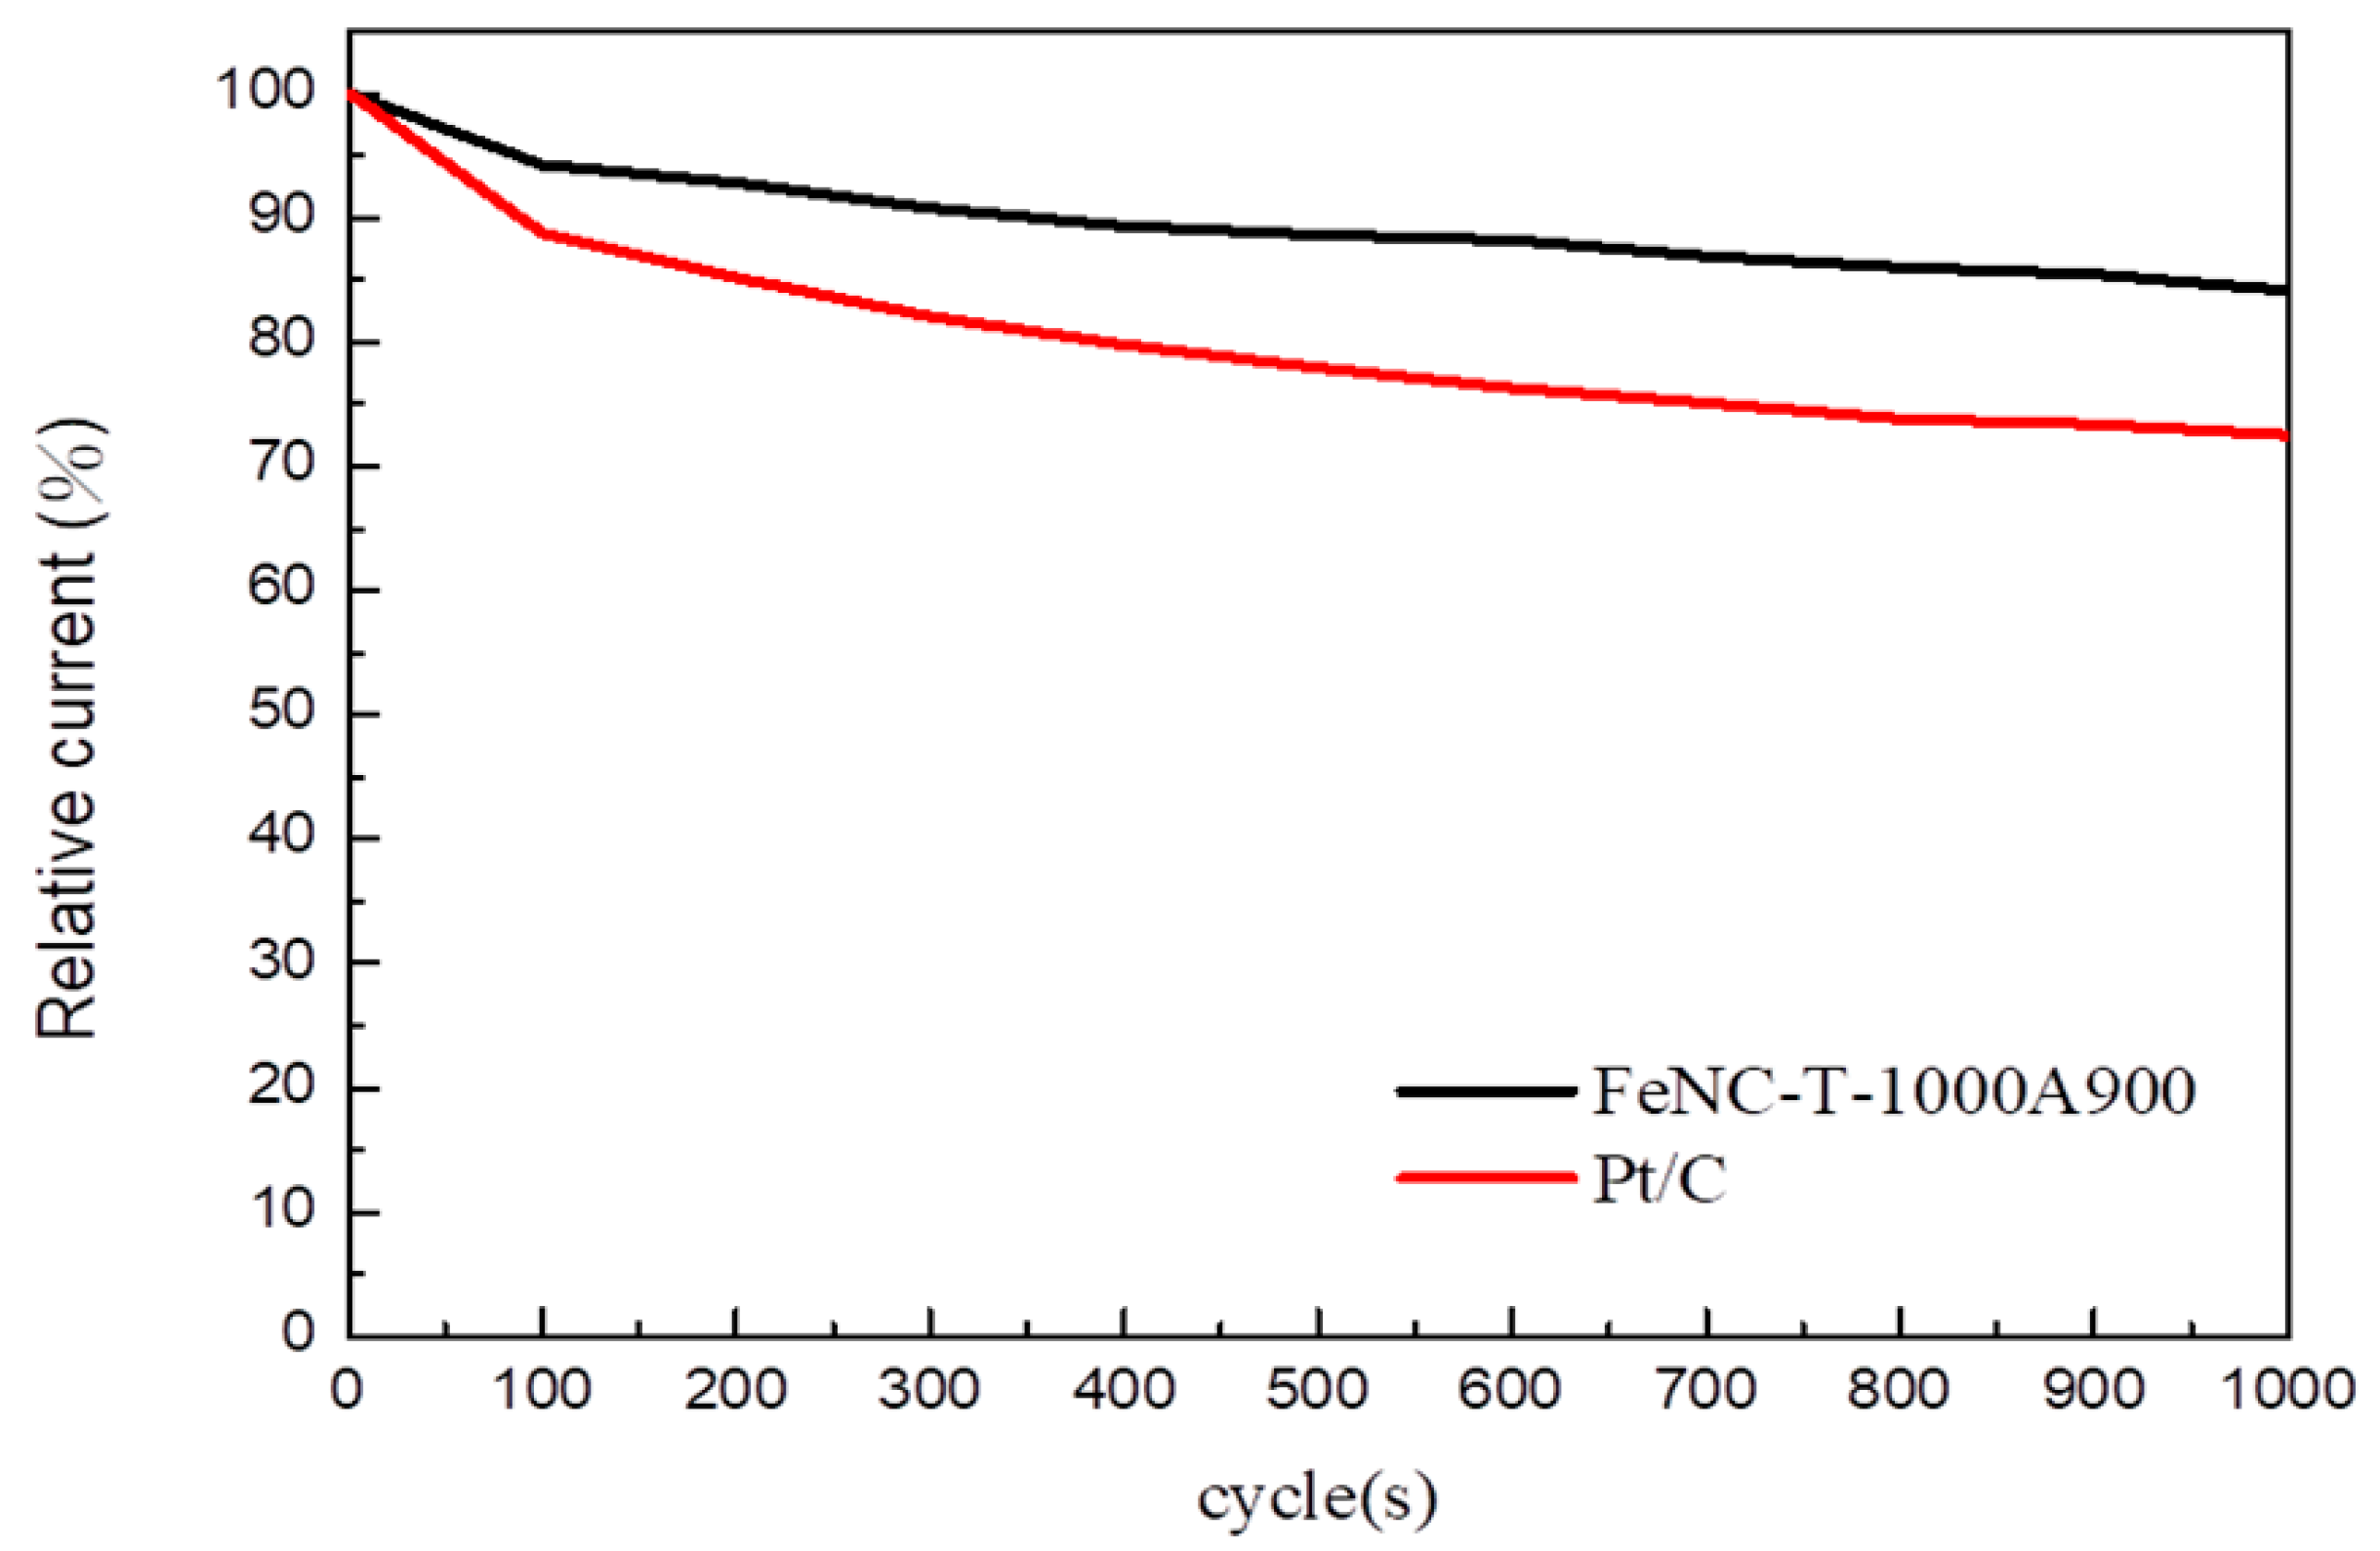
3.10. Durablity Test
4. Conclusions
Supplementary Materials
Author Contributions
Funding
Institutional Review Board Statement
Informed Consent Statement
Data Availability Statement
Acknowledgments
Conflicts of Interest
References
- Jasinski, R. A new fuel cell cathode catalyst. Nature 1964, 201, 1212. [Google Scholar] [CrossRef]
- Bagotzky, V.S.; Tarasevich, M.R.; Radyushkina, K.A.; Levina, O.A.; Andrusyova, S.I. Electrocatalysis of the oxygen reduction process on metal chelates in acid electrolyte. J. Power Sources 1978, 2, 233–240. [Google Scholar] [CrossRef]
- Ratso, S.; Sahraie, N.R.; Sougrati, M.T.; Käärik, M.; Kook, M.; Saar, R.; Paiste, P.; Jia, Q.; Leis, J.; Mukerjee, S.; et al. Synthesis of highly-active Fe–N–C catalysts for PEMFC with carbide-derived carbons. J. Mater. Chem. A 2018, 6, 14663–14674. [Google Scholar] [CrossRef]
- Mamtani, K.; Singh, D.; Tian, J.; Millet, J.M.; Miller, J.T.; Co, A.C.; Ozkan, U.S. Evolution of N-coordinated iron–carbon (FeNC) catalysts and their oxygen reduction (ORR) performance in acidic media at various stages of catalyst. Catal. Lett. 2016, 146, 1749–1770. [Google Scholar] [CrossRef]
- Logeshwaran, N.; Ramakrishnan, S.; Chandrasekaran, S.S.; Vinothkannan, M.; Kim, A.R.; Sengodan, S.; Velusamy, D.B.; Varadhan, P.; He, J.-H.; Yoo, D.J. An efficient and durable trifunctional electrocatalyst for zinc–air batteries driven overall water splitting. Appl. Catal. B. Environ. 2021, 297, 120405. [Google Scholar] [CrossRef]
- Elayappan, V.; Shanmugam, R.; Chinnusamy, S.; Yoo, D.J.; Mayakrishnan, G.; Kim, K.; Noh, H.S.; Kim, M.K.; Lee, H. Three-dimensional bimetal TMO supported carbon based electrocatalyst developed via dry synthesis for hydrogen and oxygen evolution. Appl. Surf. Sci. 2020, 505, 144642. [Google Scholar] [CrossRef]
- Kannan, R.; Kim, A.R.; Yoo, D.J. Enhanced electrooxidation of methanol, ethylene glycol, glycerol, and xylitol over a polypyrrole/manganese oxyhydroxide/palladium nanocomposite electrode. J. Appl Electrochem. 2014, 44, 893–902. [Google Scholar] [CrossRef]
- Vijayakumar, E.; Ramakrishnan, S.; Sathiskumar, C.; Yoo, D.J.; Balamurugan, J.; Noh, H.S.; Kwon, D.; Kim, Y.H.; Lee, H. MOF-derived CoP-nitrogen-doped carbon@ NiFeP nanoflakes as an efficient and durable electrocatalyst with multiple catalytically active sites for OER, HER, ORR and rechargeable zinc-air batteries. Chem. Eng. J. 2022, 428, 131115. [Google Scholar] [CrossRef]
- Jaouen, F.; Proietti, E.; Lefèvre, M.; Chenitz, R.; Dodelet, J.P.; Wu, G.; Chung, H.T.; Johnston, C.M.; Zelenay, P. Recent advances in non-precious metal catalysis for oxygen reduction reaction in polymer electrolyte fuel cells. Energy Environ. Sci. 2011, 4, 114–130. [Google Scholar] [CrossRef]
- Lefevre, M.; Proietti, E.; Jaouen, F.; Dodelet, J.P. Iron-based catalysts with improved oxygen reduction activity in polymer electrolyte fuel cells. Science 2009, 324, 71–74. [Google Scholar] [CrossRef] [PubMed]
- Jaouen, F.; Lefevre, M.; Dodelet, J.-P.; Cai, M. Heat-treated Fe/N/C catalysts for O2 electroreduction: Are active sites hosted in micropores? J. Phys. Chem. B 2006, 110, 5553–5558. [Google Scholar] [CrossRef]
- Jaouen, F.; Herranz, J.; Lefèvre, M.; Dodelet, J.-P.; Kramm, U.I.; Herrmann, I.; Bogdanoff, P.; Maruyama, J.; Nagaoka, T.; Garsuch, A.; et al. Cross-laboratory experimental study of non-noble-metal electrocatalysts for the oxygen reduction reaction. ACS Appl. Mater. Interfaces 2009, 1, 1623–1639. [Google Scholar] [CrossRef]
- Jaouen, F.; Marcotte, S.; Dodelet, J.-P.; Lindbergh, G. Oxygen reduction catalysts for polymer electrolyte fuel cells from the pyrolysis of iron acetate adsorbed on various carbon supports. J. Phys. Chem. B 2003, 107, 1376–1386. [Google Scholar] [CrossRef]
- Ramanavicius, S.; Ramanavicius, A. conducting polymers in the design of biosensors and biofuel cells. Polymers 2021, 13, 49. [Google Scholar] [CrossRef] [PubMed]
- Ramanavicius, S.; Ramanavicius, A. charge transfer and biocompatibility aspects in conducting polymer-based enzymatic biosensors and biofuel cells. Nanomaterials 2021, 11, 371. [Google Scholar] [CrossRef]
- Gavrilov, N.; Dašić-Tomić, M.; Pašti, I.; Ćirić-Marjanović, G.; Mentus, S. Carbonized polyaniline nanotubes/nanosheets-supported Pt nanoparticles: Synthesis, characterization and electrocatalysis. Mater. Lett. 2011, 65, 962–965. [Google Scholar] [CrossRef]
- Higgins, D.C.; Meza, D.; Chen, Z. Nitrogen-doped carbon nanotubes as platinum catalyst supports for oxygen reduction reaction in proton exchange membrane fuel cells. J. Phys. Chem. C 2010, 114, 21982–21988. [Google Scholar] [CrossRef]
- Gong, K.; Du, F.; Xia, Z.; Durstock, M.; Dai, L. Nitrogen-doped carbon nanotube arrays with high electrocatalytic activity for oxygen reduction. Science 2009, 323, 760–764. [Google Scholar] [CrossRef]
- Khomenko, V.G.; Barsukov, V.Z.; Katashinskii, A.S. The catalytic activity of conducting polymers toward oxygen reduction. Electrochim. Acta 2005, 50, 1675–1683. [Google Scholar] [CrossRef]
- Chen, Z.; Higgins, D.; Chen, Z. Electrocatalystic activity of nitrogen doped carbon nanotubes with different morphologies for oxygen reduction reaction. Electrochim. Acta 2010, 55, 4799–4804. [Google Scholar] [CrossRef]
- Chen, Z.; Higgins, D.; Tao, H.; Hsu, R.S.; Chen, Z. Highly active nitrogen-doped carbon nanotubes for oxygen reduction reaction in fuel cell applications. J. Phys. Chem. C 2009, 113, 21008–21013. [Google Scholar] [CrossRef]
- Wang, Y.-Z.; Chang, K.-J.; Hung, L.-F.; Ho, K.-S.; Chen, J.-P.; Hsieh, T.-H.; Chao, L. Carboxylated carbonized polyaniline nanofibers as Pt-catalyst conducting support for proton exchange membrane fuel cell. Synth. Met. 2014, 188, 21–29. [Google Scholar] [CrossRef]
- Wu, R.H.; Tsai, M.J.; Ho, K.S.; Wei, T.E.; Hsieh, T.H.; Han, Y.K.; Kuo, C.W.; Tseng, P.H.; Wang, W.Z. Sulfonated Polyaniline Nanofiber as Pt-Catalyst Conducting Support for Proton Exchange Membrane Fuel Cell. Polymer 2014, 55, 2035–2043. [Google Scholar] [CrossRef]
- Wang, Y.Z.; Tsai, M.J.; Hsieh, T.H.; Tseng, P.H.; Ho, K.S. Studies on the 1D polyanilines prepared with n-dodecylbenzenesulfonic and camphorsulfonic acid. Polym. Int. 2015, 64, 1568–1577. [Google Scholar] [CrossRef]
- Wang, Y.-Z.; Huang, W.-Y.; Hsieh, T.-H.; Jheng, L.-C.; Ho, K.-S.; Huang, S.-W.; Chao, L. FeNxC Based Catalysts Prepared by the Calcination of Iron-Ethylenediamine@Polyaniline as the Cathode-Catalyst of Proton Exchange Membrane Fuel Cell. Polymers 2019, 11, 1368. [Google Scholar] [CrossRef] [PubMed]
- Yeager, E. Dioxygen electrocatalysis: Mechanisms in relation to catalyst structure. J. Mol. Catal. 1986, 38, 5–25. [Google Scholar] [CrossRef]
- Kinoshita, K. Electrochemical Oxygen Technology; Interscience: New York, NY, USA, 1922. [Google Scholar]
- Maldonado, S.; Stevenson, K.J. Influence of nitrogen doping on oxygen reduction electrocatalysis at carbon nanofiber electrodes. J. Phys. Chem. B 2005, 109, 4707–4716. [Google Scholar] [CrossRef]
- Lai, L.; Potts, J.R.; Zhan, D.; Wang, L.; Poh, C.K.; Tang, C.; Gong, H.; Shen, Z.; Lin, J.; Ruo, R.S. Exploration of the active center structure of nitrogen-doped graphene-based catalysts for oxygen reduction reaction. Energy Environ. Sci. 2012, 5, 7936–7942. [Google Scholar] [CrossRef]
- Lin, Z.; Song, M.K.; Ding, Y.; Liu, Y.; Liu, M.; Wong, C.P. Three-dimensional nitrogen-doped carbon nanotubes/graphene structure used as a metal-free electrocatalyst for the oxygen reduction reaction. Chem. Phys. 2012, 14, 3381–3387. [Google Scholar]
- Zhao, Y.; Watanabe, K.; Hashimoto, K. self-supporting oxygen reduction electrocatalysts made from a nitrogen-rich network polymer. J. Am. Chem. Soc. 2012, 134, 9528–19531. [Google Scholar] [CrossRef]
- Kramm, U.I.; Dodelet, J.P. Structure of the catalytic sites in Fe/N/C-catalysts for O2-reduction in PEM fuel cells. Chem. Phys. 2012, 14, 11673–11688. [Google Scholar] [CrossRef]
- Kattel, S.; Wang, G. Reaction pathway for oxygen reduction on FeN4 embedded graphene. J. Phys. Chem. Lett. 2014, 5, 452–456. [Google Scholar] [CrossRef] [PubMed]
- He, Z.; Maurice, J.-L.; Gohier, A.; Lee, C.S.; Pribat, D.; Cojocaru, C.S. Iron Catalysts for the Growth of Carbon Nanofibers: Fe, Fe3C or Both? Chem. Mater. 2011, 23, 5379–5387. [Google Scholar] [CrossRef]
- Liang, J.; Zheng, Y.; Chen, J.; Liu, J.; Hulicova-Jurcakova, D.; Jaroniec, M.; Qiao, S.Z. Facile Oxygen Reduction on a Three-Dimensionally Ordered Macroporous Graphitic C3N4/Carbon Composite Electrocatalyst. Angew. Chem. Int. Ed. 2012, 51, 3892–3896. [Google Scholar] [CrossRef] [PubMed]


| Catalysts | Atomic Concentration (at%) | |||
|---|---|---|---|---|
| C | O | N | Fe | |
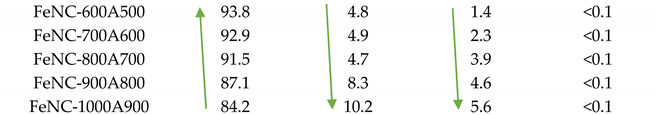 | ||||
| FeNC Catalysts | N 1s (at%) | ||||
|---|---|---|---|---|---|
| Pyridinic N | Fe-N | Pyrrolic N | Graphitic N | Pyridine-N Oxide | |
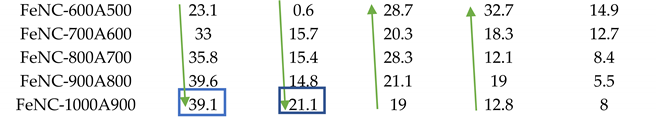 | |||||
| Catalysts | BET Surface Area (m2·g−1) | Ave. Pore Size (nm) |
|---|---|---|
| FeNC-1000A900 | 564.6 | 4.95 |
| FeNC-900A800 | 468.5 | 4.63 |
| FeNC-800A700 | 406.6 | 4.12 |
| FeNC-700A600 | 364.1 | 4.29 |
| FeNC-600A500 | 329.0 | 3.77 |
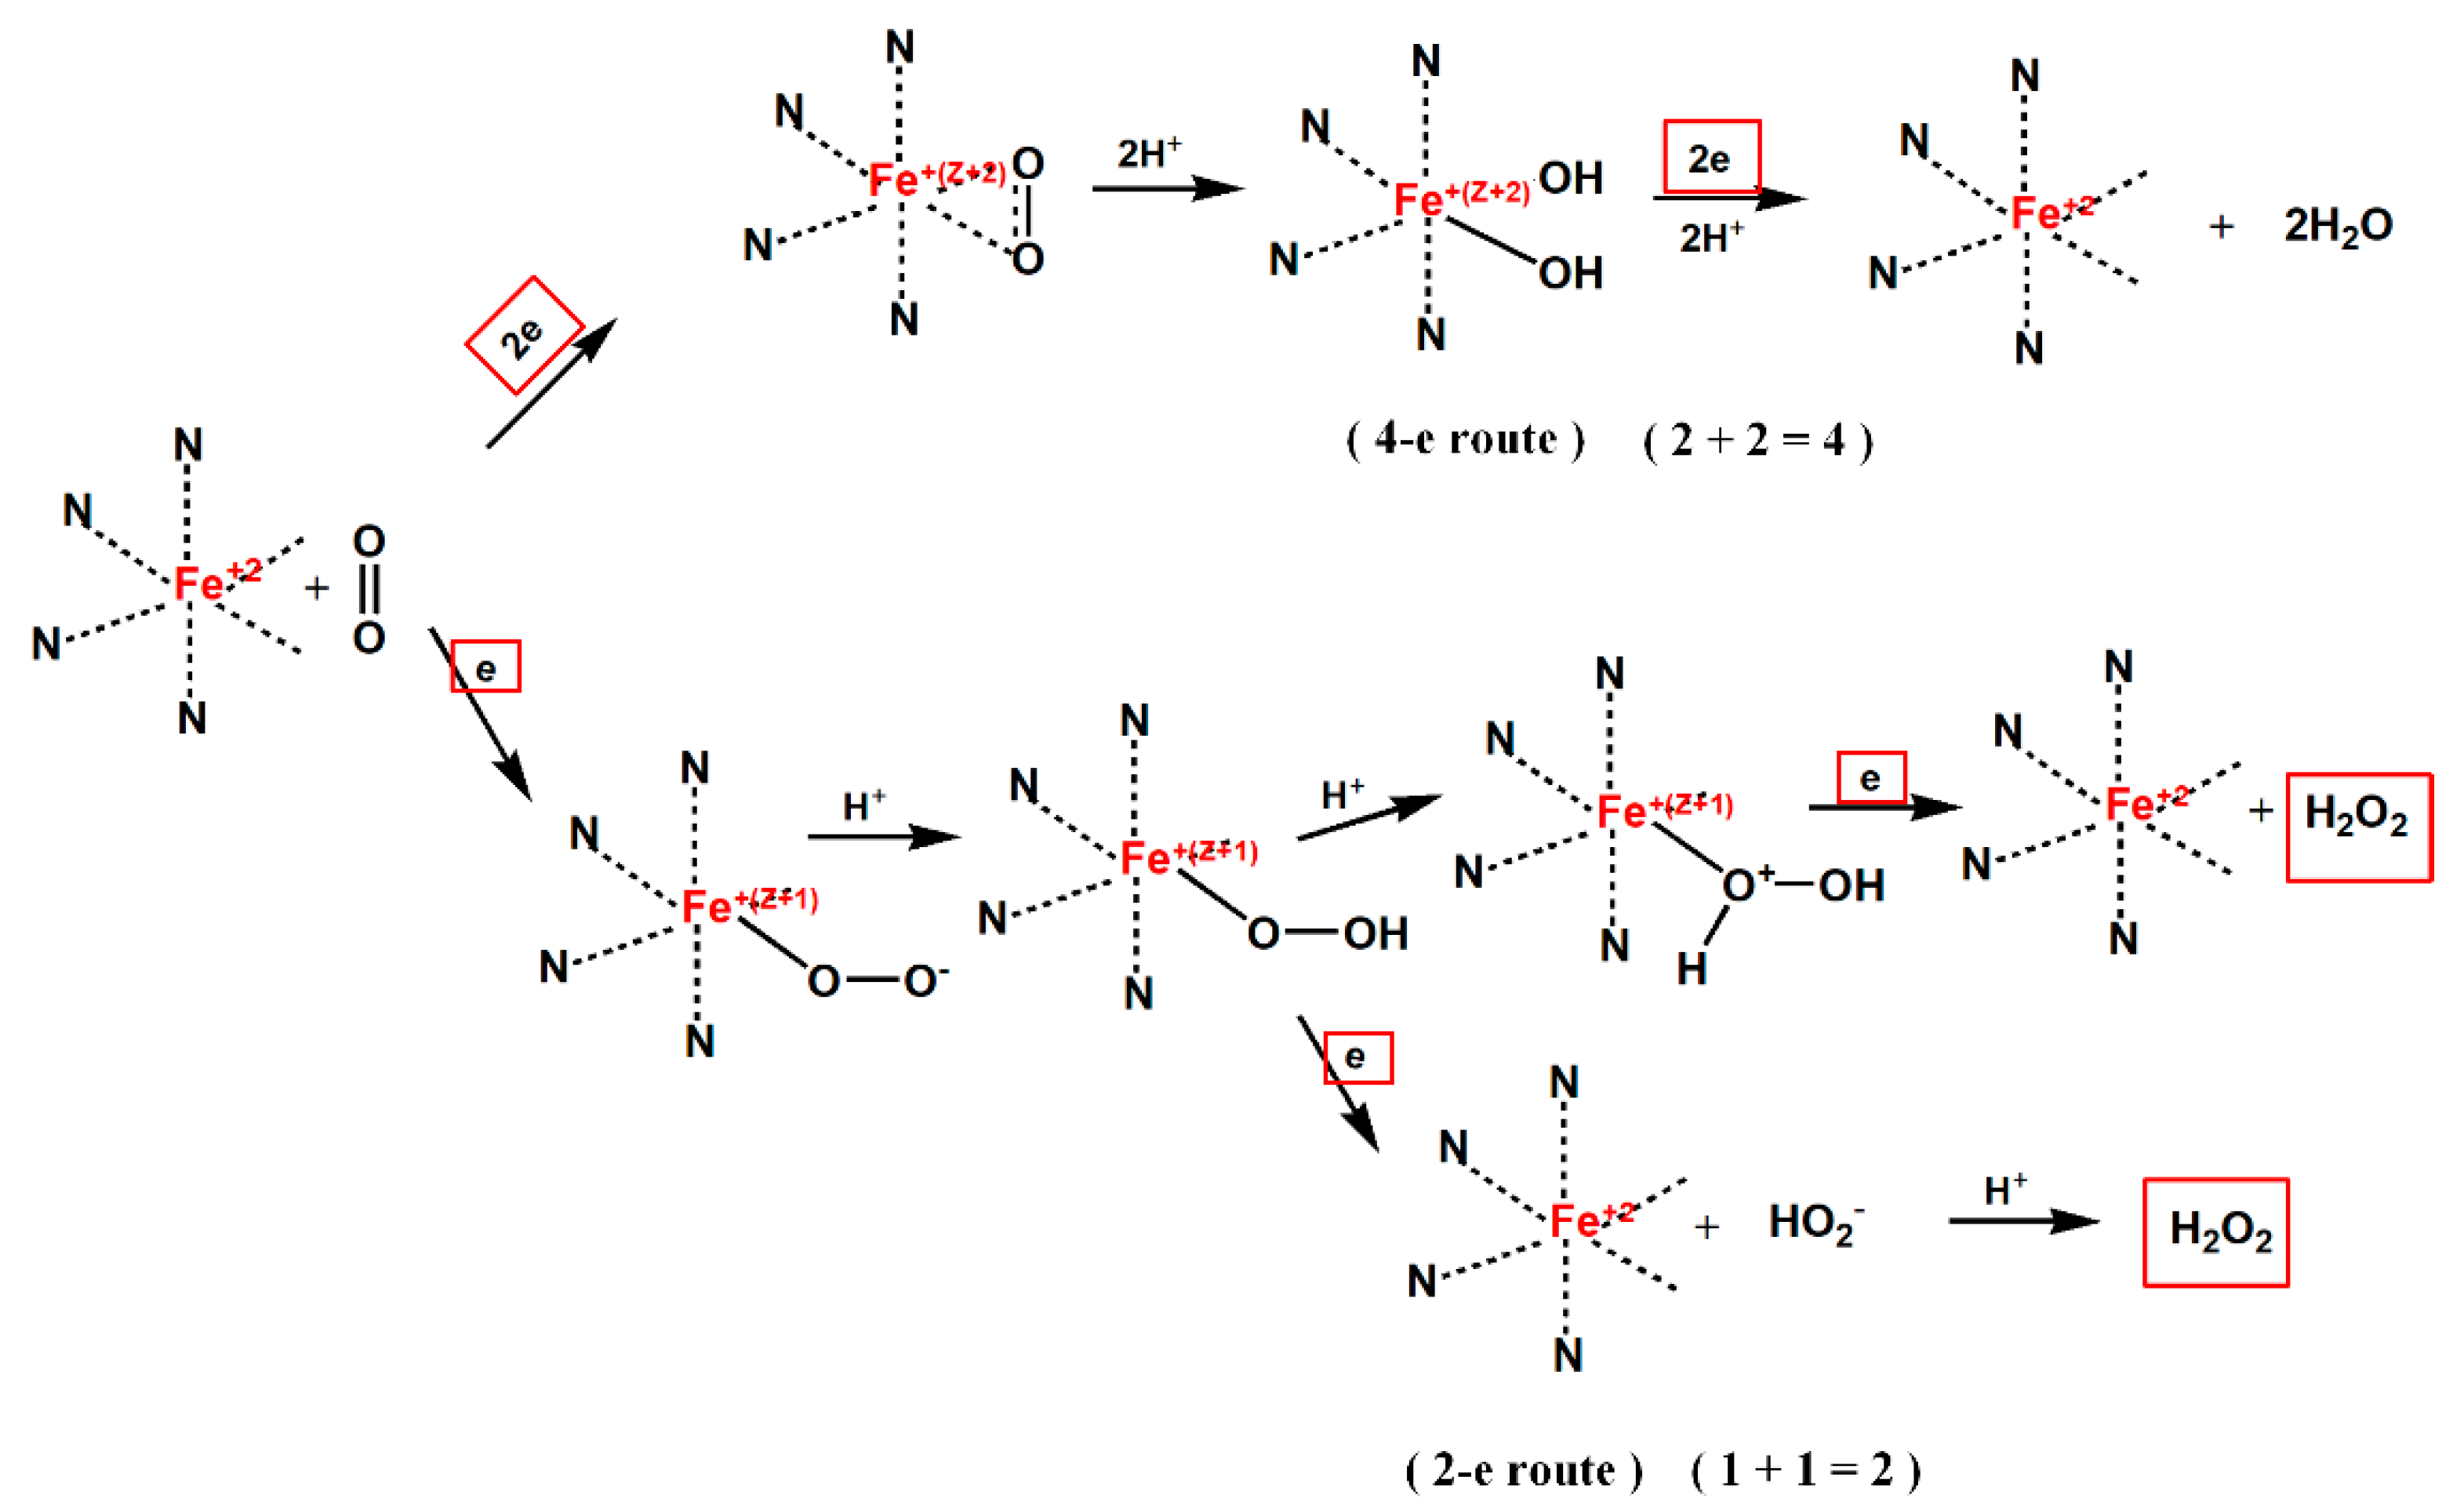
| FeNC | 1000A900 | 900A800 | 800A700 | 700A600 | 600A500 | |
|---|---|---|---|---|---|---|
| Potential | ||||||
| 0.4018 | 3.81 | 3.51 | 3.70 | 3.52 | 3.15 | |
| 0.35053 | 3.82 | 3.93 | 3.72 | 3.58 | 3.24 | |
| 0.30171 | 3.84 | 3.82 | 3.57 | 3.64 | 3.31 | |
| 0.25044 | 3.87 | 3.65 | 3.54 | 3.66 | 3.37 | |
| 0.20161 | 3.90 | 3.61 | 3.56 | 3.66 | 3.42 | |
| Ave. | 3.85 | 3.70 | 3.61 | 3.61 | 3.30 | |
| % of 4-e route | 92.5 | 85.0 | 80.5 | 80.5 | 65.0 | |
Publisher’s Note: MDPI stays neutral with regard to jurisdictional claims in published maps and institutional affiliations. |
© 2021 by the authors. Licensee MDPI, Basel, Switzerland. This article is an open access article distributed under the terms and conditions of the Creative Commons Attribution (CC BY) license (https://creativecommons.org/licenses/by/4.0/).
Share and Cite
Cheng, Y.-W.; Huang, W.-Y.; Ho, K.-S.; Hsieh, T.-H.; Jheng, L.-C.; Kuo, Y.-M. Fe, N-Doped Metal Organic Framework Prepared by the Calcination of Iron Chelated Polyimines as the Cathode-Catalyst of Proton Exchange Membrane Fuel Cells. Polymers 2021, 13, 3850. https://doi.org/10.3390/polym13213850
Cheng Y-W, Huang W-Y, Ho K-S, Hsieh T-H, Jheng L-C, Kuo Y-M. Fe, N-Doped Metal Organic Framework Prepared by the Calcination of Iron Chelated Polyimines as the Cathode-Catalyst of Proton Exchange Membrane Fuel Cells. Polymers. 2021; 13(21):3850. https://doi.org/10.3390/polym13213850
Chicago/Turabian StyleCheng, Yu-Wei, Wen-Yao Huang, Ko-Shan Ho, Tar-Hwa Hsieh, Li-Cheng Jheng, and Yang-Ming Kuo. 2021. "Fe, N-Doped Metal Organic Framework Prepared by the Calcination of Iron Chelated Polyimines as the Cathode-Catalyst of Proton Exchange Membrane Fuel Cells" Polymers 13, no. 21: 3850. https://doi.org/10.3390/polym13213850
APA StyleCheng, Y.-W., Huang, W.-Y., Ho, K.-S., Hsieh, T.-H., Jheng, L.-C., & Kuo, Y.-M. (2021). Fe, N-Doped Metal Organic Framework Prepared by the Calcination of Iron Chelated Polyimines as the Cathode-Catalyst of Proton Exchange Membrane Fuel Cells. Polymers, 13(21), 3850. https://doi.org/10.3390/polym13213850