Article

Manufacturing and Analysis of Overmolded Hybrid Fiber Polyamide 6 Composite

by
Heru S. B. Rochardjo
1,* and
Cahyo Budiyantoro
2
1
Department Mechanical and Industrial Engineering, Universitas Gadjah Mada, Yogyakarta 55281, Indonesia
2
Department of Mechanical Engineering, Universitas Muhammadiyah Yogyakarta, Bantul 55183, Indonesia
*
Author to whom correspondence should be addressed.
Polymers 2021, 13(21), 3820; https://doi.org/10.3390/polym13213820
Submission received: 5 October 2021 / Revised: 27 October 2021 / Accepted: 30 October 2021 / Published: 4 November 2021
(This article belongs to the Section Polymer Processing and Engineering)

Abstract

:
Currently, fiber-reinforced thermoplastic composites are widely applied in structural applications. It has great potential to replace metal structures and provides advantages in weight reduction. In this study, the pretensioned unidirectional carbon fiber was overmolded by Polyamide 6 contained 30%wt of glass fibers (PA 6-30GF). Process parameters such as injection pressure, melting temperature, duration of carbon fiber cryogenic treatment, and fiber pretension were optimized to maximize the flexural strength, impact strength, and interlaminar properties of the hybrid composite. The relationship between factors and responses was analyzed using Box–Behnken design (BBD) from response surface methodology (RSM) and analysis of variance (ANOVA). Three levels were assigned for each factor. There were 27 experimental trials carried out, and a significant regression for the coefficient between the factors was derived. The BBD and ANOVA analysis demonstrate that the predicted values from the model are in satisfactory correlation with the experimental results. The optimum responses found were achieved by setting the following injection molding parameters: melting temperature of 278 °C and injection pressure of 122 bar. Carbon fiber, as a unidirectional reinforcement, should be immersed in liquid nitrogen for 10 min and mounted on the mold in a pretensioned state with a force of 100 N. The combination of these parameters can produce an optimum flexural strength of 248.6 Mpa, impact strength of 173.4 kJ/m2 and an ILSS of 30.4 Mpa.

1. Introduction

Composites for structural applications can be made by combining short and continuous fibers and/or combining different types of fibers. Both glass and carbon fibers are common synthetic fibers used as reinforcements, embedded in a thermoplastic matrix. The glass fibers are relatively cheap, easily obtained, have high a strength-to-weight ratio, but low stiffness. Comparing to glass fiber, carbon fiber is more expensive and has lower compressive strength, but the strength-to-weight ratio and stiffness are higher. Carbon fibers also have lower density and better thermal and electrical conductivity than glass fibers. Due to the ease and speed of their production process, short fibers are preferred as reinforcement over continuous fibers [1]. Short fibers perform well in resisting impact loads but are less efficient at supporting flexural and tensile loads. Tensile and flexural loads are the domains of continuous fiber reinforcement. For structural composites with a combination of loading conditions, hybridization of discontinuous fibers and continuous fibers reinforcement is required [2,3]. Moreover, hybridization of those two types of fibers was aimed to reduce the weaknesses of both and to get the advantages of each of them.
In automotive applications, the combination of flexural and impact loads often occurs in several components, for example in bumpers. The use of composite materials for these components needs to consider the ease and speed of the process as well as low production costs. The injection overmolding is one of the production methods that can be developed to produce hybrid fiber-reinforced thermoplastic composites. With this method, one can combine various types of fibers in one composite product. The quality of the injection product is influenced by the setting of process parameters. Process parameters can affect the physical performance of the composite in the form of geometry and dimensions, fiber length after filling, fiber orientation, and the fiber volume fraction in the resulting composite [4]. The parameters can be optimized to improve mechanical properties [5]. The process parameters that can be controlled include injection pressure, cylinder heating temperature, packing pressure and packing time, cooling temperature and time, injection speed, and back pressure [6]. Setting A high injection pressure and high melting temperature can facilitate the flow of plastic melt-carrying fibers into the mold cavity. The appropriate injection pressure ensures the physical quality of the product with precise dimensions and geometries that are free of sink marks and voids. However, a too-high injection pressure can result in fiber damage. The melting temperature is normally adjusted according to the type of matrix material and follows the recommendations of the material manufacturer. High melting temperatures decrease the viscosity of the plastic melt so that they penetrate the fiber more easily; however, too-high melt temperatures can degrade the matrix. Optimizing processing parameters is an essential issue in obtaining high flexural and impact properties for short fiber-continuous fiber hybrid composite products. In general, the hybrid injection-overmolding process involves using thermoforming sheets as the core of the product [7]. Some plastic-material manufacturing industries, such as BASF and Lanxess, and injection-machine manufacturing industries, such as Engel and KraussMaffei, have developed technological solutions for injection molding-based hybrid composites. However, using unidirectional fiber directly as the core of the specimen still has the potential to be developed [8].
The adhesion between fiber and matrix is also a factor that determines the quality of structural composites. Cryogenic fiber treatment is a practical, effective, and environmentally friendly method to enhance the bonding strength between carbon fiber and polymer matrix. Shao et al. [9] immersed the carbon fiber in liquid nitrogen at −196 °C, this treatment increased the adhesive strength of the carbon fiber/epoxy composite by up to 31%. Cryogenic treatment basically cannot change the chemical composition of the fiber; only morphological changes occur in the form of an increase in surface roughness. Song et al. [10] stated that increasing the surface roughness can improve the surface energy of the fiber.
Structural strength analysis of composites containing continuous fibers often uses the assumption that the fibers are in a straight state, while in fact, the condition of wavy fibers can occur. The assumption of the straight condition can cause over-prediction in determining the compressive properties of unidirectional fibrous composites. Fiber tension control is applied to the filament winding and pultrusion processes. In the process of manufacturing composite structural composites using the injection molding method, fiber pretension has not been carried out. The stress that occurs during mechanical property testing is affected by fiber tension during the process. In general, an increase in tension will increase the strength of the component if the fiber dominates the load bearing [11,12].
This study uses the injection-overmolding technique in the manufacture of hybrid fiber reinforced polyamide-6 composites. The composite is composed of pretensioned uni-directional carbon fiber and overmolded by polyamide 6 containing 30% glass fibers. The injection process parameters were varied to show the sensitivity of PA 6 GF on melting temperature and injection pressure. Cryogenic treatment was applied to unidirectional carbon fiber before overmolding. The parameter factors were divided into three levels: low, medium, and high. The target of this research is to determine the effect of process parameters on the flexural strength and the impact strength of composite and the inter-laminar shear strength (ILSS) between fiber and matrix in the composite system. The data analysis used the Response Surface Method-Box Behnken Design and ANOVA.

2. Experimental

2.1. Materials

The carbon fibers T700SC 12K, made by Toray, Tokyo, Japan, were used as unidirectional reinforcement [13]. The Amilan PA 6-30GF produced by Toray Resins Europe GmbH, Germany, was used as unidirectional reinforcement. The material is a polyamide (PA) 6 that contains 30% glass fiber, a type of engineering plastic with high ductility and impact resistance [14]. The properties of the materials involved in this study are shown in Table 1. PA 6 easily absorbs moisture, therefore drying needs to be done by using a hot-air dryer. Drying is recommended at 80–120 °C for 6 h until the humidity content is around 0.15 to 0.2%.

2.2. Manufacturing of Hybrid Overmolded Composites

The manufacturing stages of the hybrid fiber overmolded composite are shown in Figure 1. As a unidirectional reinforcement, the carbon fiber was cut along the mold length, mounted on a mold equipped with a pre-tension device. One end of the fiber was clamped on the chuck, while the other end was pulled with varying tension: 20%, 30%, and 40% of the ultimate strength of fiber, respectively. The pretension is obtained by static loading, since the cross-section area of the carbon fiber bundle is 7 mm × 7 μm = 0.049 mm2, and the load applied to the fiber was 50 N, 75 N, and 100 N respectively. The deadweight method was applied to the fiber pretension, that is, simply applying a constant weight to the unidirectional fibers before plastic melt injection [15]. The load was released after the plastic reaches the solidification state. Before being attached to the mold, the carbon fiber was immersed in liquid nitrogen for three time periods of 10, 15, and 20 min. This treatment aimed to increase the surface roughness of fibers so that the mechanical interlocking between the matrix and fibers can be increased. Immersing carbon fiber in liquid nitrogen for 10 min has been proven to produce better fiber-matrix adhesion of CFRP than silane coupling agents [16]. A FANUC ROBOSHOT -S-2000i100A injection machine with a clamping capacity of 100 tons was used to produce overmolding specimen A. PA 6-GF pellet was fed through the hopper of the injection molding machine, plasticized, and transported to the nozzle. The melted matrix containing short glass fibers was overmolded onto pretensioned unidirectional fibers. Two injection parameters were varied: injection pressure and melting temperature. The hydraulic injection pressure was varied by 100 bar, 120 bar, and 140 bar. The melting temperature was adjusted as follows: 260 °C, 270 °C, and 280 °C [17], following material manufacturer recommendation. Other injection process parameters were set constantly, according to the initial trial results and recommendations from the matrix material supplier, as shown in Table 2.

2.3. Design of Experiment

Response surface methodology (RSM) is an effective method for linking factors to the expected response. This is a statistically based method that has many advantages, including the capability for evaluating interactions between variables, less experimental trial, easy-to-understand graphical data display, investigated all factor-level combinations, and it can develop mathematical models that connecting factors and responses [18,19]. The mathematical model can be expressed as a regression model as described in Equation (1):
Y = β 0 + i = 1 k β i X i + i = 1 k β i i X i 2 + i = 1 k 1 0 i > j , j = 2 k β i j X i X j + ϵ
where Y is the predicted response related to the model, and β 0 corresponds to constant, β i , β i i , and β i j are the linear, quadratic, and interaction coefficients, X is process factor, and k is the number of the factors [20,21].
In this study, the Box–Behnken design (BBD), a type of RSM design, was used to determine the effect of process factors on the target responses. There were 4 factors with each divided into three levels (low, middle, and high) used in this study, as shown in Table 3. Melting temperature and injection pressure are controllable injection parameters that govern the flow behavior of the matrix containing short fiber. Fiber pretensions influence the role of unidirectional fiber, while nitrogen immersion affects the fiber-matrix adhesion. These factors and levels are arranged in the experimental design as shown in Table 4. The experimental design was carried out with 27 trials and in each trial, 5 repetitions were carried out. The trials consisted of 24 cube points and 3 central points at run 1, 4, and 20. Flexural strength, impact strength, and ILSS were the target responses of this experiment.

2.4. Characterization

The specimens were subjected to three types of mechanical properties characterization: a flexural test, an impact test, and interlaminar shear strength (ILSS).
A three-point- bending test was performed, according to ISO 178, on the samples’ flexural properties using a Zwick/Roell Z20 Proline universal test machine. The test was performed at a displacement rate of 2 mm/min [22]. The testing specimen had a thickness of 5.5 mm, a width of 10 mm, and a length of 110 mm (20 times of thickness). According to the standard, the span length was 88 mm, 16 times the thickness of the specimen [22].
The interlaminar shear strength (ILSS) of the composite was evaluated by short beam shear tests following ASTM D-2344 [23]. Dumbbell specimens were cut into a rectangular specimen of dimension 40 mm × 10 mm × 5.5 mm. At room temperature, the tests were carried out on a GOTECH universal testing machine with a crosshead speed of 2 mm/min. A three-point bending device equipped with 3-mm-diameter supports and a 6-mm-diameter indenter nose was adjusted to a span of 20 mm. The interlaminar shear strength (ILSS) can be calculated according to Equation (2).
I L S S = 0.75 F m w · t
where:
ILSS = interlaminar shear strength, Mpa
Fm = maximum load recorded during the test, N
w = specimen width, mm
t = specimen thickness, mm
At least five specimens per set of parameter combinations were tested.
The impact tests were carried out on the GOTECH testing machine using the Charpy unnotched flatwise method following ISO 179 [24]. The width and thickness of the test specimen were 10 mm and 5.5 mm, respectively. Impact strength was calculated based on the initial angle of the pendulum hammer and the final angle after impact, as show in in Equations (3) and (4) [24].
E c = W × R ( cos β cos α )
a c = E c h · b × 10 3
where:
  • W = pendulum weight.
  • R = pendulum arm length, m.
  • A = initial angle of the pendulum hammer.
  • Β = final angle after impact.
  • Ec = corrected energy, absorbed by breaking test specimen, J.
  • ac = Charpy impact strength, kJ/m2
  • h = specimen thickness, mm.
  • b = specimen width, mm.
All these three tests were performed at a temperature of 23 °C and relative humidity (RH) of approximately 50%. For each trial, at least five identical samples were tested, and average values and standard deviations were recorded.

3. Results and Discussion

3.1. Testing Results

Table 5 shows the test results on the overmolding specimens, the values of flexural strength, impact strength, and ILSS in the table are the average values of five measurements from each run. The manufacturing of overmolded hybrid fiber composite produced a multipurpose specimen, as shown in Figure 2.
The results of 27 trials showed that the highest flexural strength of 252.8 Mpa was obtained from run 5 with a combination of parameters: melting temperature of 280 °C, the injection pressure of 120 bar, fiber pretension of 75 N, and fiber immersion for 10 min. Run 21, with a combination of parameters—melting temperature of 270 °C, the pressure of 140 bar, fiber pretension of 50 N, and fiber immersion for 15 min—resulted in the highest impact strength value of 173.4 kJ/m2. The highest ILSS results were obtained in run 1 with a combination of parameters: melting temperature 270 °C, an injection pressure of 120 bar, fiber pretension of 75 N, and fiber immersion for 15 min. The interesting thing is that even the lowest flexural strength and impact values from the experiment were higher than the PA 6 30 GF values. The lowest flexural strength result was given by the 18th run, of 207.2 Mpa, an increase of about 42% compared to the raw matrix. The lowest impact strength result occurred in the third run, of 137.3 kJ/m2, 37% higher than the raw matrix. Meanwhile, the lowest ILSS was seen on the 24th run, of 16.4 MPa. The lowest flexural strength result was given by the 18th run of 207.2 Mpa, an increase of about 42% compared to the raw matrix. The lowest impact strength results occurred in the third run of 137.3 kJ/m2, 37% higher than the raw matrix. Meanwhile, the lowest ILSS was seen on the 24th run of 16.4 MPa. According to Maier et al. [25], the ILSS of PA6-CF is in the range of 21 to 28 Mpa at room temperature. This shows the contribution of carbon fiber as a unidirectional reinforcement. However, because the design of experiment did not represent all combinations of factors and levels, further analysis was needed to find opportunities for higher response values and to analyze the significance of each factor on the response.

3.2. Analysis of Variance (ANOVA) and Model Fitting of the Responses

The experimental results were analyzed using F-test-based ANOVA. The ANOVA can be used to evaluate the relationship between responses and process factors. The significance of factors on the three target responses can be observed.

3.2.1. Flexural Strength

Table 6 shows the results of ANOVA for flexural strength, in this case, the mathematical model follows a linear order. From the functional analysis of the relationship between factors and flexural strength, it is known that the function fits a first-order polynomial regression model, with a p-value of 0.0323; this reflects the overall fit of the model. If this case uses a second-order polynomial, a p-value of 0.157 is obtained, which is greater than the specified significant level (α = 0.05).
The Model F-value of 3.21 demonstrates that the model was significant. There is only a 3.23% chance that an F-value of this amount could occur due to noise. Values of “Prob > F” less than 0.0500 indicate that model’s terms are significant. In this situation, A model (melt temperature) is a significant model term. The “Lack of Fit F-value” of 0.75 indicates that the Lack of Fit is not significant in comparison to the pure error. A non-significant lack of fit is preferable since it shows that the model fits the response. “Adeq Precision” calculates the signal-to-noise ratio; a ratio greater than four is preferable. The ratio of 5.79 indicates an adequate signal, and the model can be used to navigate the design space. The relationship between the model-forming factors and the flexural strength response, in terms of actual factors, can be expressed as written in the Equation (5):
Flexural strength = +44.019 + 0.636 × A + 0.2 × B + 0.097 × C − 0.69 × D
where A is the melt temperature, B is the injection pressure, C is the fiber pretension, and D is the duration of carbon fiber immersion in liquid nitrogen. This equation can be interpreted as all factors except nitrogen immersion time having a positive effect on flexural strength. Here, melting temperature has the most significant effect on flexural strength because it can reduce the viscosity of the matrix so that the glass fiber can be evenly distributed. The negative effect of immersion time means that a longer immersion time of unidirectional carbon fiber in liquid nitrogen results in lower flexural strength.

3.2.2. Impact Strength

Table 7 describes the ANOVA for impact strength, second-order polynomial can be used as a mathematical model for this response. For the impact strength response, the second-order polynomial gives a p-value of 0.043 (significant model), while the first-order polynomial gives a p-value of 0.694 (not significant model).
The Model F-value of 3.82 proves the model was significant. There is only a 1.27% chance that an F-value of this amount could occur due to noise. Interaction of melt temperature (A) and fiber pretension (C), and fiber pretension, in quadratic order, significantly influenced the impact strength. “Adeq Precision” is 7.55, which indicates an adequate signal, so this model can be used to navigate the design space. Equation (6) is the mathematical model derived from the ANOVA, in terms of actual factors:
Impact strength = −2035.69 + 20.85 A − 2.74 B − 15.44 C + 13.32 D + (3.33 × 10⁻³) AB
+ 0.052 AC − 0.036 AD + (2.6 × 10⁻³) BC − 0.027 BD − 0.039 CD − 0.045 A2
+ 9.24 B2 + 9.89 C2 + 0.088 D2
where linear factors melt temperature and fiber immersion had a positive effect, while the injection pressure and fiber pretension had a negative effect, on the impact strength. High-temperature application on pretensioned fiber helps the unidirectional fiber maintain its condition and experience better relaxation.

3.2.3. Interlaminar Shear Strength (ILSS)

Table 8 shows the ANOVA results for ILSS. The Model F-value of 3.61 indicates the model is significant. There is only a 1.59% chance that an F-value this large could occur due to noise. In this case, A, B, AD, A2, B2, and C2 are significant model terms. A value greater than 0.1000 indicates that the model terms are insignificant. It can be seen that all factors contribute to ILSS. The higher injection temperature and pressure make it easier for the melted matrix to carry the short glass fibers into the mold and penetrate the pretensioned carbon fibers. The interaction of a low matrix viscosity with an appropriate immersion time can facilitate such penetration.
Here “Adeq Precision” of 6.867 is adequate, so the model can be applied to navigate the design space. The mathematical model in terms of actual factors is shown in Equation (7).
ILSS = 4245.35 + 29.67   A + 0.057   B + 1.75   C + 24.43   D + ( 7.4 × 10 3 ) AB 1.61   AC 0.0798   AD     ( 2.675 × 10 3 ) BC     ( 6.75 × 10 3 ) BD 0.0186   CD 0.0538   A 2     ( 7.735 × 10 3 ) B 2     ( 4.712 × 10 3 )   C 2 0.026   D 2

3.3. Diagnostic Plots of the Responses

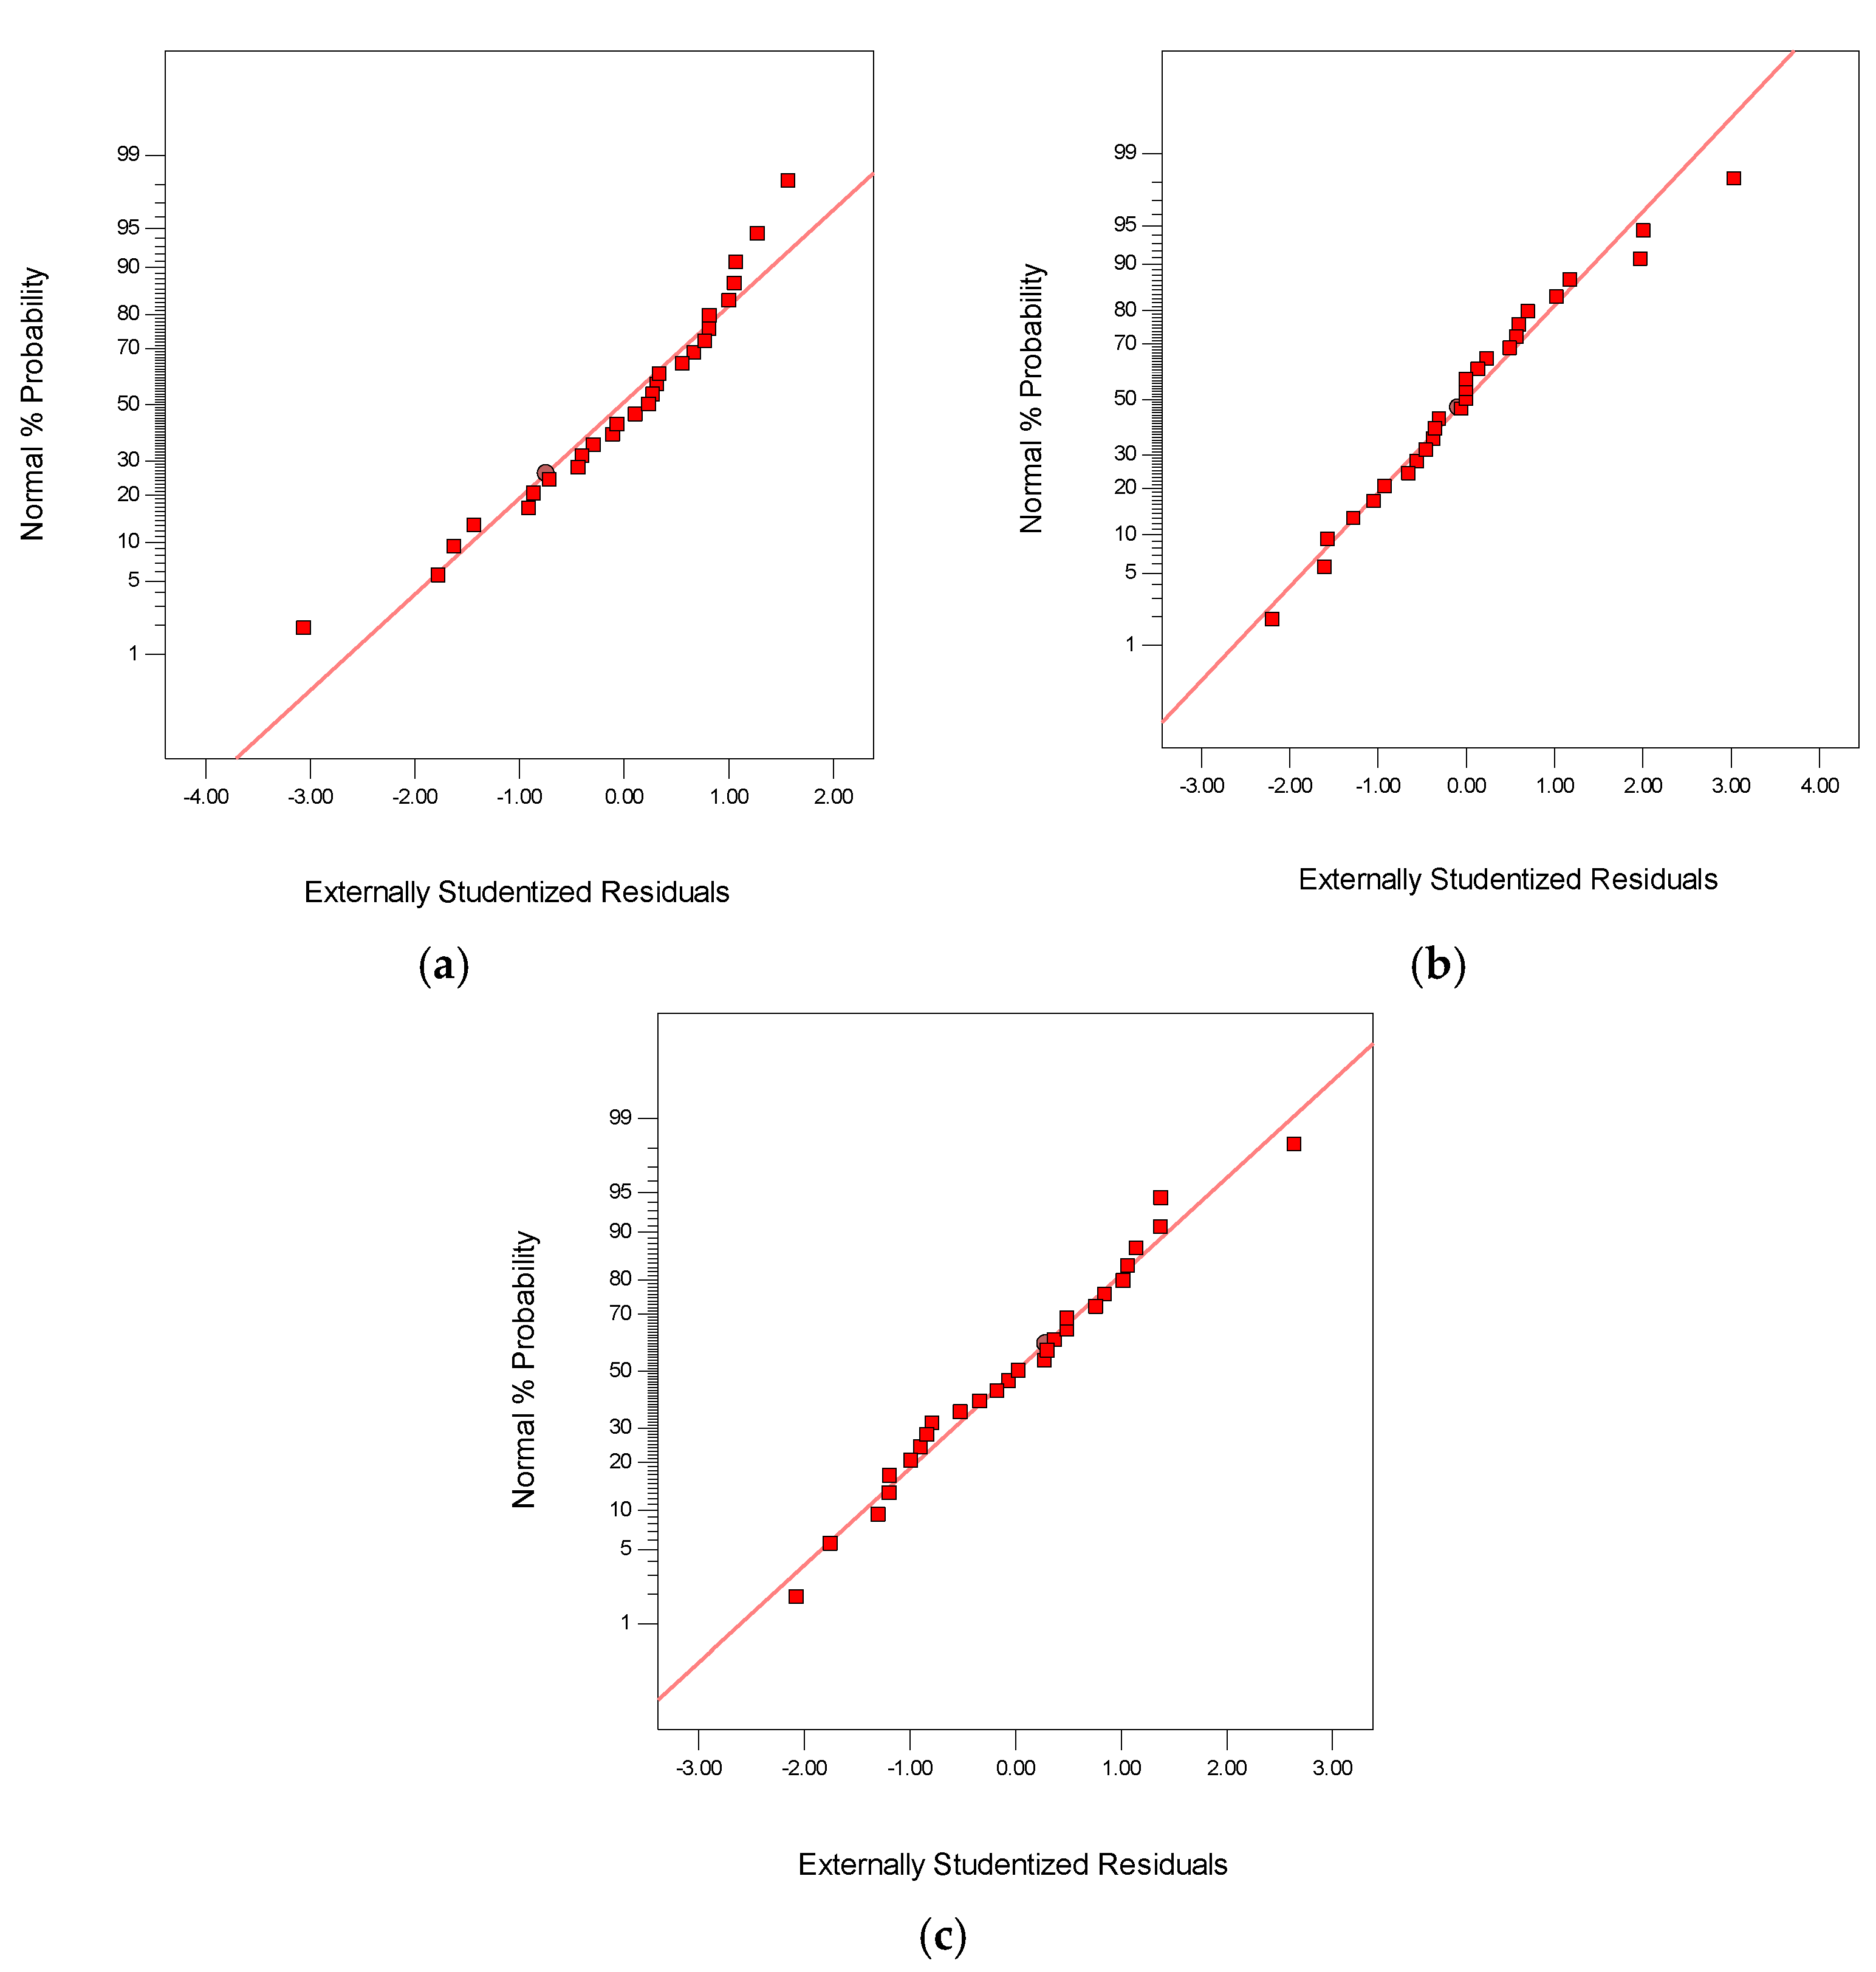
An examination of the suitability of the model with the real system is necessary to ensure that the model provides an adequate estimate. The normal probability plot is one of the diagnostic tools to provide an estimate of the adequacy of the model [26]. Figure 3 display the normal probability plot of the residuals for the flexural strength, impact strength, and ILSS, respectively. All of the residuals plots are close to the ideal line of regression, proving that the errors are normally distributed.

3.4. Effect of Process Factors on the Responses

Figure 4 shows the effect of the process factor on the target responses. The model predicts that the highest flexural strength of 253.47 Mpa can be achieved by a combination of the following process parameters: melting temperature 280 °C, injection pressure 140 bar, fiber pretension 100 N, and immersion time of 10 min. The highest predicted impact strength is 186,137 kJ/m2, this value is achieved by the same combination as mentioned previously. It means that both mechanical properties can be obtained by setting the injection process parameters and fiber pretension at the maximum value, while the immersion time of the fiber is set for 10 min. Longer immersion time does not have a positive effect on mechanical properties.
In contrast to the two mechanical properties above, the highest ILSS prediction of 31.8 Mpa was produced by a combination of process parameters: melting temperature 275.18 °C, injection pressure 118 bar, fiber pretension 75 N, and immersion time 10 min. Immersion time for 10 min is proven to contribute to high responses value.

3.5. Optimization of Process Parameters

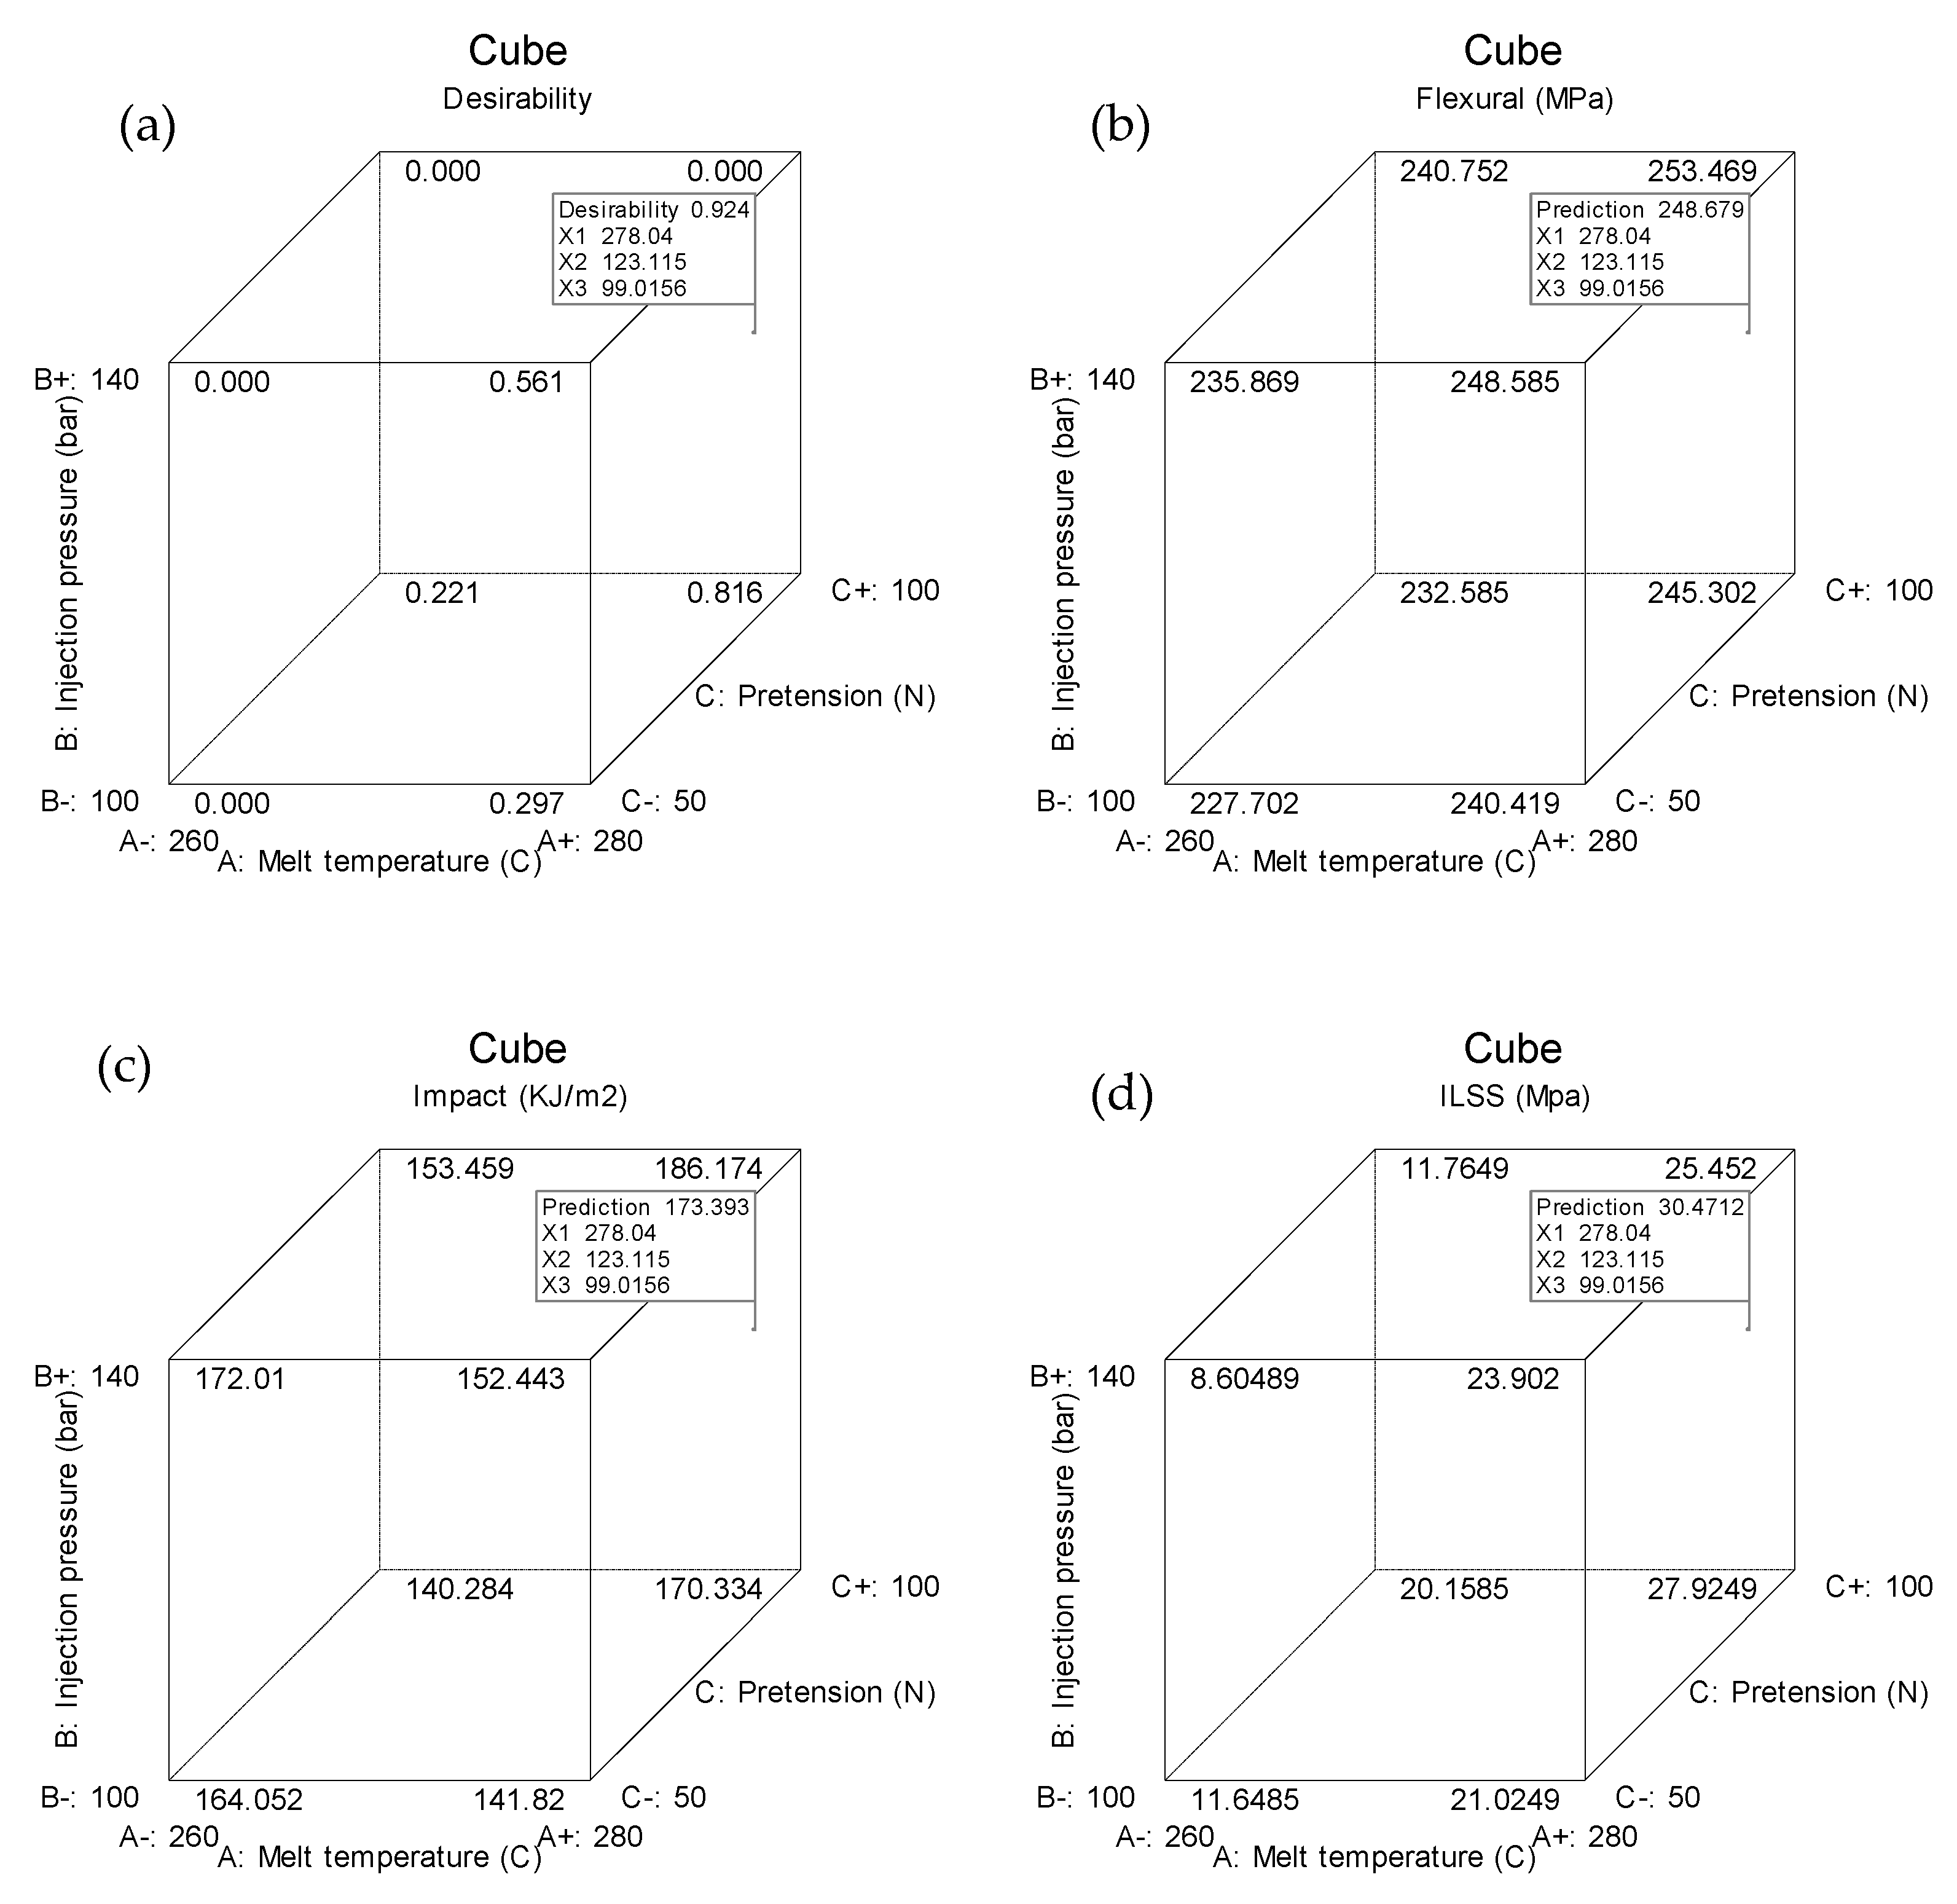
In the previous step, a combination of parameters has been obtained to maximize the value of each response. Maximum flexural strength and impact strength were obtained with the same process parameters, but not for ILSS. Optimization needs to be done to get a combination that can maximize all responses, known as multi-objective optimization [27,28,29]. A desirability function can be used to optimize multiple responses at the same time. Figure 5 shows the results of Box–Behnken design optimization. The optimal process parameters for all three responses are found to be the melt temperature of 278.06 °C, the injection pressure of 122.97 bar, a fiber pretension of 99 N, and an immersion time of 10 min. With these parameters, the optimal responses generated are as follows: flexural strength of 248.67 Mpa, impact strength of 173.4 kJ/m2, and ILSS of 30.47 Mpa. The desirability of this optimization result is 0.924, close to one. Desirability is an objective function with a value between zero and one. The value zero is assigned to factors that produce an undesirable response, whereas the value one denotes the optimal condition for the observed factors. The conditions with the highest desirability value are considered as the best values for the targeted response [30,31]. To maximize the desirability function of each response, the following Equation can be used [32]:
d = { | y L S L U S L L S L | s ,         L S L < y < U S L   0 ,                                                                             y < L S L 1 ,                                                                             y > U S L
where the exponent s is the shape constant of the desirability function and LSL and USL are the lower and upper response limits, respectively. Equation (9) can be used to calculate the overall desirability, D. Below, df, di, and ds are the desirability functions of flexural strength, impact strength, and ILSS, respectively.
D = ( d f × d i × d s ) 1 3
The optimization results can be proposed as a systematic multiobjective model for the injection overmolding process. It produces consistent parametric factors with multiobjective target responses, with less quality variation, and maintains product quality within an acceptable range.

3.6. Confirmation Experiment

The confirmation experiments were carried out using the combination of parameters that resulted from the optimization stage. Two experiments were carried out to validate the proposed optimization model using the following parameter combinations: melt temperature of 278 °C, the injection pressure of 122 bar, fiber pretension of 100 N, and fiber immersion time for 10 min. The process variables and corresponding yields for each experiment are shown in Table 9.
The experimental value obtained was reasonably close to the predicted value derived from the model, as shown in the table above. Here, the percentage errors for the confirmation experiment values and the predicted performance values at optimal process conditions were less than 3% for all responses. It is proven that Box Behnken Design and ANOVA are powerful predictive tools to determine the combination of process parameters for optimum multiple responses.

3.7. Microstructure of Fractured Surface

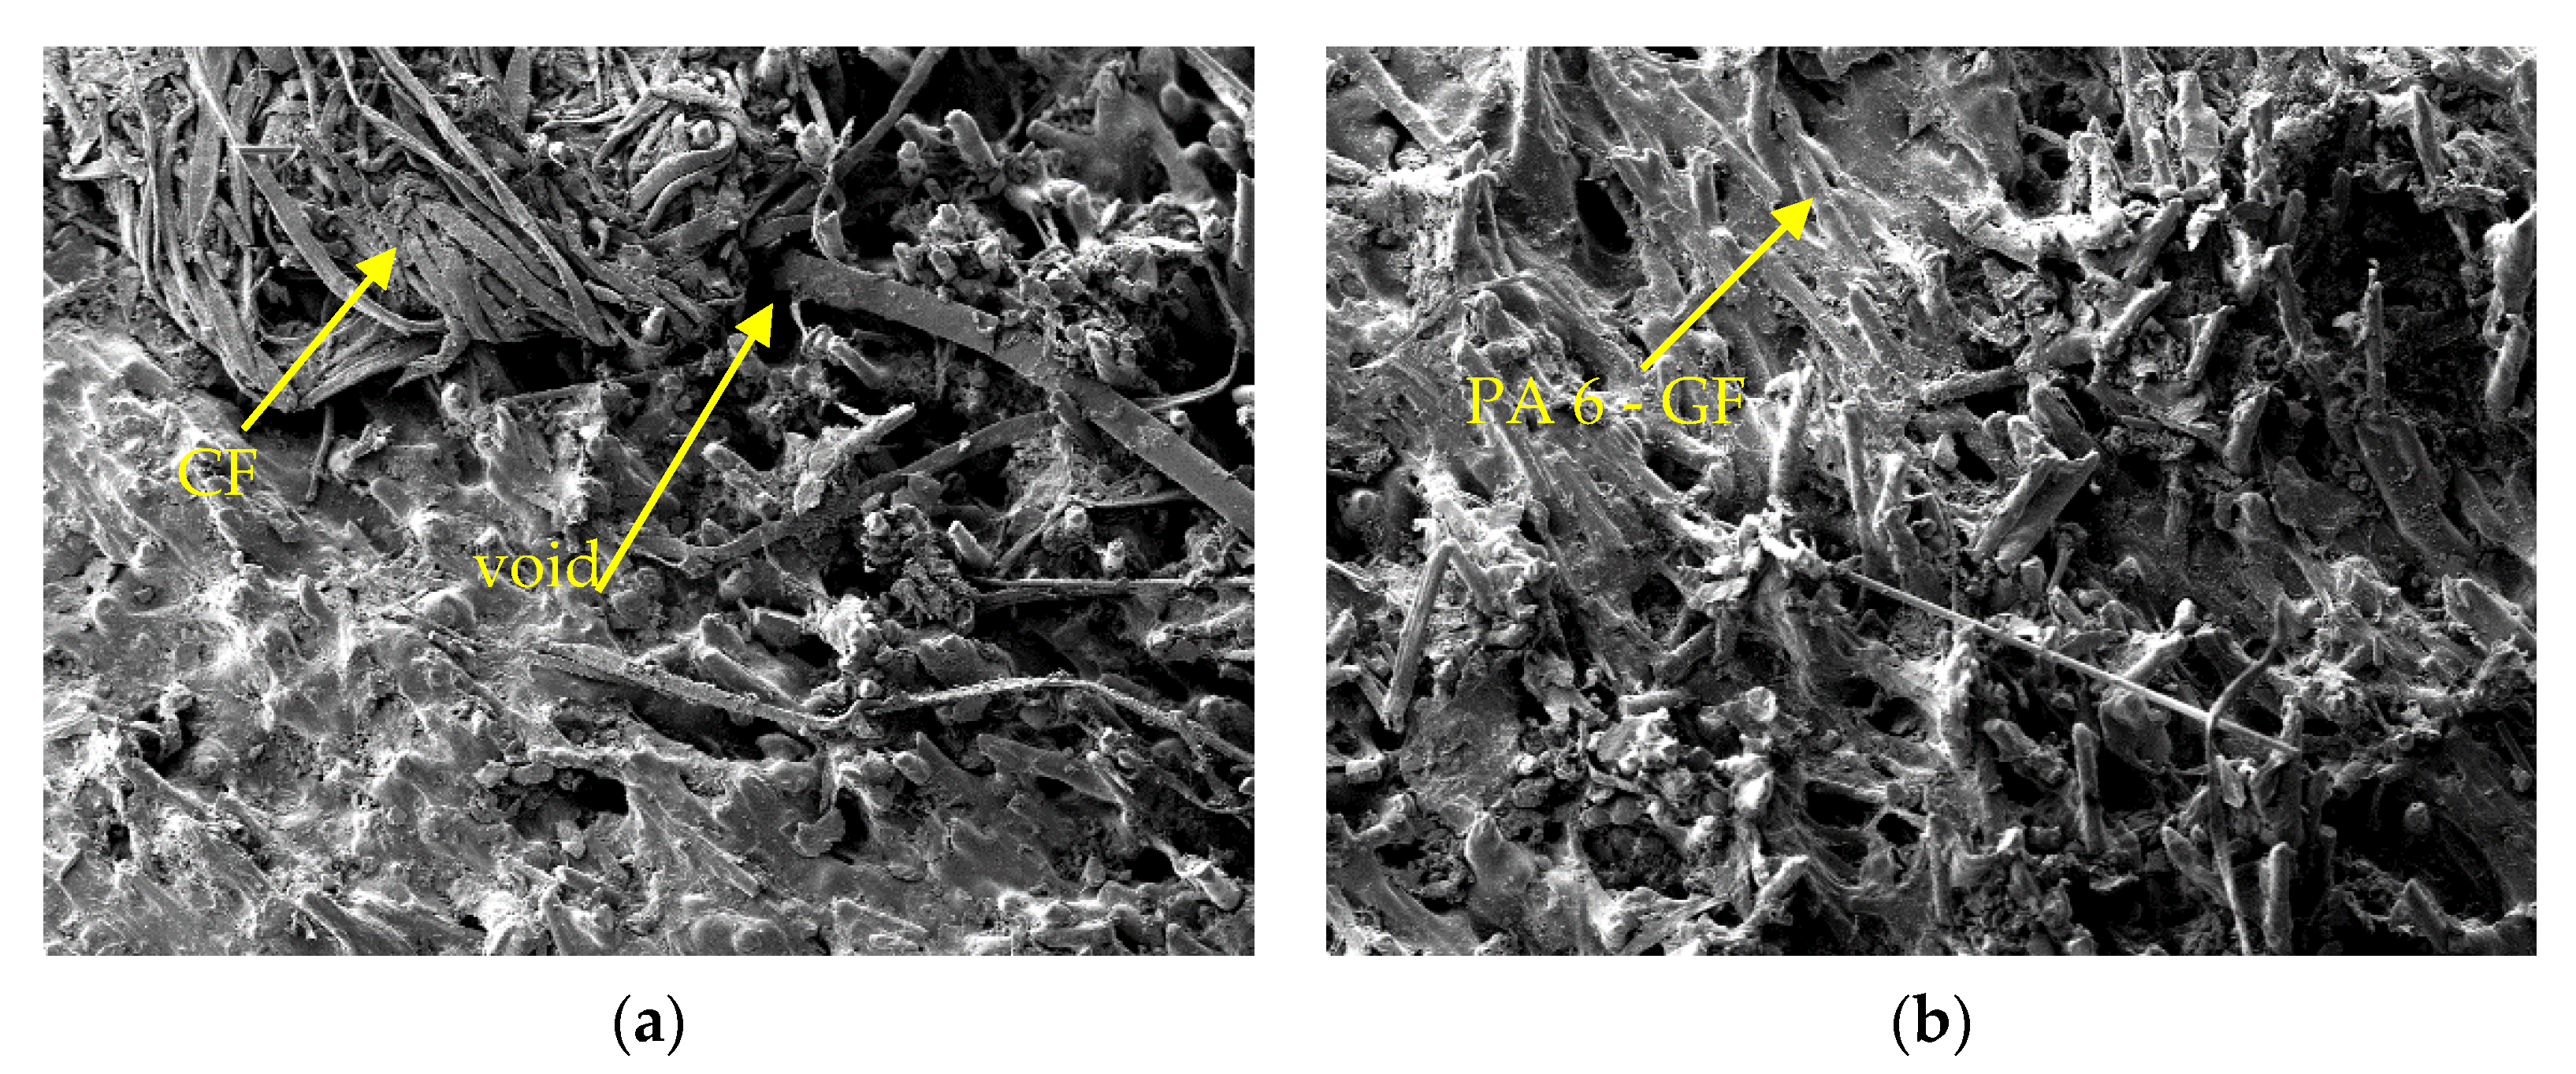
Figure 6a shows the micrograph of the fracture surface resulting from the low resistance impact test specimen. In contrast, Figure 6b displays the fracture surface of high resistance impact resistance. Glass fibers appear to bond perfectly with the PA 6 matrix because they have been incorporated in the form of composite pellets as a commercially manufactured material. Through comparing the two micrographs it can be stated that the lower impact resistance is related to the poor adhesion between unidirectional carbon fiber and the matrix. Significant gaps were found in the contact region between carbon fiber and PA 6, indicating that the interfacial bond between carbon fiber and PA 6 is much lower than between glass fiber and PA 6. In Figure 6a, there are some visible voids and agglomerated carbon fibers. This condition is due to the application of low pretension to carbon fiber combined with a low melting temperature setting. The carbon fiber cannot withstand the injection pressure, and the plastic melt cannot enter the gaps between the carbon fibers.
Different conditions are shown in Figure 6b; the voids and carbon fiber agglomeration are less than Figure 6a. The high melting temperature can reduce the viscosity of the plastic melt so that it is easier to flow into the gaps between the UD carbon fibers. The application of high pretension on carbon fiber can increase the stability of the fiber against the injection pressure of molten plastic and reduce the tendency to agglomerate. That situation is also the reason for the good mechanical performance.

4. Conclusions

The Box–Behnken design and ANOVAs have successfully demonstrated the effect of the injection overmolding process parameters on the mechanical properties of the hybrid fiber reinforced PA 6. Melting temperature had the most significant effect on flexural strength, while the interaction of melt temperature and fiber pretension, and fiber pretension in quadratic order, significantly influenced the impact strength. ILSS was significantly affected by melt temperature, injection pressure, the interaction of melt temperature and fiber immersion time, and the quadratic order of melt temperature, injection pressure, and fiber pretension. Immersing unidirectional carbon fiber for 10 min in liquid nitrogen conferred a positive effect to all three composite properties. To achieve the optimum composite mechanical properties, it is recommended to use a melting temperature of 278 °C, an injection pressure of 122 bar, a fiber pretension of 100 N, and to immerse the carbon fibers for 10 min in liquid nitrogen.

Author Contributions

Conceptualization, H.S.B.R. and C.B.; methodology, H.S.B.R.; software, C.B.; validation, H.S.B.R. and C.B.; formal analysis, H.S.B.R.; investigation, C.B.; resources, H.S.B.R.; data curation, H.S.B.R.; writing—original draft preparation, C.B.; writing—review and editing, H.S.B.R.; visualization, C.B.; supervision, H.S.B.R.; project administration, H.S.B.R.; funding acquisition, H.S.B.R. All authors have read and agreed to the published version of the manuscript.

Funding

This research was funded by the Ministry of Research and Technology/National Research and Innovation Agency of the Republic of Indonesia, grant number 2200/UN1/DITLIT/DIT-LIT/PT/2021.

Institutional Review Board Statement

Not applicable.

Informed Consent Statement

Not applicable.

Conflicts of Interest

The authors declare no conflict of interest. The funders had no role in the design of the study; in the collection, analyses, or interpretation of data; in the writing of the manuscript, or in the decision to publish the results.

References

  1. Wan, Y.; Takahashi, J. Tensile properties and aspect ratio simulation of transversely isotropic discontinuous carbon fiber reinforced thermoplastics. Compos. Sci. Technol. 2016, 137, 167–176. [Google Scholar] [CrossRef]
  2. Friedrich, K.; Almajid, A.A. Manufacturing Aspects of Advanced Polymer Composites for Automotive Applications. Appl. Compos. Mater. 2013, 20, 107–128. [Google Scholar] [CrossRef]
  3. Jiang, B.; Fu, L.; Zhang, M.; Weng, C. Effect of thermal gradient on interfacial behavior of hybrid fiber reinforced polypropylene composites fabricated by injection overmolding technique. Polym. Compos. 2020, 41, 4064–4073. [Google Scholar] [CrossRef]
  4. Huang, P.W.; Peng, H.-S.; Hwang, S.-J.; Huang, C.-T. The Low Breaking Fiber Mechanism and Its Effect on the Behavior of the Melt Flow of Injection Molded Ultra-Long Glass Fiber Reinforced Polypropylene Composites. Polymers 2021, 13, 2492. [Google Scholar] [CrossRef] [PubMed]
  5. Gibson Ronald, F. Principles of Composite Material Mechanics, 3rd ed.; CRC Press: New York, NY, USA, 1994. [Google Scholar]
  6. Rosato, D.V. Plastics Processing Data Handbook, 2nd ed.; Chapman & Hall: London, UK, 1997. [Google Scholar]
  7. Wang, Q.; Sun, L.; Li, L.; Yang, W.; Zhang, Y.; Dai, Z.; Xiong, Z. Experimental and numerical investigations on microstructures and mechanical properties of hybrid fiber reinforced thermoplastic polymer. Polym. Test. 2018, 70, 215–225. [Google Scholar] [CrossRef]
  8. Sealy, C.; Egger, P. Molding the future: ENGEL takes composite approach to composites. In Reinforced Plastics; Elsevier Ltd.: Amsterdam, The Netherlands, 2016; pp. 10–13. [Google Scholar]
  9. Shao, Y.; Xu, F.; Liu, W.; Zhou, M.; Li, W.; Hui, D. Influence of cryogenic treatment on mechanical and interfacial properties of carbon nanotube fiber/bisphenol-F epoxy composite. Compos. Part B 2017, 125, 195–202. [Google Scholar] [CrossRef]
  10. Song, M.G.; Kweon, J.H.; Choi, J.H.; Byun, J.H.; Song, M.H.; Shin, S.J.; Lee, T.J. Effect of manufacturing methods on the shear strength of composite single-lap bonded joints. Compos. Struct. 2010, 92, 2194–2202. [Google Scholar] [CrossRef]
  11. Hassan, A.K.F.; Abdullah, O.A. New methodology for prestressing fiber composites. Univers. J. Mech. Eng. 2015, 3, 252–261. [Google Scholar] [CrossRef] [Green Version]
  12. Mertiny, P.; Ellyin, F. Influence of the filament winding tension on physical and mechanical properties of reinforced composites. Compos. Part A 2002, 33, 1615–1622. [Google Scholar] [CrossRef]
  13. Torayca. T700S Data Sheet No. CFA-005; Toray Carbon Fibers: Santa Ana, CA, USA, 2018. [Google Scholar]
  14. Toray Industries. AMILAN PA 6 30 GF; Toray Industries: Tokyo, Japan, 2006. [Google Scholar]
  15. Mostafa, N.H.; Ismarrubie, Z.N.; Sapuan, S.M. Fibre prestressed polymer-matrix composites: A review. J. Compos. Mater. 2017, 51, 39–66. [Google Scholar] [CrossRef]
  16. Budiyantoro, C.; Rochardjo, H.S.B.; Nugroho, G. Effects of Processing Variables of Extrusion–Pultrusion Method on the Impregnation Quality of Thermoplastic Composite Filaments. Polymers 2020, 12, 2833. [Google Scholar] [CrossRef]
  17. Goodship, V. Practical Guide to Injection Moulding; Rapra Technology: Shropshire, UK, 2004. [Google Scholar]
  18. Antony, J. Design of Experiments for Engineers and Scientists; Buttonworth-Heineman: London, UK, 2014. [Google Scholar]
  19. Bradley, N. The Response Surface Methodology Department of Mathematical Sciences; Indiana University of South Bend: South Bend, IN, USA, 2017. [Google Scholar]
  20. Ryu, Y.; Sohn, J.; Sohn, J.S.; Cha, S.W. Shrinkage and Warpage Minimization of Glass-Fiber-Reinforced Polyamide 6 Parts by Microcellular Foam Injection Molding. Polymers 2020, 12, 889. [Google Scholar] [CrossRef]
  21. Sing, J.; Ching, Y.C.; Abdullah, L.C.; Ching, Y.K.; Razali, D.; Gan, S.N. Optimization of Mechanical Properties for Polyoxymethylene/Glass Fiber/Polytetrafluoroethylene Composites Using Response Surface Methodology. Polymers 2018, 10, 338. [Google Scholar]
  22. ISO. ISO 178—Determination of Flexural Properties; ISO: Berlin, Germany, 2019. [Google Scholar]
  23. ASTM. ASTM-D2344-Short-Beam-Strength of Polymer Matrix Composit-Materials and Their Laminates; ASTM: West Conshohocken, PA, USA, 2003. [Google Scholar]
  24. ISO. ISO 179—Determination of Charpy Impact Properties; ISO: Brussels, Belgium, 2013. [Google Scholar]
  25. Maier, A.; Schramm, N.; Kroll, L. Temperature-dependent interlaminar shear strength of unidirectional continuous fiber-reinforced thermoplastic profiles. Compos. Struct. 2021, 255, 112959. [Google Scholar] [CrossRef]
  26. Yaghoobi, H. An experimental investigation and optimization on the impact strength of kenaf fiber biocomposite: Application of response surface methodology. Polym. Bull. 2018, 75, 3283–3309. [Google Scholar] [CrossRef]
  27. Chen, W.; Nguyen, M.; Chiu, W. Optimization of the plastic injection molding process using the Taguchi method, RSM, and hybrid GA-PSO. Int. J. Adv. Manuf. Technol. 2016, 83, 1873–1886. [Google Scholar] [CrossRef]
  28. Fernandes, C.; Pontes, A.J.; Viana, J.C.; Cunha, A. Using Multi-objective Evolutionary Algorithms for Optimization of the Cooling System in Polymer Injection Molding. Int. Polym. Process. 2012, 27, 213–223. [Google Scholar] [CrossRef] [Green Version]
  29. Fernandes, C.; Pontes, A.J.; Viana, J.C.; Cunha, G.A. Using multiobjective evolutionary algorithms in the optimization of operating conditions of polymer injection molding. Polym. Eng. Sci. 2010, 50, 1667–1678. [Google Scholar] [CrossRef]
  30. Amdoun, R.; Khelifi, L.; Khelifi-slaoui, M.; Amroune, S.; Asch, M.; Gontier, E. The Desirability Optimization Methodology; a Tool to Predict Two Antagonist Responses in Biotechnological Systems: Case of Biomass Growth and Hyoscyamine Content in Elicited Datura starmonium Hairy Roots. Iran J. Biotechnol. 2018, 16, 1–19. [Google Scholar] [CrossRef] [Green Version]
  31. Wu, C.; Lui, W.; Peng, J. Optimization of Extrusion Variables and Maleic Anhydride Content on Biopolymer Blends Based on Poly(hydroxybutyrate-co-hydroxyvalerate)/Poly(vinyl acetate) with Tapioca Starch. Polymers 2018, 10, 827. [Google Scholar] [CrossRef] [Green Version]
  32. Pal, S.; Gauri, S.K. A desirability functions-based approach for simultaneous optimization of quantitative and ordinal response variables in industrial processes. Int. J. Eng. Sci. Technol. 2018, 10, 76–87. [Google Scholar] [CrossRef] [Green Version]
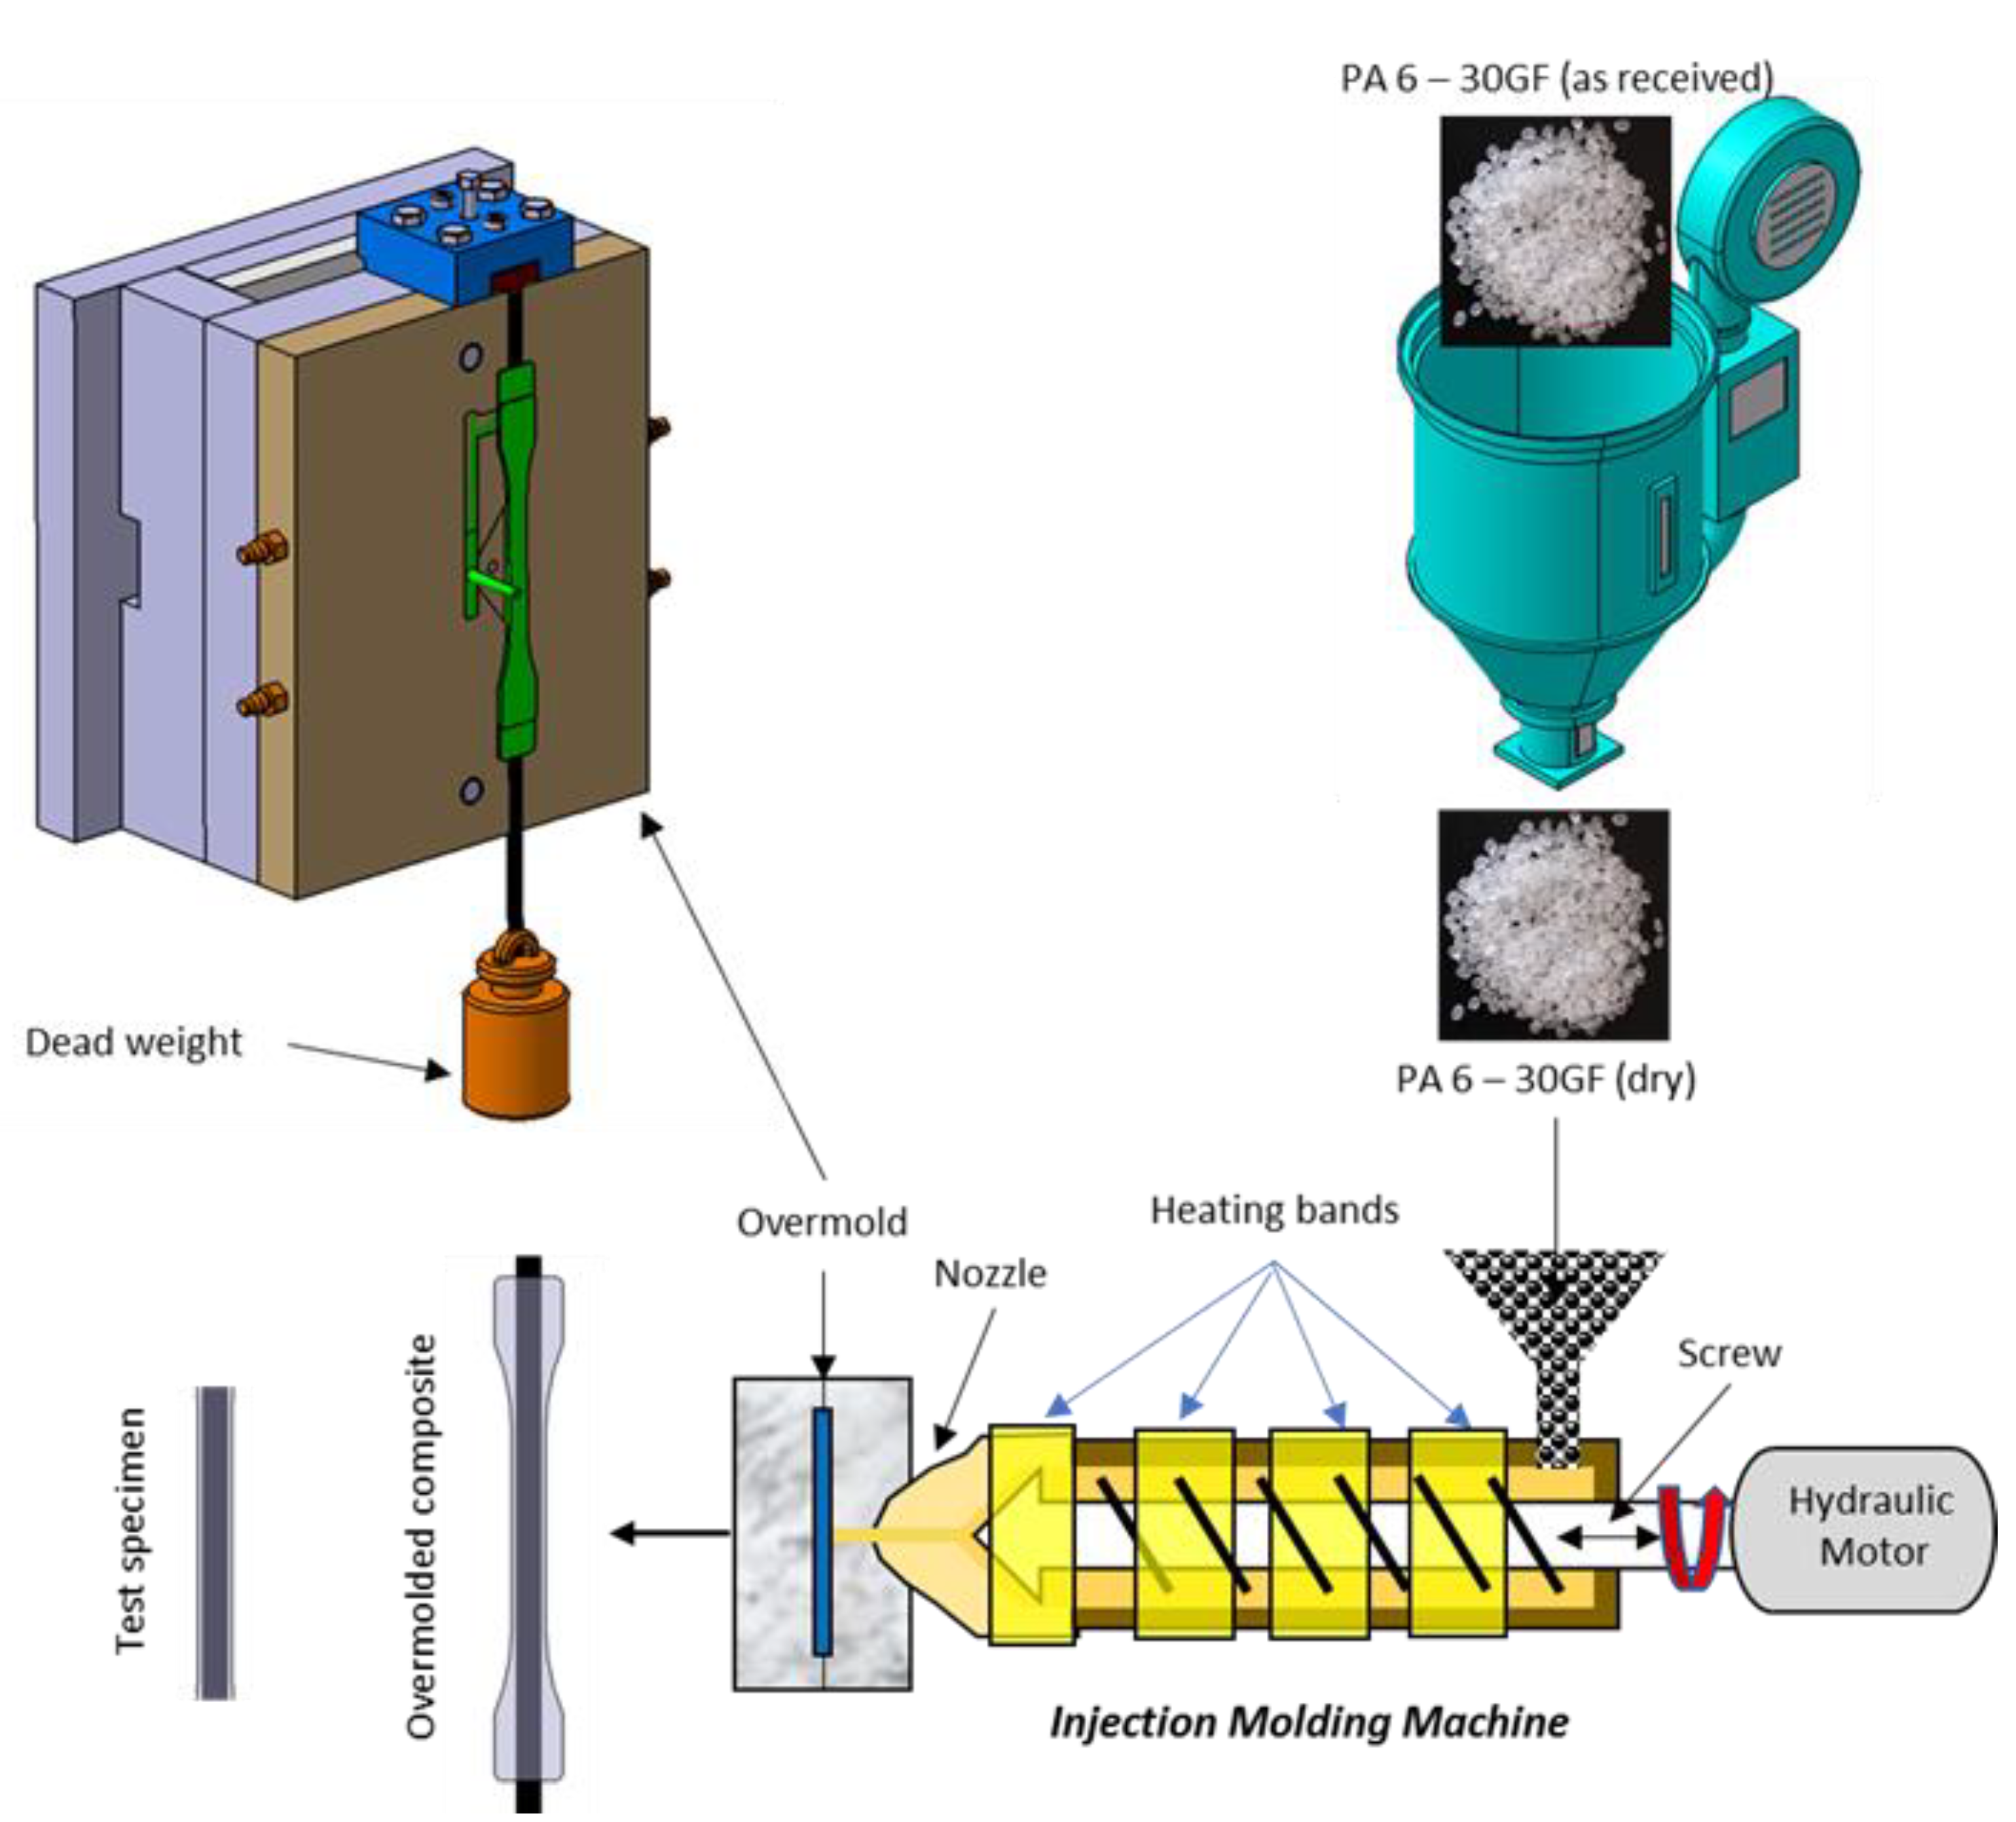
Figure 1. Manufacturing steps of hybrid fiber overmolded composite.
Polymers 13 03820 g001
Figure 2. Result of hybrid fiber overmolded composite.
Polymers 13 03820 g002
Figure 3. Normal probability plot residuals for the responses: (a) flexural strength; (b) impact strength; (c) ILSS.
Polymers 13 03820 g003
Figure 4. Effect of injection pressure and melt temperature on the target responses: (a) flexural strength; (b) impact strength; (c) ILSS.
Polymers 13 03820 g004
Figure 5. Optimization results: (a) desirability; (b) flexural strength; (c) impact strength; (d) ILSS.
Polymers 13 03820 g005
Figure 6. Micrograph of fracture surface: (a) low impact resistance specimen; (b) high impact resistance specimen.
Polymers 13 03820 g006
Table 1. Material properties.
MaterialPropertiesValues
carbon fiber
(T700SC 12K)
filament diameter (µm)7
density (g/cm3)1.8
tensile strength (Mpa)4900
Amilan PA 6-30 GFdensity (g/cm3)1.36
melting temperature (°C)225
flexural strength at 23 °C (Mpa)280 (dry)
145 (2.5% water)
flexural modulus at 23 °C (Gpa)9.5 (dry)
5.1 (2.5% water)
charpy impact, unnotched, at 23 °C (kJ/m2)80 (dry)
100 (2.5% water)
liquid nitrogenboiling point (°C)−196
density, liquid @ BP, 1 atm (Kg/m3)808.5
specific gravity, liquid (water = 1) @ 20 °C, 1 atm0.808
Table 2. Constant parameter setting.
ParametersValuesUnit
screw speed160rpm
charging time3.42s
backpressure50bar
hot size70mm
velocity transfer pressure35mm
injection speed80mm/s
filling time0.535s
packing pressure300kg/cm2
packing time2s
cooling time15s
cooling temperature40°C
Table 3. Parameter factors and levels.
FactorsCodingActual Level
Low (−1)Middle (0)High (+1)
Melting temperature (°C)A260270280
Injection pressure (bar)B100120140
Fiber pretension (N)C5075100
Nitrogen immersion (min)D101520
Table 4. Design of experiment.
RunCodeActual
ABCDABCD
100002701207515
210−102801205015
3−101026012010015
400002701207515
5100−12801207510
6001−127012010010
7−100−12601207510
811002801407515
9010−12701407510
101−1002801007515
11−10012601207520
120−10−12701007510
130−11027010010015
14001127012010020
1500−1−12701205010
1610012801207520
1700−112701205020
18−1−1002601007515
19−10−102601205015
2000002701207515
2101−102701405015
2201012701407520
23101028012010015
24−11002601407515
250−1012701007520
260−1−102701005015
27011027014010015
Table 5. Testing results.
RunParameters
ABCDFlexural Strength (Mpa)Impact Strength (kJ/m2)ILSS (Mpa)
12701207515245.4153.27132.6
22801205015238144.56924.53
326012010015241.2137.28519.36
42701207515247.5153.27129.9
52801207510252.8151.46930
627012010010249.2166.97428.85
72601207510245.6151.62120.97
82801407515250155.14826.8607
92701407510246.8166.87924
102801007515238.6151.46924.86
112601207520235.2158.97926.8
122701007510233.2148.86229.9
1327010010015235155.22530.2
1427012010020241.2157.77524.48
152701205010239153.27124.83
162801207520237.8151.54519.86
172701205020237.4162.50629.8
182601007515207.2147.94220.32
192601205015221.5166.97421.63
202701207515230153.27128.4
212701405015233.4173.39321.28
222701407520242162.2821
2328012010015234.2167.16220.65
242601407515224.4148.95716.4
252701007520231.4155.07229.6
262701005015233.2171.47922.72
2727014010015231162.35623.41
Table 6. ANOVA for flexural strength.
SourceSum of SquaresdfMean SquareF-Valuep-Value
Prob > F
Note
Model900.984225.243.210.0323significant
A-Melt temperature485.141485.146.900.0154significant
B-Injection pressure200.081200.082.850.1056
C-Fiber pretension71.54171.541.020.3239
D-Nitrogen immersion144.211144.212.050.1660
Residual1545.902270.27
Lack of Fit1363.302068.160.750.7155not significant
Pure Error182.61291.30
Cor Total2446.8826
Adeq Precision5.79
Table 7. ANOVA for impact strength.
SourceSum of SquaresdfMean SquareF-Valuep-Value
Prob > F
Note
Model1558.2814111.313.820.0127significant
A-Melt temperature7.6917.690.260.6168
B-Injection pressure126.521126.524.340.0592
C-Fiber pretension53.83153.831.850.1991
D-Nitrogen immersion6.8716.870.240.6359
AB1.7811.780.0610.8092
AC683.341683.3423.450.0004significant
AD13.25113.250.450.5128
BC6.8016.800.230.6376
BD29.21129.211.000.3364
CD84.96184.962.920.1134
A2110.171110.173.780.0756
B272.92172.922.500.1396
C2204.111204.117.010.0213significant
D226.27126.270.900.3611
Residual349.611229.13
Lack of Fit349.611034.96
Pure Error0.00020.000
Cor Total1907.9026
Adeq Precision7.55
Table 8. ANOVA for ILSS.
SourceSum of SquaresdfMean SquareF-Valuep-Value
Prob > F
Note
Model383.631427.403.610.0159significant
A-Melt temperature37.74137.744.970.0456significant
B-Injection pressure50.63150.636.670.0240significant
C-Fiber pretension0.3910.390.0510.8247
D-Nitrogen immersion4.1014.100.540.4767
AB8.7618.761.150.3037
AC0.6510.650.0850.7751
AD63.76163.768.400.0134significant
BC7.1617.160.940.3507
BD1.8211.820.240.6329
CD21.81121.812.870.1158
A2154.531154.5320.360.0007significant
B251.06151.066.730.0235significant
C246.27146.276.100.0295significant
D22.2712.270.300.5949
Residual91.08127.59
Lack of Fit82.02108.201.810.4078not significant
Pure Error9.0624.53
Cor Total474.7026
Adeq Precision6.867
Table 9. Results of model validation at the optimum condition.
EntryPredicted Flexural StrengthConfirmation Flexular StrengthPredicted Impact StrengthConfirmation Impact StrengthPredicted ILSSConfirmation ILSS
(Mpa)(Mpa)(kJ/m2)(kJ/m2)(Mpa)(Mpa)
1248.67249173.4171.430.4730.26
2246169.529.99
Publisher’s Note: MDPI stays neutral with regard to jurisdictional claims in published maps and institutional affiliations.