
Incorporation of Natural Blueberry, Red Grapes and Parsley Extract By-Products into the Production of Chitosan Edible Films

 ,
,  , , ,
, , ,  , , and
Abstract
:1. Introduction
2. Materials and Methods
2.1. Materials
2.2. The Extract Preparation
2.3. Edible Packaging Preparation
2.4. Stability of the Film-Forming Solutions
Zeta Potential
2.5. Basic Morphological and Textural Properties of the Films
2.5.1. Film Thickness
2.5.2. Textural Properties
2.5.3. Gas Barrier Properties
2.6. Basic Compositional and Structural Analysis
2.6.1. Water Content, Solubility and Swelling Degree
Solubility (%) = [(W2 − W4)/W2] × 100
Swelling degree (%) = [(W3 − W2)/W2] × 100
2.6.2. Attenuated Total Reflectance Fourier-Transform spectroscopy
2.7. Content of the Antioxidant Compounds in the Films
2.7.1. Attenuated Total Reflectance Fourier-Transform Spectroscopy
2.7.2. HPLC—Polyphenolic Compounds Determination
2.8. Evaluation of the Antioxidant Properties of the Films
2.8.1. FRAP (Ferric Reducing Antioxidant Power)
2.8.2. ABTS (2,2′-Azino-Bis(3-Ethylbenzothiazoline-6-Sulfonic Acid))
2.8.3. DPPH (2,2-Diphenyl-1-Picrylhydrazyl)
2.9. Antimicrobial Properties of Films
2.10. Determination of Migration of Bioactive Compounds
2.11. Statistical Analysis
3. Results and Discussion
3.1. Stability of the Film-Forming Solutions
3.2. Basic Morphological and Textural Properties of the Films
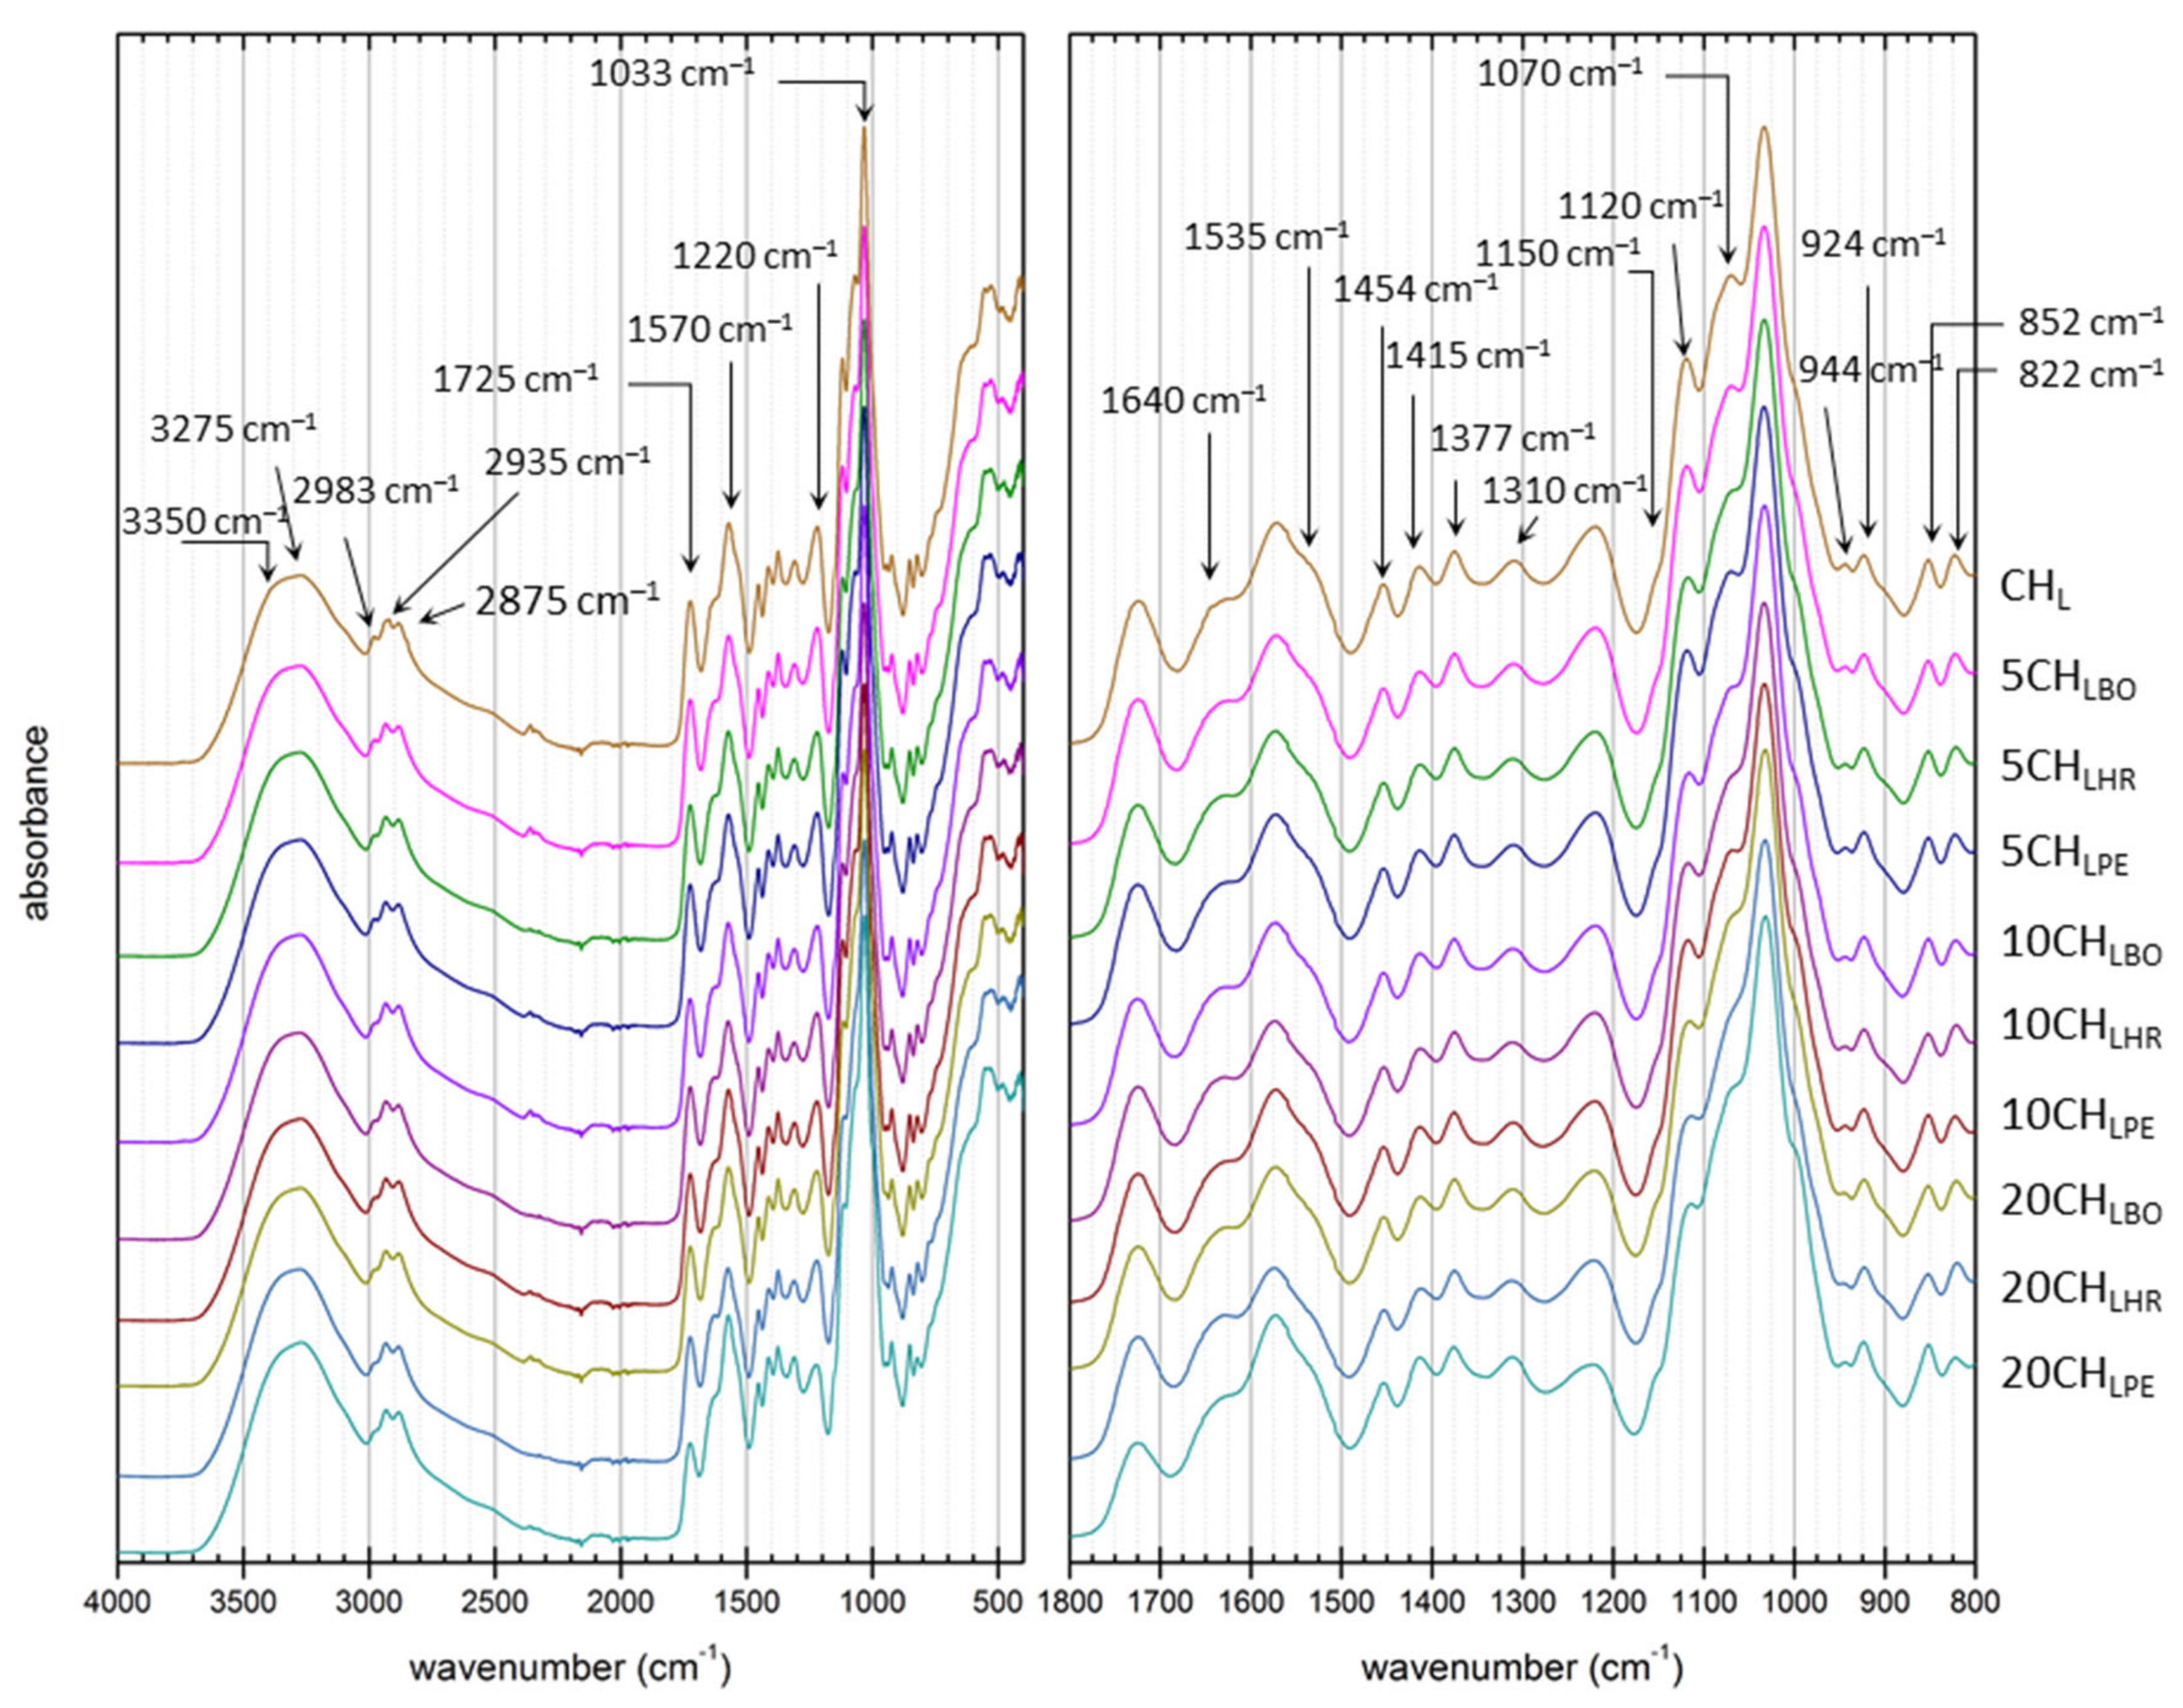
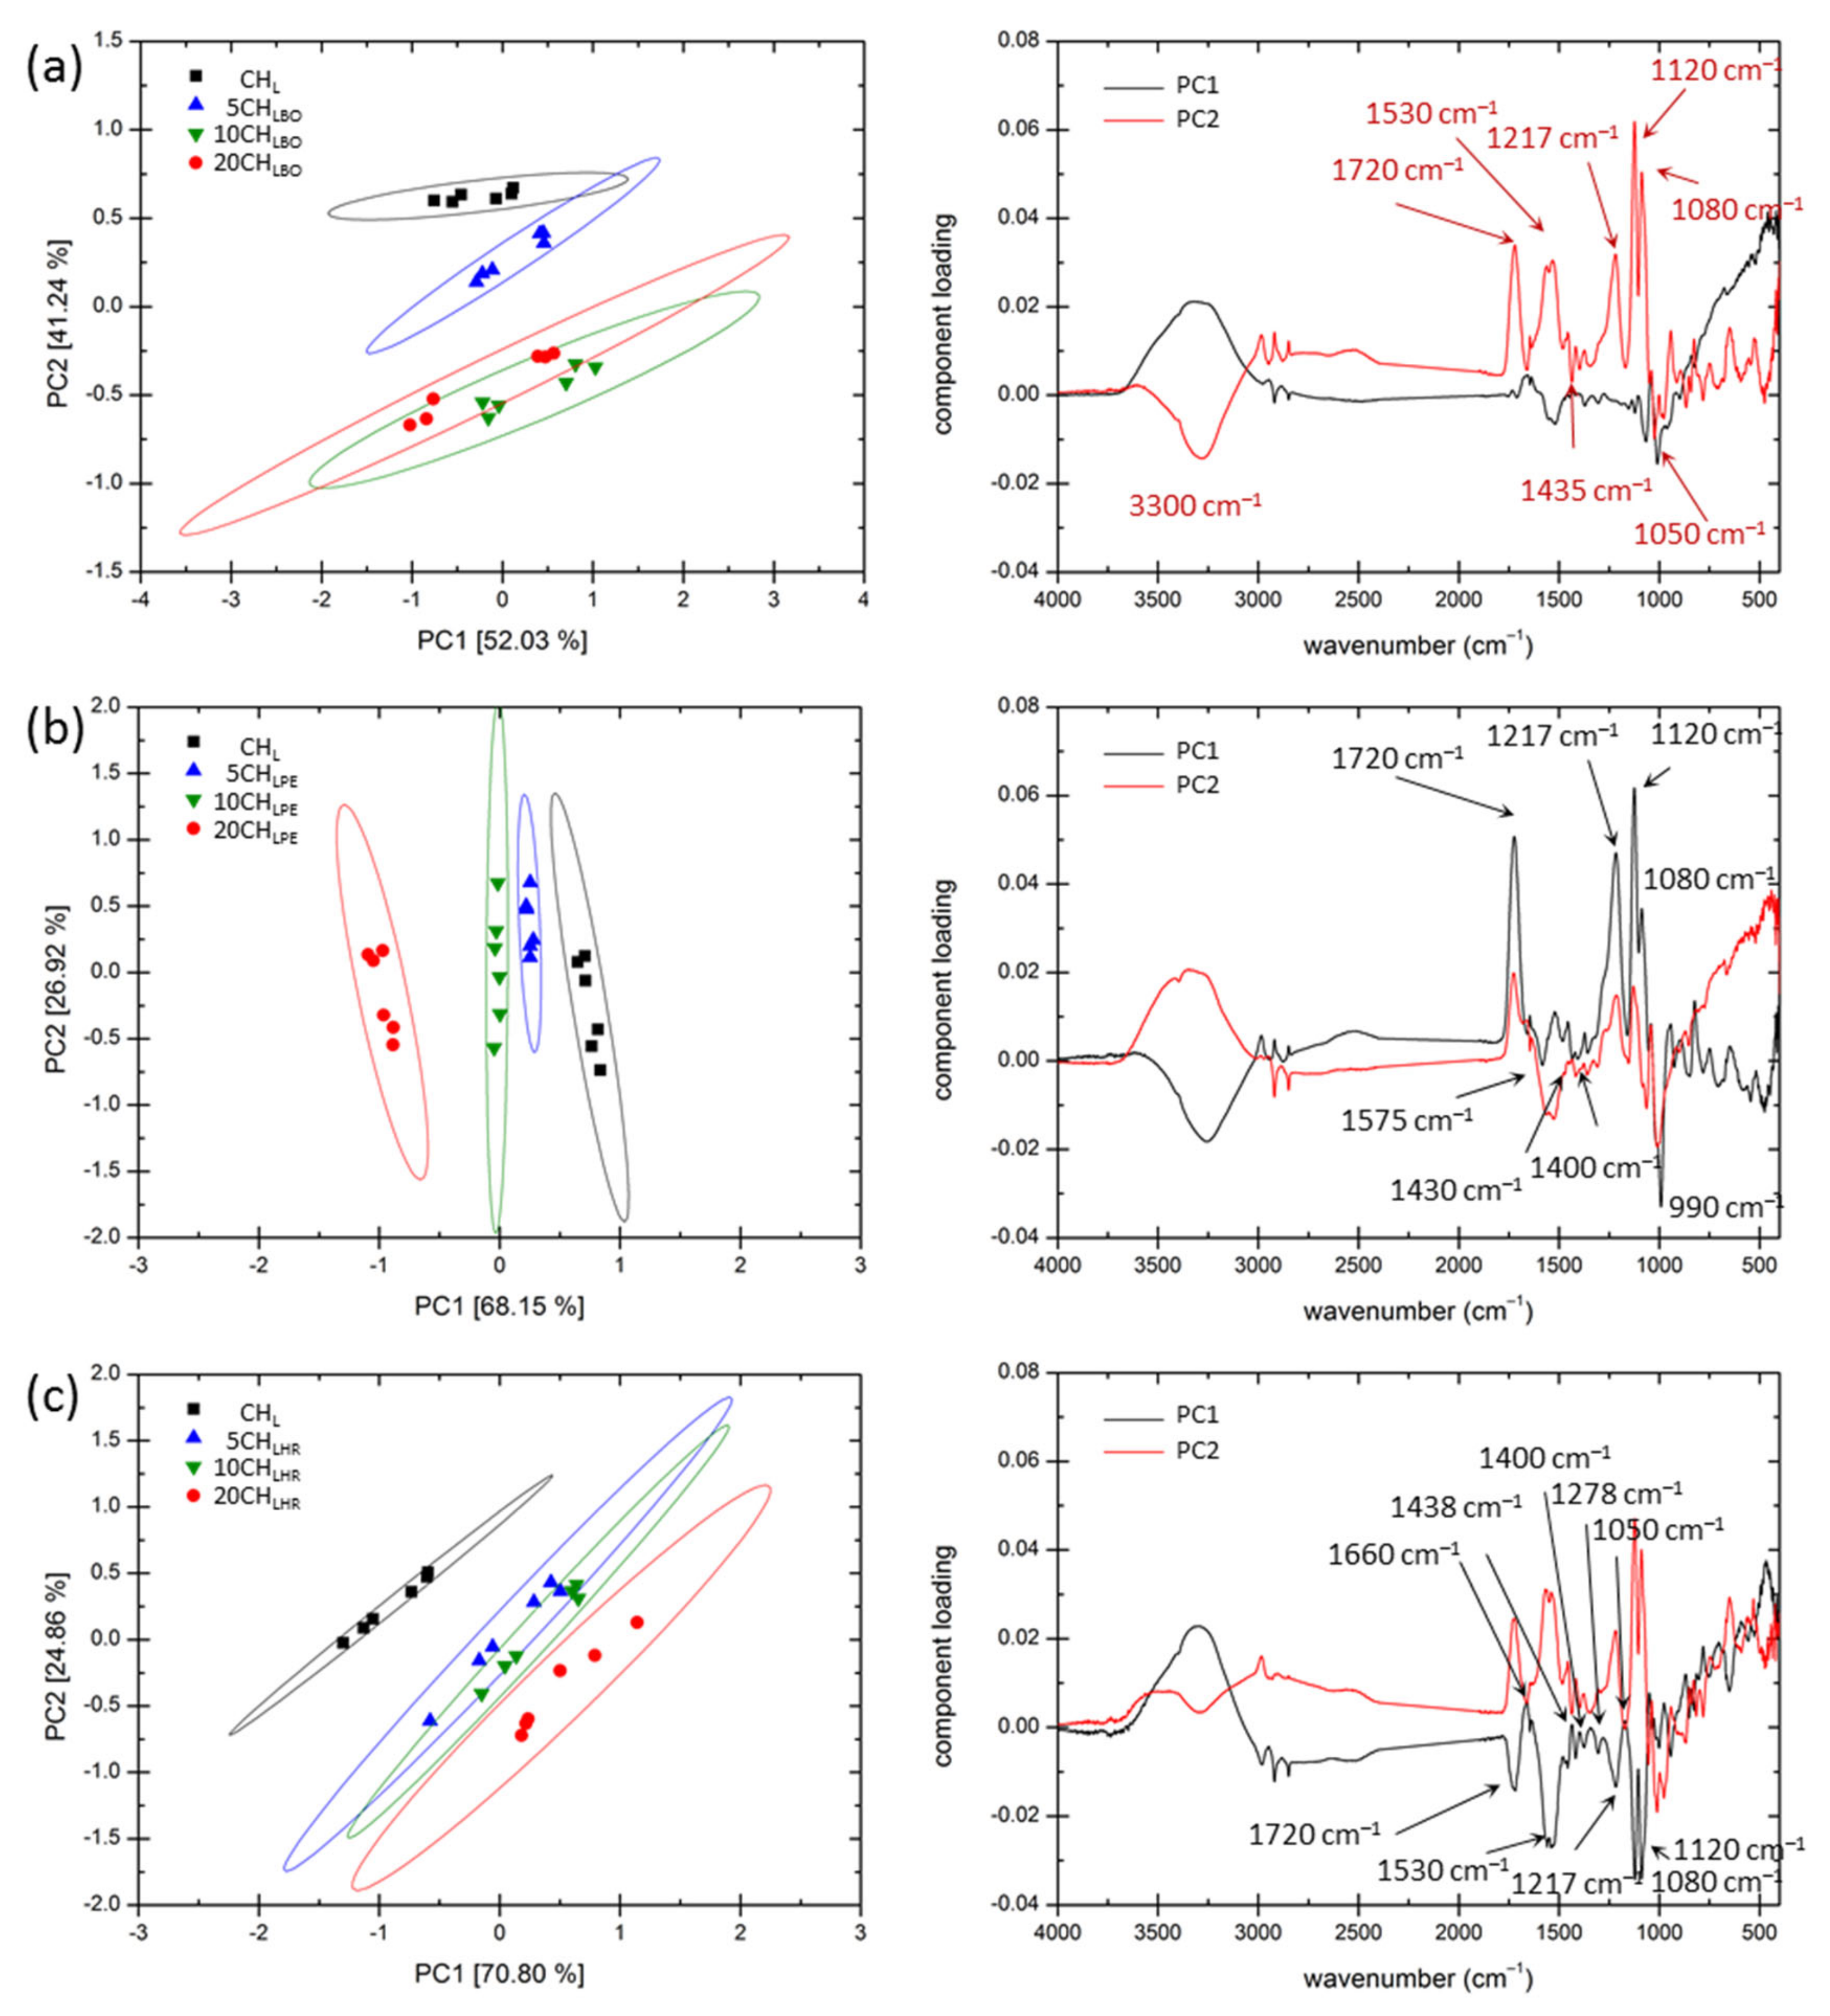
3.3. Basic Compositional and Structural Analysis
3.4. Content of the Antioxidant Compounds in the Films
3.5. Evaluation of the Antioxidant Properties of the Films
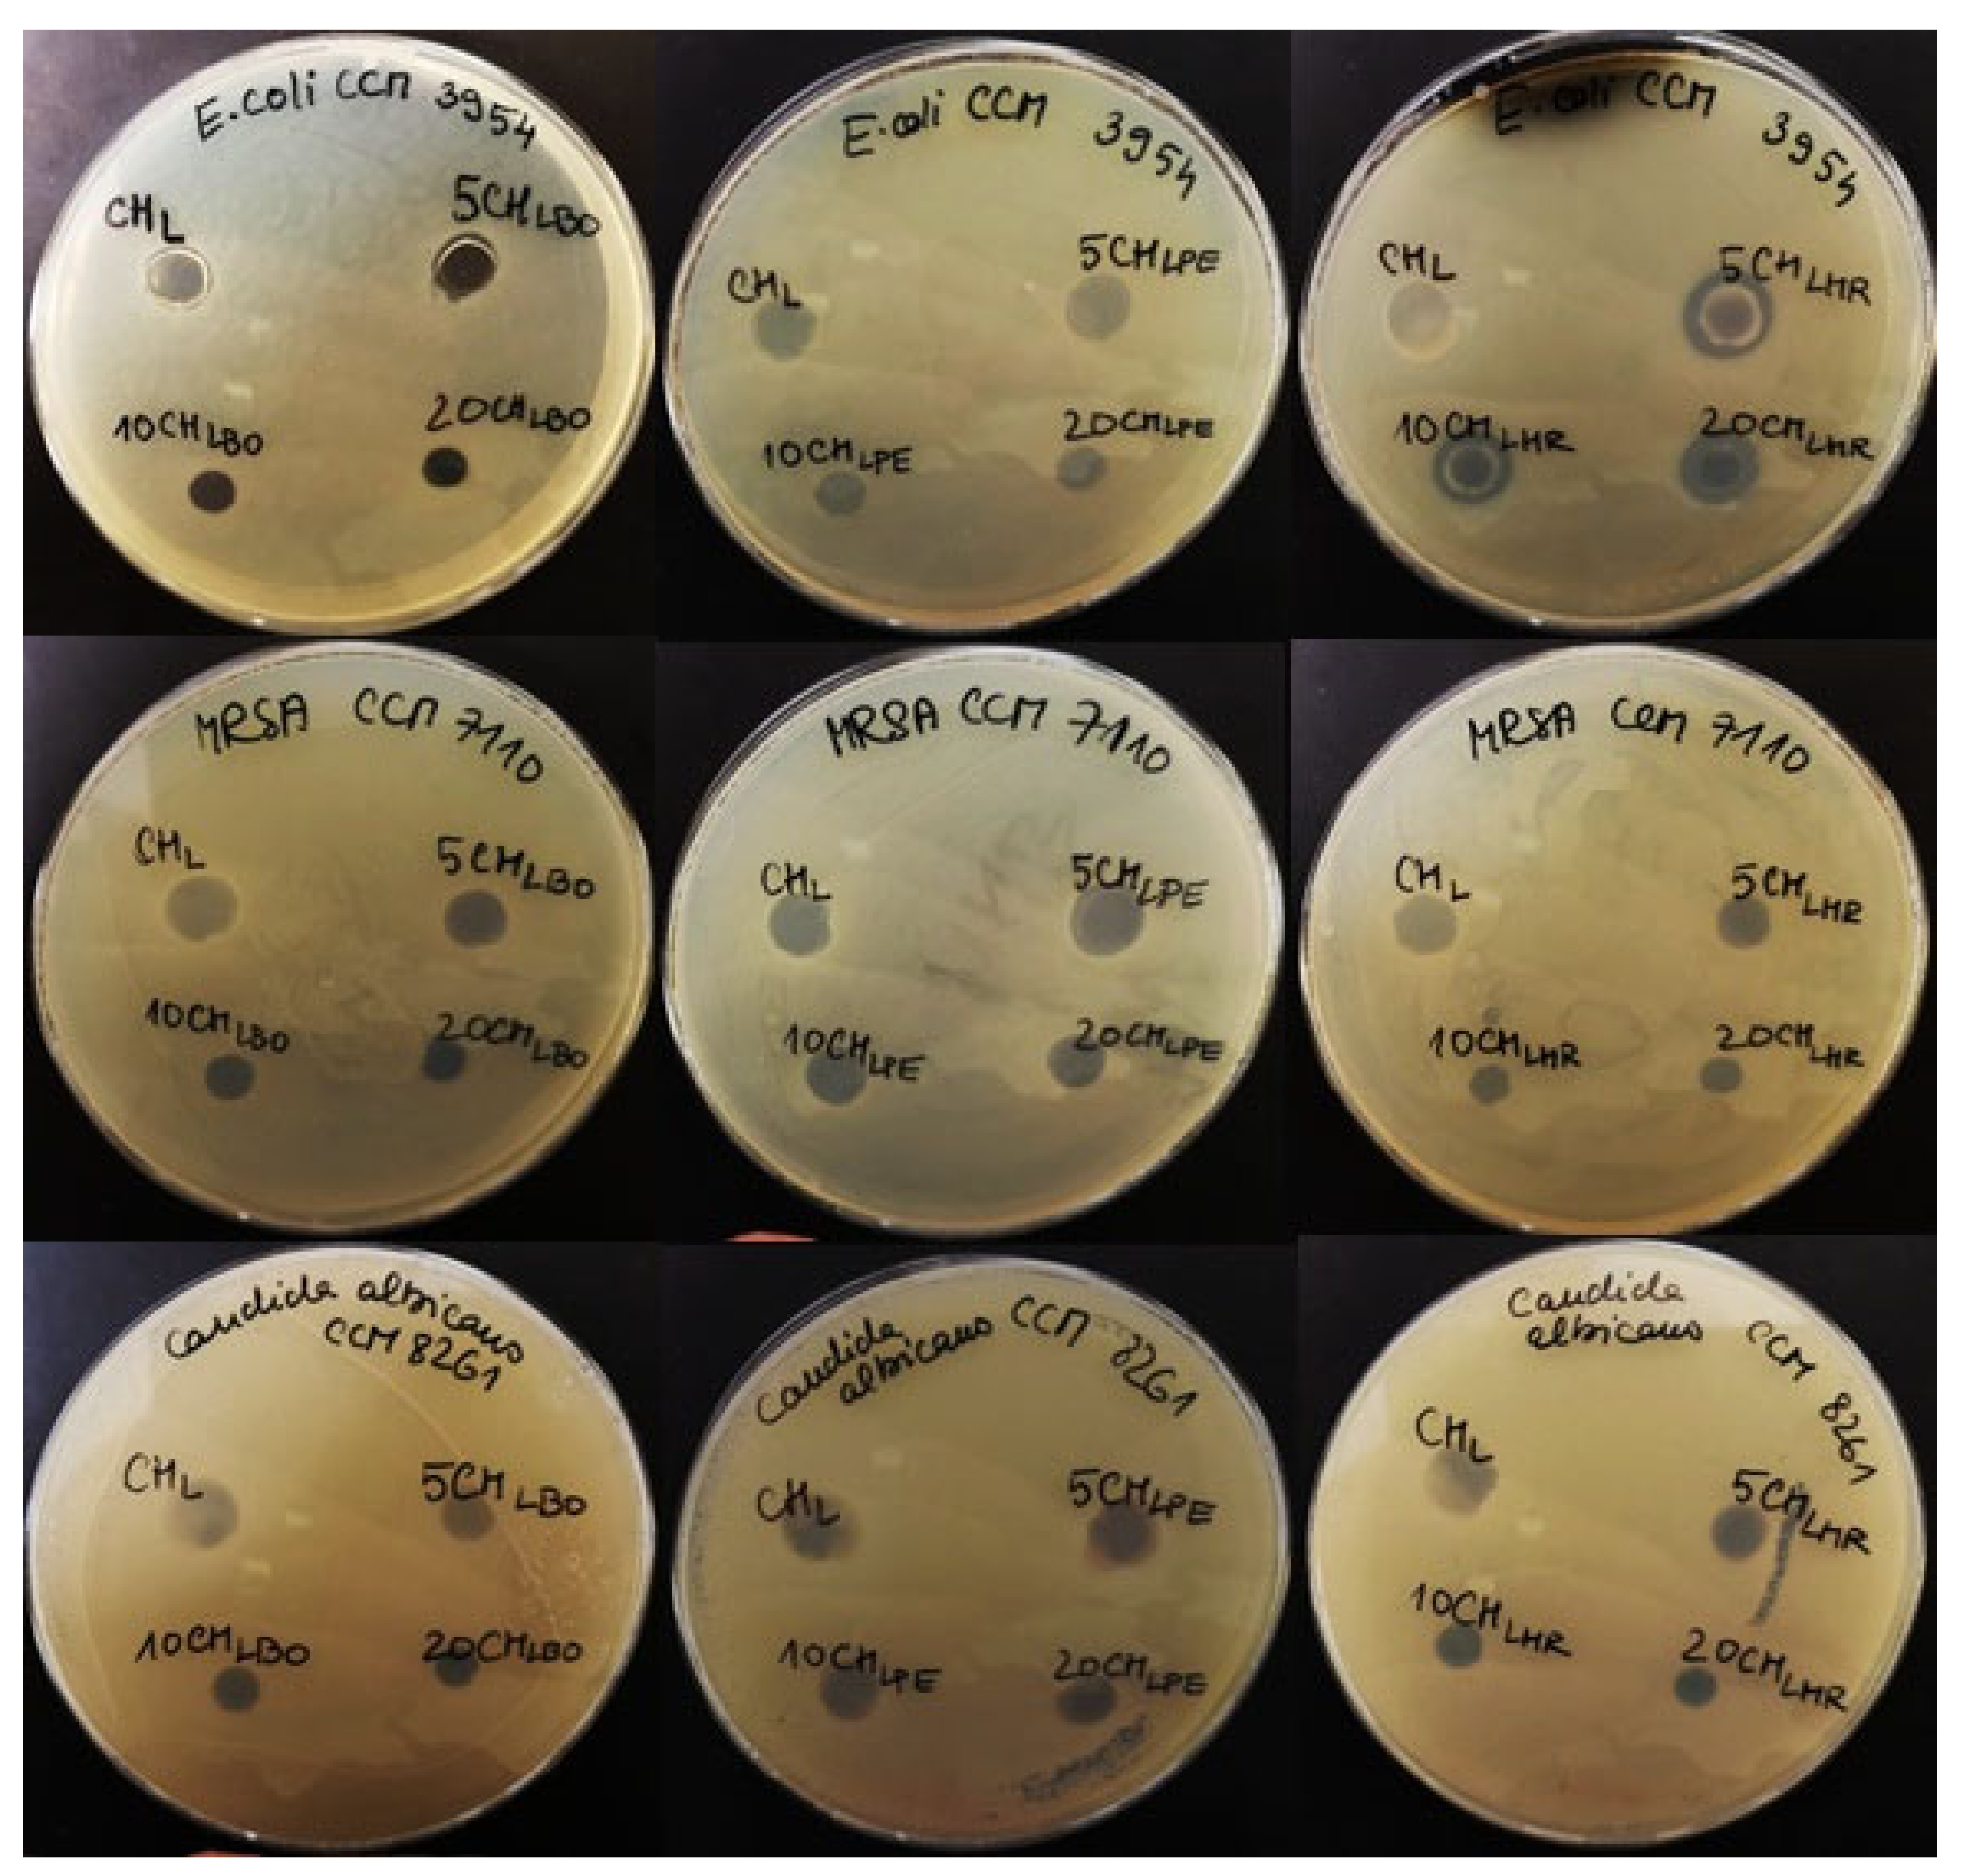
3.6. Antimicrobial Properties of Films
3.7. Release of the Active Components from the Films
4. Conclusions
Author Contributions
Funding
Institutional Review Board Statement
Informed Consent Statement
Data Availability Statement
Conflicts of Interest
References
- Salgado, P.R.; Ortiz, C.M.; Musso, Y.S.; Di Giorgio, L.; Mauri, A.N. Edible films and coatings containing bioactives. Curr. Opin. Food Sci. 2015, 5, 86–92. [Google Scholar] [CrossRef]
- Wang, Q.; Liu, W.; Tian, B.; Li, D.; Liu, C.; Jiang, B.; Feng, Z. Preparation and characterization of coating based on protein nanofibers and polyphenol and application for salted duck egg yolks. Foods 2020, 9, 449. [Google Scholar] [CrossRef] [PubMed] [Green Version]
- Balti, R.; Mansour, M.B.; Zayoud, N.; Le Balc’h, R.; Brodu, N.; Arhaliass, A.; Massé, A. Active exopolysaccharides based edible coatings enriched with red seaweed (Gracilaria gracilis) extract to improve shrimp preservation during refrigerated storage. Food Bioscience 2020, 34, 100522. [Google Scholar] [CrossRef]
- Hu, Y.; Shi, L.; Ren, Z.; Hao, G.; Chen, J.; Weng, W. Characterization of emulsion films prepared from soy protein isolate at different preheating temperatures. J. Food Eng. 2021, 309, 110697. [Google Scholar] [CrossRef]
- Kaczmarek, B.; Owczarek, A.; Nadolna, K.; Sionkowska, A. The film-forming properties of chitosan with tannic acid addition. Mater. Lett. 2019, 245, 22–24. [Google Scholar] [CrossRef]
- Kumar, M.N.R. A review of chitin and chitosan applications. React. Funct. Polym. 2000, 46, 1–27. [Google Scholar] [CrossRef]
- Hirano, S.; Gebelein, C.G.; Carraher, C.E., Jr. Industrial Biotechnological Polymers; Technomic: Lancaster, UK, 1995; Volume 189. [Google Scholar]
- Le, Y.; Anand, S.C.; Horrocks, A.R. Recent developments in fibres and materials for wound management. Indian J. Fibre Text. 1997, 22, 337–347. [Google Scholar]
- Nair, K.R.; Madhavan, P. Chitosan for removal of mercury from water. Fish. Technol. 1984, 21, 109–112. [Google Scholar]
- Ma, Q.; Ren, Y.; Gu, Z.; Wang, L. Developing an intelligent film containing Vitis amurensis husk extracts: The effects of pH value of the film-forming solution. J. Clean. Prod. 2017, 166, 851–859. [Google Scholar] [CrossRef]
- Vermeiren, L.; Devlieghere, F.; van Beest, M.; de Kruijf, N.; Debevere, J. Developments in the active packaging of foods. Trends Food Sci. Technol. 1999, 10, 77–86. [Google Scholar] [CrossRef]
- Espitia, P.J.P.; Du, W.X.; de Jesús Avena-Bustillos, R.; Soares, N.D.F.F.; McHugh, T.H. Edible films from pectin: Physical-mechanical and antimicrobial properties—A review. Food Hydrocoll. 2014, 35, 287–296. [Google Scholar] [CrossRef]
- Lalnunthari, C.; Devi, L.M.; Badwaik, L.S. Extraction of protein and pectin from pumpkin industry by-products and their utilization for developing edible film. J. Food Sci. Technol. 2019, 57, 1807–1816. [Google Scholar] [CrossRef]
- Tkaczewska, J.; Jamróz, E.; Kulawik, P.; Morawska, M.; Szczurowska, K. Evaluation of the potential use of a carp (Cyprinus carpio) skin gelatine hydrolysate as an antioxidant component. Food Funct. 2019, 10, 1038–1048. [Google Scholar] [CrossRef]
- Jancikova, S.; Jamróz, E.; Kulawik, P.; Tkaczewska, J.; Dordevic, D. Furcellaran/gelatin hydrolysate/rosemary extract composite films as active and intelligent packaging materials. Int. J. Biol. Macromol. 2019, 131, 19–28. [Google Scholar] [CrossRef] [PubMed]
- Torres-León, C.; Vicente, A.A.; Flores-López, M.L.; Rojas, R.; Serna-Cock, L.; Alvarez-Pérez, O.B.; Aguilar, C.N. Edible films and coatings based on mango (var. Ataulfo) by-products to improve gas transfer rate of peach. Lwt 2018, 97, 624–631. [Google Scholar] [CrossRef] [Green Version]
- Faria, A.; Oliveira, J.; Neves, P.; Gameiro, P.; Santos-Buelga, C.; de Freitas, V.; Mateus, N. Antioxidant properties of prepared blueberry (Vaccinium myrtillus) extracts. J. Agric. Food Chem. 2005, 53, 6896–6902. [Google Scholar] [CrossRef]
- Nakatani, N. Antioxidants from spices and herbs. In Natural Antioxidants: Chemistry, Health Effects, and Applications; AOCS Press: Urbana, IL, USA, 1997; pp. 64–75. [Google Scholar]
- Rodríguez-Díaz, R.C.; Aguilar-Caballos, M.P.; Gómez-Hens, A. Determination of some hydroxybenzoic acids and catechins in white wine samples by liquid chromatography with luminescence detection. J. Sep. Sci. 2006, 29, 2772–2779. [Google Scholar] [CrossRef] [PubMed]
- Downey, M.O.; Dokoozlian, N.K.; Krstic, M.P. Cultural practice and environmental impacts on the flavonoid composition of grapes and wine: A review of recent research. Am. J. Enol. Viticult. 2006, 57, 257–268. [Google Scholar]
- Charles, D.J. Parsley. In Handbook of Herbs and Spices; Woodhead Publishing: Sawston, UK, 2012; pp. 430–451. [Google Scholar]
- Hänsel, R.; Keller, K.; Rimpler, H.; Schneider, G. Hagers Handbuch Der Pharmazeutischen Praxis. 5. 6; Springer: Berlin, Germany, 1994; pp. 105–119. [Google Scholar]
- Tauferova, A.; Pospiech, M.; Javurkova, Z.; Tremlova, B.; Dordevic, D.; Jancikova, S.; Tesikova, K.; Zdarsky, M.; Vitez, T.; Vitezova, M. Plant Byproducts as Part of Edible Coatings: A Case Study with Parsley, Grape and Blueberry Pomace. Polymers 2021, 13, 2578. [Google Scholar] [CrossRef]
- Souza, V.G.L.; Fernando, A.L.; Pires, J.R.A.; Rodrigues, P.F.; Lopes, A.A.; Fernandes, F.M.B. Physical properties of chitosan films incorporated with natural antioxidants. Ind. Crop. Prod. 2017, 107, 565–572. [Google Scholar] [CrossRef]
- Mlynáriková, K.; Samek, O.; Bernatová, S.; Růžička, F.; Ježek, J.; Hároniková, A.; Šiler, M.; Zemánek, P.; Holá, V. Influence of culture media on microbial fingerprints using Raman spectroscopy. Sensors 2015, 15, 29635–29647. [Google Scholar] [CrossRef] [Green Version]
- Tomadoni, B.; Cassani, L.; Ponce, A.; Moreira, M.D.R.; Agüero, M.V. Optimization of ultrasound, vanillin and pomegranate extract treatment for shelf-stable unpasteurized strawberry juice. LWT-Food Sci. Technol. 2016, 72, 475–484. [Google Scholar] [CrossRef]
- Gómez-Estaca, J.; Bravo, L.; Gómez-Guillén, M.C.; Alemán, A.; Montero, P. Antioxidant properties of tuna-skin and bovine-hide gelatin films induced by the addition of oregano and rosemary extracts. Food Chem. 2009, 112, 18–25. [Google Scholar] [CrossRef] [Green Version]
- Behbahani, B.A.; Shahidi, F.; Yazdi, F.T.; Mortazavi, S.A.; Mohebbi, M. Use of Plantago major seed mucilage as a novel edible coating incorporated with Anethum graveolens essential oil on shelf life extension of beef in refrigerated storage. Int. J. Biol. Macromol. 2017, 94, 515–526. [Google Scholar] [CrossRef] [PubMed]
- Thaipong, K.; Boonprakob, U.; Crosby, K.; Cisneros-Zevallos, L.; Byrne, D.H. Comparison of ABTS, DPPH, FRAP, and ORAC assays for estimating antioxidant activity from guava fruit extracts. J. Food Compos. Anal. 2006, 19, 669–675. [Google Scholar] [CrossRef]
- Adilah, A.N.; Jamilah, B.; Noranizan, M.A.; Hanani, Z.N. Utilization of mango peel extracts on the biodegradable films for active packaging. Food Packag. Shelf Life 2018, 16, 1–7. [Google Scholar] [CrossRef]
- European Commission. Commission Regulation (EU) No 10/2011 of 14 January 2011 on plastic materials and articles intended to come into contact with food. Off. J. Eur. Union 2011, 12, 1–89. [Google Scholar]
- Cheung, R.C.F.; Ng, T.B.; Wong, J.H.; Chan, W.Y. Chitosan: An update on potential biomedical and pharmaceutical applications. Mar. Drugs 2015, 13, 5156–5186. [Google Scholar] [CrossRef]
- Larsson, M.; Hill, A.; Duffy, J. Suspension stability; why particle size, zeta potential and rheology are important. Ann. Trans. Nord. Rheol. Soc. 2012, 20, 209–214. [Google Scholar]
- Kanmani, P.; Rhim, J.W. Antimicrobial and physical-mechanical properties of agar-based films incorporated with grapefruit seed extract. Carbohyd. Polym. 2014, 102, 708–716. [Google Scholar] [CrossRef]
- Kanatt, S.R.; Rao, M.S.; Chawla, S.P.; Sharma, A. Active chitosan–polyvinyl alcohol films with natural extracts. Food Hydrocoll. 2012, 29, 290–297. [Google Scholar] [CrossRef]
- Jridi, M.; Boughriba, S.; Abdelhedi, O.; Nciri, H.; Nasri, R.; Kchaou, H.; Kaya, M.; Sebai, H.; Zouari, N.; Nasri, M. Investigation of physicochemical and antioxidant properties of gelatin edible film mixed with blood orange (Citrus sinensis) peel extract. Food Packag. Shelf Life 2019, 21, 100342. [Google Scholar] [CrossRef]
- Park, S.K.; Rhee, C.O.; Bae, D.H.; Hettiarachchy, N.S. Mechanical properties and water-vapor permeability of soy-protein films affected by calcium salts and glucono-δ-lactone. J. Agric. Food Chem. 2001, 49, 2308–2312. [Google Scholar] [CrossRef]
- Siripatrawan, U.; Vitchayakitti, W. Improving functional properties of chitosan films as active food packaging by incorporating with propolis. Food Hydrocoll. 2016, 61, 695–702. [Google Scholar] [CrossRef]
- Kalaycıoğlu, Z.; Torlak, E.; Akın-Evingür, G.; Özen, İ.; Erim, F.B. Antimicrobial and physical properties of chitosan films incorporated with turmeric extract. Int. J. Biol. Macromol. 2017, 101, 882–888. [Google Scholar] [CrossRef] [PubMed]
- Jancikova, S.; Dordevic, D.; Jamroz, E.; Behalova, H.; Tremlova, B. Chemical and Physical Characteristics of Edible Films, Based on κ-and ι-Carrageenans with the Addition of Lapacho Tea Extract. Foods 2020, 9, 357. [Google Scholar] [CrossRef] [Green Version]
- Kittur, F.; Kumar, K.; Tharanathan, R. Functional packaging properties of chitosan films. Z. Lebensm. Unters. Forsch. 1998, 206, 44–47. [Google Scholar] [CrossRef]
- Kołodziejska, I.; Piotrowska, B. The water vapour permeability, mechanical properties and solubility of fish gelatin–chitosan films modified with transglutaminase or 1-ethyl-3-(3-dimethylaminopropyl) carbodiimide (EDC) and plasticized with glycerol. Food Chem. 2007, 103, 295–300. [Google Scholar] [CrossRef]
- Cazón, P.; Vázquez, M.; Velazquez, G. Novel composite films based on cellulose reinforced with chitosan and polyvinyl alcohol: Effect on mechanical properties and water vapour permeability. Polym. Test. 2018, 69, 536–544. [Google Scholar] [CrossRef]
- Bedane, A.H.; Eić, M.; Farmahini-Farahani, M.; Xiao, H. Water vapor transport properties of regenerated cellulose and nanofibrillated cellulose films. J. Membr. Sci. 2015, 493, 46–57. [Google Scholar] [CrossRef]
- Robertson, G.L. Food Packaging: Principles and Practice, 3rd ed.; CRC Press: Boca Raton, FL, USA, 2012. [Google Scholar]
- Rambabu, K.; Bharath, G.; Banat, F.; Show, P.L.; Cocoletzi, H.H. Mango leaf extract incorporated chitosan antioxidant film for active food packaging. Int. J. Biol. Macromol. 2019, 126, 1234–1243. [Google Scholar]
- Srinivasa, P.C.; Ramesh, M.N.; Tharanathan, R.N. Effect of plasticizers and fatty acids on mechanical and permeability characteristics of chitosan films. Food Hydrocoll. 2007, 21, 1113–1122. [Google Scholar] [CrossRef]
- Reyes-Chaparro, P.; Gutierrez-Mendez, N.; Salas-Muñoz, E.; Ayala-Soto, J.G.; Chavez-Flores, D.; Hernández-Ochoa, L. Effect of the addition of essential oils and functional extracts of clove on physicochemical properties of chitosan-based films. Int. J. Polym. Sci. 2015, 2015, 714254. [Google Scholar] [CrossRef] [Green Version]
- Elsabee, M.Z.; Abdou, E.S. Chitosan based edible films and coatings: A review. Mater. Sci. Eng. C 2013, 33, 1819–1841. [Google Scholar] [CrossRef]
- Rhim, J.-W. Increase in water vapor barrier property of biopolymer-based edible films and coatings by compositing with lipid materials. Food Sci. Biotechnol. 2004, 13, 528–535. [Google Scholar]
- Wang, L.; Wang, Q.; Tong, J.; Zhou, J. Physicochemical properties of chitosan films incorporated with honeysuckle flower extract for active food packaging. J. Food Process Eng. 2017, 40, e12305. [Google Scholar] [CrossRef] [Green Version]
- Ojagh, S.M.; Rezaei, M.; Razavi, S.H.; Hosseini, S.M.H. Development and evaluation of a novel biodegradable film made from chitosan and cinnamon essential oil with low affinity toward water. Food Chem. 2010, 122, 161–166. [Google Scholar] [CrossRef]
- Bourbon, A.I.; Pinheiro, A.C.; Cerqueira, M.A.; Rocha, C.M.; Avides, M.C.; Quintas, M.A.; Vicente, A.A. Physico-chemical characterization of chitosan-based edible films incorporating bioactive compounds of different molecular weight. J. Food Eng. 2011, 106, 111–118. [Google Scholar] [CrossRef] [Green Version]
- Favaro, L.I.; Balcão, V.M.; Rocha, L.K.; Silva, E.C.; Oliveira, J.M., Jr.; Vila, M.M.; Tubino, M. Physicochemical characterization of a crude anthocyanin extract from the fruits of Jussara (Euterpe edulis Martius): Potential for food and pharmaceutical applications. J. Brazil. Chem. Soc. 2018, 29, 2072–2088. [Google Scholar] [CrossRef]
- Morar, M.I.; Fetea, F.; Rotar, A.M.; Nagy, M.; Semeniuc, C.A. Characterization of essential oils extracted from different aromatic plants by FTIR spectroscopy. Bull. Univ. Agric. Sci. Vet. Med. Cluj Napoca. Food Sci. Technol. 2017, 74, 37–39. [Google Scholar] [CrossRef] [Green Version]
- Ertani, A.; Pizzeghello, D.; Francioso, O.; Sambo, P.; Sanchez-Cortes, S.; Nardi, S. Capsicum chinensis L. growth and nutraceutical properties are enhanced by biostimulants in a long-term period: Chemical and metabolomic approaches. Front. Plant Sci. 2014, 5, 375. [Google Scholar] [CrossRef] [PubMed] [Green Version]
- Bors, W.; Michel, C.; Stettmaier, K. Structure-activity relationships governing antioxidant capacities of plant polyphenols. In Methods in Enzymology; Academic Press: Cambridge, MA, USA, 2001; Volume 335, pp. 166–180. [Google Scholar]
- Siripatrawan, U.; Harte, B.R. Physical properties and antioxidant activity of an active film from chitosan incorporated with green tea extract. Food Hydrocoll. 2010, 24, 770–775. [Google Scholar] [CrossRef]
- Moradi, M.; Tajik, H.; Rohani, S.M.R.; Oromiehie, A.R.; Malekinejad, H.; Aliakbarlu, J.; Hadian, M. Characterization of antioxidant chitosan film incorporated with Zataria multiflora Boiss essential oil and grape seed extract. LWT-Food Sci. Technol. 2012, 46, 477–484. [Google Scholar] [CrossRef]
- Ruiz-Navajas, Y.; Viuda-Martos, M.; Sendra, E.; Perez-Alvarez, J.A.; Fernández-López, J. In vitro antibacterial and antioxidant properties of chitosan edible films incorporated with Thymus moroderi or Thymus piperella essential oils. Food Control 2013, 30, 386–392. [Google Scholar] [CrossRef]
- Saberi, B.; Vuong, Q.V.; Chockchaisawasdee, S.; Golding, J.B.; Scarlett, C.J.; Stathopoulos, C.E. Physical, barrier, and antioxidant properties of pea starch-guar gum biocomposite edible films by incorporation of natural plant extracts. Food Bioprocess Technol. 2017, 10, 2240–2250. [Google Scholar] [CrossRef] [Green Version]
- Lapornik, B.; Prošek, M.; Wondra, A.G. Comparison of extracts prepared from plant by-products using different solvents and extraction time. J. Food Eng. 2005, 71, 214–222. [Google Scholar] [CrossRef]
- Crozier, A.; Yokota, T.; Jaganath, I.B.; Marks, S.; Saltmarsh, M.; Clifford, M.N. Secondary metabolites in fruits, vegetables, beverages and other plant based dietary components. In Plant Secondary Metabolites: Occurrence, Structure and Role in the Human Diet; Blackwell Publishing: Hoboken, NJ, USA, 2006; pp. 208–302. [Google Scholar]
- Kim, K.W.; Thomas, R.L. Antioxidative activity of chitosans with varying molecular weights. Food Chem. 2007, 101, 308–313. [Google Scholar] [CrossRef]
- Xie, W.; Xu, P.; Liu, Q. Antioxidant activity of water-soluble chitosan derivatives. Bioorg. Med. Chem. Lett. 2001, 11, 1699–1701. [Google Scholar] [CrossRef]
- Negro, C.; Tommasi, L.; Miceli, A. Phenolic compounds and antioxidant activity from red grape marc extracts. Bioresour. Technol. 2003, 87, 41–44. [Google Scholar] [CrossRef]
- Wong, P.Y.; Kitts, D.D. Studies on the dual antioxidant and antibacterial properties of parsley (Petroselinum crispum) and cilantro (Coriandrum sativum) extracts. Food Chem. 2006, 97, 505–515. [Google Scholar] [CrossRef]
- Katalinić, V.; Možina, S.S.; Skroza, D.; Generalić, I.; Abramovič, H.; Miloš, M.; Ljubenkov, I.; Piskernik, S.; Pezo, I.; Terpinc, P.; et al. Polyphenolic profile, antioxidant properties and antimicrobial activity of grape skin extracts of 14 Vitis vinifera varieties grown in Dalmatia (Croatia). Food Chem. 2010, 119, 715–723. [Google Scholar] [CrossRef]
- Baydar, N.G.; Özkan, G.; Sağdiç, O. Total phenolic contents and antibacterial activities of grape (Vitis vinifera L.) extracts. Food Control 2004, 15, 335–339. [Google Scholar] [CrossRef]
- Farag, R.S.; Daw, Z.Y.; Abo-Raya, S.H. Influence of some spice essential oils on Aspergillus parasiticus growth and production of aflatoxins in a synthetic medium. J. Food Sci. 1989, 54, 74–76. [Google Scholar] [CrossRef]
- Arvanitoyannis, I.S.; Bosnea, L. Migration of substances from food packaging materials to foods. Crc Rev. Food Sci. 2004, 44, 63–76. [Google Scholar] [CrossRef]
- Alam, M.N.; Bristi, N.J.; Rafiquzzaman, M. Review on in vivo and in vitro methods evaluation of antioxidant activity. Saudi Pharm. J. 2013, 21, 143–152. [Google Scholar] [CrossRef] [PubMed] [Green Version]
- Stratil, P.; Klejdus, B.; Kubáň, V. Determination of phenolic compounds and their antioxidant activity in fruits and cereals. Talanta 2007, 71, 1741–1751. [Google Scholar] [CrossRef] [PubMed]

| Sample | Composition |
|---|---|
| CHL | 1.5 g chitosan + 1% lactic acid + glycerol |
| 5CHLBO | 1.5 g chitosan + 1% lactic acid + 5% blueberry extract + glycerol |
| 10CHLBO | 1.5 g chitosan + 1% lactic acid + 10% blueberry extract + glycerol |
| 20CHLBO | 1.5 g chitosan + 1% lactic acid + 20% blueberry extract + glycerol |
| 5CHLPE | 1.5 g chitosan + 1% lactic acid + 5% parsley extract + glycerol |
| 10CHLPE | 1.5 g chitosan + 1% lactic acid + 10% parsley extract + glycerol |
| 20CHLPE | 1.5 g chitosan + 1% lactic acid + 20% parsley extract + glycerol |
| 5CHLHR | 1.5 g chitosan + 1% lactic acid + 5% red grapes extract + glycerol |
| 10CHLHR | 1.5 g chitosan + 1% lactic acid + 10% red grapes extract + glycerol |
| 20CHLHR | 1.5 g chitosan + 1% lactic acid + 20% red grapes extract + glycerol |
| Sample | Zeta Potential (mV) | Conductivity (mS/cm) |
|---|---|---|
| CHL | 33.84 ± 0.72 | 2.008 ± 0.005 ac |
| 5CHLBO | 34.58 ± 2.14 ac | 1.980 ± 0.020 c |
| 10CHLBO | 32.26 ± 1.07 abe | 1.808 ± 0.008 b |
| 20CHLBO | 31.44 ± 1.36 abe | 1.922 ± 0.008 d |
| 5CHLPE | 34.52 ± 1.36 acd | 2.050 ± 0.001 ef |
| 10CHLPE | 30.62 ± 2.09 be | 2.000 ± 0.007 ac |
| 20CHLPE | 36.68 ± 0.32 c | 2.084 ± 0.006 g |
| 5CHLHR | 31.98 ± 1.83 abe | 1.920 ± 0.008 d |
| 10CHLHR | 32.22 ± 2.02 abe | 1.996 ± 0.011 ac |
| 20CHLHR | 31.30 ± 2.32 de | 2.029 ± 0.022 af |
| Sample | Thickness (mm) |
|---|---|
| CHL | 0.174 ± 0.013 |
| 5CHLBO | 0.176 ± 0.046 |
| 10CHLBO | 0.172 ± 0.040 |
| 20CHLBO | 0.214 ± 0.022 |
| 5CHLPE | 0.196 ± 0.030 |
| 10CHLPE | 0.188 ± 0.019 |
| 20CHLPE | 0.180 ± 0.017 |
| 5CHLHR | 0.206 ± 0.055 |
| 10CHLHR | 0.186 ± 0.019 |
| 20CHLHR | 0.210 ± 0.029 |
| Sample | Strength (MPa) | Breaking Strain (%) |
|---|---|---|
| CHL | 0.06 ± 0.04 | 122.34 ± 11.89 acd |
| 5CHLBO | 0.04 ± 0.01 a | 116.01 ± 15.25 ad |
| 10CHLBO | 0.09 ± 0.03 | 107.72 ± 9.89 a |
| 20CHLBO | 0.06 ± 0.01 | 102.08 ± 7.26 a |
| 5CHLPE | 0.04 ± 0.01 a | 136.67 ± 18.18 |
| 10CHLPE | 0.08 ± 0.03 | 113.60 ± 30.36 |
| 20CHLPE | 0.10 ± 0.02 b | 149.16 ± 3.54 ce |
| 5CHLHR | 0.04 ± 0.01 a | 142.99 ± 13.18 def |
| 10CHLHR | 0.05 ± 0.01 a | 182.41 ± 17.94 be |
| 20CHLHR | 0.09 ± 0.04 | 118.10 ± 9.80 af |
| Sample | Water Vapor Permeability (23 °C, 85 % RH) (g/m2 d) | Oxygen Transmission Rate (23 °C, 0 % RH) (mL/m2 d 0.1 MPa) |
|---|---|---|
| CHL | 1235.8 ± 42.1 a | 15.1 ± 0.8 |
| 5CHLBO | 1270.0 ± 25.3 a | 11.4 ± 1.1 |
| 10CHLBO | 1327.4 ± 57.6 ac | 8.7 ± 0.7 |
| 20CHLBO | 1485.1 ± 72.8 de | 4.1 ± 1.0 |
| 5CHLPE | 1356.2 ± 37.6 acde | 12.6 ± 0.5 |
| 10CHLPE | 1467.3 ± 50.9 e | 9.8 ± 1.3 |
| 20CHLPE | 1719.4 ± 22.3 b | 6.5 ± 0.5 |
| 5CHLHR | 1318.8 ± 66.3 ac | 13.7 ± 1.4 |
| 10CHLHR | 1422.4 ± 47.0 cde | 10.3 ± 0.4 |
| 20CHLHR | 1724.6 ± 30.8 b | 5.2 ± 0.9 |
| Sample | Water Content (%) | Solubility (%) | Swelling Degree (%) |
|---|---|---|---|
| CHL | 17.11 ± 1.59 a | 48.02 ± 5.00 | 287.60 ± 77.36 |
| 5CHLBO | 14.50 ± 2.80 | 46.90 ± 1.50 | 122.26 ± 26.72 acd |
| 10CHLBO | 13.55 ± 0.57 bc | 45.12 ± 1.52 a | 93.23 ± 6.39 af |
| 20CHLBO | 17.84 ± 1.95 a | 45.49 ± 2.21 | 74.28 ± 21.55 agf |
| 5CHLPE | 13.83 ± 0.95 bc | 45.49 ± 2.21 | 151.91 ± 20.18 d |
| 10CHLPE | 14.83 ± 0.83 ac | 49.59 ± 4.58 ac | 150.53 ± 18.23 cd |
| 20CHLPE | 12.73 ± 0.38 b | 46.06 ± 0.80 b | 118.28 ± 21.99 fcd |
| 5CHLHR | 15.76 ± 0.48 a | 49.77 ± 1.67 | 108.56 ± 19.01 fcde |
| 10CHLHR | 15.45 ± 0.96 ac | 49.79 ± 2.96 bc | 69.91 ± 13.74 eag |
| 20CHLHR | 15.56 ± 2.21 | 45.87 ± 1.65 ac | 43.99 ± 7.12 g |
| Sample | TPC (mg Gallic Acid/g) |
|---|---|
| CHL | 0.12 ± 0.01 a |
| 5CHLBO | 0.47 ± 0.00 b |
| 10CHLBO | 0.49 ± 0.00 b |
| 20CHLBO | 0.85 ± 0.00 cf |
| 5CHLPE | 0.09 ± 0.00 a |
| 10CHLPE | 0.32 ± 0.07 abde |
| 20CHLPE | 0.47 ± 0.02 bd |
| 5CHLHR | 0.43 ± 0.00 d |
| 10CHLHR | 0.72 ± 0.00 eg |
| 20CHLHR | 0.96 ± 0.05 fg |
| Sample | Rosmarinic Acid (µg/g) | Chlorogenic Acid (µg/g) | Epigallocatechin (mg/g) |
|---|---|---|---|
| CHL | 6.17 ± 0.13 a | 0.00 ± 0.00 ad | 0.00 ± 0.00 |
| 5CHLBO | 4.52 ± 0.20 b | 14.62 ± 0.85 b | 0.49 ± 0.43 ca |
| 10CHLBO | 4.85 ± 0.28 b | 21.04 ± 0.41 e | 1.22 ± 0.01 dc |
| 20CHLBO | 8.56 ± 0.16 c | 78.09 ± 6.12 f | 3.12 ± 0.01 e |
| 5CHLPE | 7.76 ± 0.12 d | 0.00 ± 0.00 d | 0.00 ± 0.00 |
| 10CHLPE | 11.15 ± 0.05 e | 6.62 ± 0.39 c | 2.68 ± 0.46 ged |
| 20CHLPE | 20.63 ± 0.90 f | 5.14 ± 4.76 bcde | 2.33 ± 1.13 |
| 5CHLHR | 4.16 ± 0.63 ab | 0.00 ± 0.00 d | 0.00 ± 0.00 ba |
| 10CHLHR | 3.64 ± 0.57 ab | 0.00 ± 0.00 d | 0.00 ± 0.00 ba |
| 20CHLHR | 6.97 ± 3.60 abcde | 0.00 ± 0.00 d | 1.31 ± 0.16 hcg |
| Sample | Epicatechin Gallate (mg/g) | Epicatechin (mg/g) |
|---|---|---|
| CHL | 0.00 ± 0.00 | 0.00 ± 0.00 |
| 5CHLBO | 0.00 ± 0.00 | 8.02 ± 0.19 a |
| 10CHLBO | 3.02 ± 0.36 a | 12.94 ± 0.18 b |
| 20CHLBO | 5.18 ± 0.03 c | 24.75 ± 0.02 c |
| 5CHLPE | 0.00 ± 0.00 | 0.00 ± 0.00 |
| 10CHLPE | 165.46 ± 1.29 d | 1.47 ± 0.04 d |
| 20CHLPE | 182.78 ± 4.50 d | 2.74 ± 0.06 e |
| 5CHLHR | 3.09 ± 0.11 a | 4.62 ± 0.07 f |
| 10CHLHR | 4.62 ± 0.76 bac | 4.68 ± 0.47 ef |
| 20CHLHR | 76.47 ± 0.69 e | 9.70 ± 0.22 g |
| Sample | FRAP (μmol Trolox/g) | ABTS (%) | DPPH (%) |
|---|---|---|---|
| CHL | 0.12 ± 0.07 a | 0.09 ± 0.02 a | 1.03 ± 0.07 ai |
| 5CHLBO | 0.50 ± 0.02 b | 0.48 ± 0.12 ae | 2.16 ± 0.05 ln |
| 10CHLBO | 1.15 ± 0.01 cf | 0.71 ± 0.07 e | 2.75 ± 0.01 mo |
| 20CHLBO | 2.45 ± 0.06 d | 0.76 ± 0.08 e | 5.39 ± 0.06 e |
| 5CHLPE | 0.92 ± 0.08 cf | 0.95 ± 0.04 e | 1.17 ± 0.56 abcdflop |
| 10CHLPE | 1.06 ± 0.37 bcf | 1.02 ± 0.13 de | 1.89 ± 0.63 |
| 20CHLPE | 1.23 ± 0.08 cf | 1.47 ± 0.02 cd | 2.48 ± 3.43 fhr |
| 5CHLHR | 1.02 ± 0.04 c | 2.29 ± 0.08 b | 1.18 ± 0.32 inopr |
| 10CHLHR | 1.26 ± 0.04 f | 3.35 ± 0.18 f | 1.64 ± 0.03 bgp |
| 20CHLHR | 1.89 ± 0.04 e | 4.23 ± 0.27 g | 2.03 ± 0.86 fhjlm |
| Sample | TPC (mg Gallic Acid/mL) | TPC (mg Gallic Acid/g) |
|---|---|---|
| CHL | 0.002 ± 0.000 a | 0.12 ± 0.01 a |
| 5CHLBO | 0.005 ± 0.000 c | 0.47 ± 0.00 b |
| 10CHLBO | 0.008 ± 0.000 d | 0.49 ± 0.00 b |
| 20CHLBO | 0.010 ± 0.000 e | 0.85 ± 0.00 cf |
| 5CHLPE | 0.004 ± 0.000 b | 0.09 ± 0.00 a |
| 10CHLPE | 0.010 ± 0.000 f | 0.32 ± 0.07 abde |
| 20CHLPE | 0.011 ± 0.000 g | 0.47 ± 0.02 bd |
| 5CHLHR | 0.011 ± 0.000 e | 0.43 ± 0.00 d |
| 10CHLHR | 0.012 ± 0.000 g | 0.72 ± 0.00 eg |
| 20CHLHR | 0.016 ± 0.000 h | 0.96 ± 0.05 fg |
| Sample | FRAP (μmol Trolox/mL) | ABTS (%) | DPPH (%) |
|---|---|---|---|
| CHL | 0.0112 ± 0.0004 a | 2.60 ± 0.40 a | 34.22 ± 1.25 a |
| 5CHLBO | 0.0111 ± 0.0002 a | 2.70 ± 0.04 c | 51.62 ± 3.00 cadg |
| 10CHLBO | 0.0137 ± 0.0005 c | 3.10 ± 0.08 d | 54.95 ± 0.50 d |
| 20CHLBO | 0.0210 ± 0.0002 d | 3.81 ± 0.19 e | 70.07 ± 0.97 b |
| 5CHLPE | 0.0163 ± 0.0002 e | 3.73 ± 0.04 e | 34.45 ± 2.56 ead |
| 10CHLPE | 0.0152 ± 0.0002 b | 4.86 ± 0.05 b | 53.33 ± 0.34 fcd |
| 20CHLPE | 0.0170 ± 0.0001 e | 4.94 ± 0.05 b | 58.75 ± 0.06 g |
| 5CHLHR | 0.0153 ± 0.0005 b | 2.67 ± 0.08 c | 41.48 ± 3.00 acd |
| 10CHLHR | 0.0129 ± 0.0005 cb | 3.24 ± 0.08 d | 52.00 ± 7.60 |
| 20CHLHR | 0.0248 ± 0.0004 f | 4.35 ± 0.05 f | 53.15 ± 3.64 gcdb |
Publisher’s Note: MDPI stays neutral with regard to jurisdictional claims in published maps and institutional affiliations. |
© 2021 by the authors. Licensee MDPI, Basel, Switzerland. This article is an open access article distributed under the terms and conditions of the Creative Commons Attribution (CC BY) license (https://creativecommons.org/licenses/by/4.0/).
Share and Cite
Dordevic, S.; Dordevic, D.; Sedlacek, P.; Kalina, M.; Tesikova, K.; Antonic, B.; Tremlova, B.; Treml, J.; Nejezchlebova, M.; Vapenka, L.; et al. Incorporation of Natural Blueberry, Red Grapes and Parsley Extract By-Products into the Production of Chitosan Edible Films. Polymers 2021, 13, 3388. https://doi.org/10.3390/polym13193388
Dordevic S, Dordevic D, Sedlacek P, Kalina M, Tesikova K, Antonic B, Tremlova B, Treml J, Nejezchlebova M, Vapenka L, et al. Incorporation of Natural Blueberry, Red Grapes and Parsley Extract By-Products into the Production of Chitosan Edible Films. Polymers. 2021; 13(19):3388. https://doi.org/10.3390/polym13193388
Chicago/Turabian StyleDordevic, Simona, Dani Dordevic, Petr Sedlacek, Michal Kalina, Karolina Tesikova, Bojan Antonic, Bohuslava Tremlova, Jakub Treml, Marcela Nejezchlebova, Lukas Vapenka, and et al. 2021. "Incorporation of Natural Blueberry, Red Grapes and Parsley Extract By-Products into the Production of Chitosan Edible Films" Polymers 13, no. 19: 3388. https://doi.org/10.3390/polym13193388
APA StyleDordevic, S., Dordevic, D., Sedlacek, P., Kalina, M., Tesikova, K., Antonic, B., Tremlova, B., Treml, J., Nejezchlebova, M., Vapenka, L., Rajchl, A., & Bulakova, M. (2021). Incorporation of Natural Blueberry, Red Grapes and Parsley Extract By-Products into the Production of Chitosan Edible Films. Polymers, 13(19), 3388. https://doi.org/10.3390/polym13193388