
Low-Velocity Impact Analysis of Pineapple Leaf Fiber (PALF) Hybrid Composites

 ,
,  , ,
, ,  ,
,  and
and
Abstract
:
1. Introduction
2. Materials and Methods
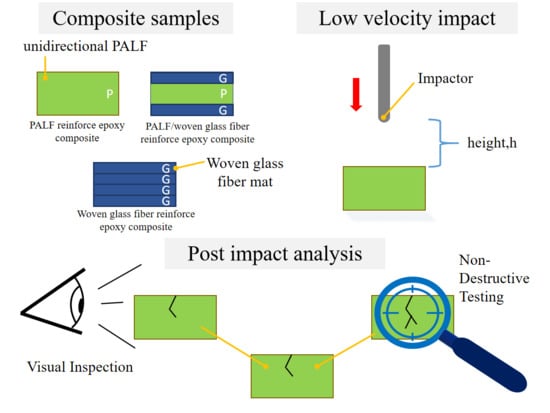
2.1. Preparation of Materials
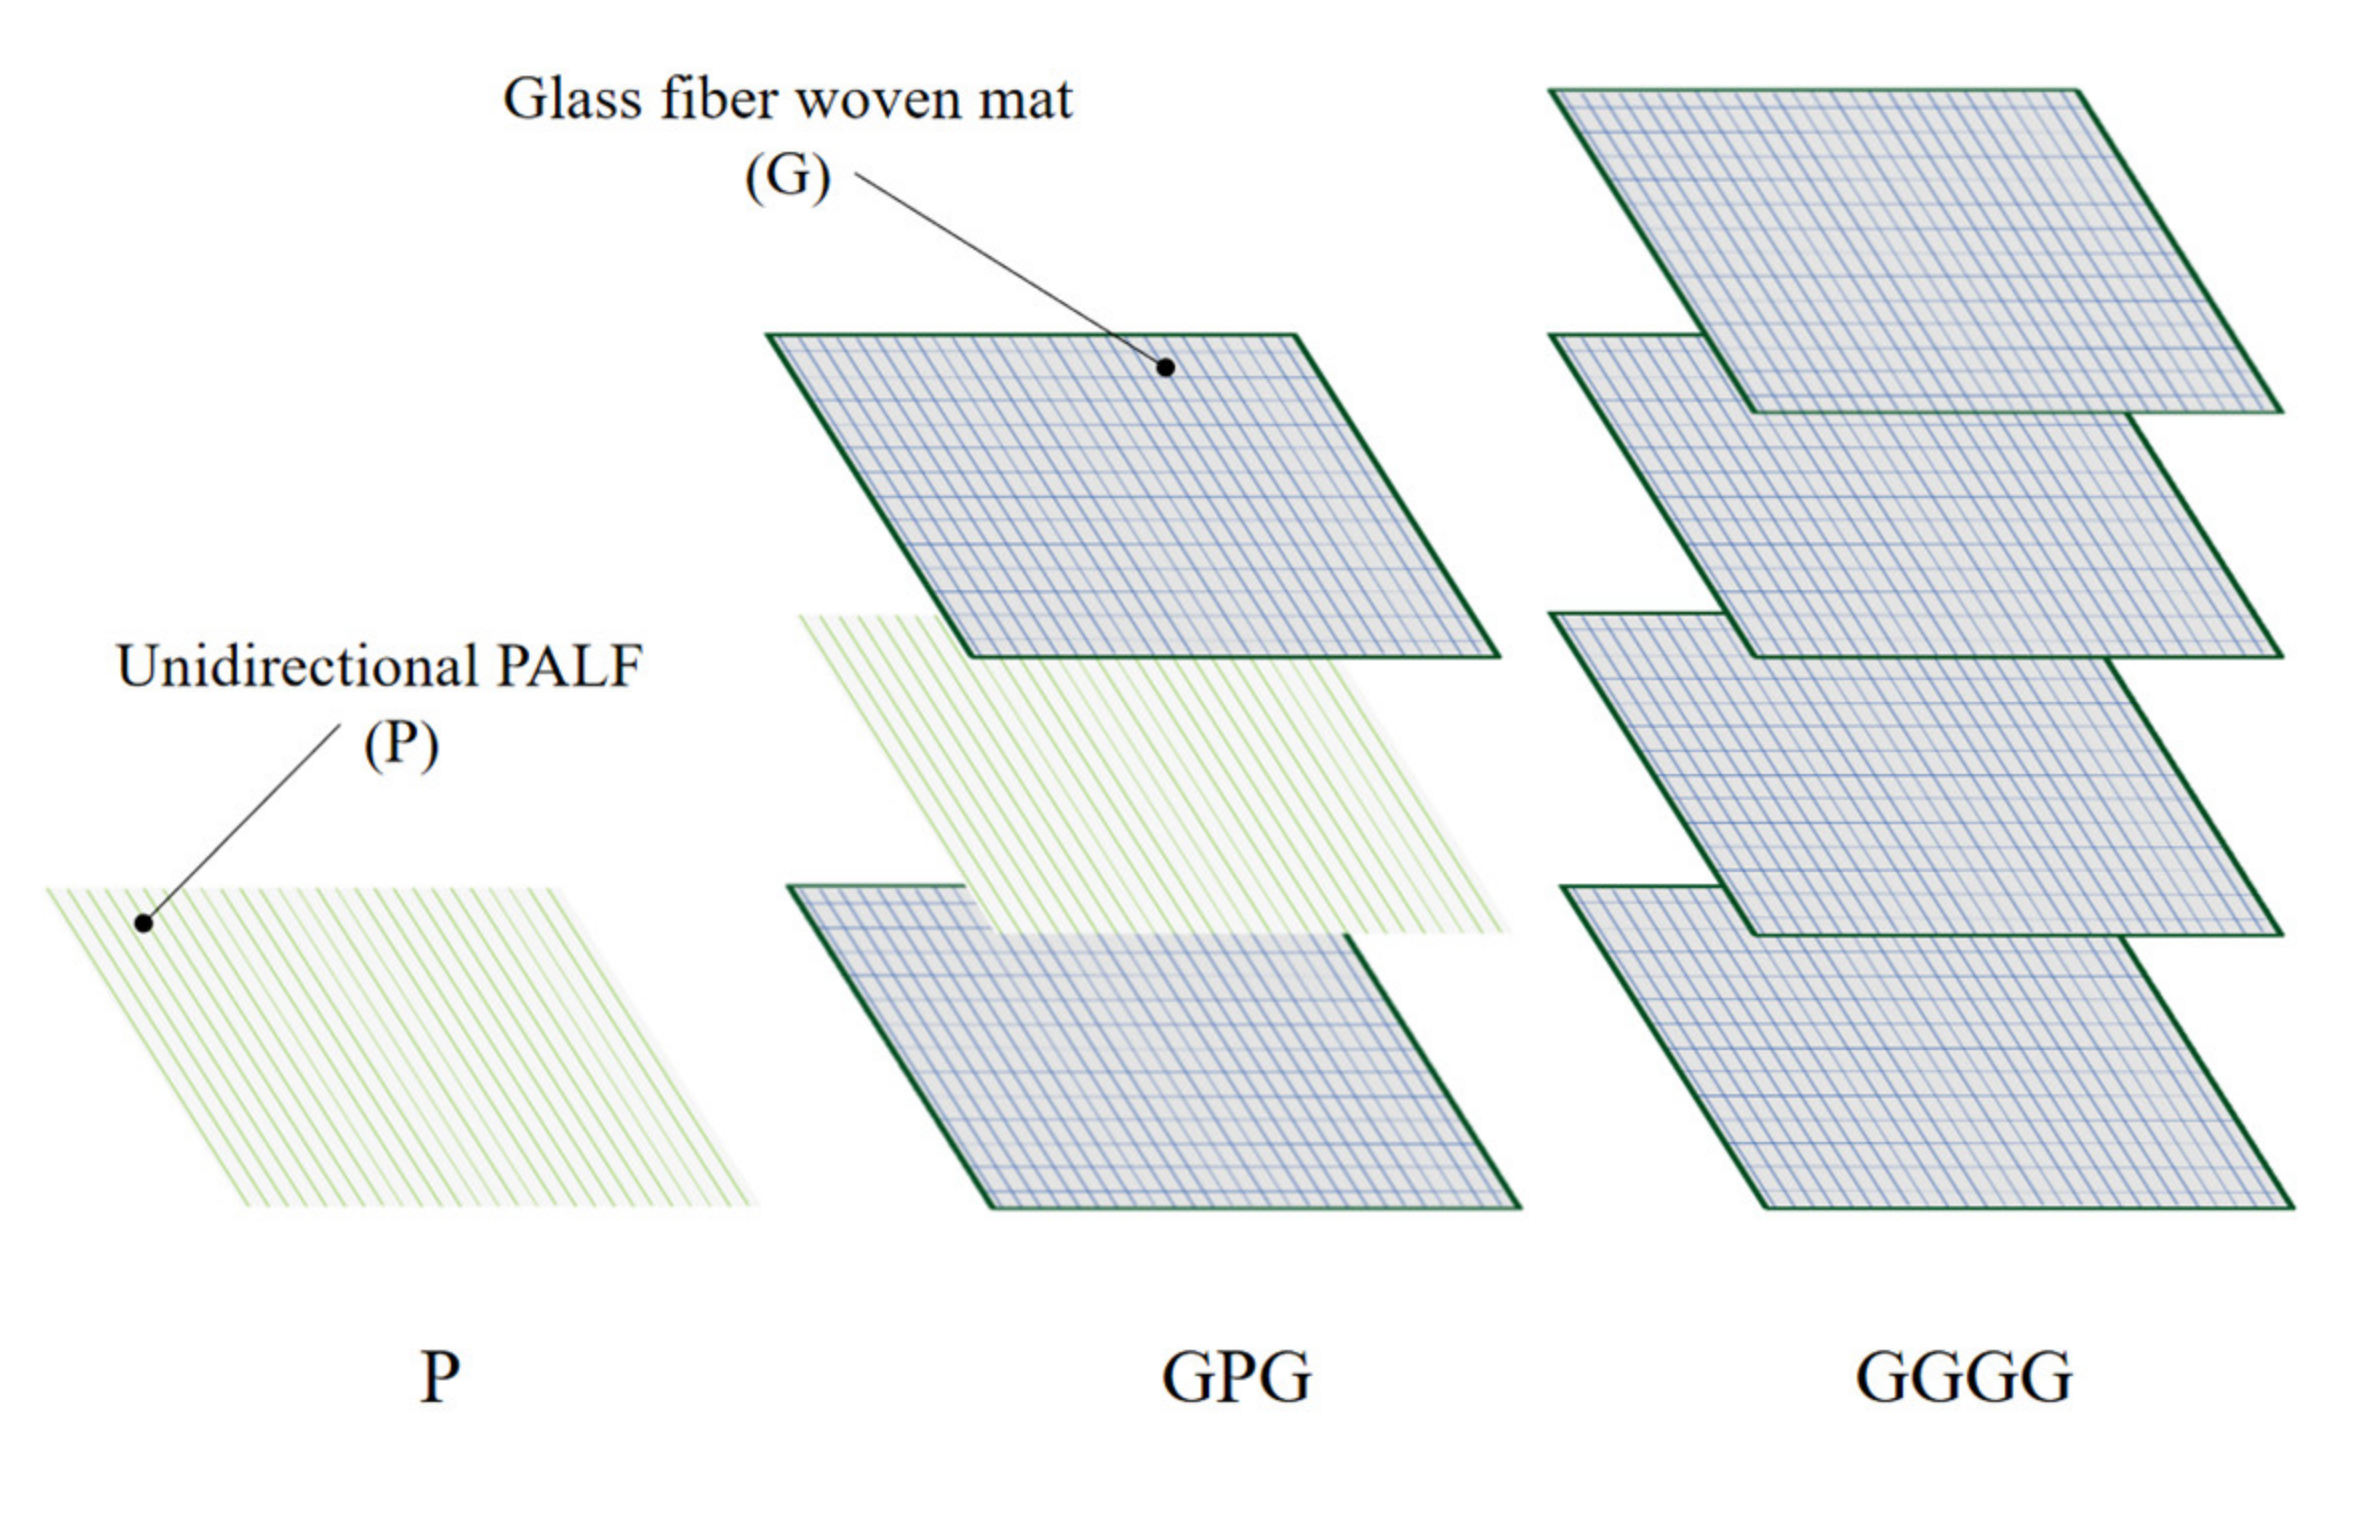
2.2. Composites Preparation
2.3. Flexural Test
2.4. Low-Velocity Test
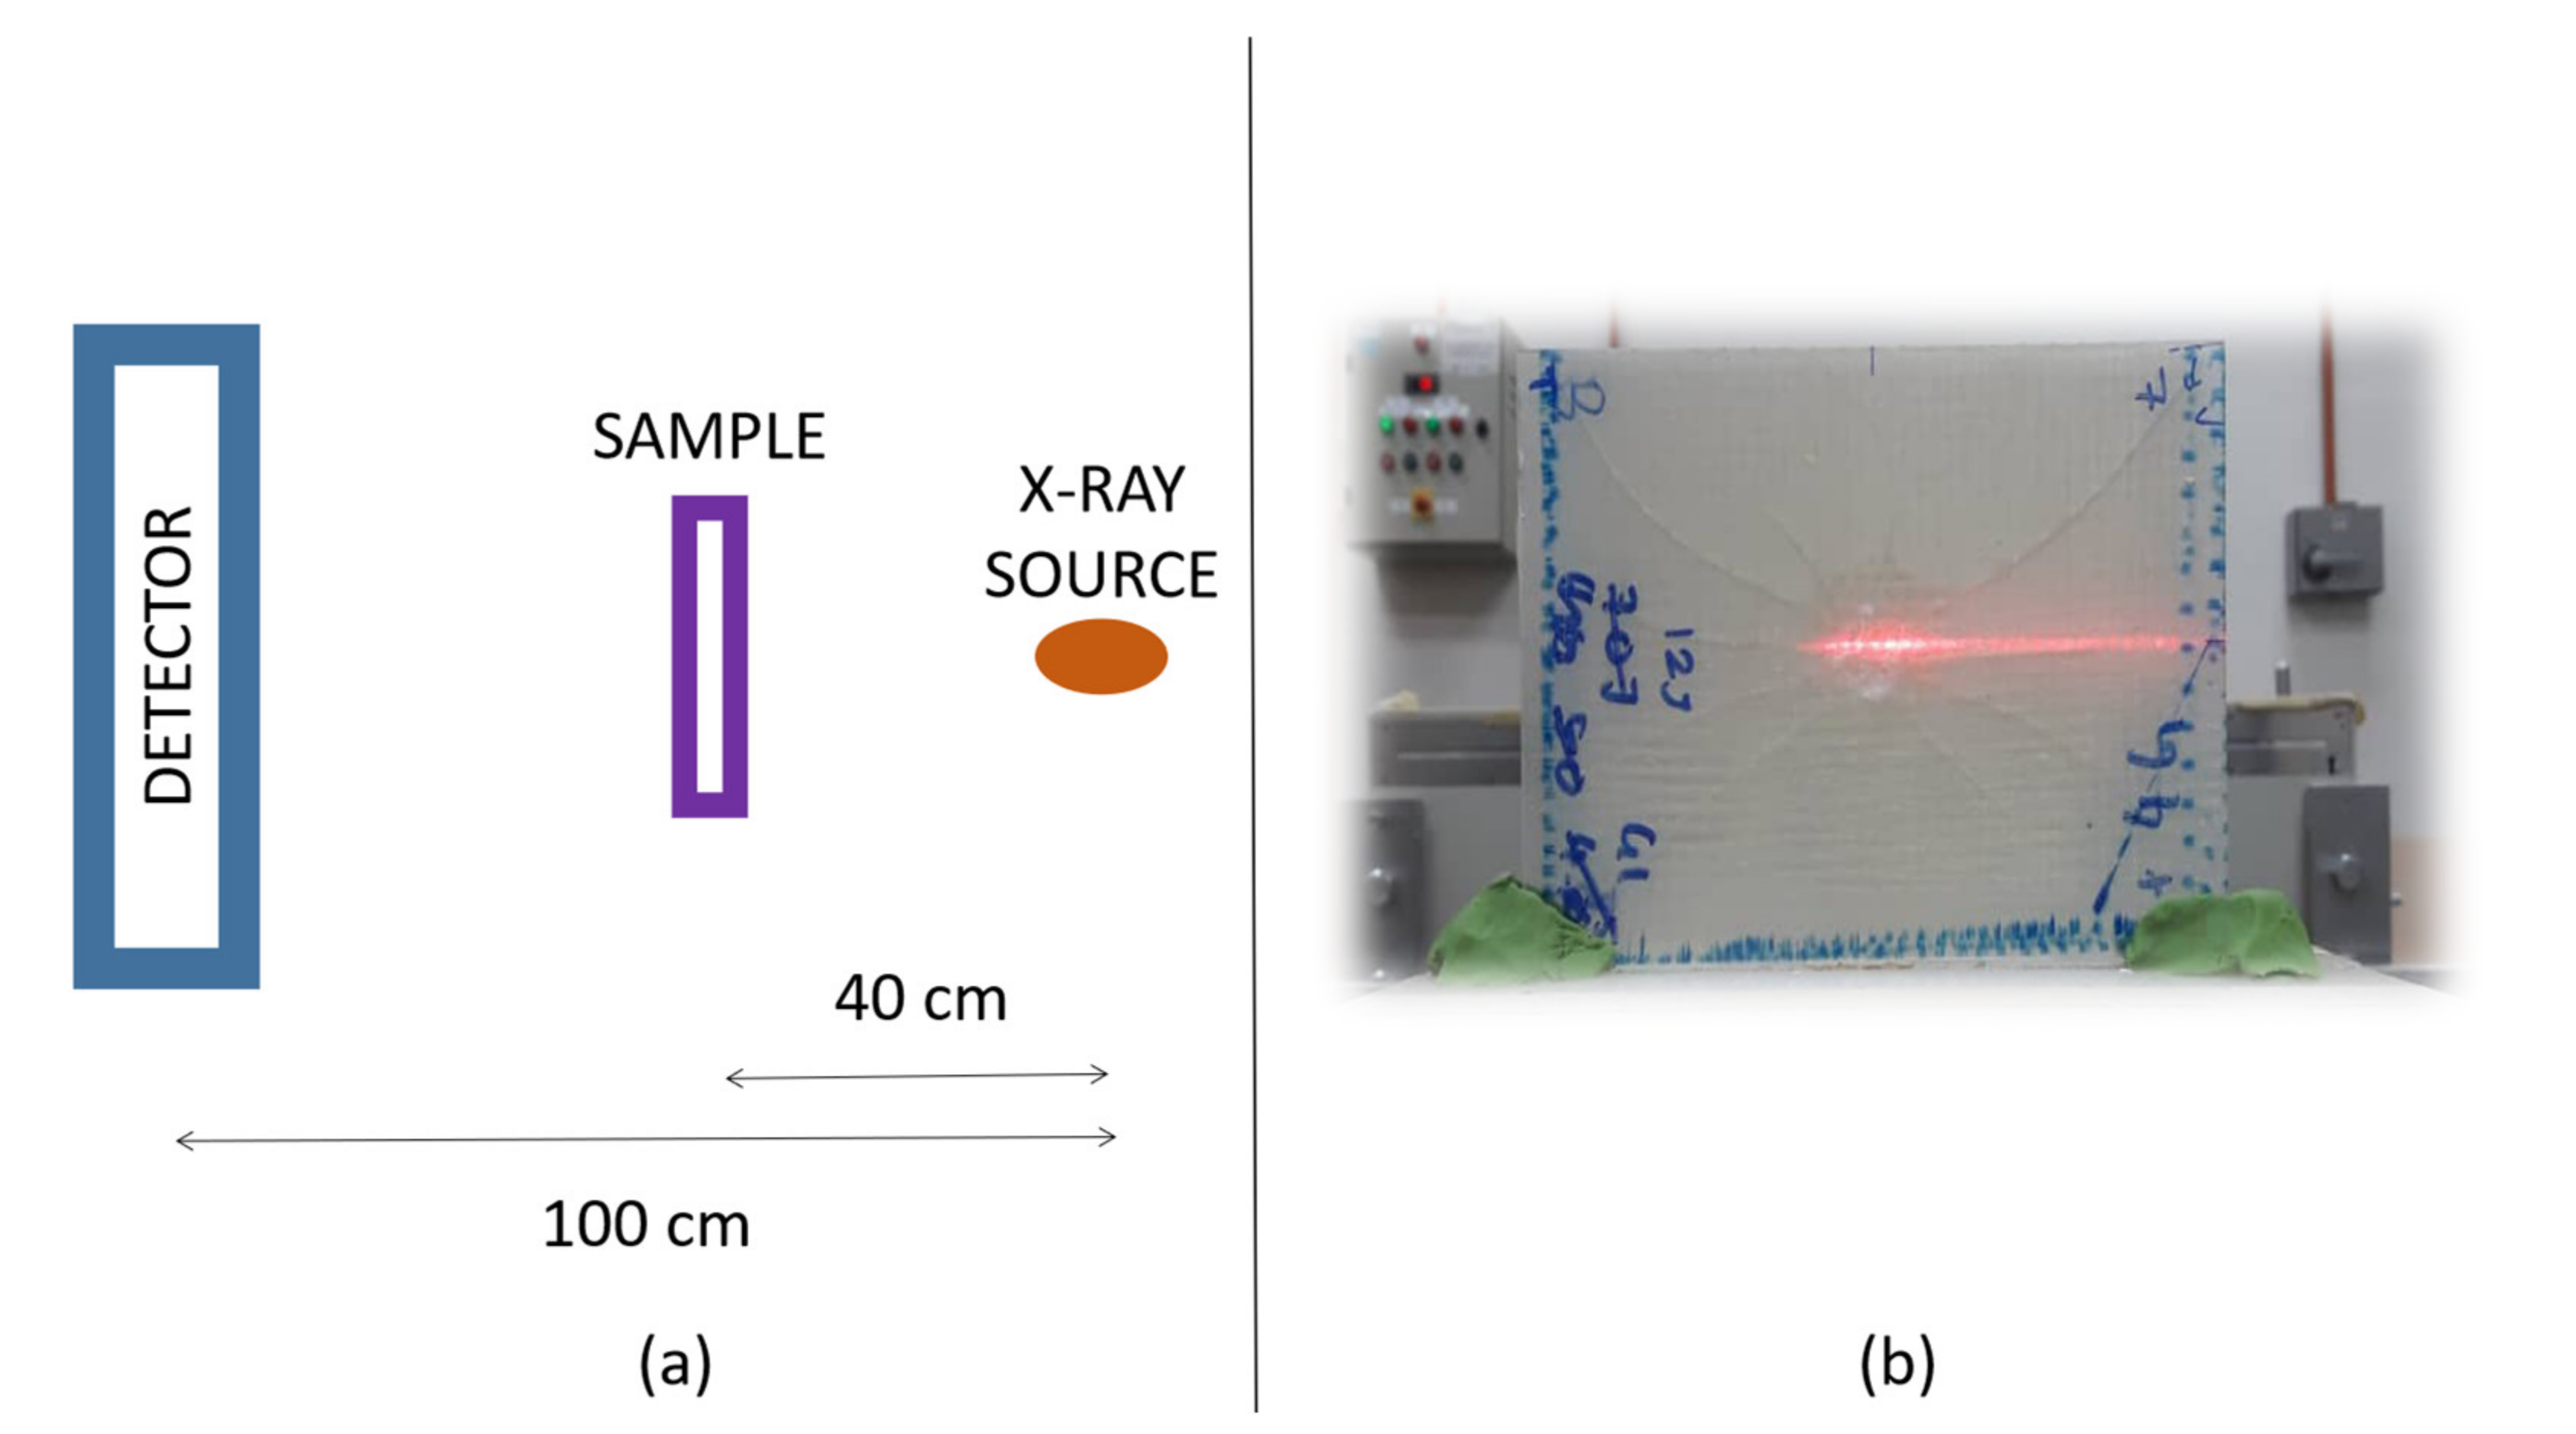
2.5. Non-Destructive Test
3. Results
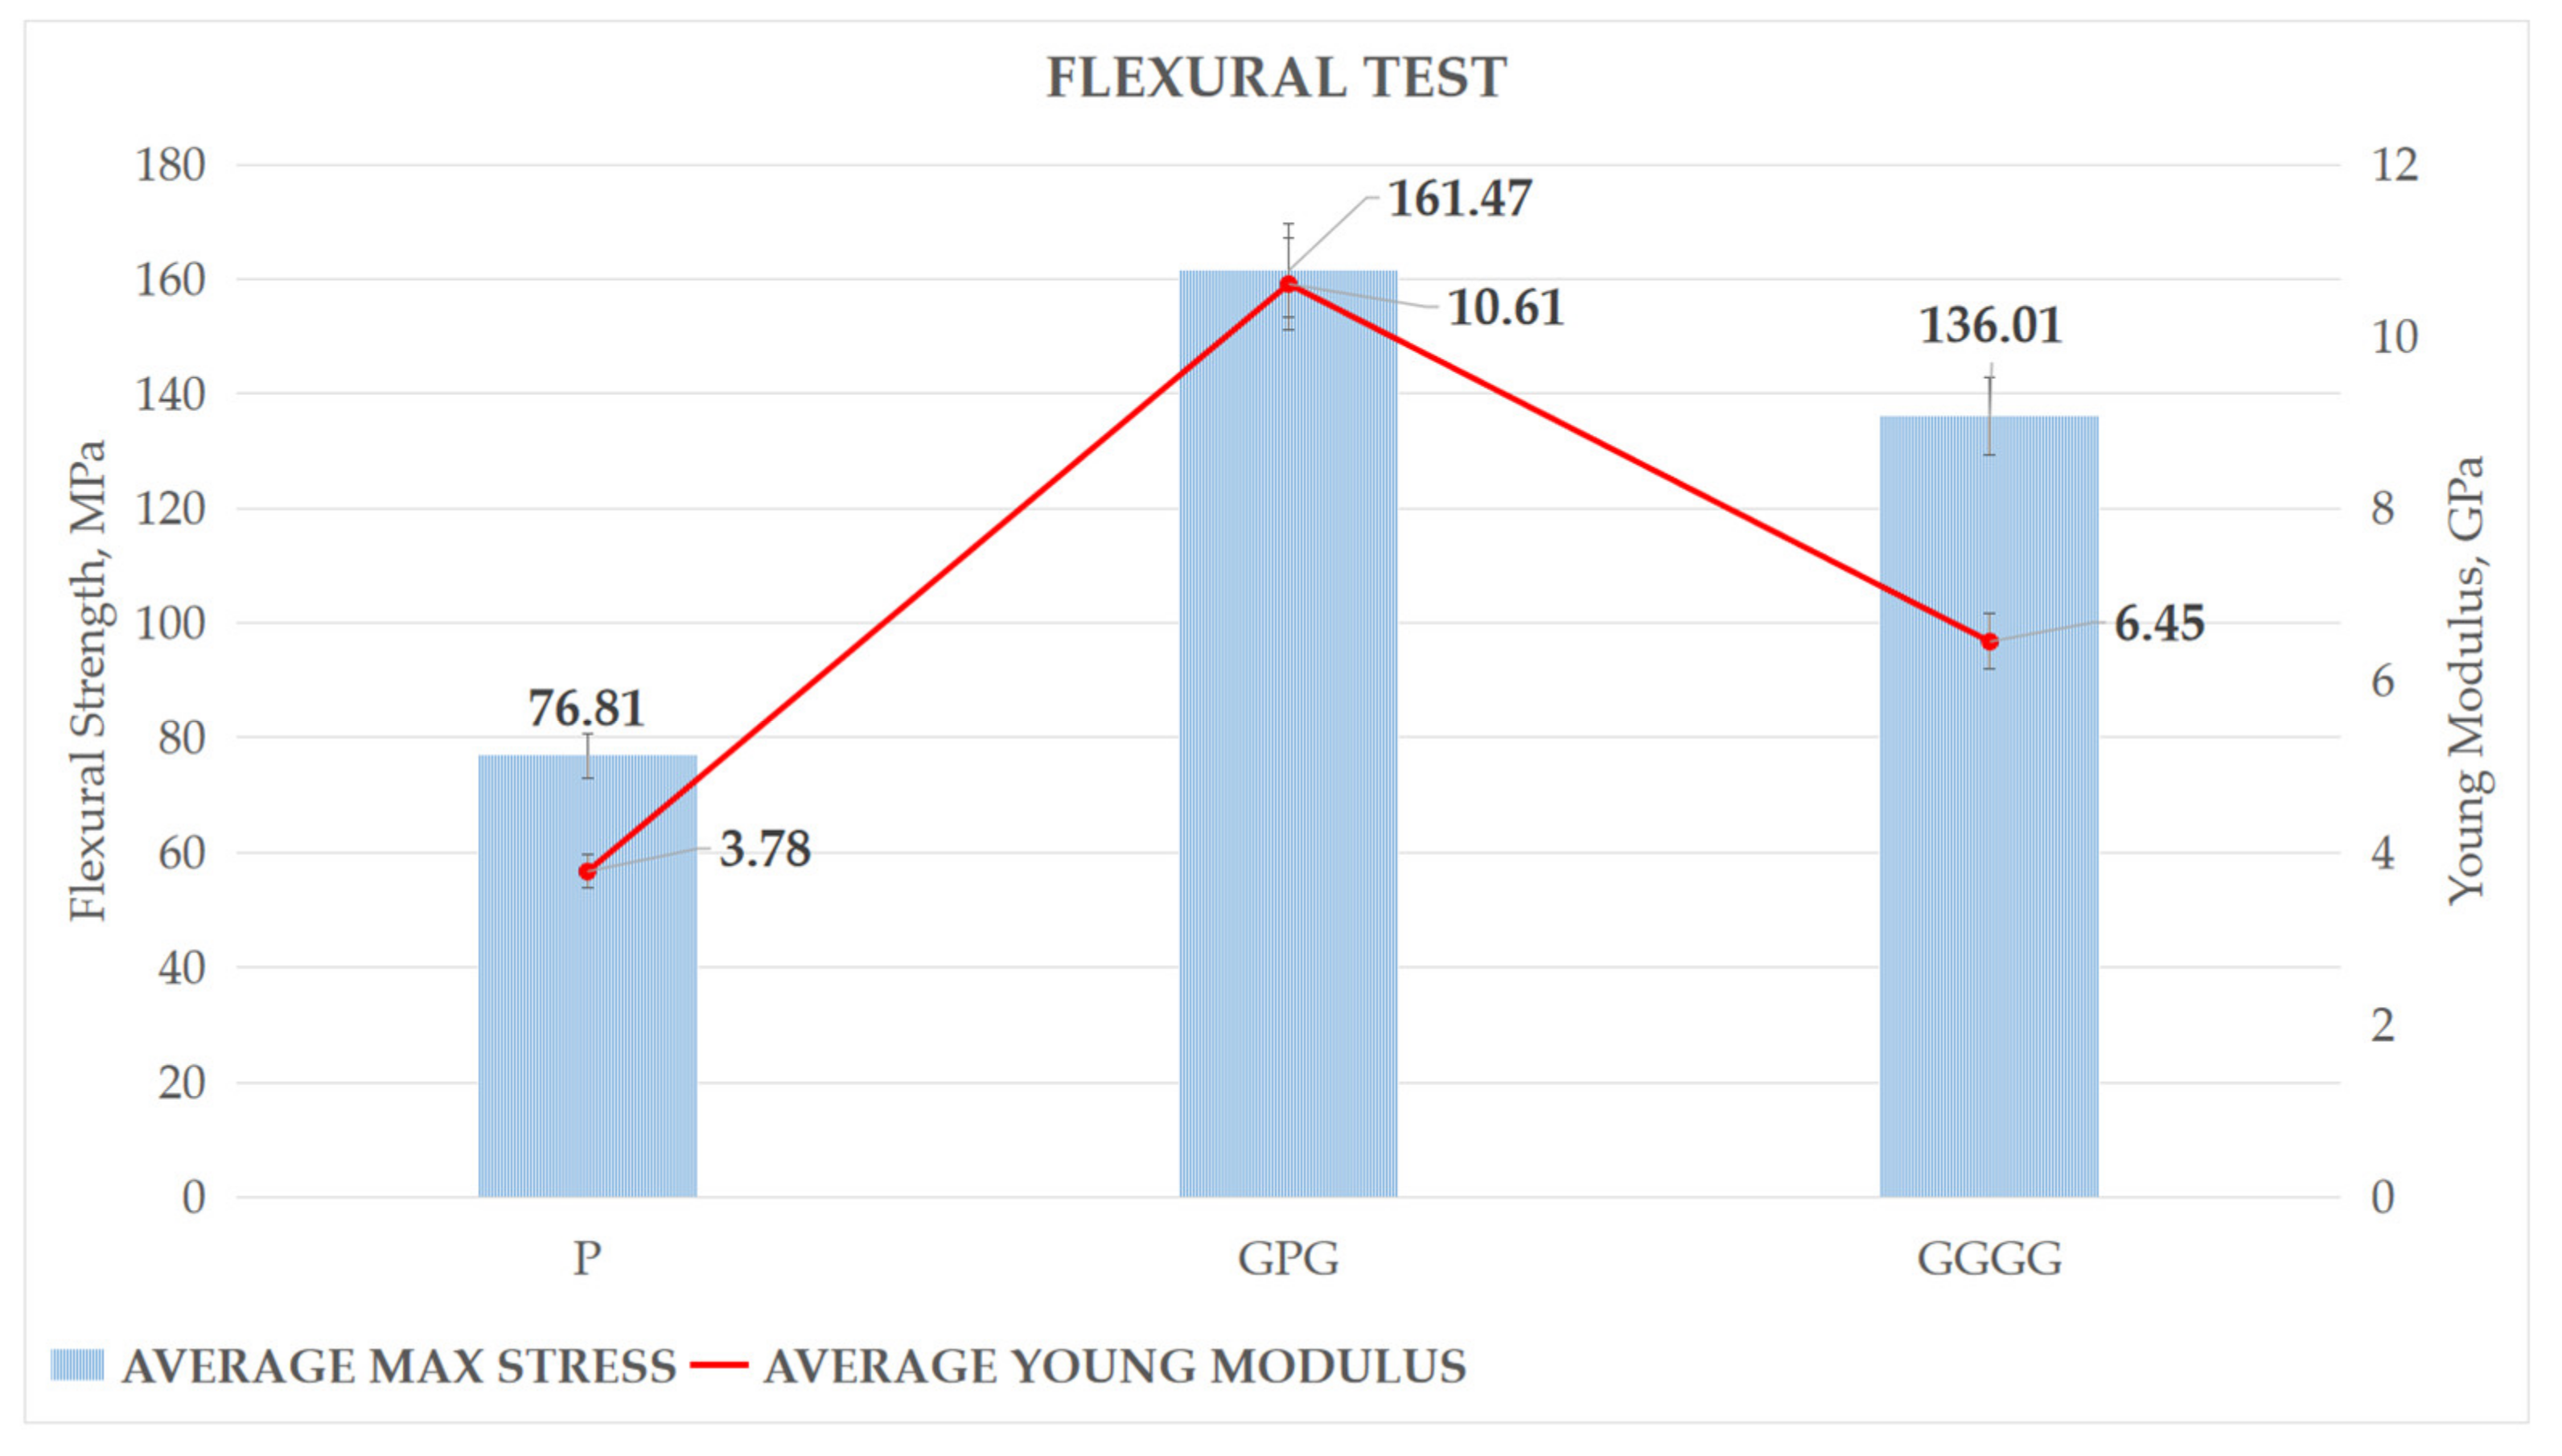
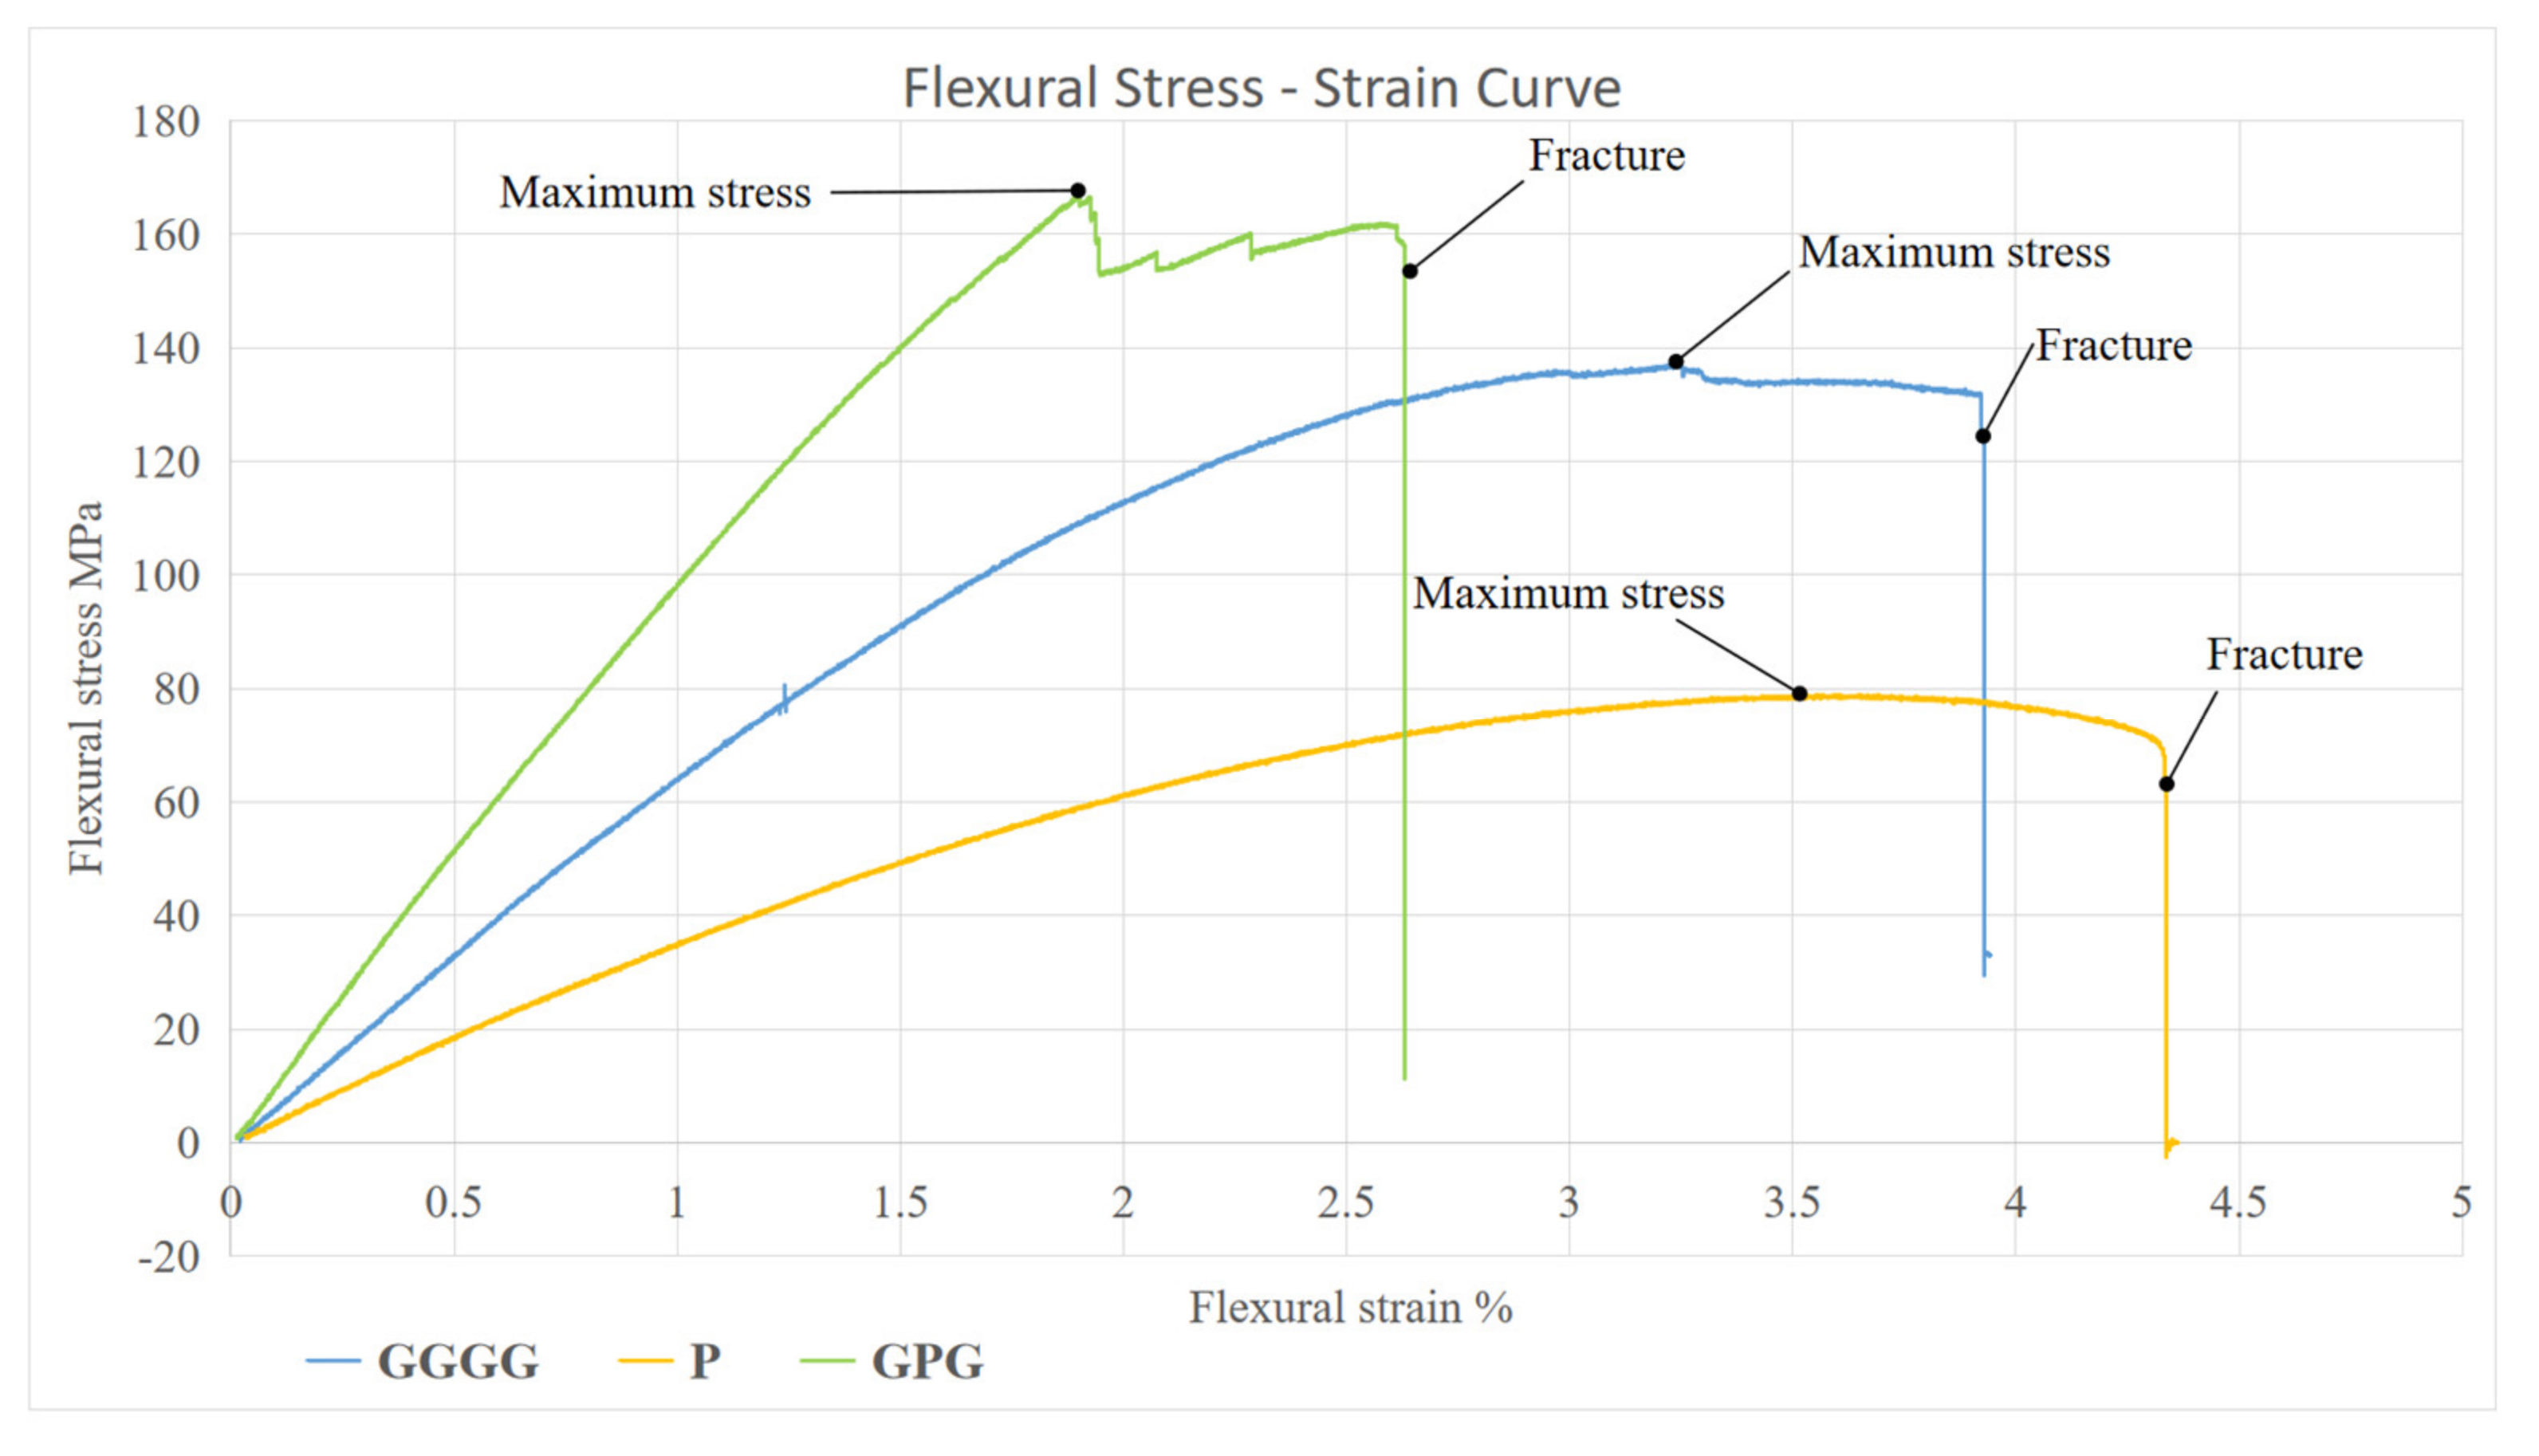
3.1. Flexural Test
3.2. Low-Velocity Impact Test
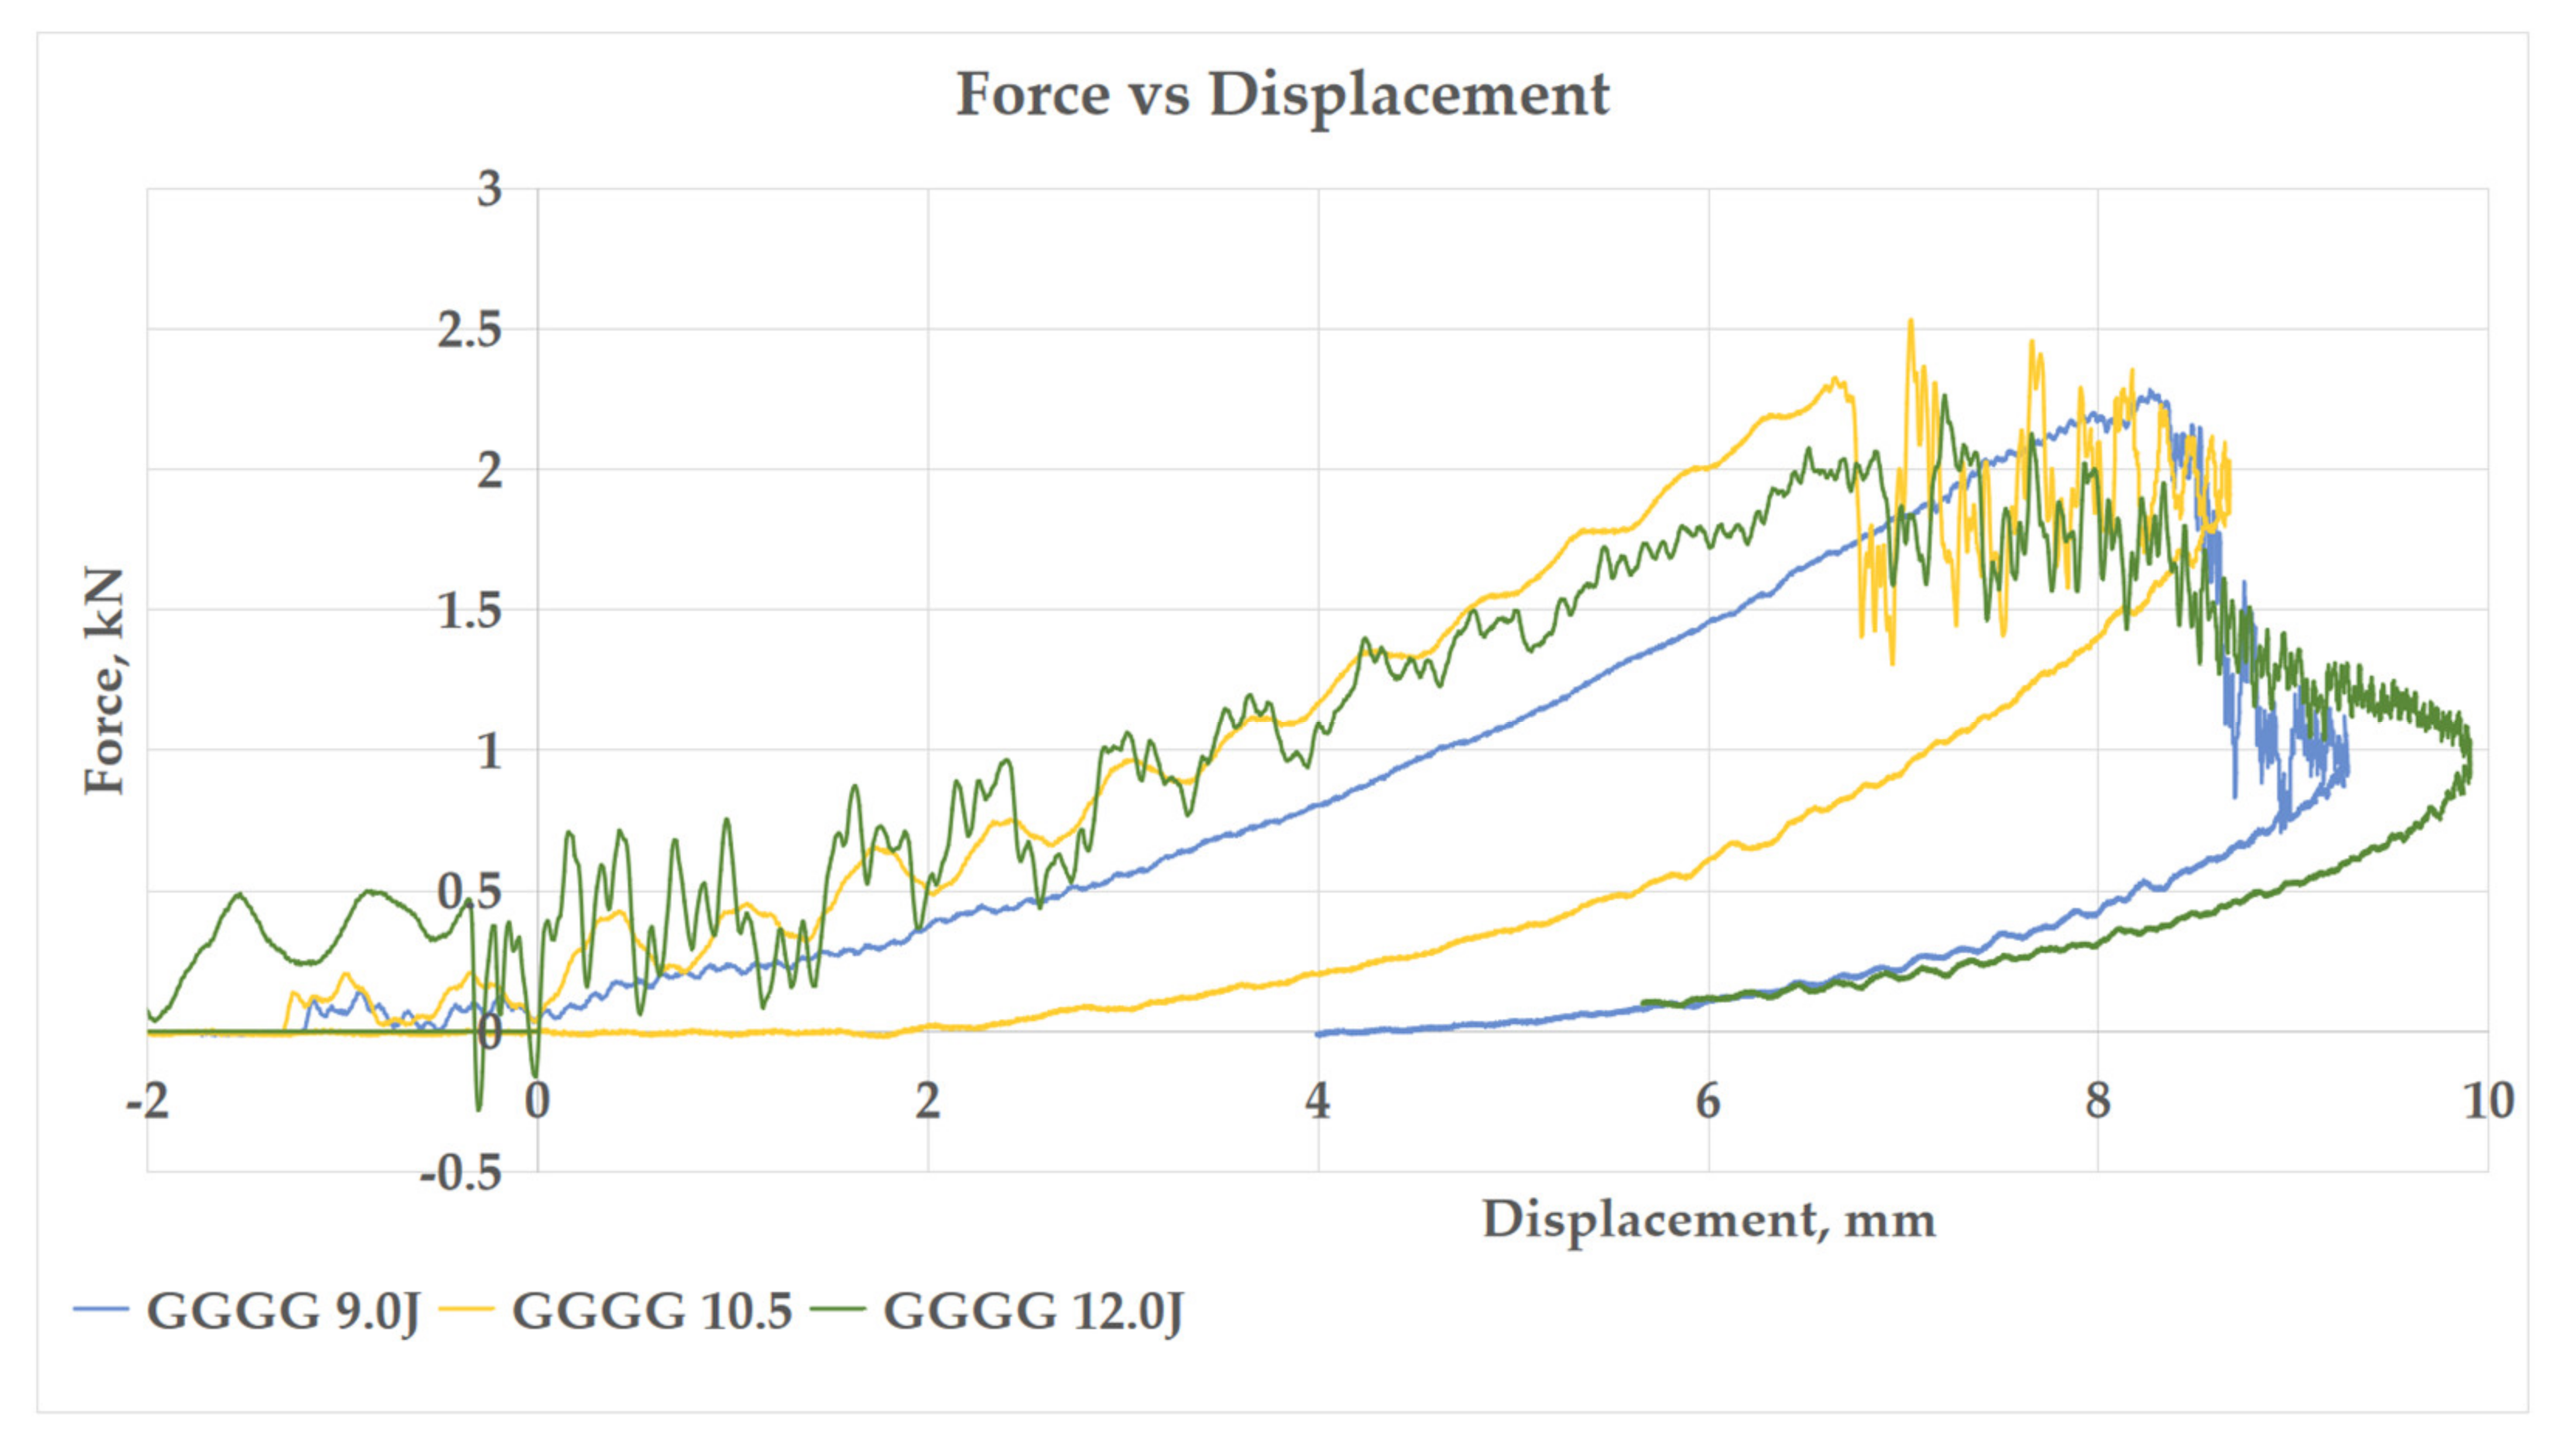
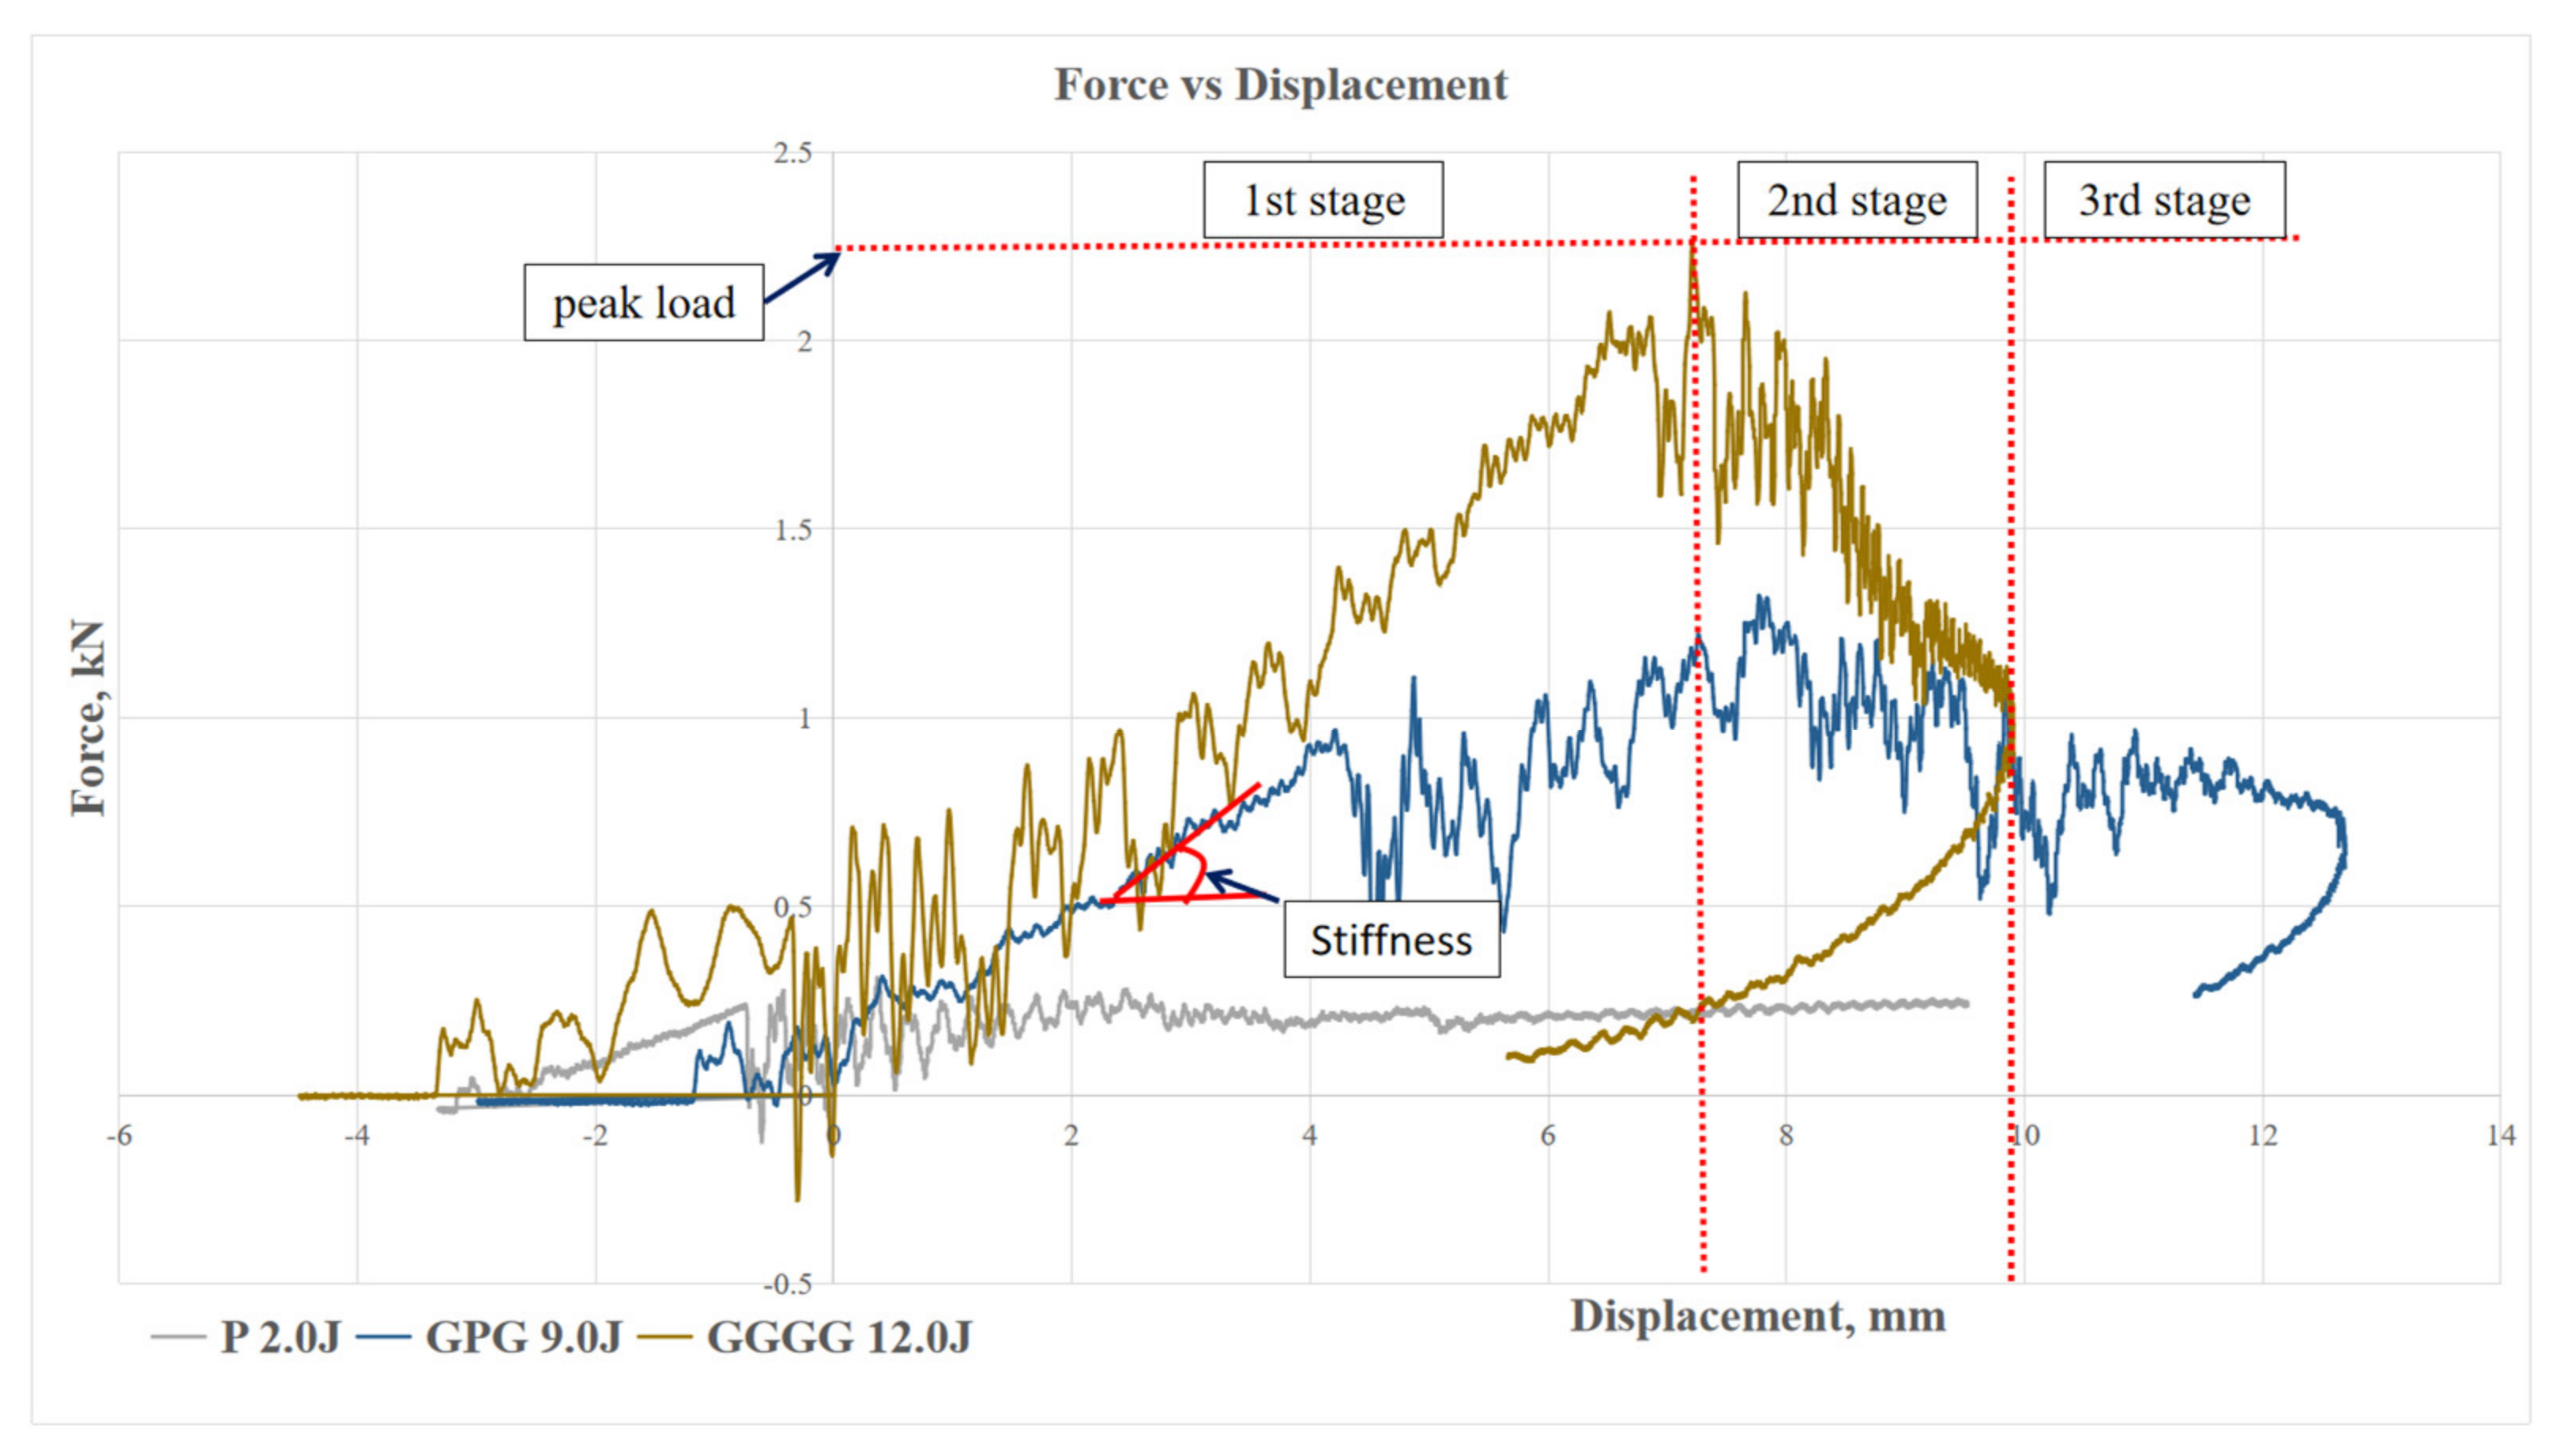
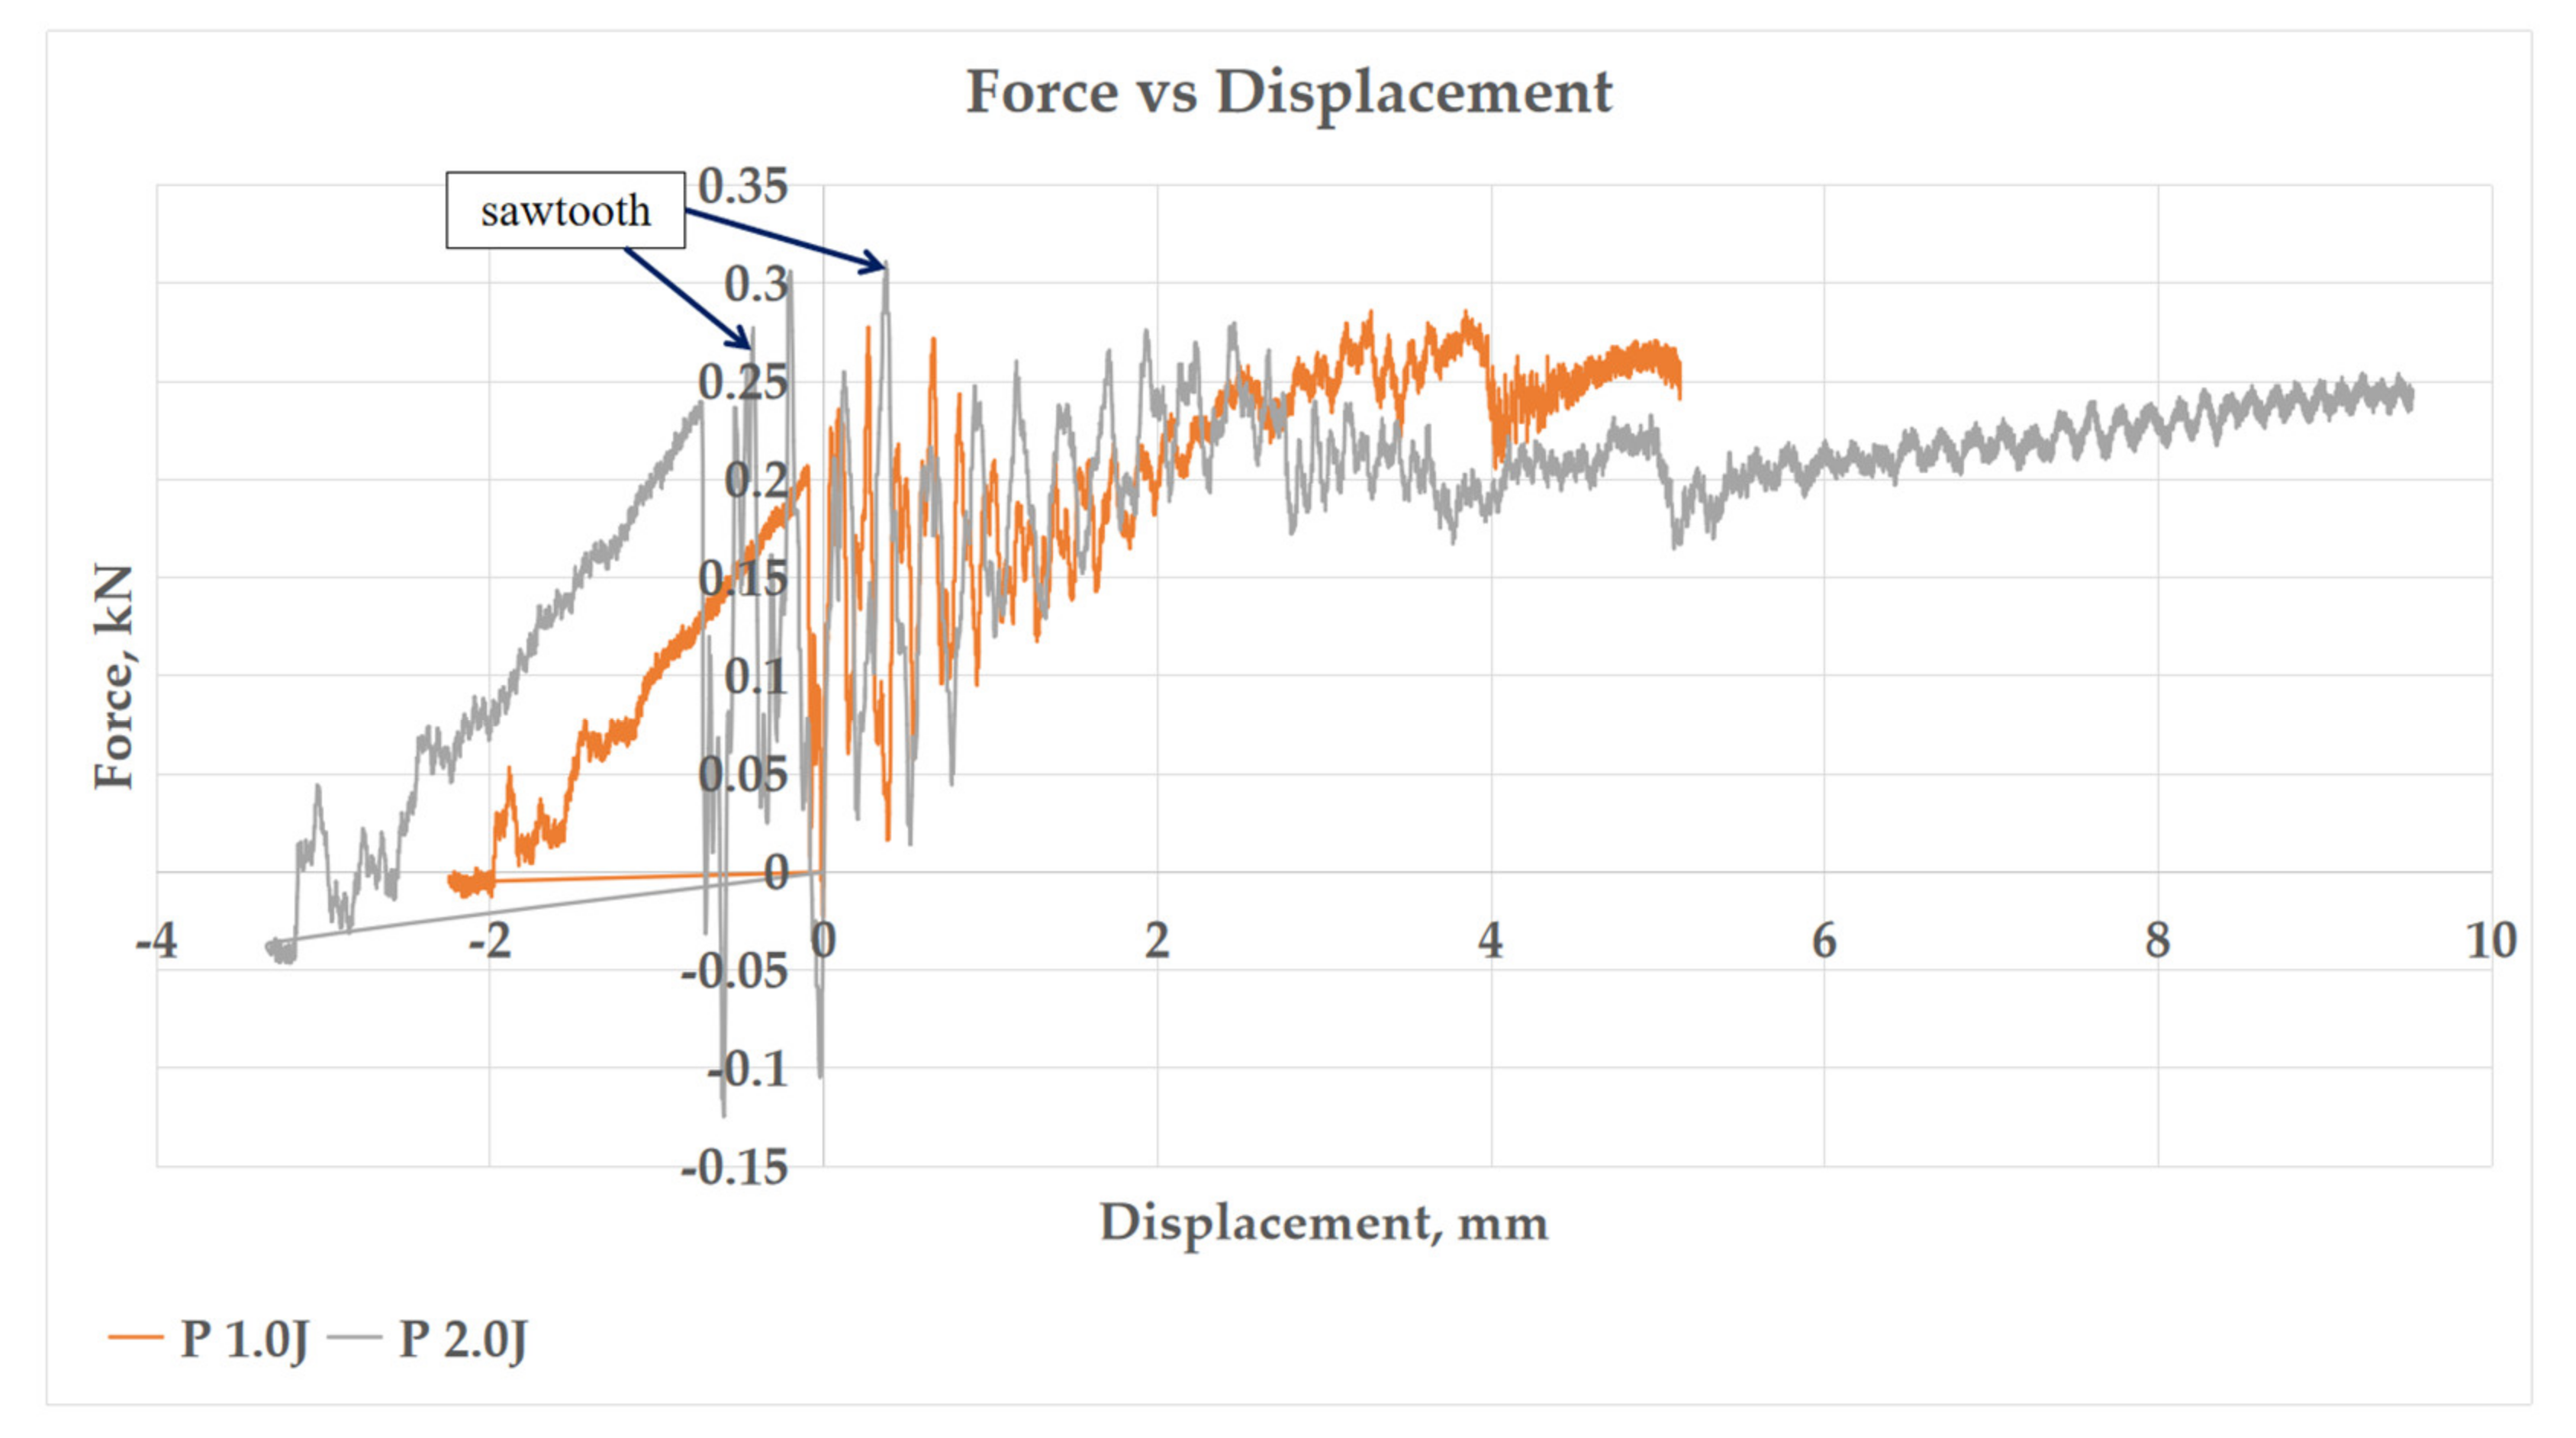
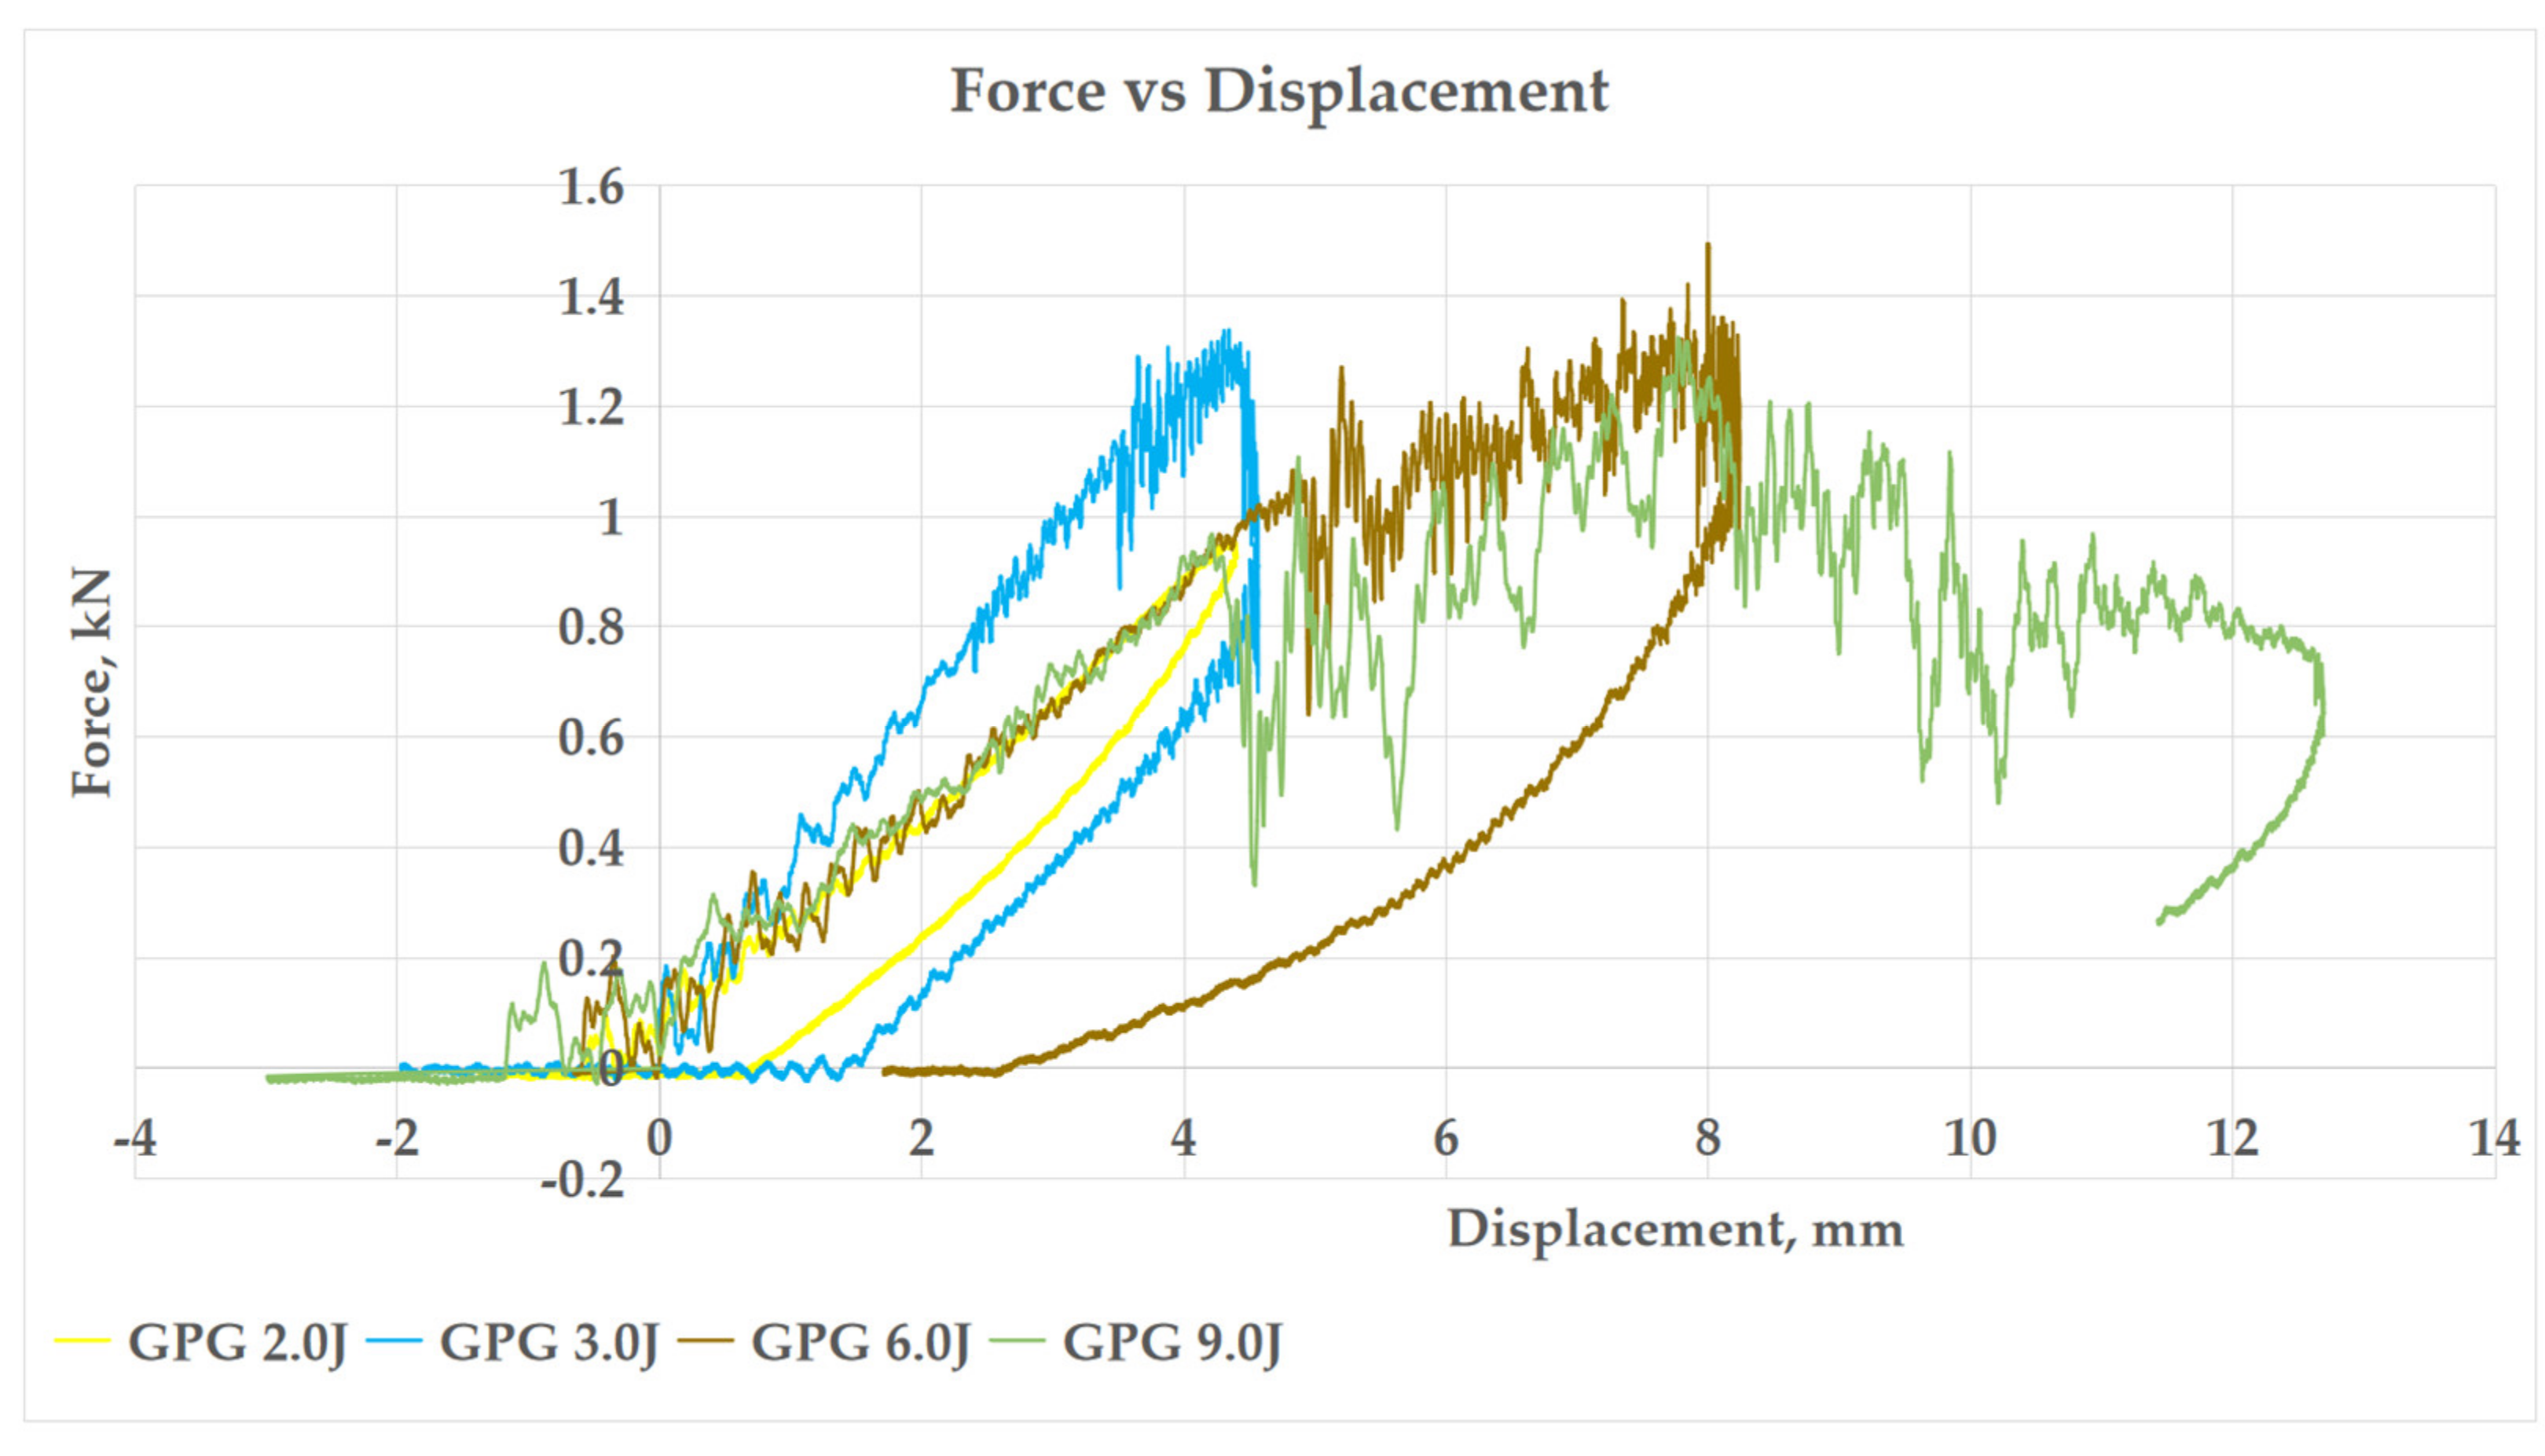
3.2.1. Force–Displacement Curve
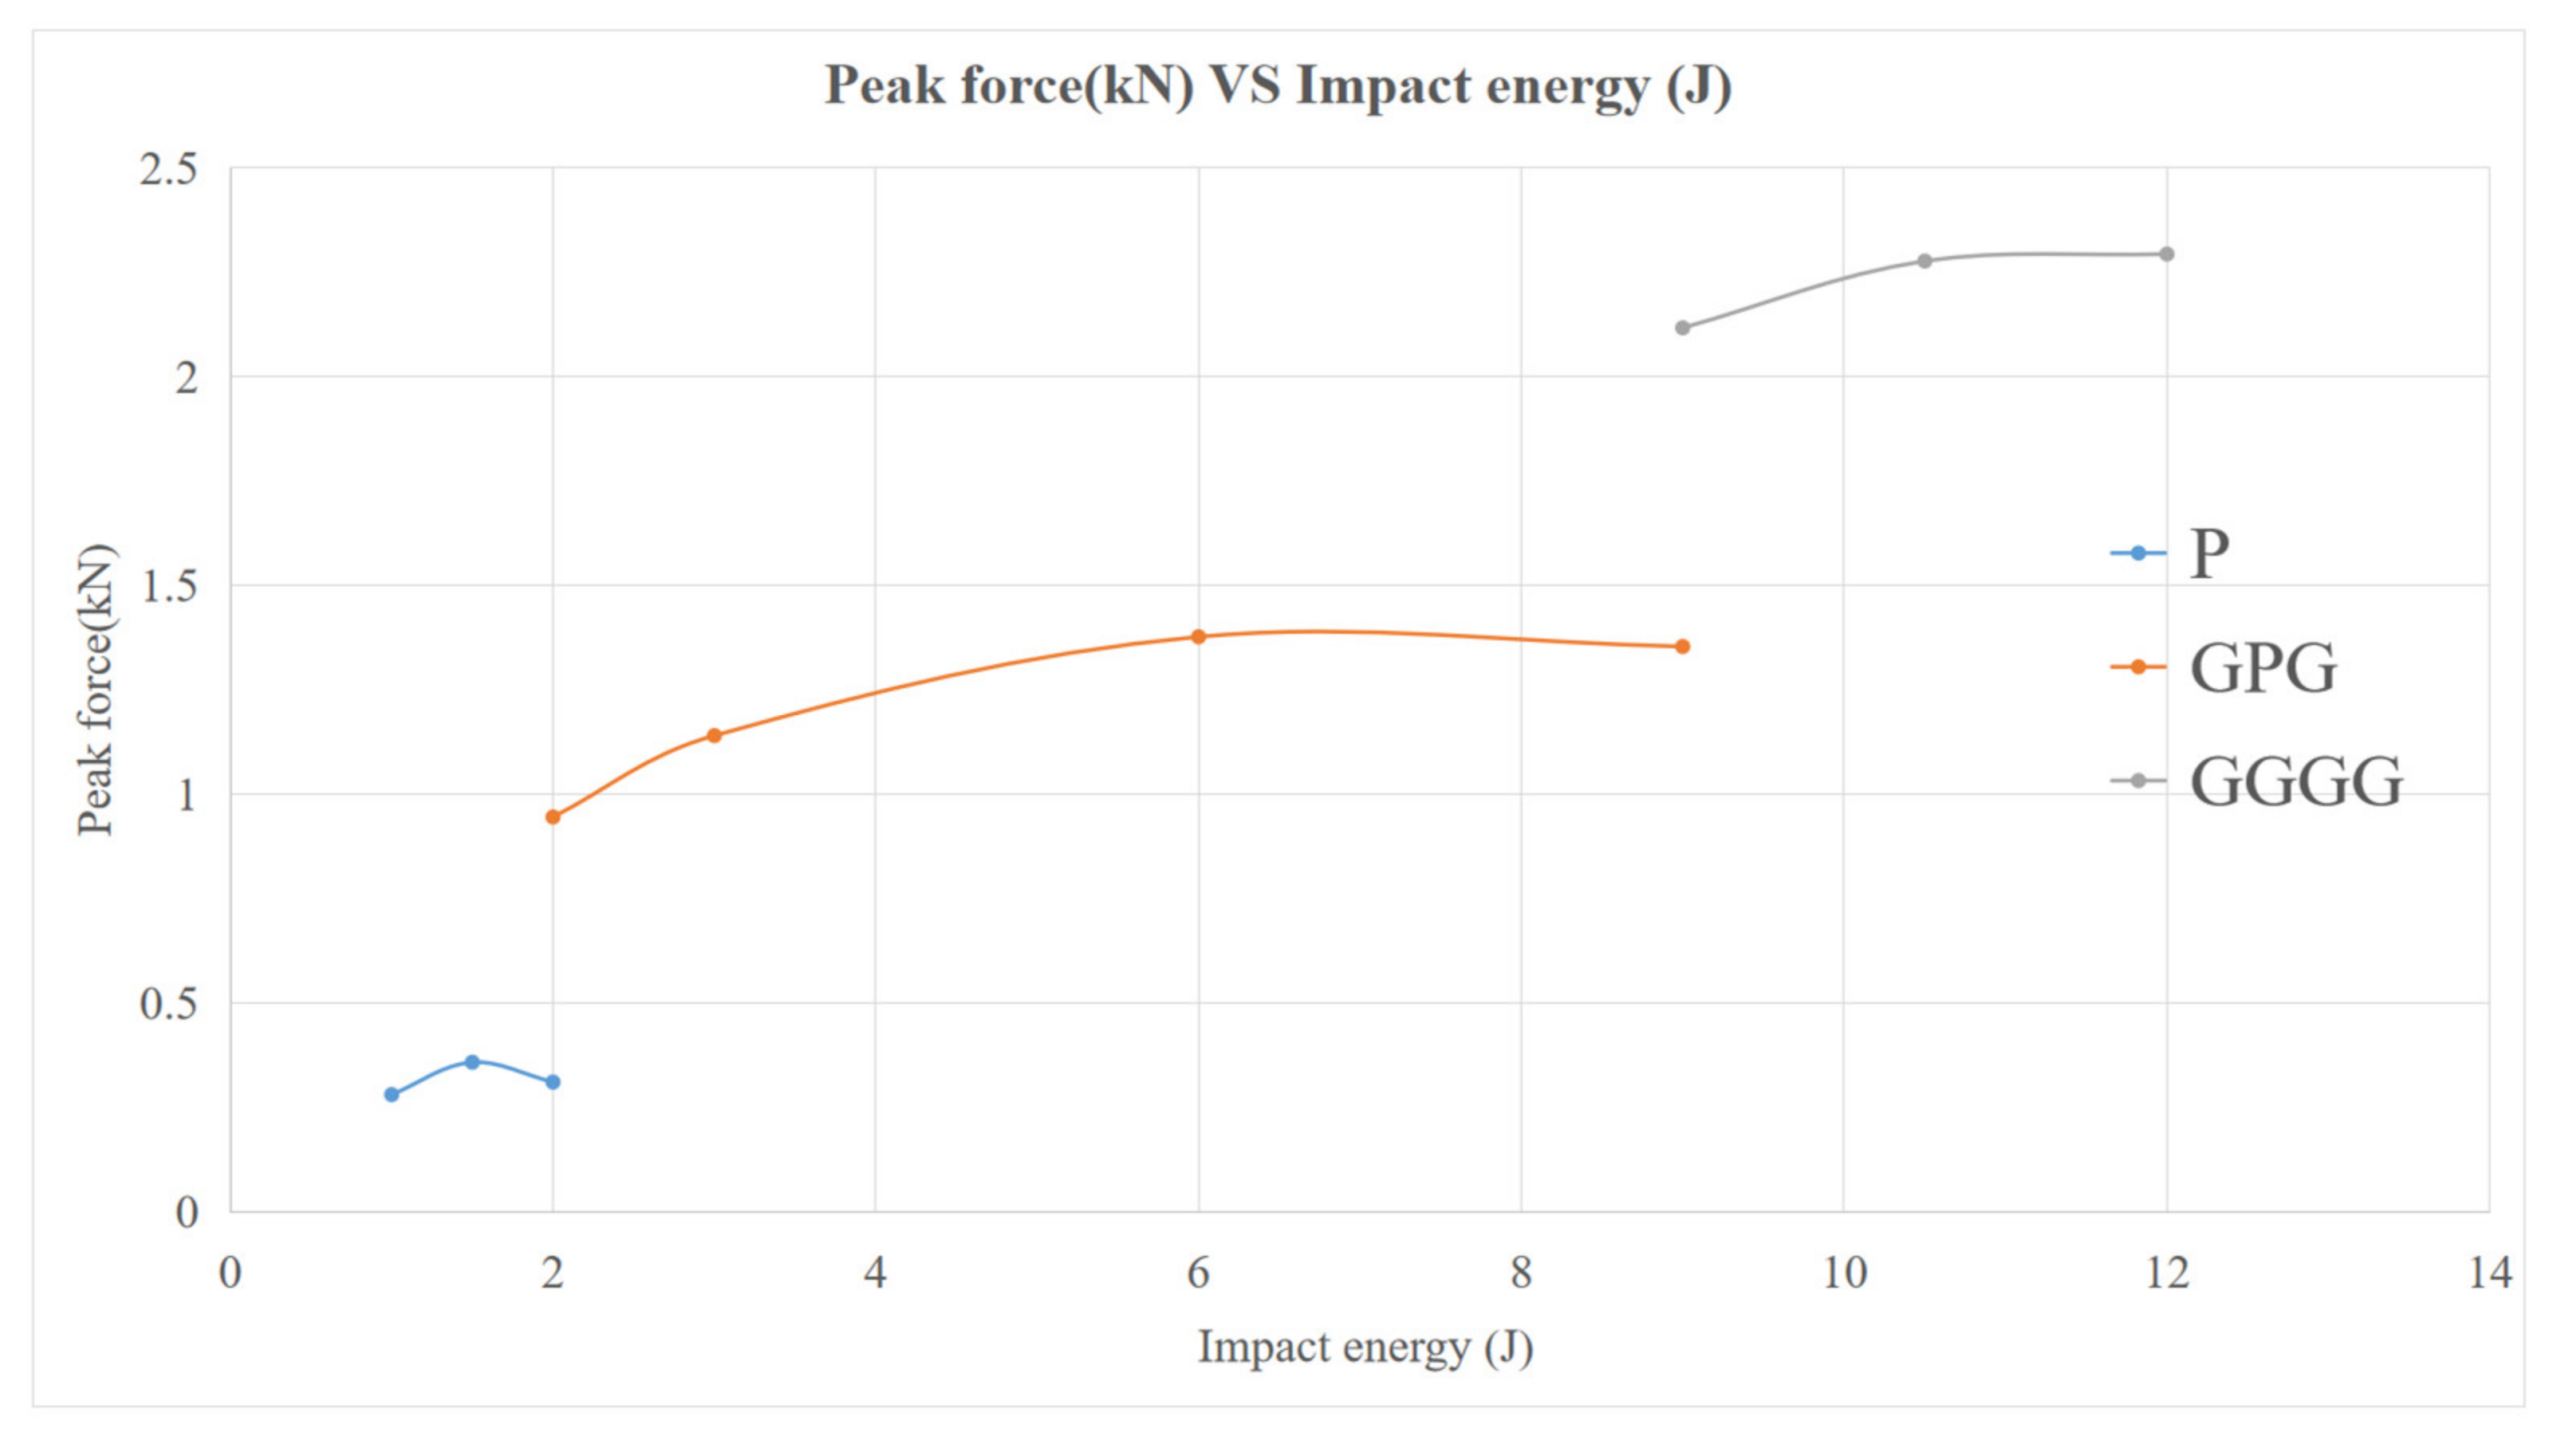
3.2.2. Peak Force of Composite
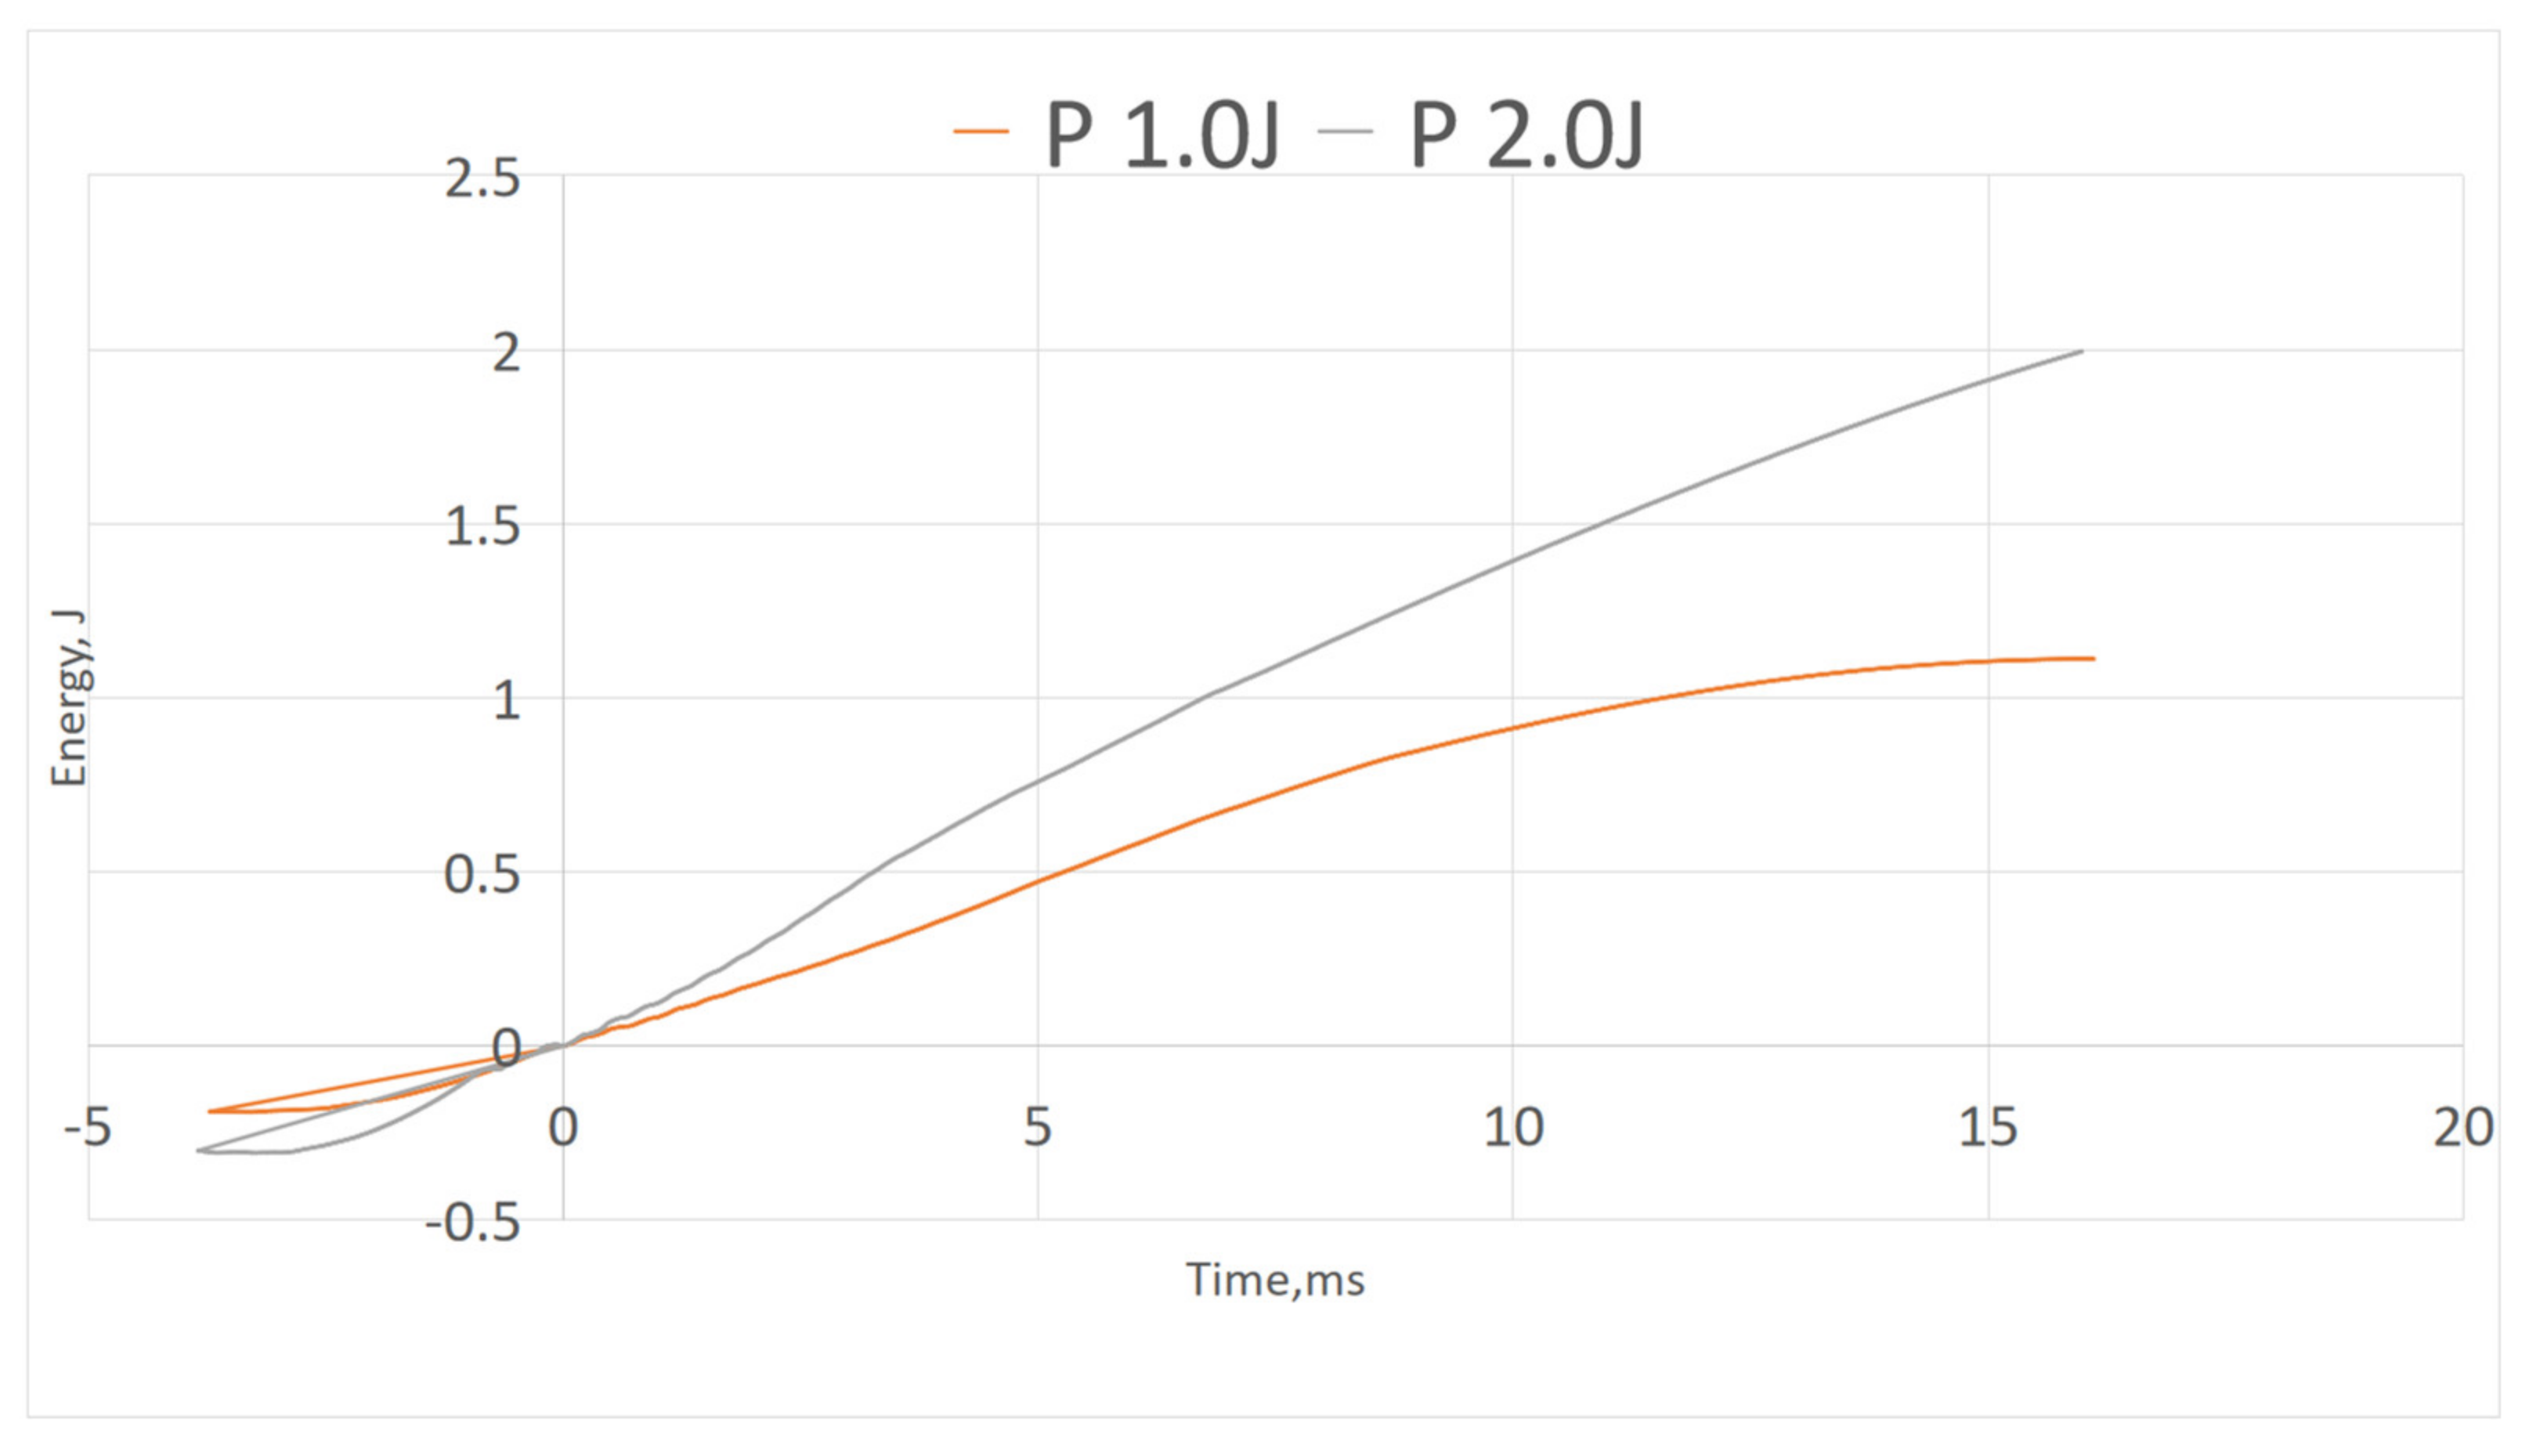
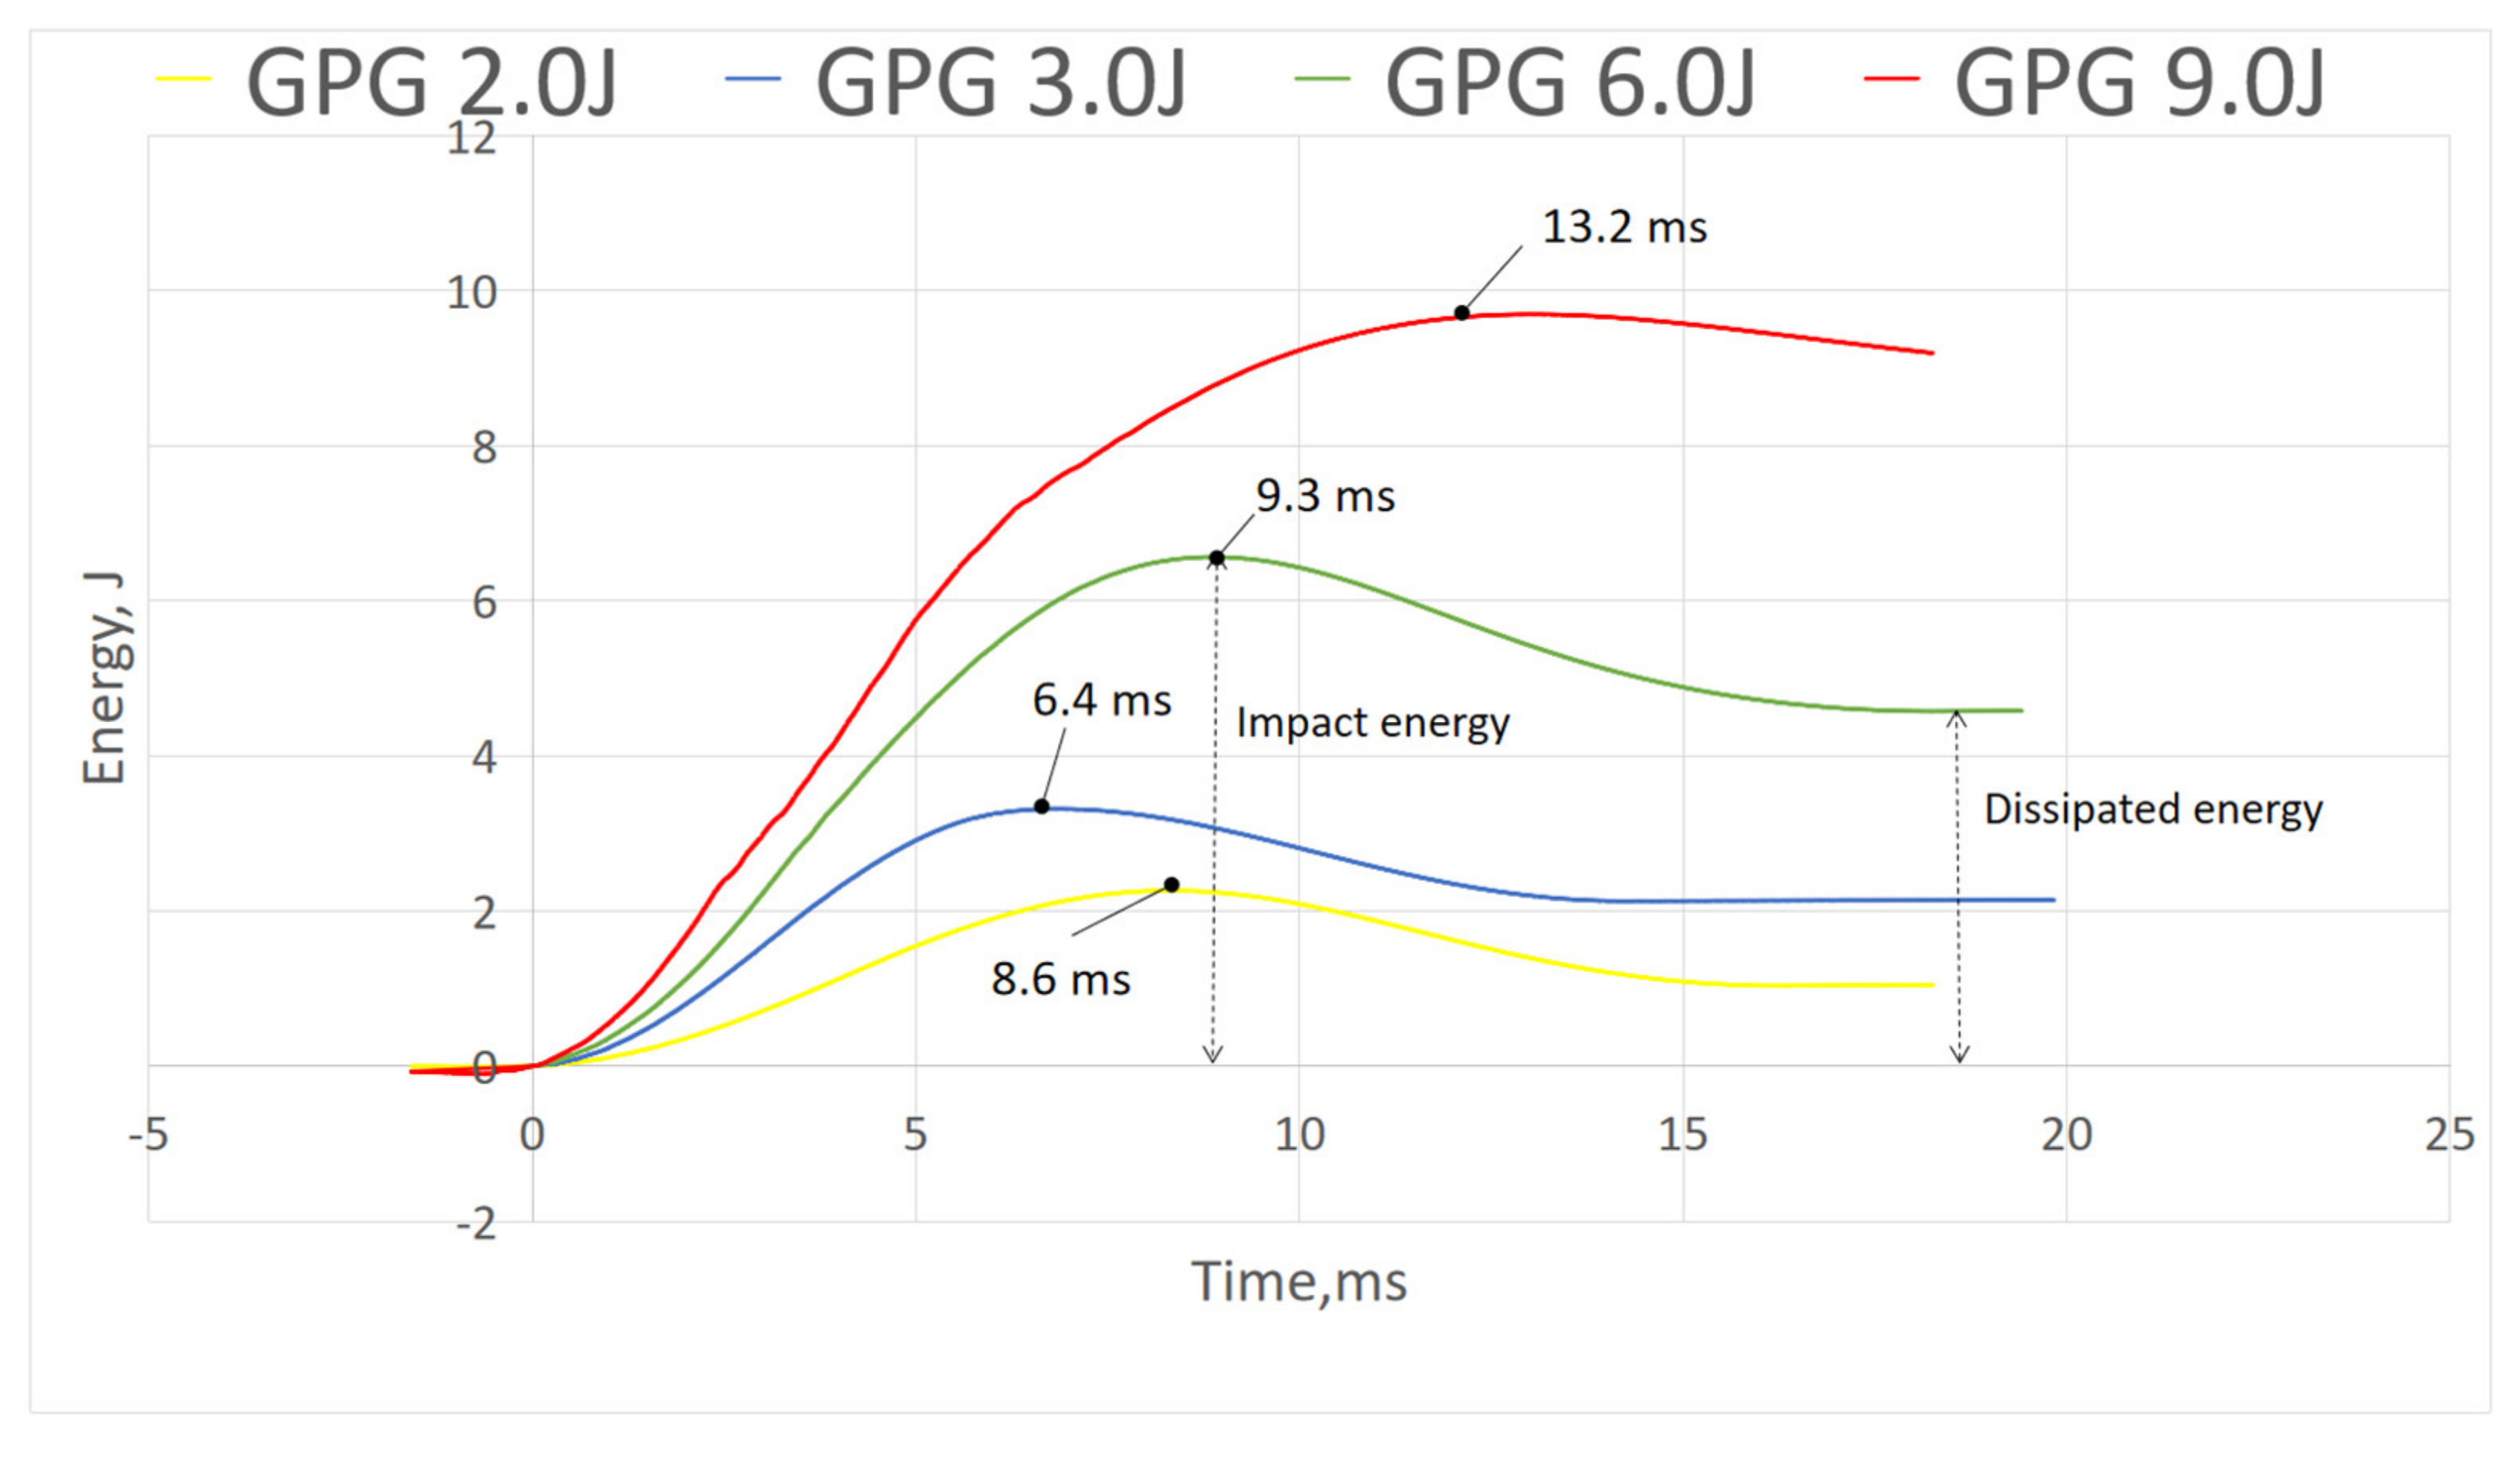
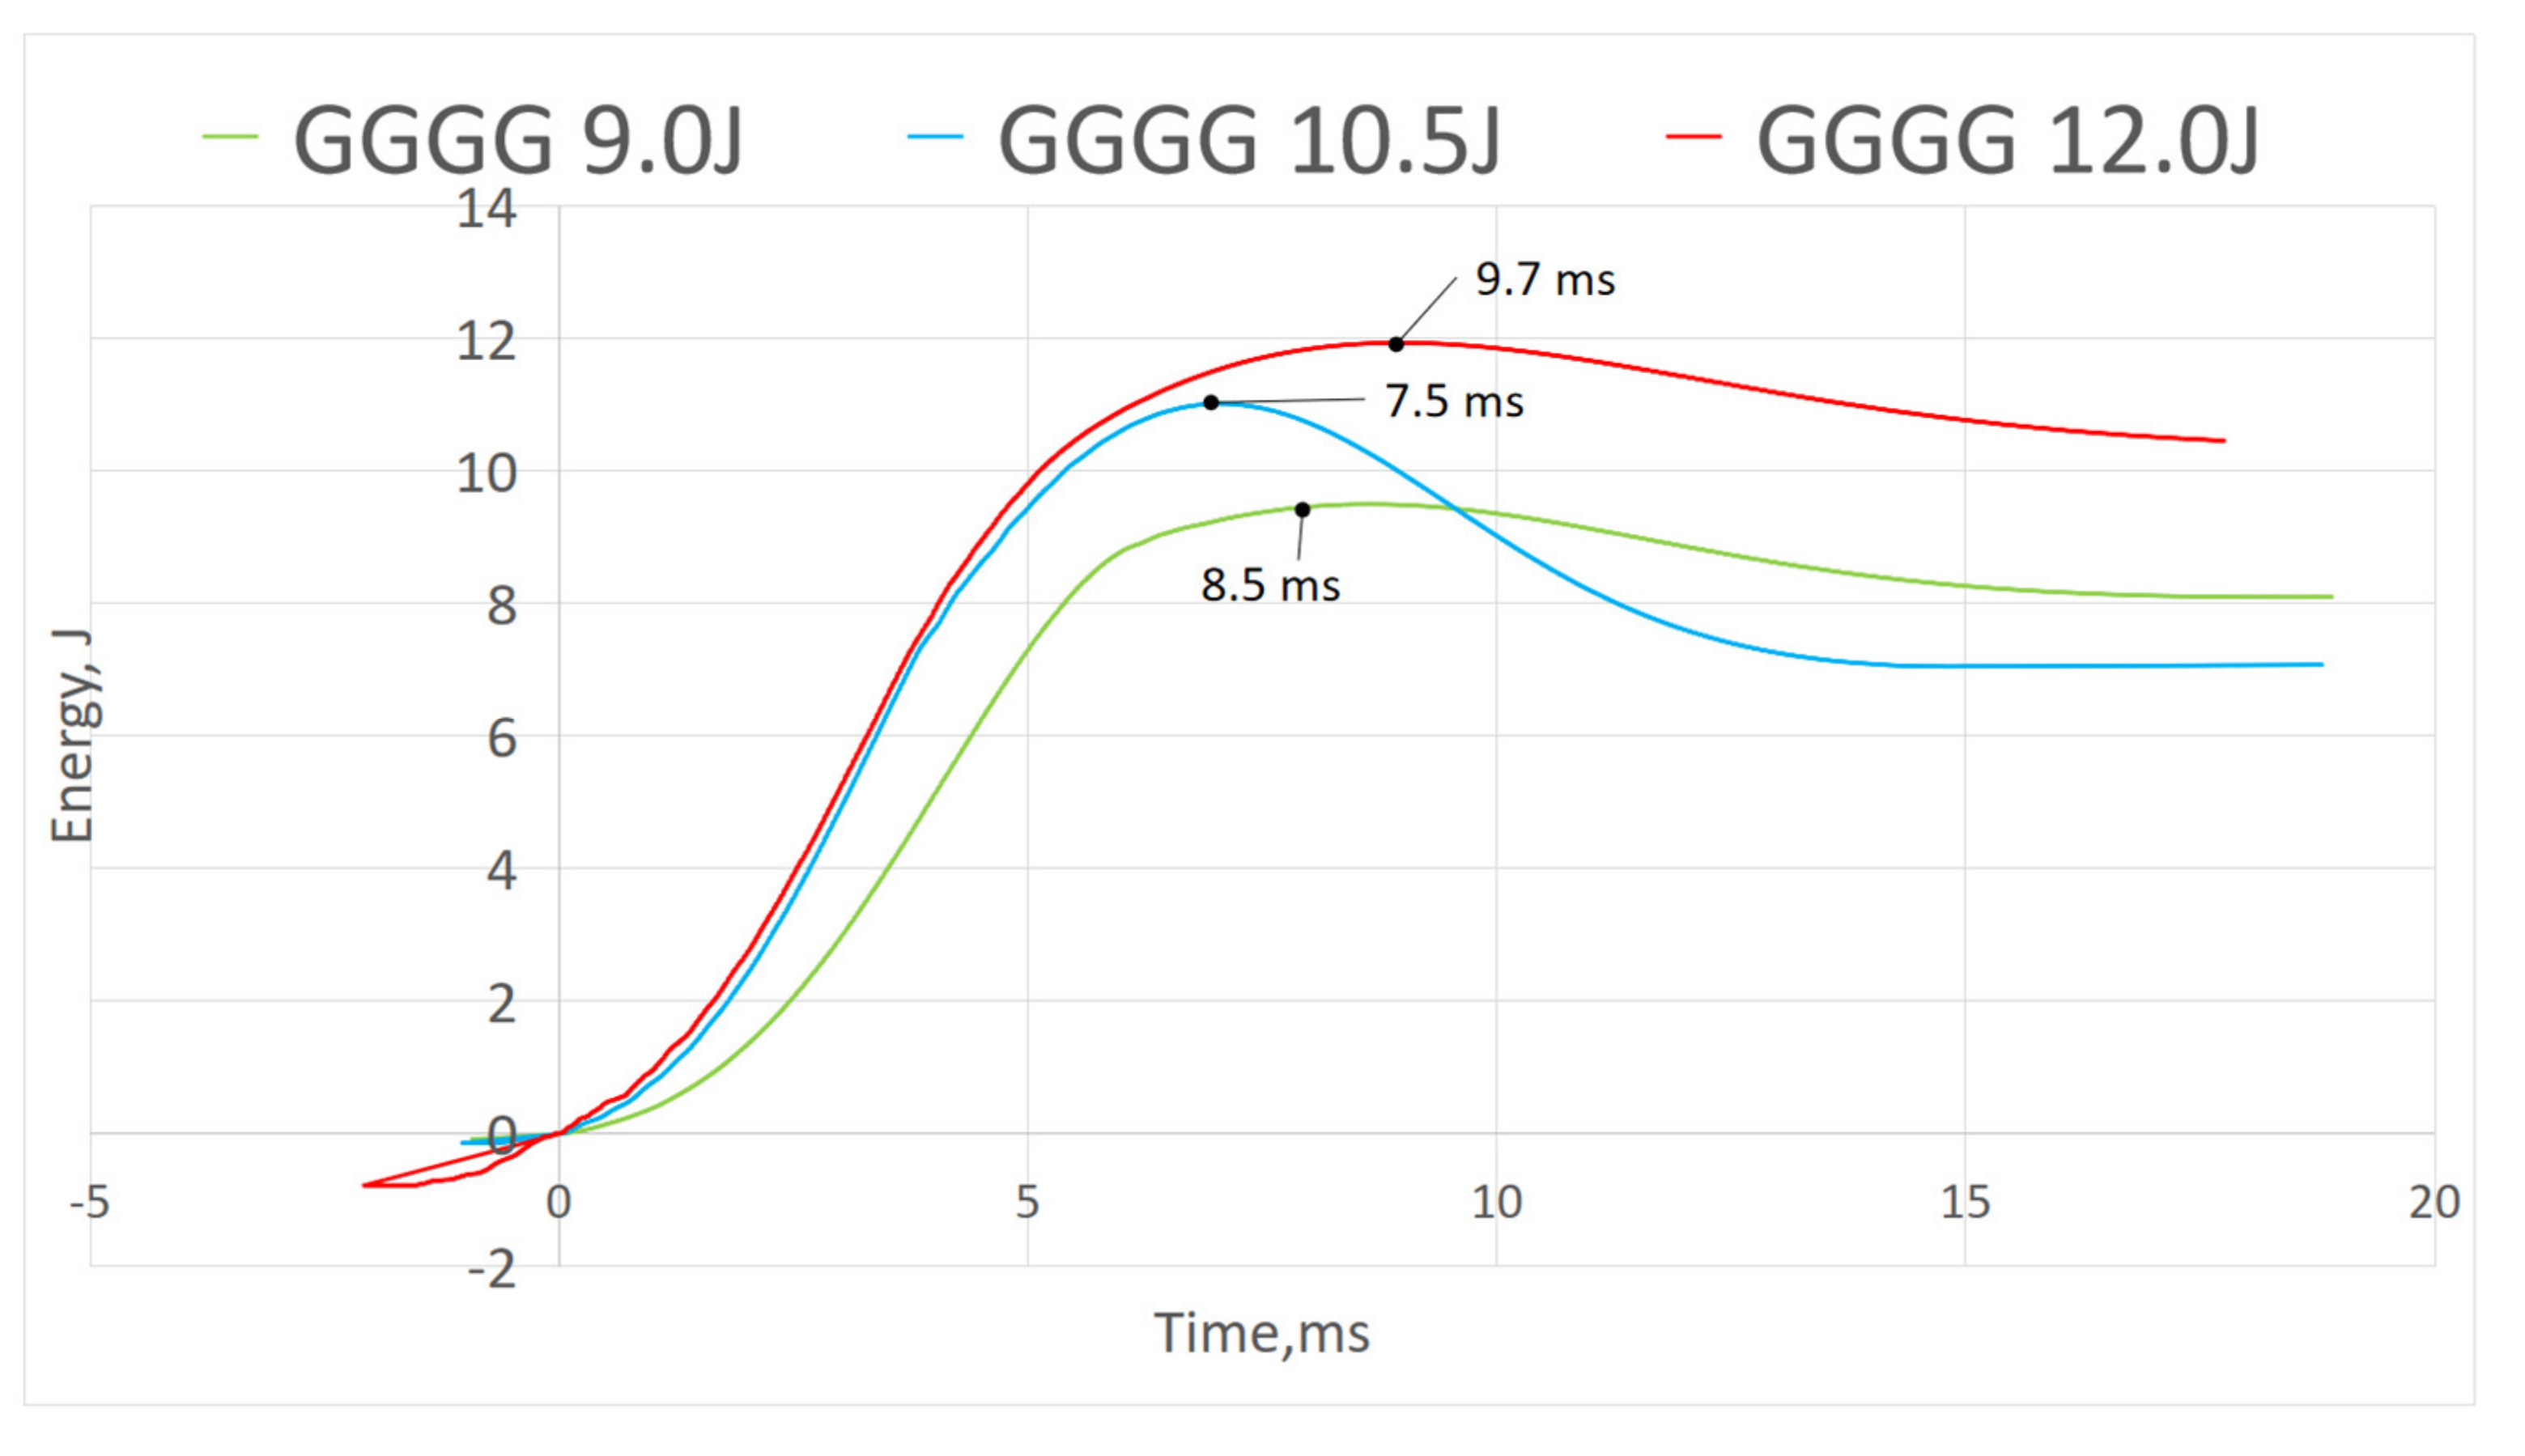
3.2.3. Energy–Time Curve
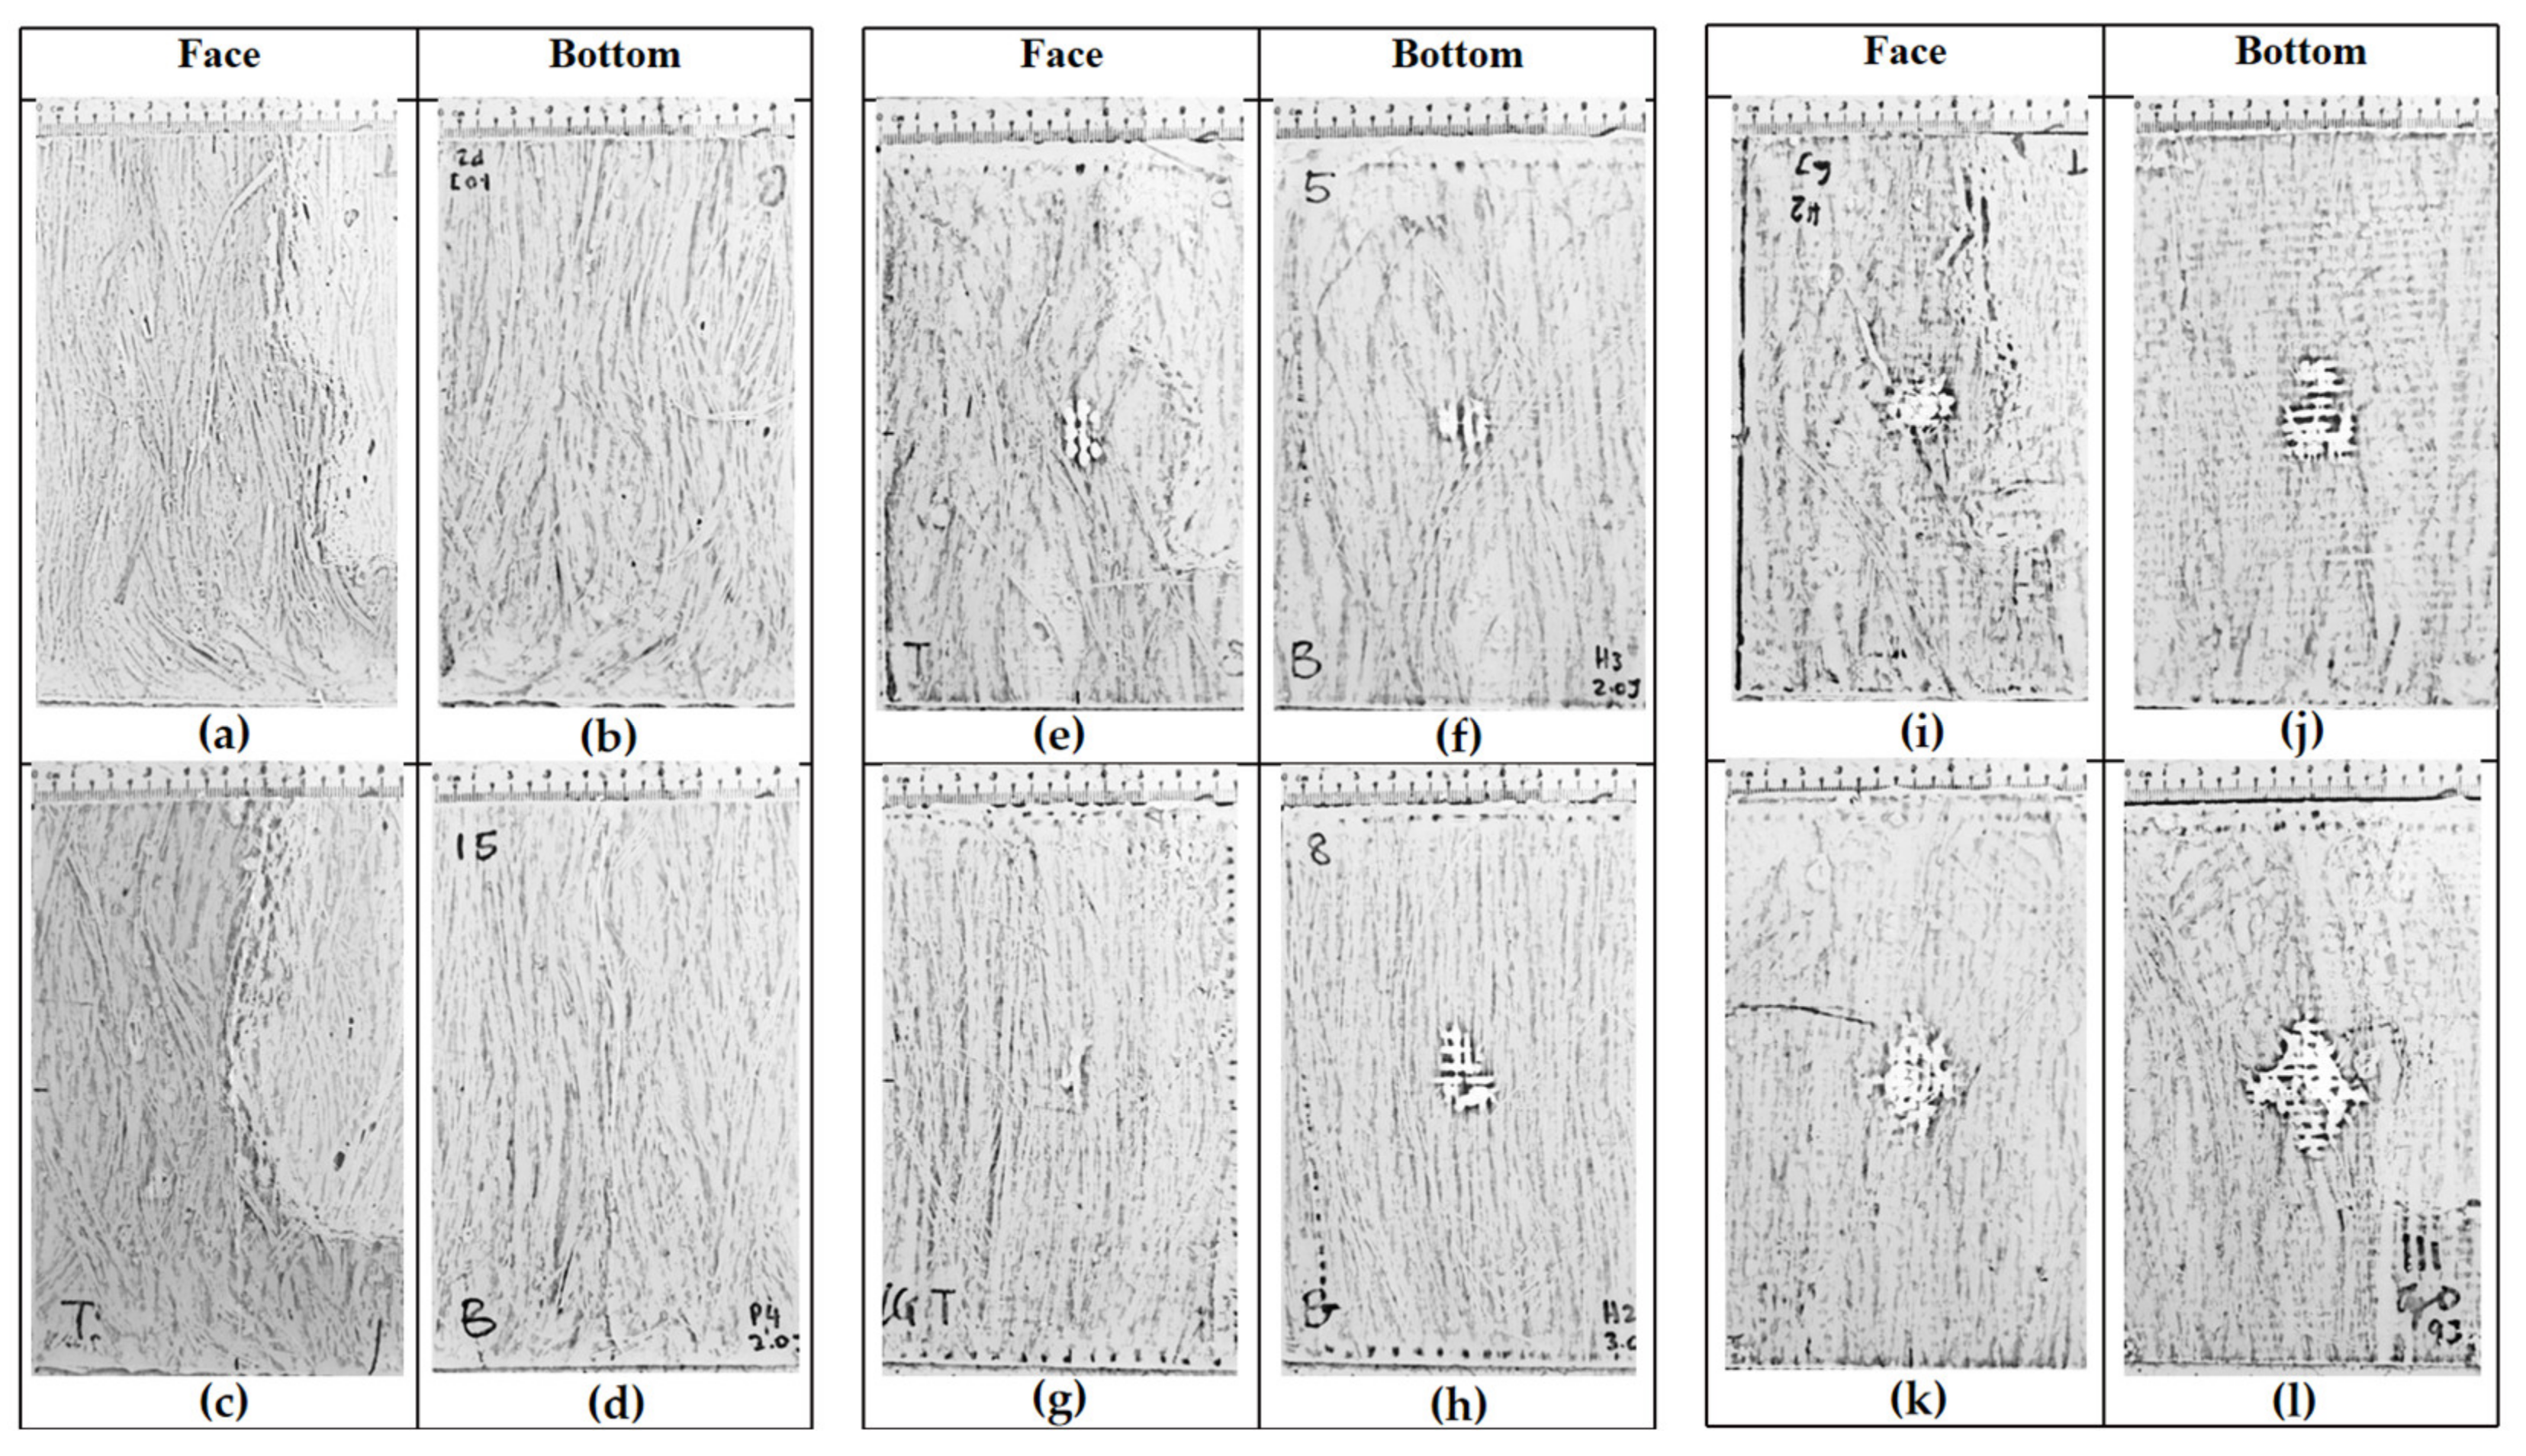
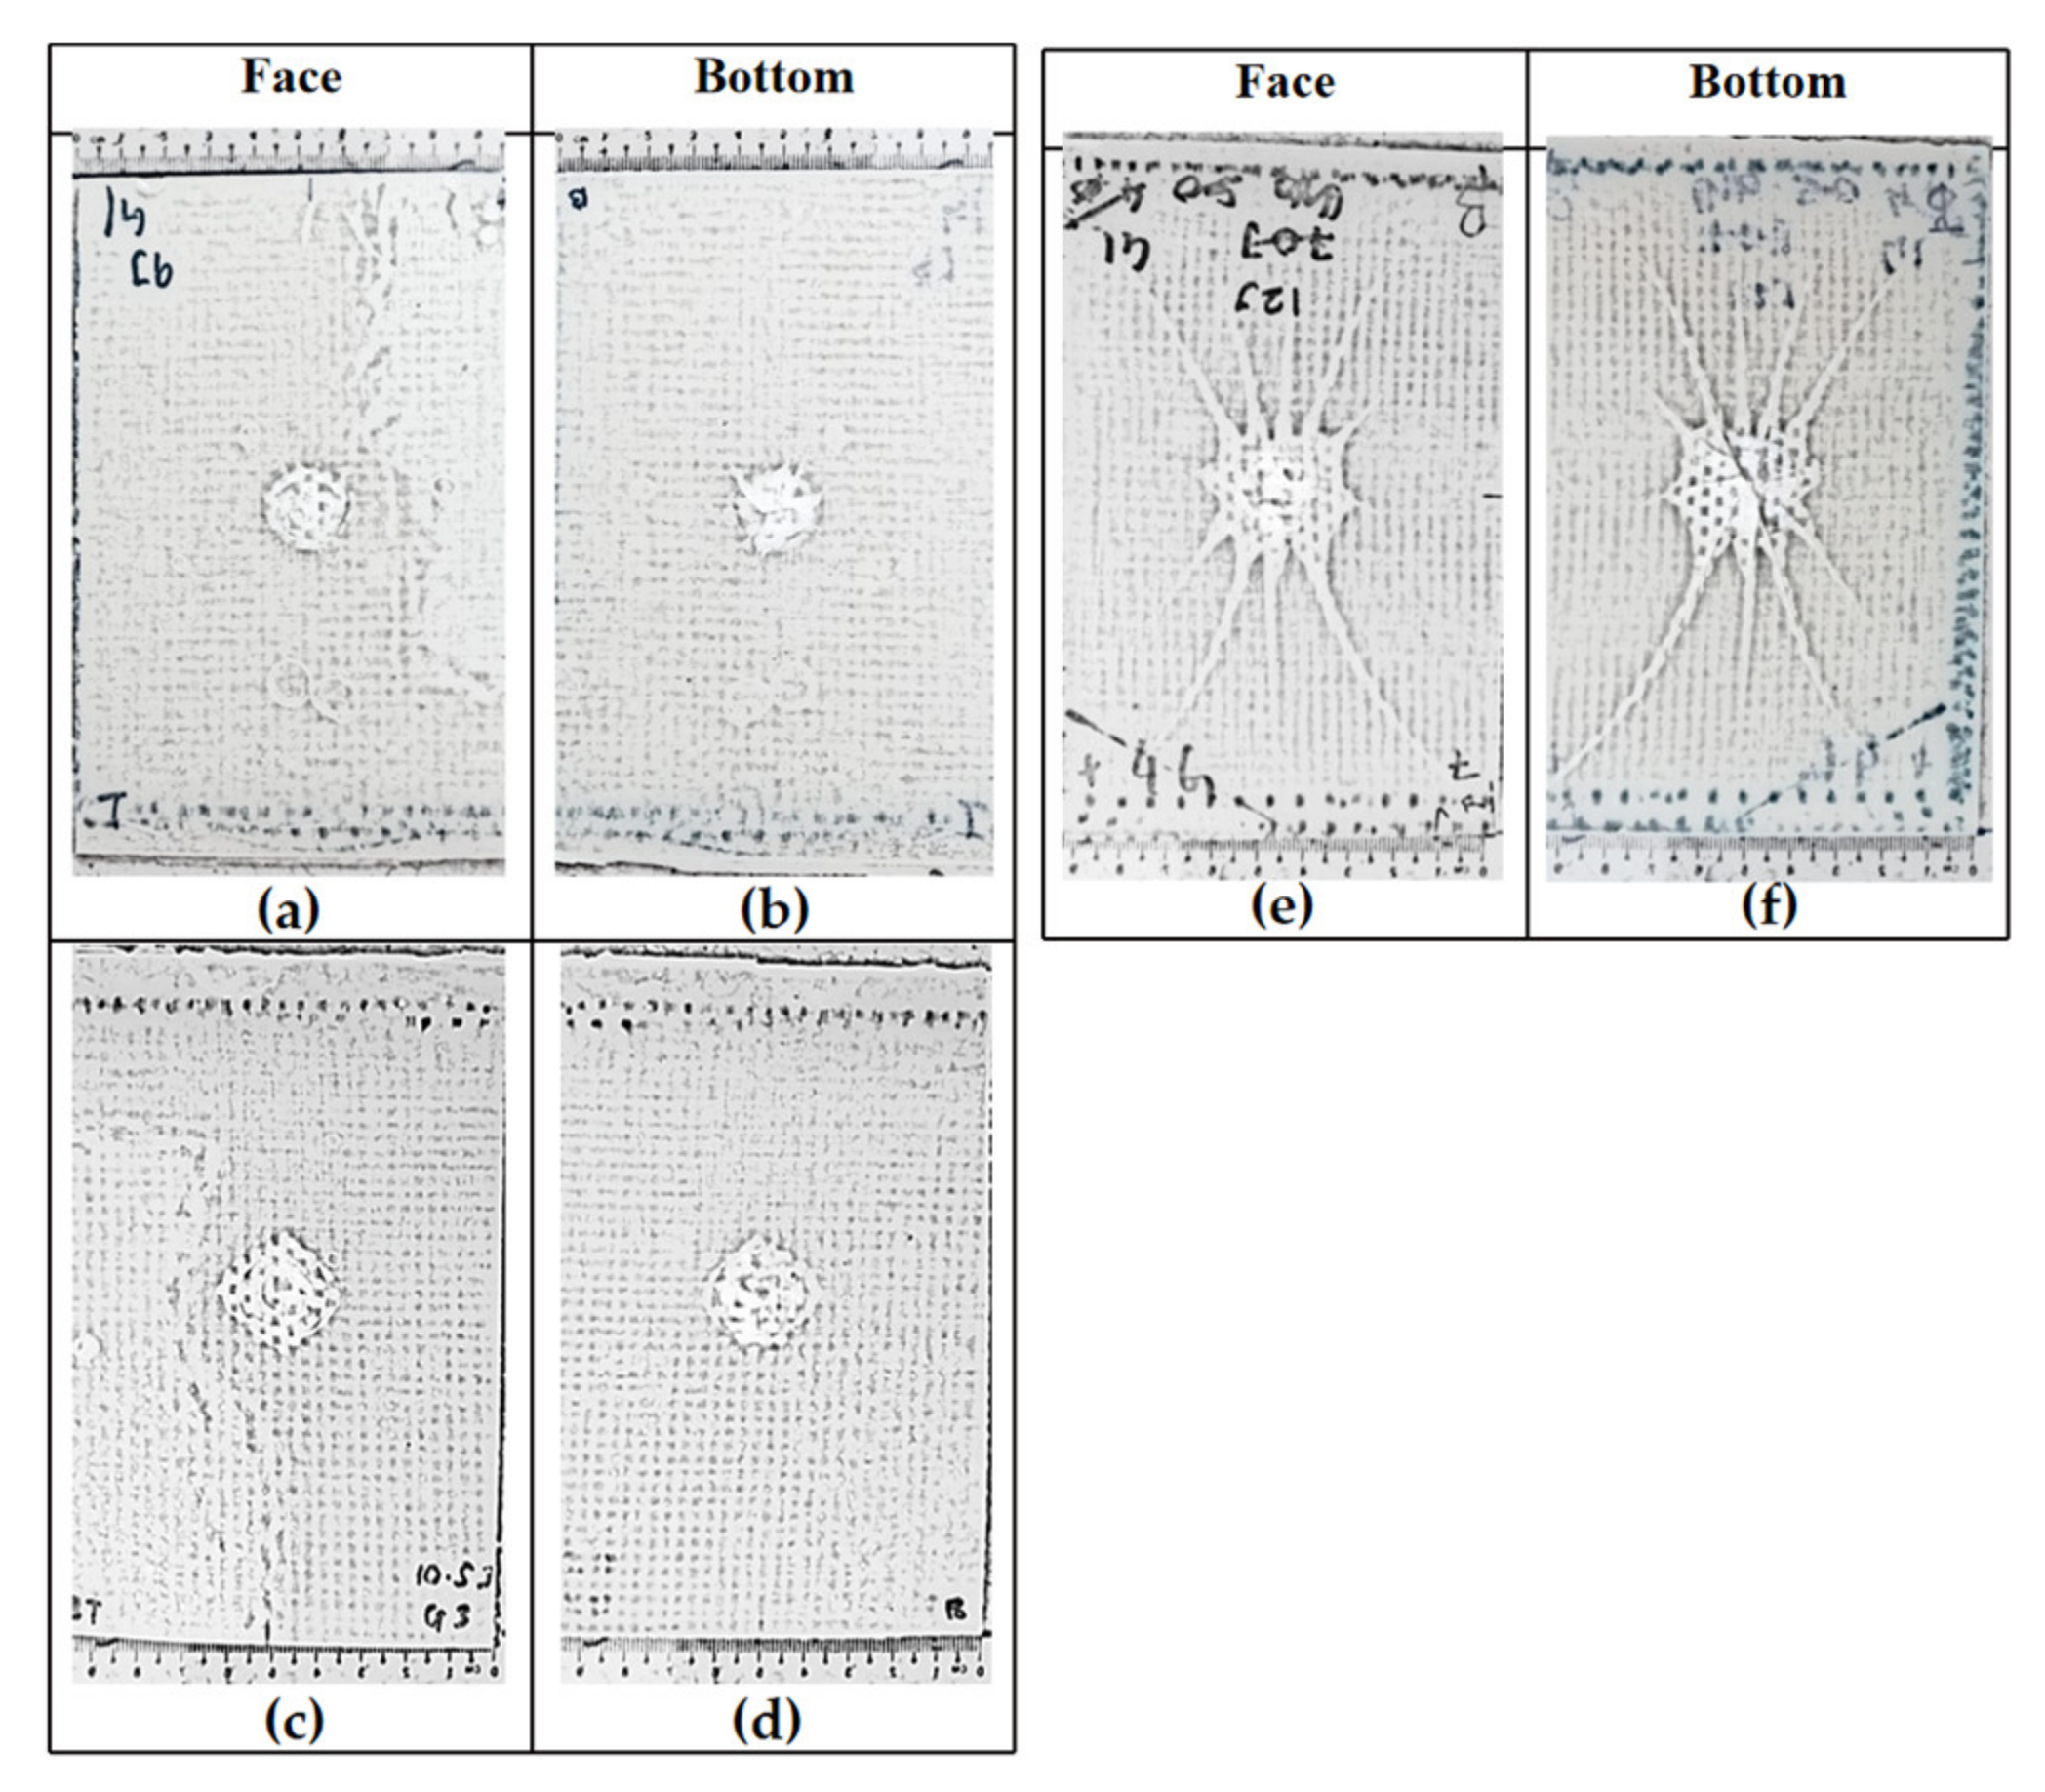
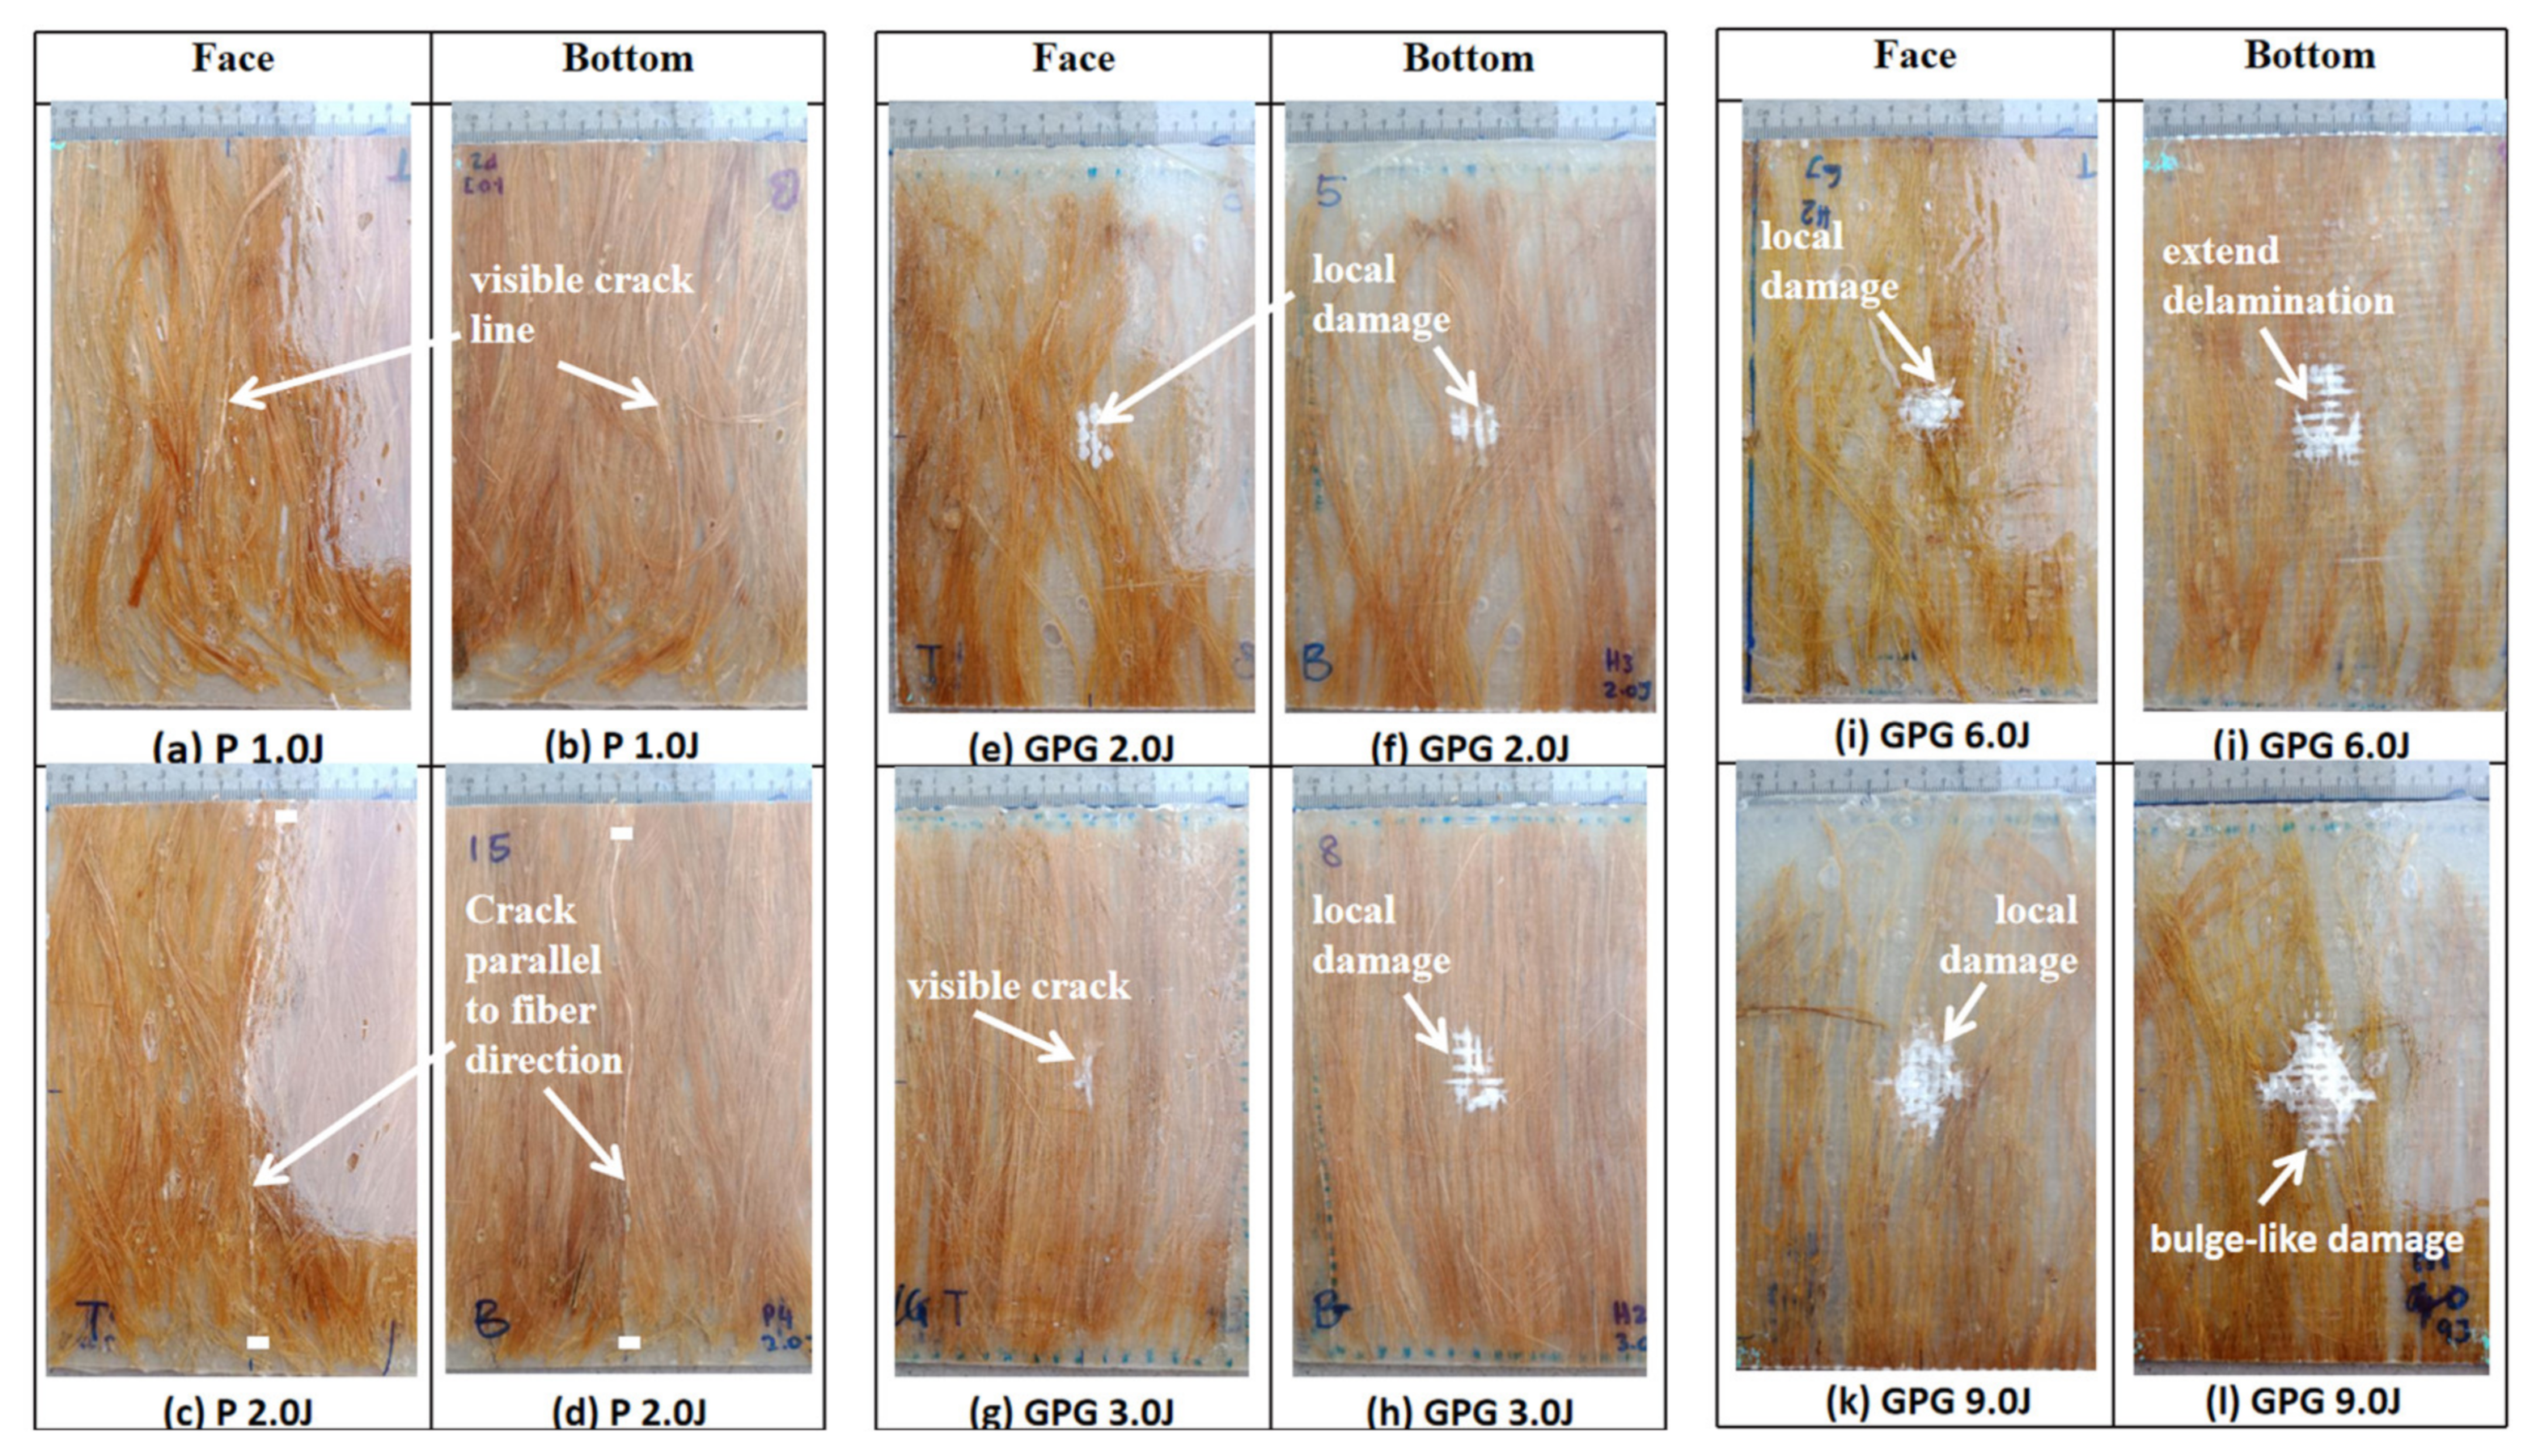
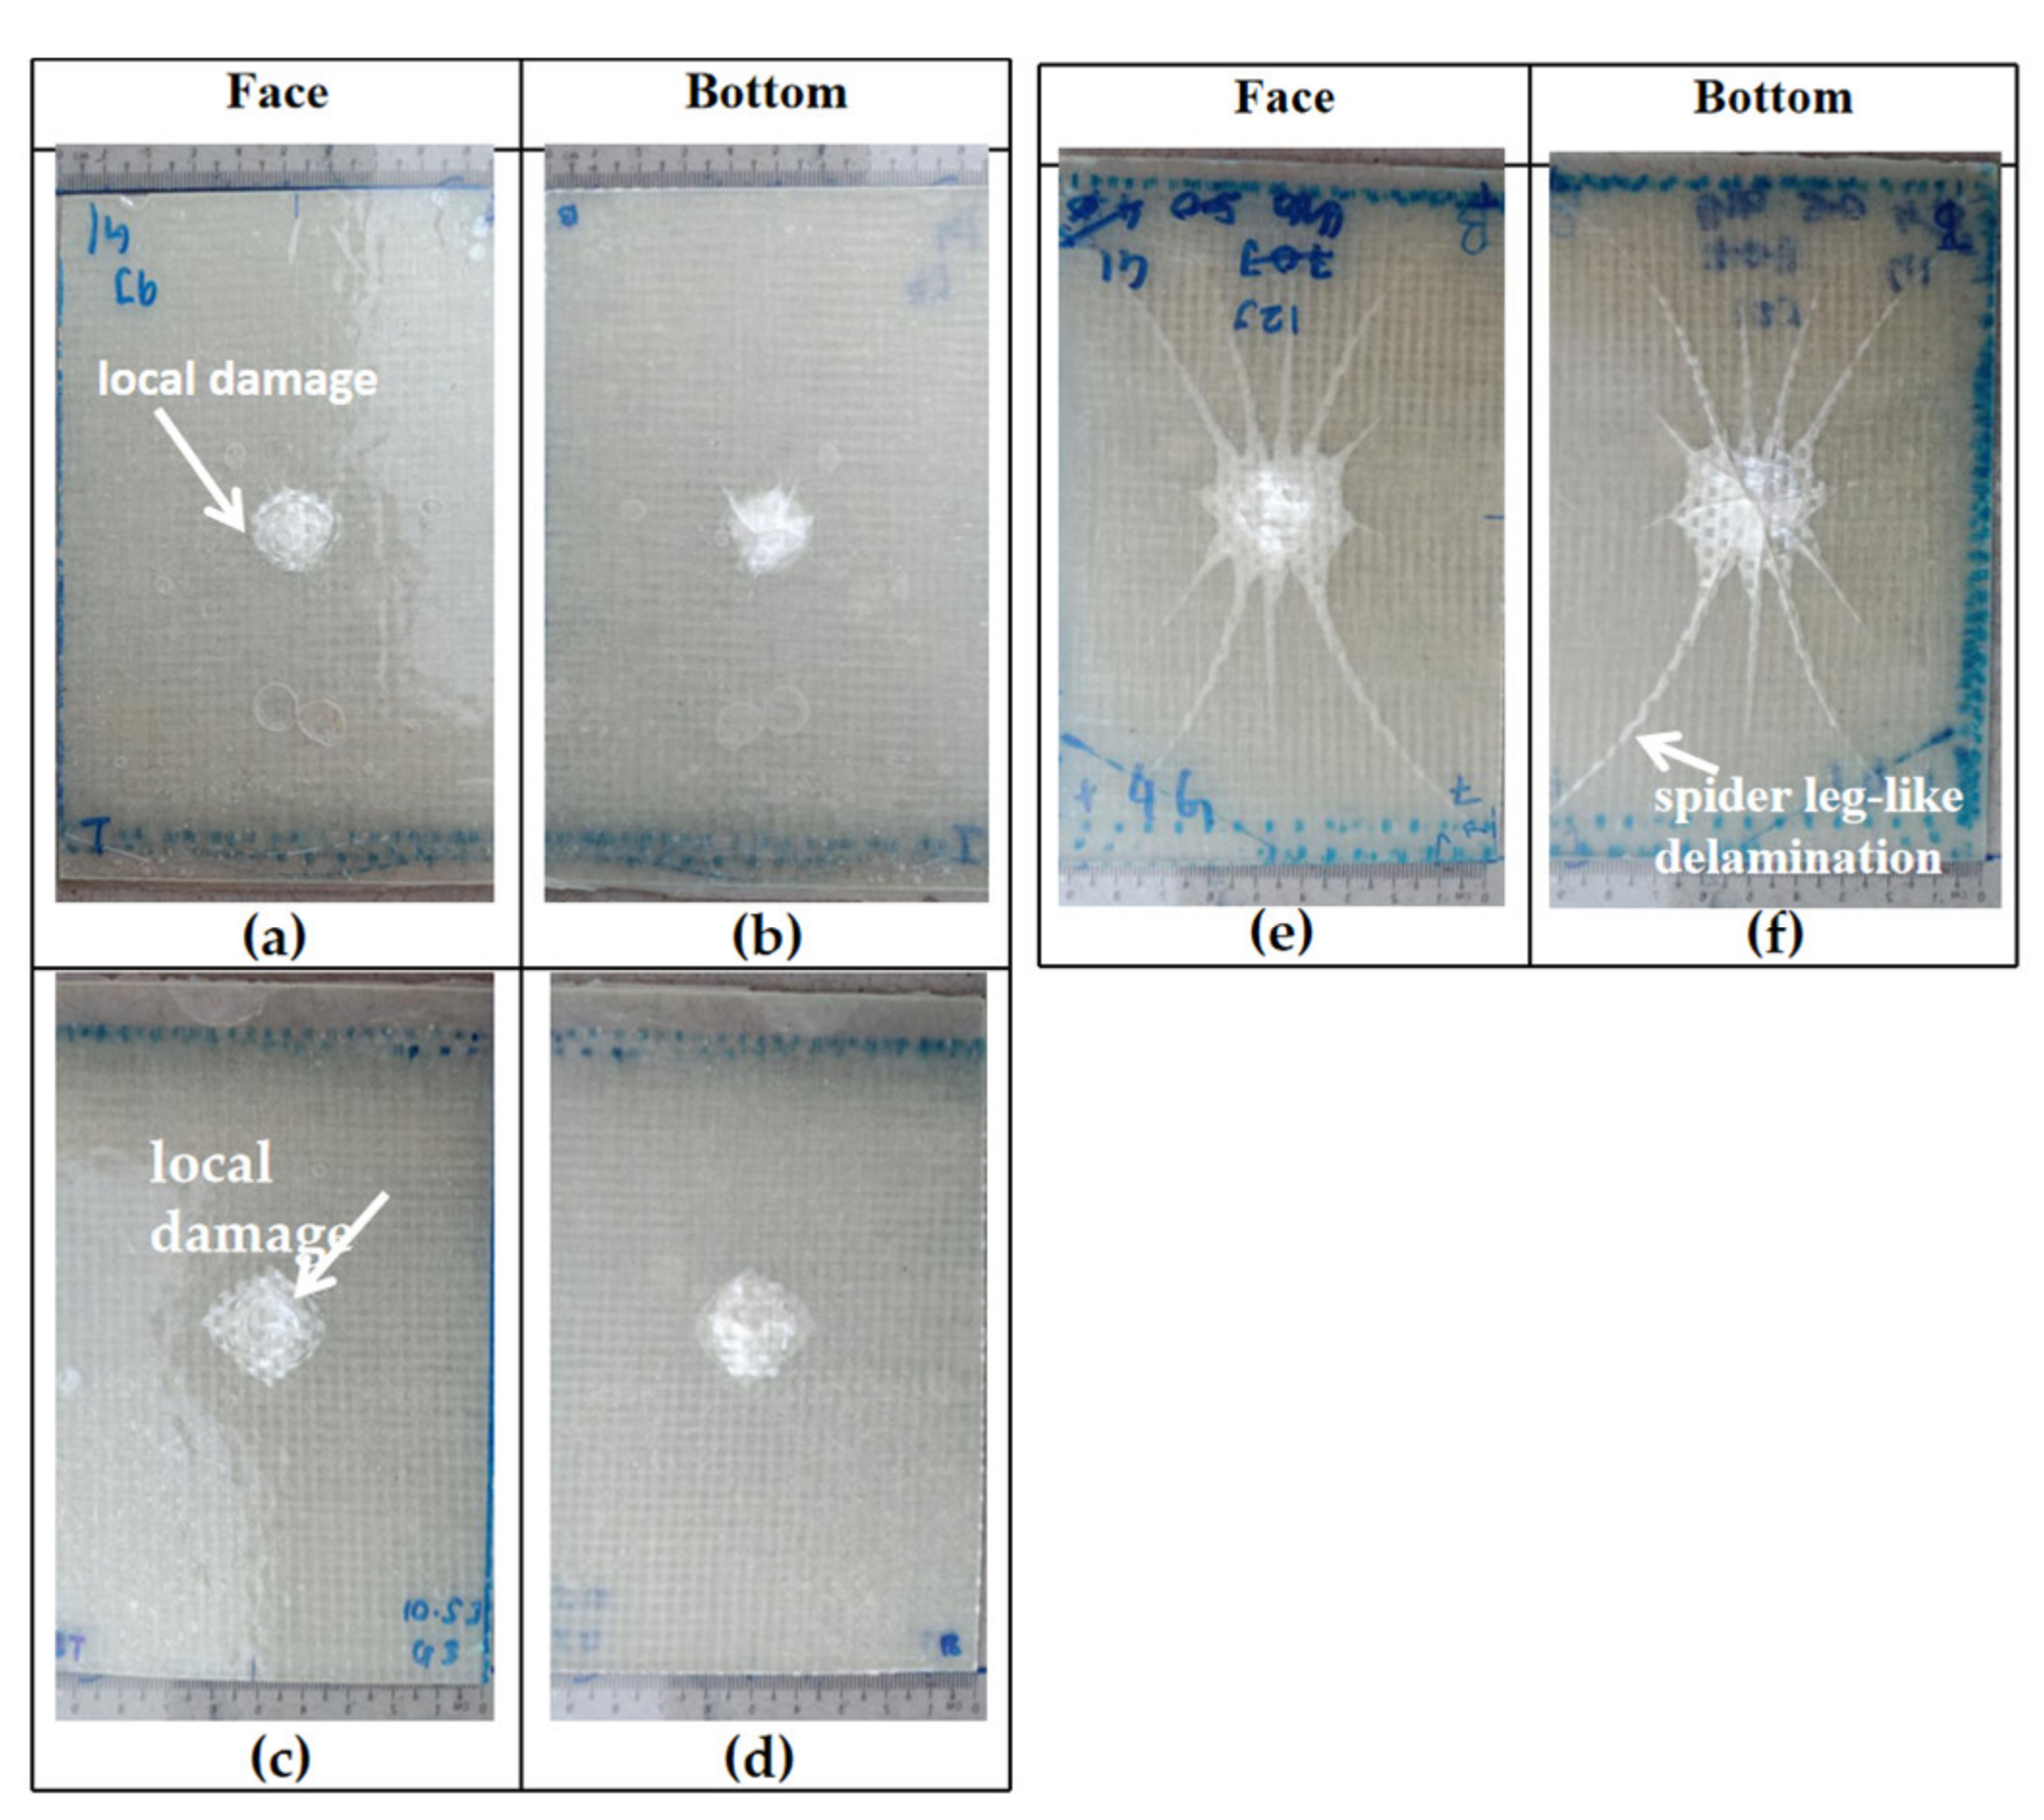
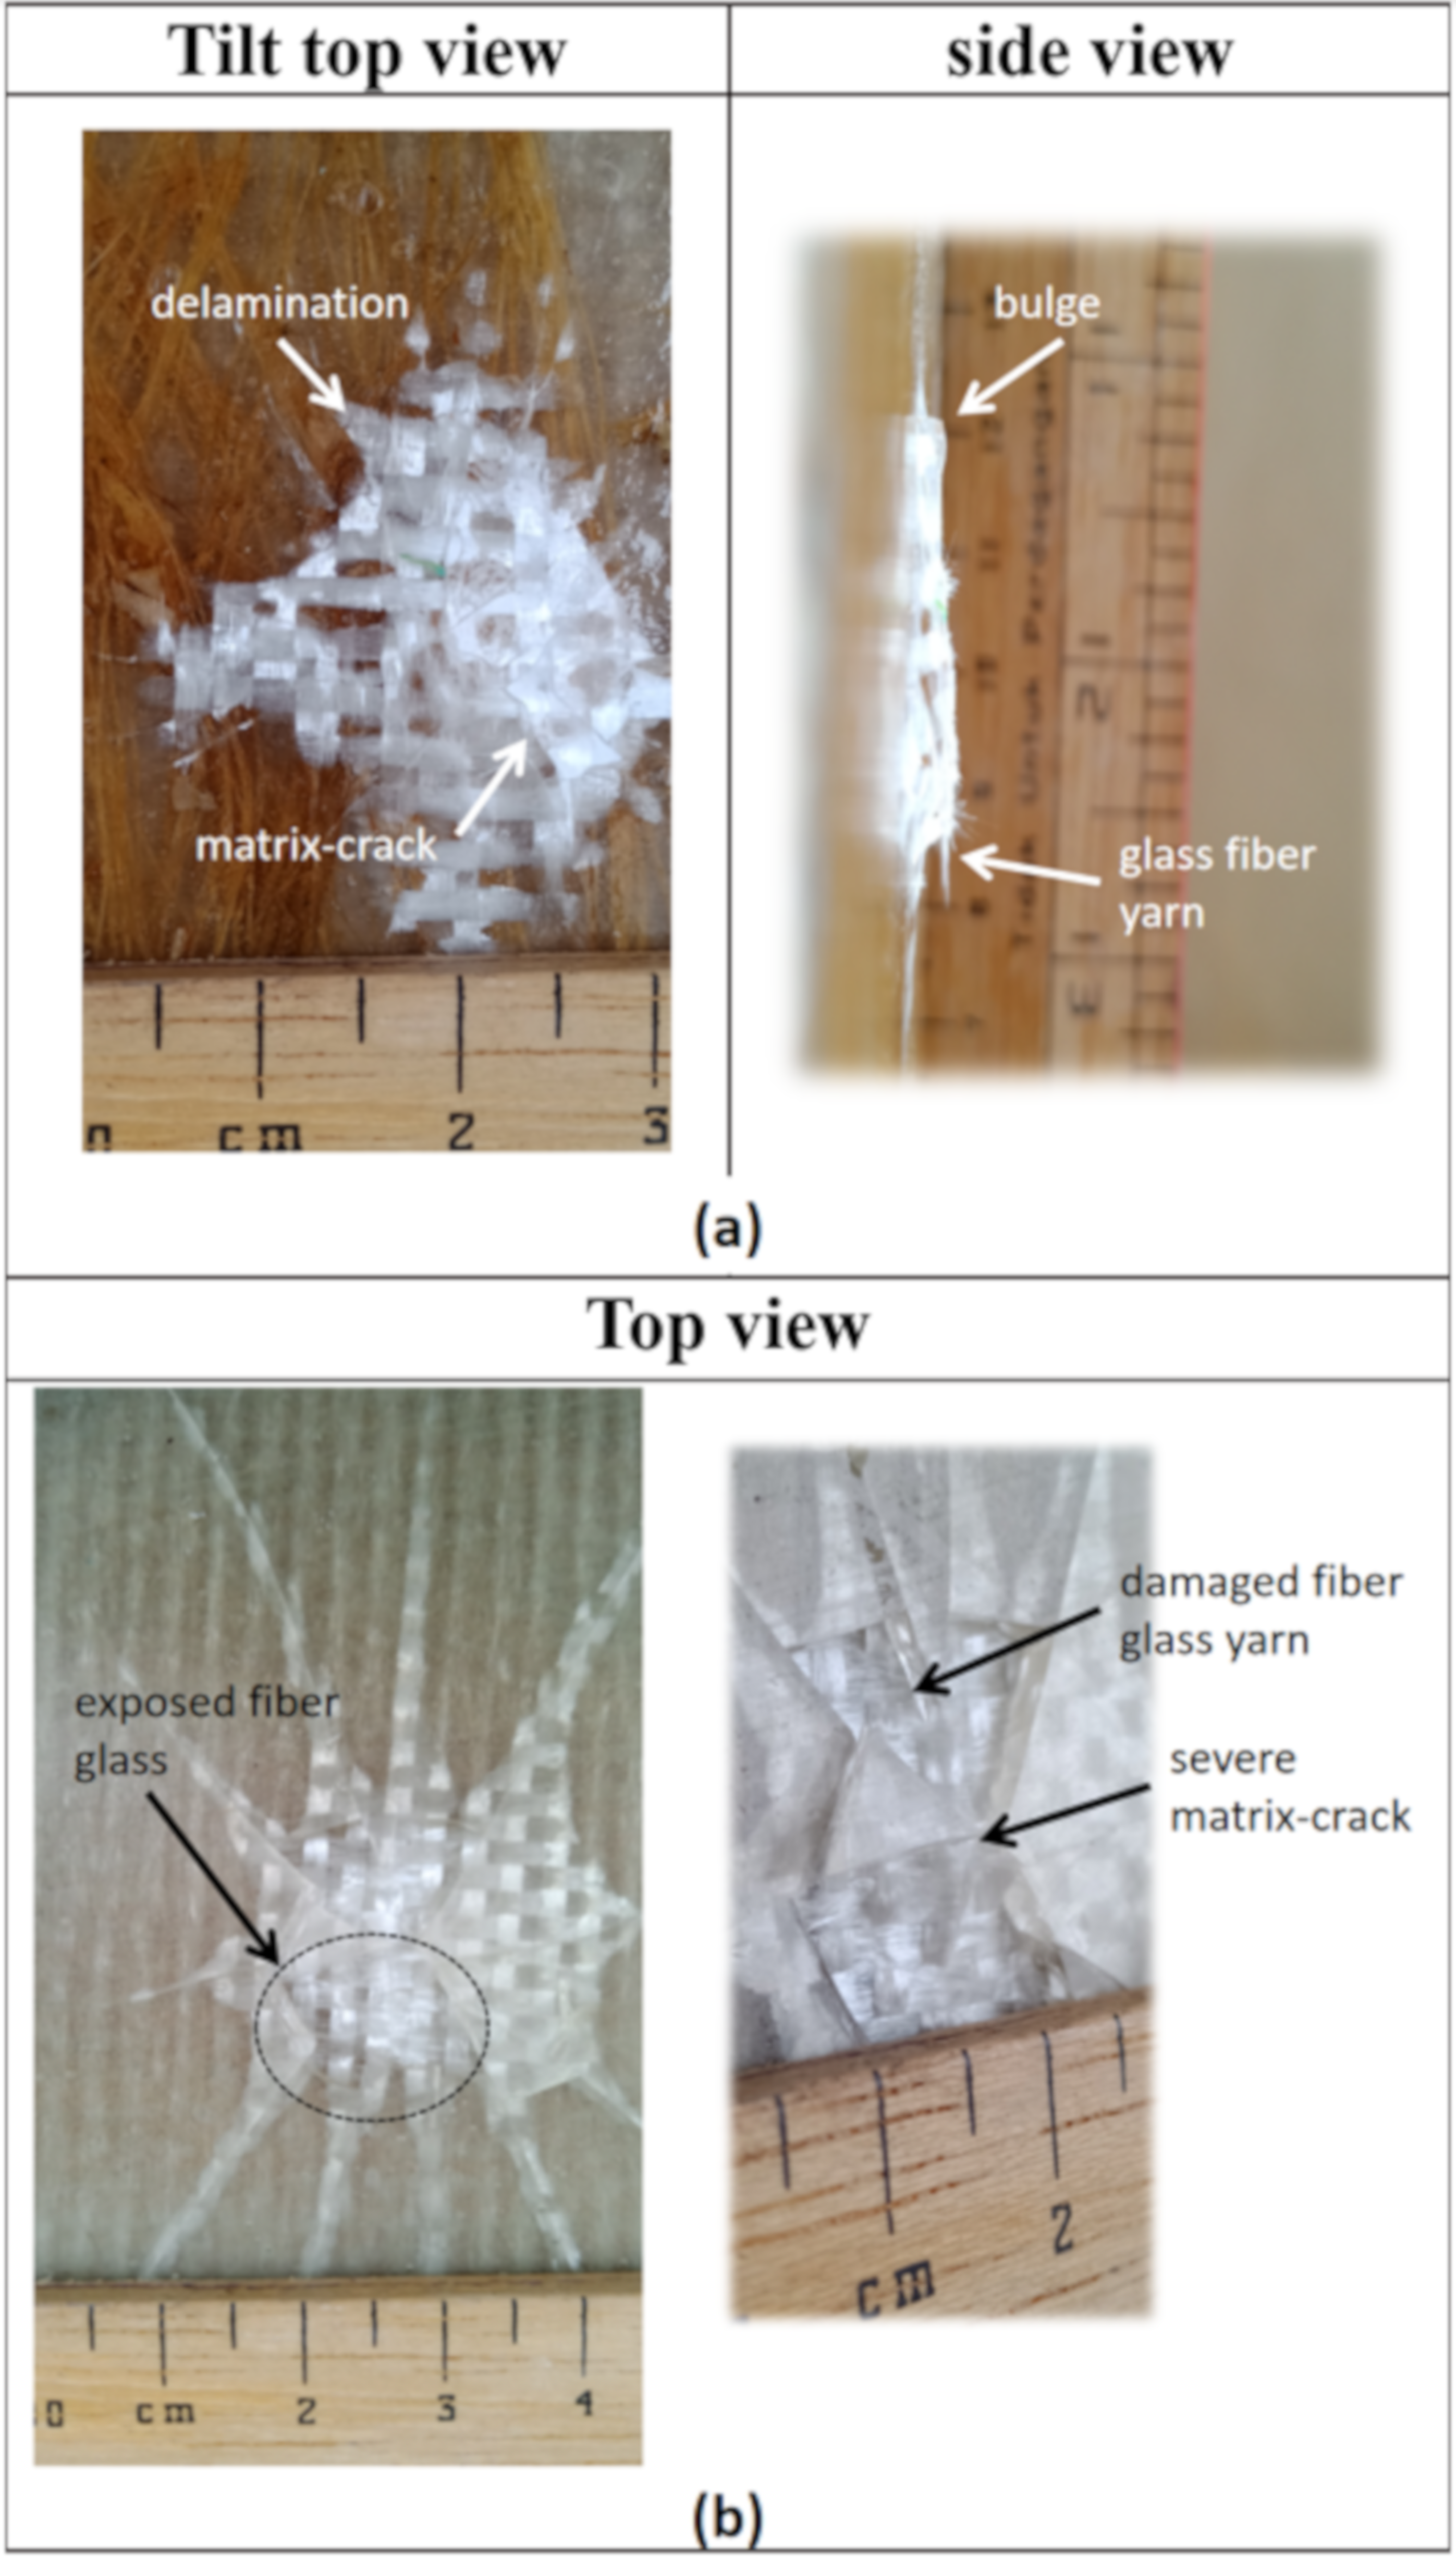
3.3. Visual Inspection
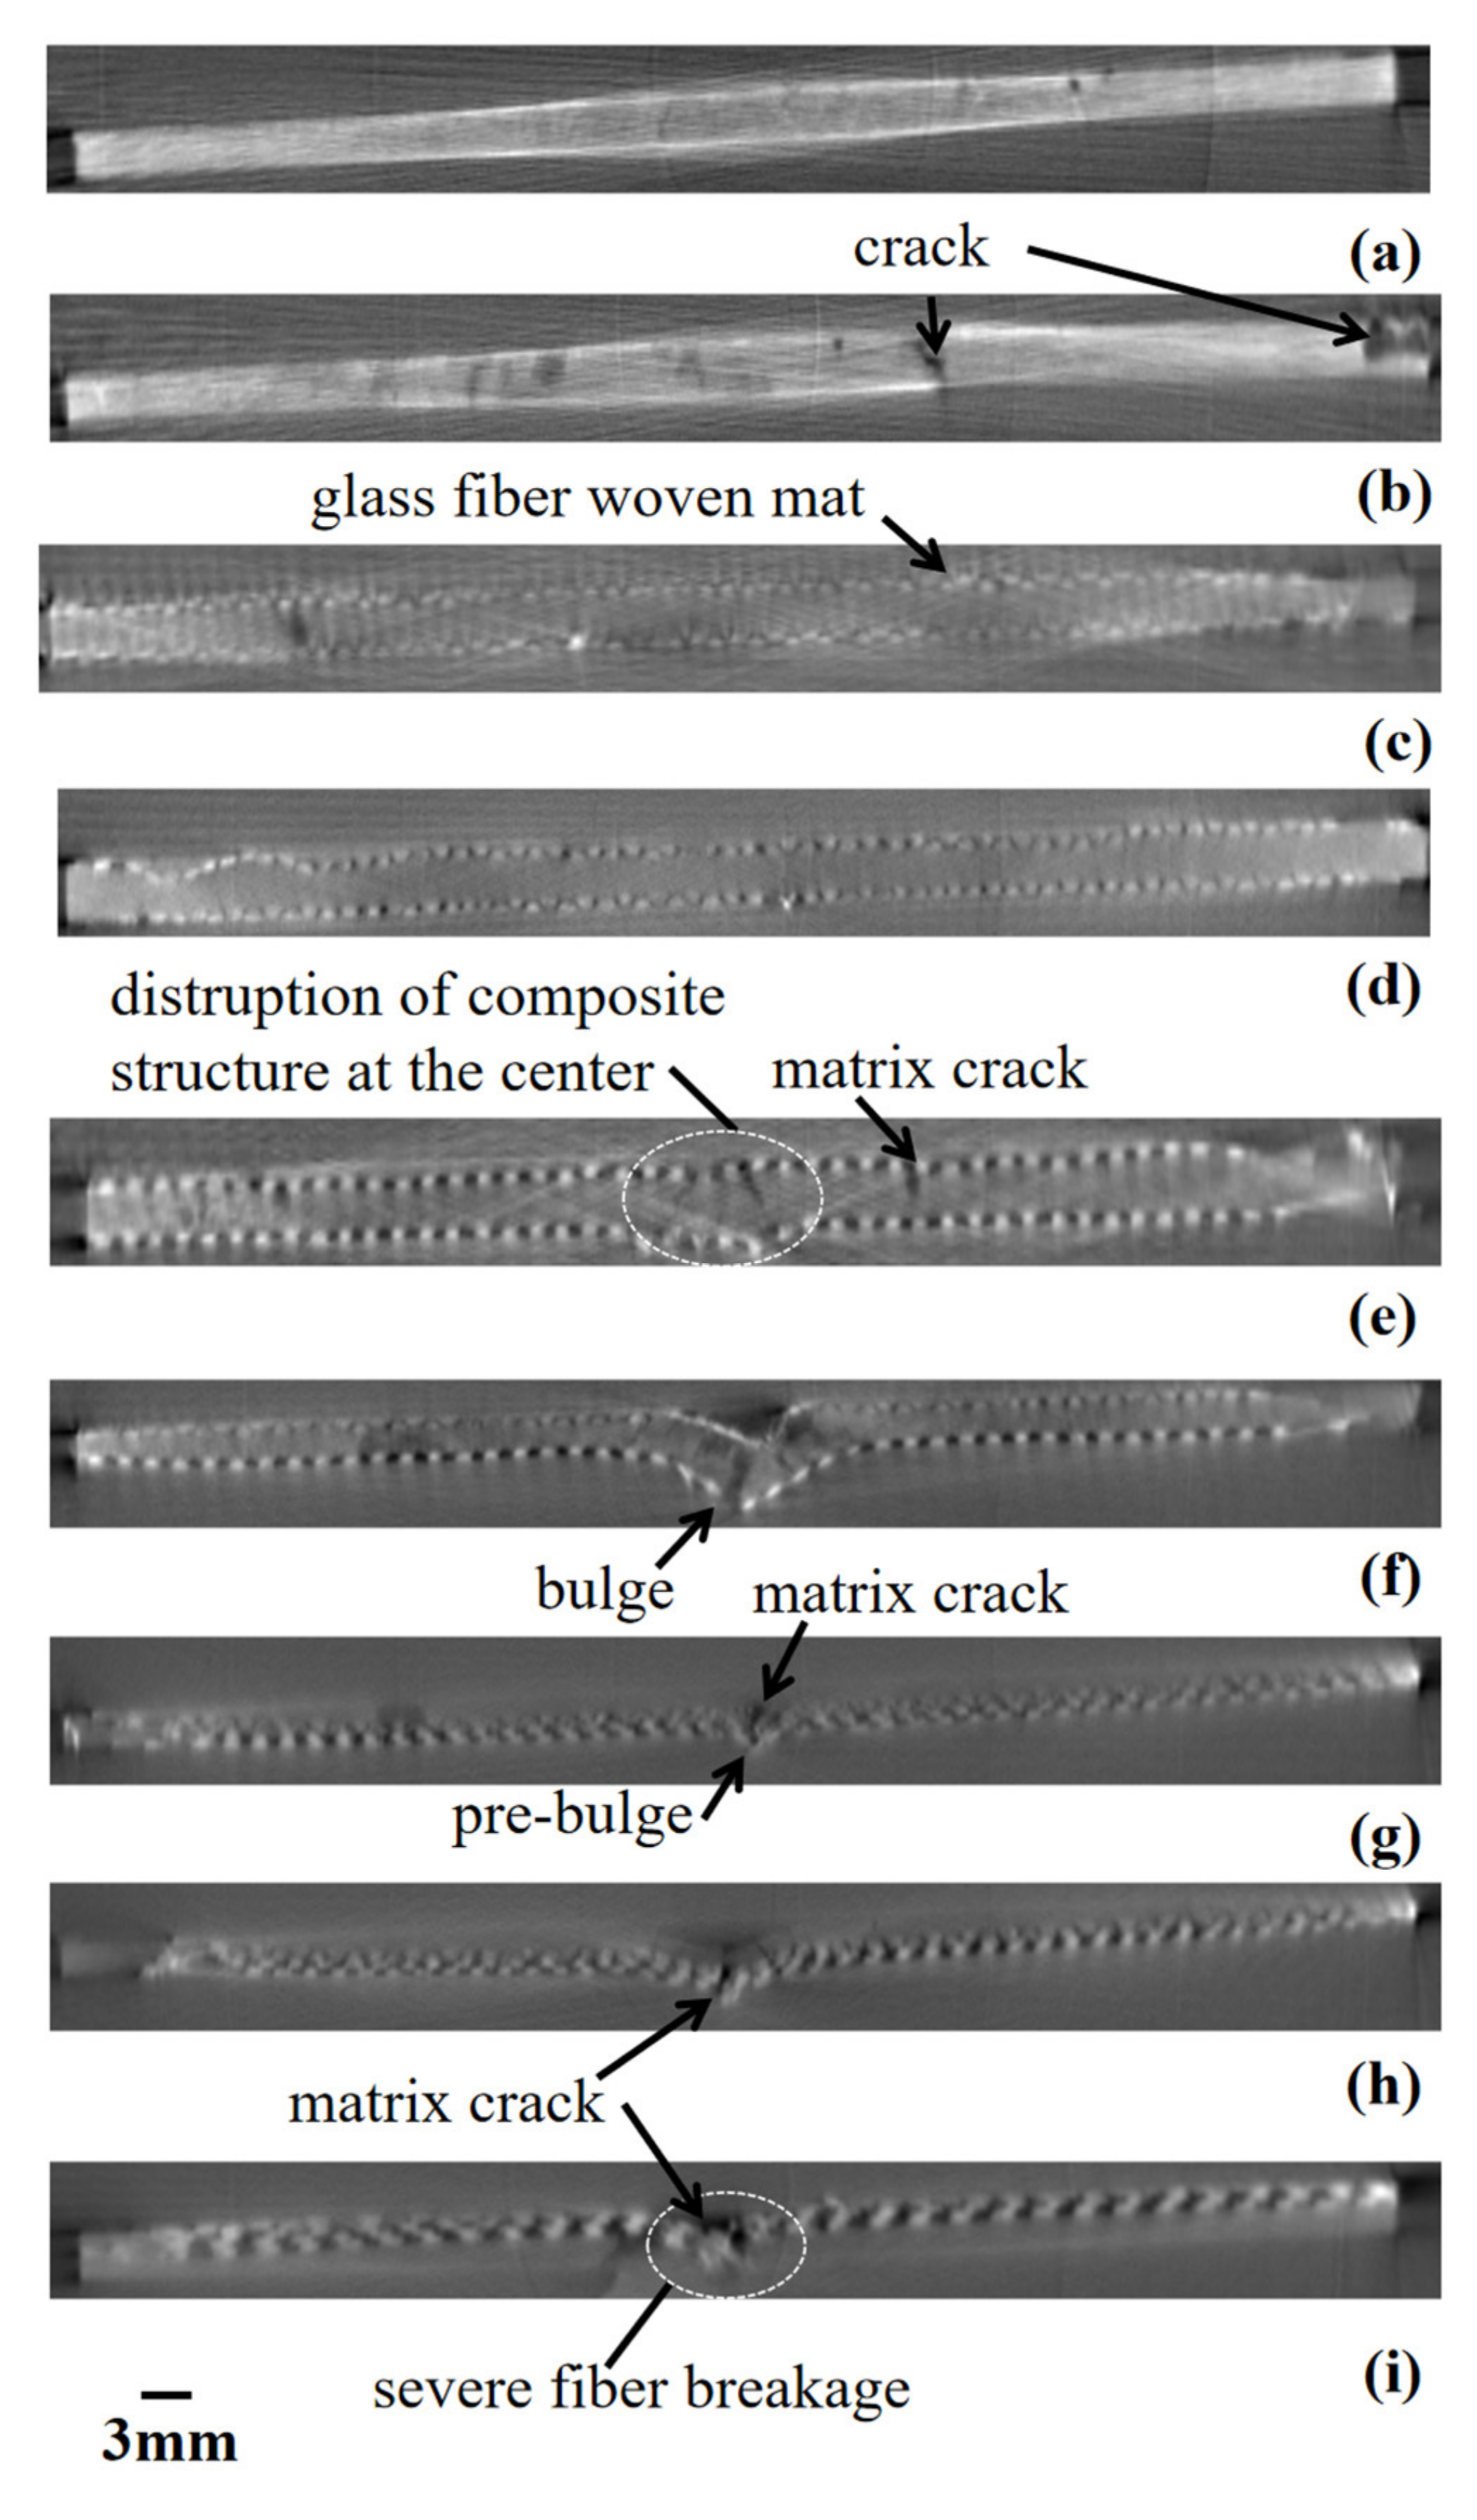
3.4. Cross-Section Damage Investigation by CT Scan Technique
4. Conclusions
Author Contributions
Funding
Data Availability Statement
Acknowledgments
Conflicts of Interest
References
- Chapman, M.; Dhakal, H.N. Effects of hybridisation on the low velocity falling weight impact and flexural properties of flax-carbon/epoxy hybrid composites. Fibers 2019, 7, 95. [Google Scholar] [CrossRef] [Green Version]
- Sarasini, F.; Tirillò, J.; Valente, M.; Valent, T.; Cioffi, S.; Iannace, S.; Sorrentino, L. Effect of basalt fiber hybridization on the impact behavior under low impact velocity of glass/basalt woven fabric/epoxy resin composites. Compos. Part A Appl. Sci. Manuf. 2013, 47, 109–123. [Google Scholar] [CrossRef]
- Aktaş, M.; Atas, C.; İçten, B.M.; Karakuzu, R. An experimental investigation of the impact response of composite laminates. Compos. Struct. 2009, 87, 307–313. [Google Scholar] [CrossRef]
- Barouni, A.K.; Dhakal, H.N. Damage investigation and assessment due to low-velocity impact on flax/glass hybrid composite plates. Compos. Struct. 2019, 226, 111224. [Google Scholar] [CrossRef]
- Nor, A.F.M.; Sultan, M.T.H.; Jawaid, M.; Azmi, A.M.R.; Shah, A.U.M. Analysing impact properties of CNT filled bamboo/glass hybrid nanocomposites through drop-weight impact testing, UWPI and compression-after-impact behaviour. Compos. Part B Eng. 2019, 168, 166–174. [Google Scholar] [CrossRef]
- Dhakal, H.N.; Méner, E.L.; Feldner, M.; Jiang, C.; Zhang, Z. Falling weight impact damage characterisation of flax and flax basalt vinyl ester hybrid composites. Polymers 2020, 12, 806. [Google Scholar] [CrossRef] [PubMed] [Green Version]
- Najeeb, M.I.; Sultan, M.T.H. Structural Health Monitoring: Sensing Device Technology in Recent Industrial Applications. In Structural Health Monitoring System for Synthetic, Hybrid and Natural Fiber Composites; Jawaid, M., Hamdan, A., Hameed Sultan, M.T., Eds.; Springer: Singapore, 2020; pp. 1–8. [Google Scholar]
- Seghini, M.C.; Tirillò, J.; Bracciale, M.P.; Touchard, F.; Chocinski-Arnault, L.; Zuorro, A.; Sarasini, F. Surface Modification of Flax Yarns by Enzymatic Treatment and Their Interfacial Adhesion with Thermoset Matrices. Appl. Sci. 2020, 10, 2910. [Google Scholar] [CrossRef]
- Vivek, S.; Kanthavel, K.; Torris, A.; Kavimani, V. Effect of bio-filler on hybrid sisal-Banana-Kenaf-flax based epoxy composites: A statistical correlation on flexural strength. J. Bionic. Eng. 2020, 17, 1263–1271. [Google Scholar] [CrossRef]
- Shenoy Heckadka, S.; Pai Ballambat, R.; Kini Manjeshwar, V.; Kumar, M.; Hegde, P.; Kamath, A. Influence of stack sequence on the mechanical characteristics of hybrid composites analyzed using cone beam computed tomography and scanning electron microscopy. Polym. Compos. 2020, 41, 5059–5071. [Google Scholar] [CrossRef]
- Matsubara, M.; Teramoto, S.; Nagatani, A.; Kawamura, S.; Tsujiuchi, N.; Ito, A.; Furuta, S. Effect of Fiber Orientation on Nonlinear Damping and Internal Microdeformation in Short-Fiber-Reinforced Natural Rubber. Exp. Tech. 2020, 45, 37–41. [Google Scholar] [CrossRef]
- Saeedifar, M.; Saleh, M.N.; El-Dessouky, H.M.; De Freitas, S.T.; Zarouchas, D. Damage assessment of NCF, 2D and 3D woven composites under compression after multiple-impact using acoustic emission. Compos. Part A Appl. Sci. Manuf. 2020, 132, 105833. [Google Scholar] [CrossRef]
- Najeeb, M.I.; Sultan, M.T.H.; Andou, Y.; Shah, A.U.M.; Eksiler, K.; Jawaid, M.; Ariffin, A.H. Characterization of Lignocellulosic Biomass from Malaysian’s Yankee Pineapple AC6 Toward Composite Application. J. Nat. Fibers 2020, 00, 1–13. [Google Scholar] [CrossRef]
- Najeeb, M.I.; Sultan, M.T.; Andou, Y.; Shah, A.U.M.; Eksiler, K.; Jawaid, M.; Ariffin, A.H. Characterization of silane treated Malaysian Yankee Pineapple AC6 leaf fiber (PALF) towards industrial applications. J. Mater. Res. Technol. 2020, 9, 3128–3139. [Google Scholar] [CrossRef]
- Shah, A.U.M.; Sultan, M.T.H.; Safri, S.N.A. Experimental Evaluation of Low Velocity Impact Properties and Damage Progression on Bamboo/Glass Hybrid Composites Subjected to Different Impact Energy Levels. Polymers 2020, 12, 1288. [Google Scholar] [CrossRef]
- Patel, A.; Kravchenko, O.; Manas-Zloczower, I. Effect of curing rate on the microstructure and macroscopic properties of epoxy fiberglass composites. Polymers 2018, 10, 125. [Google Scholar] [CrossRef] [Green Version]
- Jain, J.; Jain, S.; Sinha, S. Characterization and thermal kinetic analysis of pineapple leaf fibers and their reinforcement in epoxy. J. Elastomers Plast. 2019, 51, 224–243. [Google Scholar] [CrossRef]
- Reddy, M.V.K.; Lakshmi, R.V.S.; Pragathi, Y.; Devaraj, P.; Naresh, N. Evaluation of mechanical properties: Influence of glass fiber on banana fiber reinforced with epoxy composite. Mater. Today Proc. 2021, 37, 1305–1312. [Google Scholar] [CrossRef]
- Akil, H.M.; De Rosa, I.M.; Santulli, C.; Sarasini, F. Flexural behaviour of pultruded jute/glass and kenaf/glass hybrid composites monitored using acoustic emission. Mater. Sci. Eng. A 2010, 527, 2942–2950. [Google Scholar] [CrossRef]
- Shesan, O.J.; Stephen, A.C.; Chioma, A.G.; Neerish, R.; Rotimi, S.E. Fiber-matrix relationship for composites preparation. In Renewable and Sustainable Composites; António, P., Fabio, F., Eds.; IntechOpen: London, UK, 2019; pp. 1–30. [Google Scholar]
- Rajak, D.K.; Pagar, D.D.; Menezes, P.L.; Linul, E. Fiber-reinforced polymer composites: Manufacturing, properties, and applications. Polymers 2019, 11, 1667. [Google Scholar] [CrossRef] [PubMed] [Green Version]
- Cavalcanti, D.K.K.; Banea, M.D.; Neto, J.S.S.; Lima, R.A.A.; da Silva, L.F.M.; Carbas, R.J.C. Mechanical characterization of intralaminar natural fibre-reinforced hybrid composites. Compos. Part. B Eng. 2019, 175, 107149. [Google Scholar] [CrossRef]
- Lu, N.; Swan, R.H., Jr.; Ferguson, I. Composition, structure, and mechanical properties of hemp fiber reinforced composite with recycled high-density polyethylene matrix. J. Compos. Mater. 2012, 46, 1915–1924. [Google Scholar] [CrossRef]
- Bensadoun, F.; Depuydt, D.; Baets, J.; Verpoest, I.; Van Vuure, A.W. Low velocity impact properties of flax composites. Compos. Struct. 2017. [Google Scholar] [CrossRef]
- Vieille, B.; Pujols-Gonzalez, J.D.; Bouvet, C.; Breteau, T.; Gautrelet, C. Influence of impact velocity on impact behaviour of hybrid woven-fibers reinforced PEEK thermoplastic laminates. Compos. Part C Open Access 2020, 2, 100029. [Google Scholar] [CrossRef]
- Li, Z.; Khennane, A.; Hazell, P.J.; Brown, A.D. Impact Behaviour of Pultruded GFRP Composites under Low-velocity Impact Loading. Compos. Struct. 2017. [Google Scholar] [CrossRef]
- Majid, D.L.; Jamal, Q.M.; Manan, N.H. Low-velocity impact performance of glass fiber, kenaf fiber, and hybrid glass/kenaf fiber reinforced epoxy composite laminates. BioResources 2018, 13, 8839–8852. [Google Scholar] [CrossRef]
- De Vasconcellos, D.S.; Sarasini, F.; Touchard, F.; Chocinski-Arnault, L.; Pucci, M.; Santulli, C.; Tirillò, J.; Iannace, S.; Sorrentino, L. Influence of low velocity impact on fatigue behaviour of woven hemp fibre reinforced epoxy composites. Compos. Part B 2014. [Google Scholar] [CrossRef]
- Ismail, A.E.; Hassan, M.A. Low velocity impact on woven kenaf fiber reinforced composites. Appl. Mech. Mater. 2014, 629, 503–506. [Google Scholar] [CrossRef]
- Dhakal, H.N.; Zhang, Z.Y.; Richardson, M.O.W.; Errajhi, O.A.Z. The low velocity impact response of non-woven hemp fibre reinforced unsaturated polyester composites. Compos. Struct. 2007, 81, 559–567. [Google Scholar] [CrossRef]
- Ravandi, M.; Teo, W.S.; Tran, L.Q.N.; Yong, M.S.; Tay, T.E. Low velocity impact performance of stitched flax/epoxy composite laminates. Compos. Part B Eng. 2017, 117, 89–100. [Google Scholar] [CrossRef]
- Fadzullah, S.S.M.; Ramli, S.N.N.; Mustafa, Z.; Razali, A.S.; Sivakumar, D.; Ismail, I. Low Velocity Impact Behaviour Of Pineapple Leaf Fibre Reinforced Polylactic Acid Biocomposites. J. Adv. Manuf. Technol. 2020, 14, 5854. [Google Scholar]
- Militello, C.; Bongiorno, F.; Epasto, G.; Zuccarello, B. Low-velocity impact behaviour of green epoxy biocomposite laminates reinforced by sisal fibers. Compos. Struct. 2020, 253, 112744. [Google Scholar] [CrossRef]
- Hassan, M. The Low Velocity Impact Response of Sandwich Structures. Ph.D. Thesis, University of Liverpool, England, UK, 2012. [Google Scholar]
- Ismail, M.F.; Sultan, M.T.H.; Hamdan, A.; Shah, A.U.M.; Jawaid, M. Low velocity impact behaviour and post-impact characteristics of kenaf/glass hybrid composites with various weight ratios. J. Mater. Res. Technol. 2019, 8, 2662–2673. [Google Scholar] [CrossRef]
- Chew, E.; Liu, J.L.; Tay, T.E.; Tran, L.Q.; Tan, V.B. Improving the mechanical properties of natural fibre reinforced laminates composites through Biomimicry. Compos. Struct. 2020, 258, 113208. [Google Scholar] [CrossRef]
- Ullah, H.; Silberschmidt, V. Mechanical Behaviour And Computed Tomography Damage Analysis Of Fabric-Reinforced Composites Under Bending. In Proceedings of the 18th Conference on Composite Materials, Athens, Greece, 25–28 June 2018. [Google Scholar]
- Zhang, C.; Rao, Y.; Li, Z.; Li, W. Low-Velocity Impact Behavior of Interlayer/Intralayer Hybrid Composites Based on Carbon and Glass Non-Crimp Fabric. Materials 2018, 11, 2472. [Google Scholar] [CrossRef] [PubMed] [Green Version]


| Composite | PALF (P) | Glass Fiber Woven Mat (G) | Layup Sequence |
|---|---|---|---|
| PALF/Epoxy | 10%wt | - | P |
| Hybrid | 5%wt | 2 layer | GPG |
| Synthetic | - | 4 layer | GGGG |
| Sample | Impact Energy, J |
|---|---|
| P | 1.0 |
| 2.0 | |
| GPG | 2.0 |
| 3.0 | |
| 6.0 | |
| 9.0 | |
| GGGG | 9.0 |
| 10.5 | |
| 12.0 |
| Fiber | Polymer | Damage Mode (Visual) | Reference | |
|---|---|---|---|---|
| Front | Back | |||
| Bamboo powder fibers | epoxy | Matrix crack | [15] | |
| Bamboo powder fibers + Glass fiber mat | epoxy | Localised delamination | Bulge with crack | [15] |
| UD PALF | Polylactic acid (PLA) | Circular dent with crack | Bulge with crack | [32] |
| UD Sisal | epoxy | Single long line crack | [33] | |
| Kenaf fiber mat | epoxy | Crack along the horizontal (major) and vertical (minor) | [27] | |
| Kenaf fiber mat + glass fiber mat | epoxy | Localised delamination with crack along the horizontal (major) and vertical (minor) | [27] | |
| Kenaf fiber mat + glass fiber mat | epoxy | Delamination at the center | - | [35] |
| UD Kenaf laminates | epoxy | - | Cross-shaped bulge with fiber breakage | [36] |
Publisher’s Note: MDPI stays neutral with regard to jurisdictional claims in published maps and institutional affiliations. |
© 2021 by the authors. Licensee MDPI, Basel, Switzerland. This article is an open access article distributed under the terms and conditions of the Creative Commons Attribution (CC BY) license (https://creativecommons.org/licenses/by/4.0/).
Share and Cite
Najeeb, M.I.; Hameed Sultan, M.T.; Md Shah, A.U.; Muhammad Amir, S.M.; Safri, S.N.A.; Jawaid, M.; Shari, M.R. Low-Velocity Impact Analysis of Pineapple Leaf Fiber (PALF) Hybrid Composites. Polymers 2021, 13, 3194. https://doi.org/10.3390/polym13183194
Najeeb MI, Hameed Sultan MT, Md Shah AU, Muhammad Amir SM, Safri SNA, Jawaid M, Shari MR. Low-Velocity Impact Analysis of Pineapple Leaf Fiber (PALF) Hybrid Composites. Polymers. 2021; 13(18):3194. https://doi.org/10.3390/polym13183194
Chicago/Turabian StyleNajeeb, Muhammad Imran, Mohamed Thariq Hameed Sultan, Ain Umaira Md Shah, Siti Madiha Muhammad Amir, Syafiqah Nur Azrie Safri, Mohammad Jawaid, and Mohamad Rabaie Shari. 2021. "Low-Velocity Impact Analysis of Pineapple Leaf Fiber (PALF) Hybrid Composites" Polymers 13, no. 18: 3194. https://doi.org/10.3390/polym13183194
APA StyleNajeeb, M. I., Hameed Sultan, M. T., Md Shah, A. U., Muhammad Amir, S. M., Safri, S. N. A., Jawaid, M., & Shari, M. R. (2021). Low-Velocity Impact Analysis of Pineapple Leaf Fiber (PALF) Hybrid Composites. Polymers, 13(18), 3194. https://doi.org/10.3390/polym13183194