Article

Novel Cu/Zn Reinforced Polymer Composites: Experimental Characterization for Radiation Protection Efficiency (RPE) and Shielding Properties for Alpha, Proton, Neutron, and Gamma Radiations

1
Department of Physics, College of Science, Princess Nourah Bint Abdulrahman University, Riyadh 11671, Saudi Arabia
2
Program of Occupational Health and Safety, Department of Property Protection and Security, Vocational School of Social Sciences, Bingöl University, Bingöl 12000, Turkey
3
Central Laboratory Application and Research Center, Bingöl University, Bingöl 12000, Turkey
4
Marine Engineering Department, Faculty of Maritime Studies and Marine Engineering, King Abdulaziz University, Jeddah 21589, Saudi Arabia
5
Medical Diagnostic Imaging Department, College of Health Sciences, University of Sharjah, Sharjah 27272, United Arab Emirates
6
Medical Radiation Research Center (USMERA), Uskudar University, Istanbul 34672, Turkey
7
Department of Physics, Arts and Sciences Faculty, Giresun University, Giresun 28100, Turkey
8
Department of Physics, Faculty of Science, University of Tabuk, Tabuk 47512, Saudi Arabia
9
Physics Department, Faculty of Science, Al-Azhar University, Assiut 71452, Egypt
10
Department of Architecture and Urban Planning, Vocational School of Technical Sciences, Bingöl University, Bingö 12000, Turkey
11
Department of Civil Engineering, Engineering Faculty, Atatürk University, Erzurum 25240, Turkey
12
INPOLDE Research Center, Department of Chemistry, Faculty of Sciences and Environment, Physics and Environment, Dunarea de Jos University of Galati, 47 Domneasca Street, 800008 Galati, Romania
13
Institute of Physics and Technology, Ural Federal University, 620002 Ekaterinburg, Russia
*
Authors to whom correspondence should be addressed.
Polymers 2021, 13(18), 3157; https://doi.org/10.3390/polym13183157
Submission received: 16 July 2021 / Revised: 5 September 2021 / Accepted: 14 September 2021 / Published: 17 September 2021
(This article belongs to the Section Polymer Composites and Nanocomposites)

Abstract

:
In this study, brass (Cu/Zn) reinforced polymer composites with different proportions of brass powders were fabricated. Different types of nuclear shielding parameters such as mass and linear attenuation coefficients, radiation protection efficiency, half and tenth value layers, and effective atomic number values were determined experimentally and theoretically in the energy range of 0.060–1.408 MeV in terms of gamma-ray shielding capabilities of fabricated polymer composites. A high Purity Germanium detector (HPGe) in conjunction with a Multi-Channel Analyzer (MCA) and twenty-two characteristic gamma-ray energies have been used in the experimental phase. In addition, the exposure and energy absorption buildup factors of reinforced Cu/Zn composites were calculated, and relative dose distribution values were computed to verify them. Proton mass stopping power (ΨP), proton projected range (ΦP), alpha mass stopping power (ΨA), and alpha projected range (ΦA) parameters, which indicate the interactions of the produced composites with charged particle radiation, were investigated. Fast neutron removal cross-section (ΣR) results were determined to give an idea in terms of neutron shielding. According to the obtained results, it is reported that the CuZn20 coded sample’s ability to attenuate gamma-ray and charged particle radiation is more efficient than that of other prepared composites. A CuZn05 coded sample was found to be more suitable for neutron shielding capability.

1. Introduction

Technological advancements enabled the invention and ongoing improvement of a wide variety of equipment. This technological revolution has impacted numerous applications ranging from medical procedures to industrial advances during the last several years. Among emerging technologies, radiation sciences and its many applications continue to be a popular subject and are undergoing daily worldwide development. While the utilization of ionizing radiation is critical in essential applications that impact human life, such as medical diagnostics and medical radiation therapy, imprudent use of radiation, like any other activity, may have a significant effect on living biological structures DNA and materials. Therefore, the term ALARA (As Low As Reasonably Achievable) should always be considered in terms of radiation safety. This concept demands that, to the extent that it is practically possible, radiation protection measures promote the lowest radiation exposure duration and maximum distance between the public and radiation sources. Additionally, this concept implies the selection of the most suitable shielding material to limit exposure to the source. One of the critical variables here is the type and energy of the radiation released by the source, which will dictate the shielding material and design needed. It is worth noting that the most often utilized kind of radiation in medical and industrial applications is electromagnetic waves, sometimes known as X-rays or gamma-rays. Due to their excellent characteristics against X-rays and gamma-rays ionizing radiation, lead (Pb) and lead-based shields have been conventional components regarded as main shielding materials. However, lead (Pb) and lead-based shielding materials have a number of significant drawbacks, including toxicity, lack of transparency, and unsuitability for long-term use [1]. Consequently, the discovery and application of alternate radiation shielding materials has emerged as a prominent research subject in recent years [2,3,4,5,6]. The main goal of these materials is to keep radiation levels as low as possible. Additionally, it should be environmentally friendly throughout the production, use, and ultimate disposal phases and affordable and durable. Numerous studies have been conducted in recent years to determine the radiation shielding properties of glass materials [7,8,9], alloys [10,11,12], and composite materials [13,14] against ionizing radiation. A composite material, which is a general term, is often described as a substance comprised of two or more substantially distinct component materials with specific physical or chemical characteristics. It is worth noting that composite materials’ physical and chemical characteristics are often distinct from those of their components. Along with the composite’s basic structure, the kind and quantity of filler material used to strengthen the composite is critical to consider. Various experiments have been conducted before to determine the efficacy of various filler types and filler amounts in composite materials against ionizing radiation. The performance of polymer composites reinforced with BaTiO3 and CaWO4 fillers was studied by Akman et al. [15]. Their findings indicated that increasing the quantity of BaTiO3 and CaWO4 reinforcement improves the gamma-ray shielding effectiveness of polymer composites synergistically. Al-Dhuhaibat [16] has investigated the gamma-ray shielding characteristics of several epoxy polymers doped with cement, lead, iron, and aluminum. The findings indicated that Fe-filled composite samples behaved differently when exposed to gamma-rays produced by various kinds of point radioactive isotopes. The ongoing studies and their promising findings have encouraged us to fabricate some special types of polymer composites to investigate their nuclear radiation shielding properties. Accordingly, five brass (Cu/Zn) reinforced polymer composites encoded CuZn00, CuZn05, CuZn10, CuZn15, and CuZn20 were synthesized as part of an ongoing effort to develop effective and alternative shielding materials for ionizing radiation facilities. We hypothesised that these regular variations of filler contribution in the polymer composite might affect the characteristic behaviours against different types of nuclear radiation such as gamma-ray, neutron, alpha, and proton. Different types of phases as working flow have been planned as follows.
  • Phase 1: sample preparation
  • Phase 2: experimental gamma-ray transmission studies
  • Phase 3: experimental studies of radiation protection efficiency (RPE)
  • Phase 4: Monte Carlo simulations of nuclear radiation shielding properties
Experimental and advanced Monte Carlo simulation studies will be linked in terms of provided outcomes to assess the overall characterization process. The findings from this broad study may be used to further research next-generation, energy-efficient, and environmentally friendly composite materials and their application in radiation facilities.

2. Materials and Methods

Table 1 summarizes the chemical characteristics and mass densities of manufactured composite samples. The method of preparing composites in detail will be described in subsequent parts of this work. This study evaluated the mass attenuation coefficients (MAC) of manufactured composites in an experimental transmission setup using twenty-two different gamma-ray energies and a High Purity Germanium (HPGe) detector (Nel electronics, Ortec, TN, USA) We calculated the relative dose distribution (RDD) values and their behavior at various distances at 40 mean free path (mfp) to validate the derived shielding parameters. Finally, we assessed the radiation protection efficiency (RPE) of manufactured composites using experimental data. Brass reinforced composite samples encoded CuZn00, CuZn05, CuZn10, CuZn15, and CuZn20 were reported with material densities ranging from 1.1881 g/cm3 to 1.3649 g/cm3. The gamma-ray transmission properties were also simulated using the general-purpose Monte Carlo code MCNPX (version 2.4.0) [17].

2.1. Sample Preparation

Five different brass (Cu/Zn) reinforced polymer composites (Turkuaz Polyester, Turkuaz brand, Kocaeli, Turkey) were obtained by using:
(a)
Unsaturated polyester resin, as binder,
(b)
Methyl ethyl ketone peroxide (MEKP), as hardener,
(c)
Cobalt Octoate-6% (Co-6) as accelerator, and
(d)
Brass powders as filler.
Carefully weighted amounts of binder and filler were prepared. The amount of filler was determined as approximately 5%, 10%, 15%, and 20%, in weight, of the amount of binder. The filler was homogenized in a mixer for one minute. Then, a mixture of binder and accelerator obtained by mixing for 1 min was poured on the filling material in the mixer, and they were mixed for 3 min to ensure homogeneity. Finally, the hardener was added to this mixture and mixed for 1 min. Mixing steps were applied as a standard for each series. The initiation of the polymerization process and the increase in reaction speed were carried out with the help of hardener (MEKP) and accelerator (Co-6), respectively. The composite production was completed by allowing the liquid sample to be cured in molds with a radius of 1 cm and a thickness of 0.5, 1.0, 2.0, and 3.0 cm (See Figure 1). Additionally, Figure 2 illustrates the manufacturing process.

2.2. Experimental Characterization of Gamma-Ray Transmission Parameters

To estimate the mass attenuation coefficients of brass (Cu/Zn) reinforced polymer composites, the shielding characteristics of the composites were studied utilizing a High Purity Germanium detector (HPGe) in conjunction with a Multi-Channel Analyzer (MCA). The dimensional properties of the utilized detector crystal of HPGe can be listed as below.
  • Diameter: 7 cm
  • Crystal length: 2.5 cm
  • Diameter of each lead collimator window: 1 cm
  • thicknesses of each lead collimator window: 1 cm.
They were located at 20 cm and 50 cm from the detector front wall. The distance source-detector was 80 cm. The sample was located at 10 cm from the detector. The general appearance of experimental setup geometry with used devices is shown in Figure 3.
The following radioisotopes 22Na, 54Mn, 57Co, 60Co, 133Ba, 137Cs, 152Eu, and 241Am have generated twenty-two different gamma-ray energies varied from 0.060 MeV to 1.408 MeV. Further details about used radioactive isotopes can be found in literature elsewhere [18]. In this study, software from MAESTRO (Nel electronics, Ortec, TN, USA) was utilized to investigate the photo-peaks found during the data-acquisitions [19,20]. In addition, peak areas were determined by Origin7.5 code (demo version) (OriginLab Corporation, Northampton, MA, USA)by using the least-square fitting method. To determine the value and uncertainties of experimental attenuation mass coefficients we relied on Equation (1)
I = I 0   e x p µ m   ρ   x   ,   Δ µ m = 1 x ρ Δ I I 2 + Δ I 0 I 0 2 + l n Δ I I 2   Δ x ρ x ρ 2
where I0 and I are the area of the photo peak without and with a sample, respectively, µm is the mass attenuation coefficient, ρ stands for the sample density, and x represents the sample thickness in front of the beam.

2.3. Shielding Parameters

The mass attenuation coefficient ( µ m ) may be determined using several numerical simulations and database methods, including WinXcom, MCNP, Xmudat, and Geant4. Hereby, all these methods are based on the mixture rule as [21]:
µ m = µ ρ = N A M   σ t o t = k W k   µ ρ k  
In the Equation (2), µ is the Linear Attenuation Coefficient (LAC), NA is the Avogadro number, M and σtot are the atomic mass and total microscopic cross section of the sample, and Wk is a weight fraction of the kth element in the fabricated brass composite sample. Derived from this basic quantity, mfp (mean free path) and HVL (half value layer), and TVL (Tenth Value Layer) can be calculated as shown in Equations (3) and (4). As observed, HVL and TVL are proportional to mfp. The physical meaning of mfp is the average distance a gamma ray of a given energy traverses in a medium until it interacts with the medium for the first time. HVL and TVL are the average distances required for the incident flux of gamma rays to decrease its intensity by a half and a tenth, respectively. It is worth noting that removing the gamma rays from the incident beam does not necessarily imply that it will no longer contribute to the dose delivered by the radiation source to the patient or public, as secondary radiation might still reach them.
m f p = 1 / μ    
H V L = l n 2 μ       ;           T V L = l n 10 μ  
Zeff (effective atomic number) is another important parameter to consider when assessing gamma radiation shielding, since electromagnetic radiation is mostly dispersed by electrons of the atomic shell. Zeff has far more information than the electron density, as it also depends on the gamma radiation energy, which is why it is an interesting parameter in Radiation Shielding Design. Zeff can be determined for each composite sample by utilization of Equations as follows [22]:
Z e f f = j   f j   A j   µ m j j   f j     A j Z j   µ m j
In Equation (5), fj stands for the mole fraction of species j, which has molar mass Aj, atomic number Zj and mass attenuation coefficient µ m j .
The calculation of Zeff involves the contribution of all processes which can occur during the gamma-atom interaction. Depending on the gamma radiation energy, the Peak to Compton ratio changes and the probability that each of these effects occurs. Hence, the difference between these parameters magnifies the sensitivity of these phenomena by the sample. The Effective Buildup Factor (EBF) and the Effective Absorption Buildup Factor (EABF) somehow take into account the contribution of those secondary radiations mentioned above when discussing mfp. The EBF estimates the ratio between the contribution of all gamma detected (primary and secondary radiation), and the contribution of those gammas that are detected which have not had any interaction between the radiation source and the detector (primary radiation). The EABF takes into account how much energy was deposited in the material by both primary and secondary radiation, with respect to how much energy was deposited in the detector only by primary radiation. EBF and EABF are critical metrics for determining the radiation shielding effectiveness of the absorber material environment under investigation. These parameters, EBF and EABF, provide detailed information on the quantity of photons, their intensity, energy flow, and dose. EBF and EABF of brass reinforced polymer composites were calculated using the well-established Geometric Progression (G-P) fitting technique [23]. To estimate buildup factors of composites reinforced with brass, the equivalent atomic numbers (Zeq) were determined. The Zeq values can be calculated based on Equation (6) as follows:
Z e q = Z 1 l o g H 2 l o g H x Z 2 l o g H 1 l o g H x l o g H 2 l o g H 1
Equation (6) should be calculated at a given energy and sample. The quantity of Hx is the ratio between Compton attenuation and total attenuation ((µ/ρ)Comp/(µ/ρ)) for the energy and sample under consideration. H2 and H1 are the corresponding ratios for two successive atomic numbers Z1 and Z2 = Z1+1, so that Hx lies between H1 and H2.
We utilized Zeq values to obtain the G-P fitting parameters by the Equations (7)–(9). Thus, at last, the buildup factors of composites reinforced with brass were successfully determined.
B E , X = 1 + b 1 K x 1 K 1             for   K 1
E , x = 1 + b 1 x       for   K = 1
where
K E , x = c x a + d tanh x x k 2 tanh 2 1 tanh 2 ,   x 40 M F P  
x denotes the distance between the source and detector in Equations (7)–(9). At 1 mfp, the EBF is represented as b. The K (E, X) factor denotes dosage multiplication. The capacity of brass reinforced polymer composites to attenuate fast neutrons was investigated in this article. Therefore, the effective removal cross section (ΣR/ ρ , in cm2/g) values neutron shielding part were determined. The determination process of ΣR/ ρ and heavy charged particles with all detail can be found in our previous studies [24]. On the other hand, the term radiation protection efficiency (RPE) is a critical metric to consider when evaluating the attenuation qualities of potential shielding materials. Equation (10) may be used to calculate this parameter [25].
RPE (%) = (1 – I/I0) × 100
where I denotes photon counts that have been attenuated, and I0 denotes photon counts that have not been attenuated. Moreover, the SRIM Monte Carlo code was used to estimate the fundamental shielding properties for heavy-charged ions as follows.
  • Proton mass stopping power/PSP (ΨP)
  • Proton projected range/PPR (ΦP)
  • Alpha mass stopping power/ASP (ΨA)
  • Alpha projected range/APR (ΦA)
These parameters of the manufactured composite samples were extensively determined in addition to gamma-ray and neutron interactions [26]. Our previous study [1] has detailed information on computations and technical details.

2.4. Monte Carlo Simulations

To verify the experimental findings, MCNPX (version 2.7.0) (Los Alamos National Laboratory, Los Alamos, NM, USA)was also utilized in this study. This code is very flexible, has been thoroughly tested and validated, and has been used to develop and verify additional assessments involving photon, neutron, and charged particle transport. The code may need two modules as input; the first specifies the system’s shape in as much detail as the user desires, as well as the densities of each material. The second one includes the material composition, a description of the radiation source, the evaluations required to produce the required outputs, and the number of histories to compute to reach significant accuracy. Additionally, the program makes use of libraries of data detailing cross sections and other nuclear data, which are required to reproduce all of the particle transport processes. Figure 4 depicts the whole simulation setup obtained from MCNPX Visual Editor, complete with specified simulation equipment for calculating the attenuation coefficients. Between the source of isotropic point radiation and the detecting field, a polymer composite as gamma-ray attenuator has been placed. Additionally, two significant Lead (Pb) blocks have been built to absorb scattering gamma rays, which may improve detection consistency. Finally, each polymer composite sample was subjected to a total of 108 particle tracks with different photon intensities (Number of History). After all simulations were completed, the MCNPX output had a relative error rate of less than 1%. All the MCNPX simulations were performed on a LenovoTM ThinkStation620 equipped with a RyzenTM ThreadripperTM Pro 3995WX CPU (2.7GHz, 64 Cores, 256MB Cache).

3. Results and Discussion

The chemical contents and densities of the materials are given in Table 1. The μ m (MAC) values between 0.060 and 1.408 MeV energy region were measured by experimental and Monte Carlo methods. Figure 5 and Table 2 show the obtained experimental, Monte Carlo simulation, theoretical mass attenuation coefficients, and corresponding energy values. From the figure and table, we observe that the μ m values decrease with increasing energy, which is expected, as the higher the gamma-ray energies have higher penetration properties. Additionally, we found that the samples with greater brass content have higher MAC values, implying that the shielding ability is improved. This is also a natural occurrence, since brass components increase the mass of the substance, which is mostly composed of Copper and Zinc. If the mass attenuation coefficients of the produced composites are compared with those of lead (Pb) and tungsten (W), which are commonly used in radiation shielding; At 662 keV, the mass attenuation coefficients of CuZn00, CuZn05, CuZn10, CuZn15, and CuZn20 are 23.8%, 24.4%, 24.9%, 25.3% and 25.8% lower, respectively, than that of Pb with a mass attenuation coefficient 0.0999 cm2/g [27]. At the same energy, the mass attenuation coefficients of CuZn00, CuZn05, CuZn10, CuZn15, and CuZn20 are 15.6%, 16.2%, 16.6%, 17.1%, and 17.5% lower, respectively, than that of W with a mass attenuation coefficient 0.0933 cm2/g [28]. Ahmed et al. [29] developed flexible silicone-based composites with tungsten additives at different ratios for use in radiation shielding. The highest percentage (88.1%) of tungsten added flexible silicone/tungsten composite has a mass attenuation coefficient of 0.0961 cm2/g at 662 keV, and the CuZn20 coded 20% brass added composite has a 21% lower mass attenuation coefficient than this sample. Alsayed et al. [30] investigated the radiation shielding properties of high-density polyethylene (HDPE) based composites with zinc oxide (ZnO) at different ratios. At 662 keV, the highest ZnO doped (40%) composite has a mass attenuation coefficient of 0.065 cm2/g. When the mass attenuation coefficient of this sample is compared with that of the CuZn20 coded sample, the CuZn20 coded sample has a 22.2% higher mass attenuation coefficient than the other. In other words, the CuZn20 coded sample is a better radiation shielding material than the 40% ZnO doped and HDPE-based composite.
The LAC values, proportionate to the MAC, are shown in 
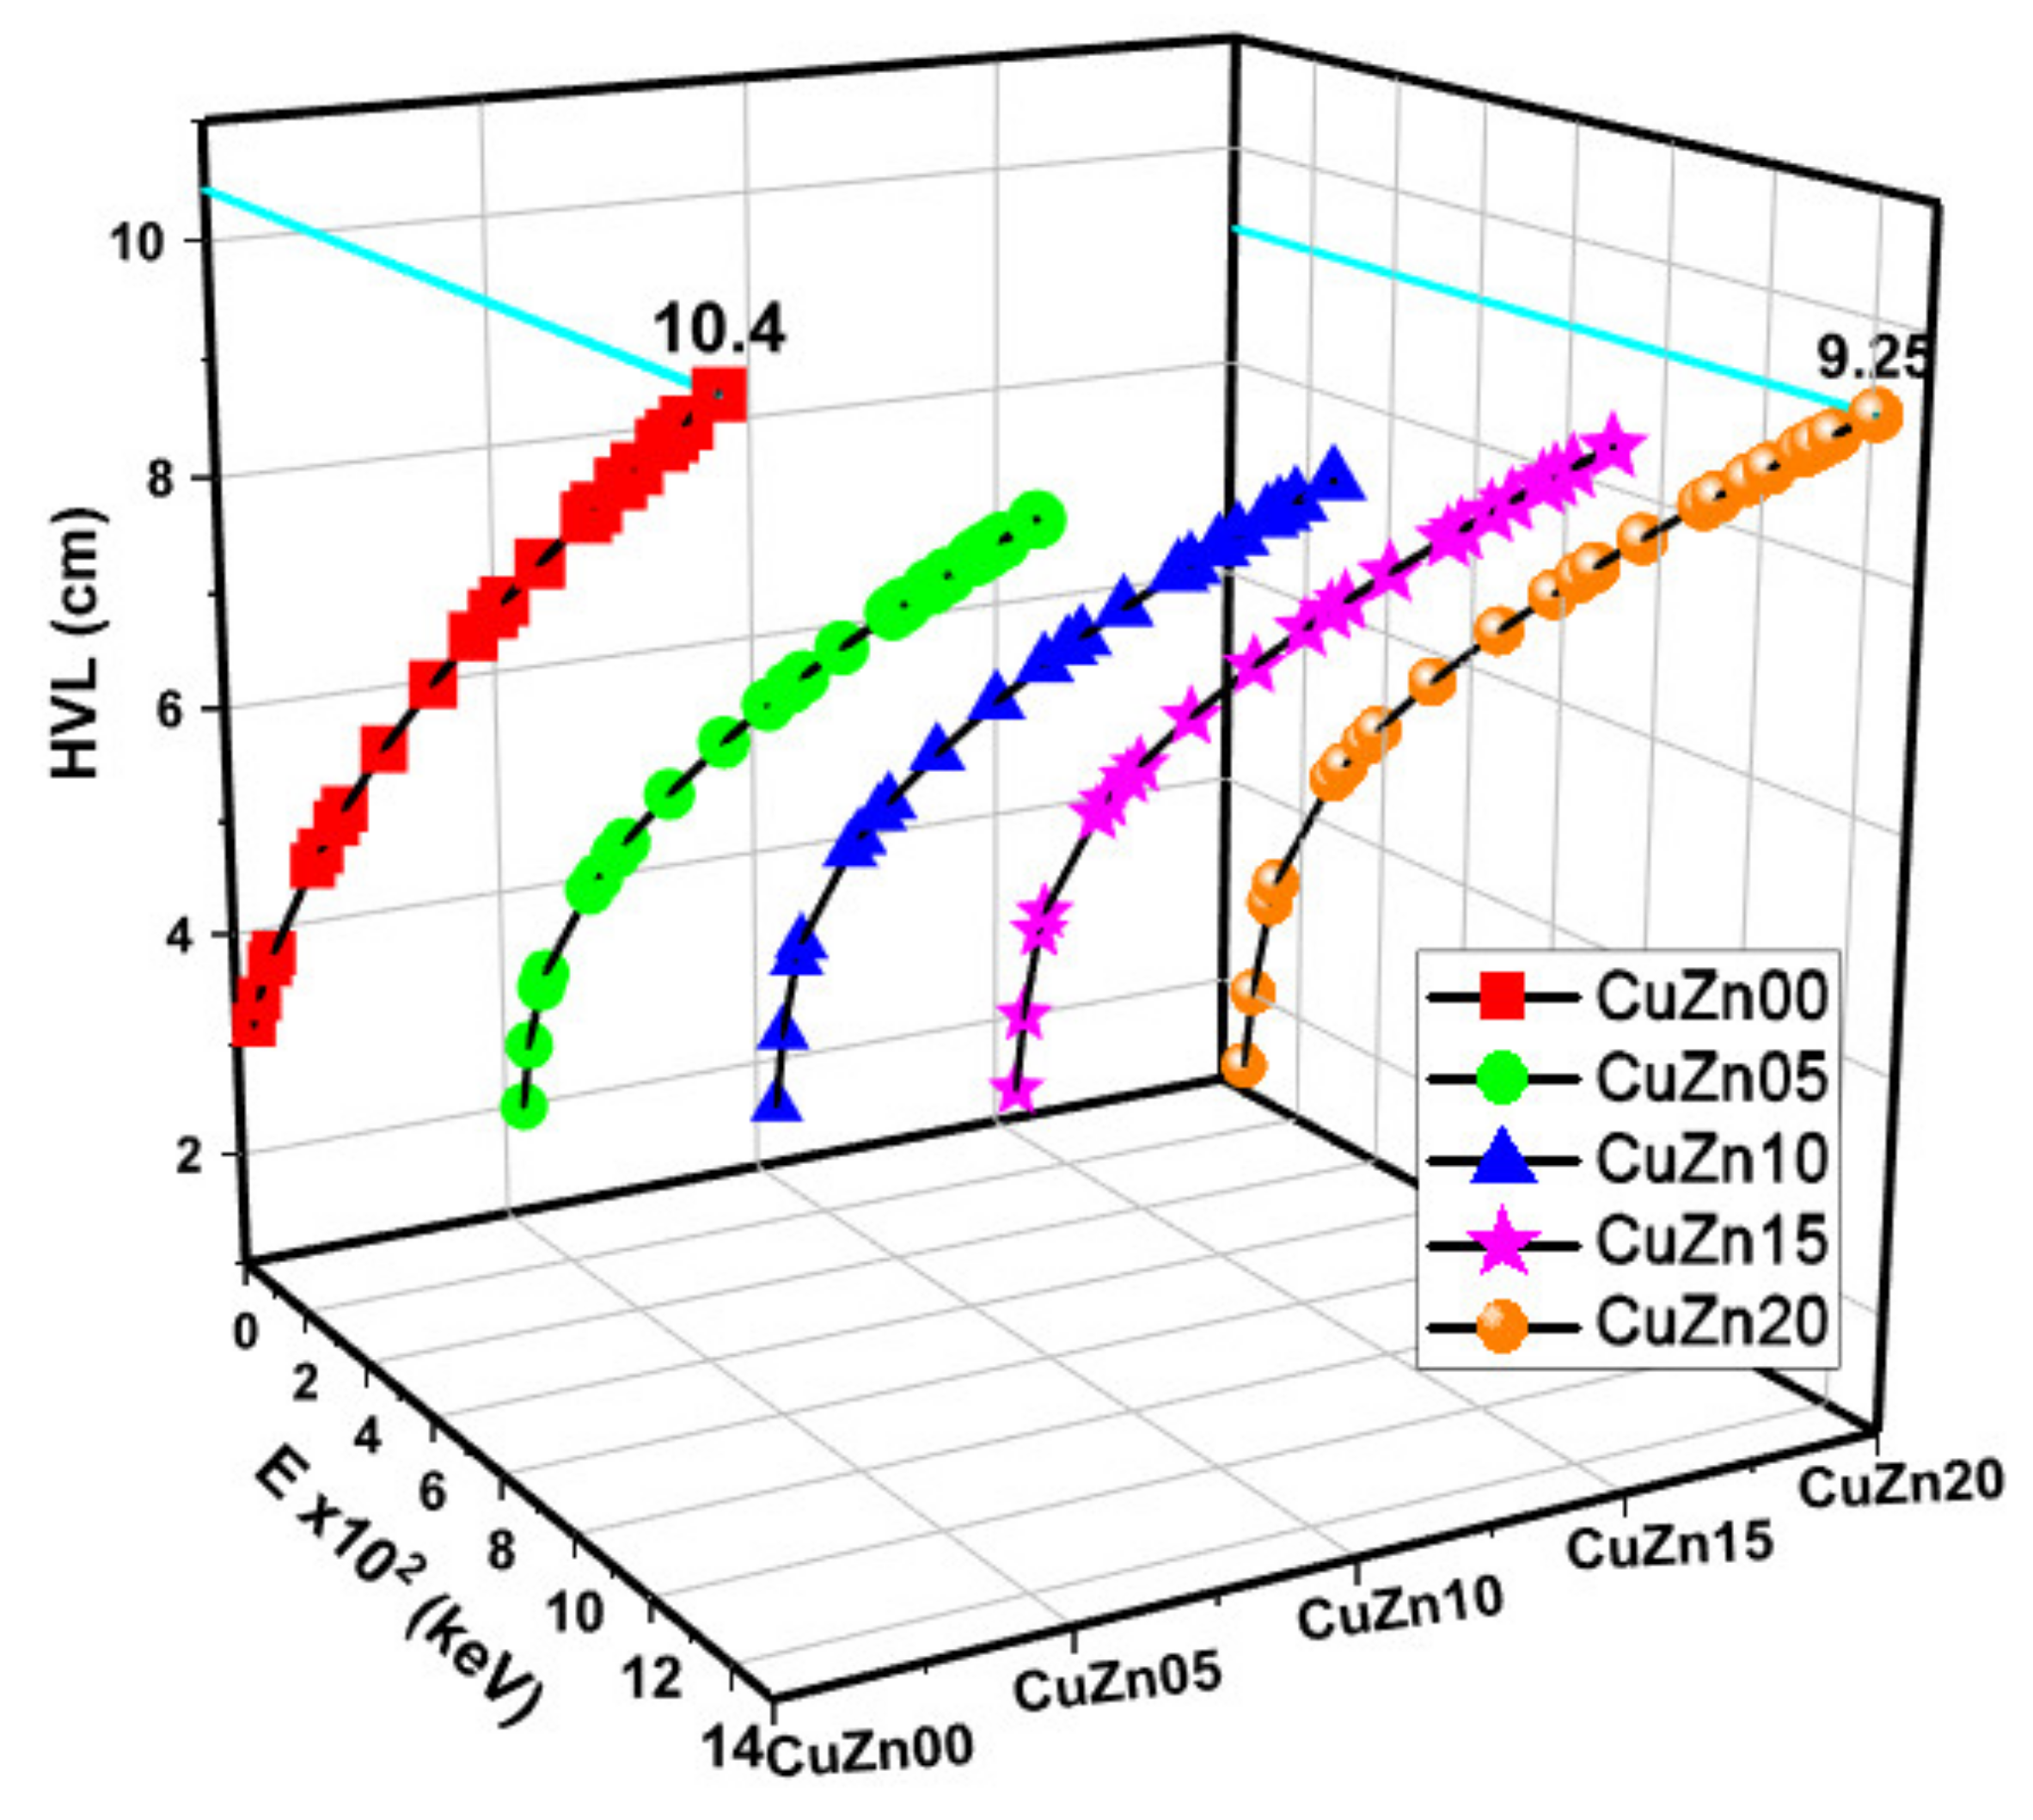
Figure 6. At all energy levels, CuZn20 exhibits higher LAC values than other materials. The relationship between HVL-TVL and mfp is inversely proportional to the relationship between MAC and mfp. As anticipated, Figure 7, Figure 8 and Figure 9 show that these lengths grow in length when the gamma energy rises and increase in size as the material density decreases. As a general observation, about 30 cm of these composites is required to decrease the intensity of un-collided high energy gammas to a tenth, while a shield of 10 cm thickness would suffice for low energies. We argued earlier that polymer composite density would increase as brass content increases in the structure. However, the effective electron density experienced by the incident gamma-ray beam will depend on the energy of the radiation because different phenomena can take place, changing the resultant transmitted beam.
Figure 10 illustrates the effective atomic number Zeff for each composite as a function of the incident gamma energies. For each energy, we notice that Zeff increases with the content of brass, as argued earlier. However, we realized that for a given composite, at lower energies, Zeff is highest, decreasing out about 0.2 MeV, then Zeff is flat until energies of 1 MeV are considered, at which point Zeff begins to increase again. This behaviour can be related to the regions where Photoelectric, Compton Scattering, or Pair Production are dominant.
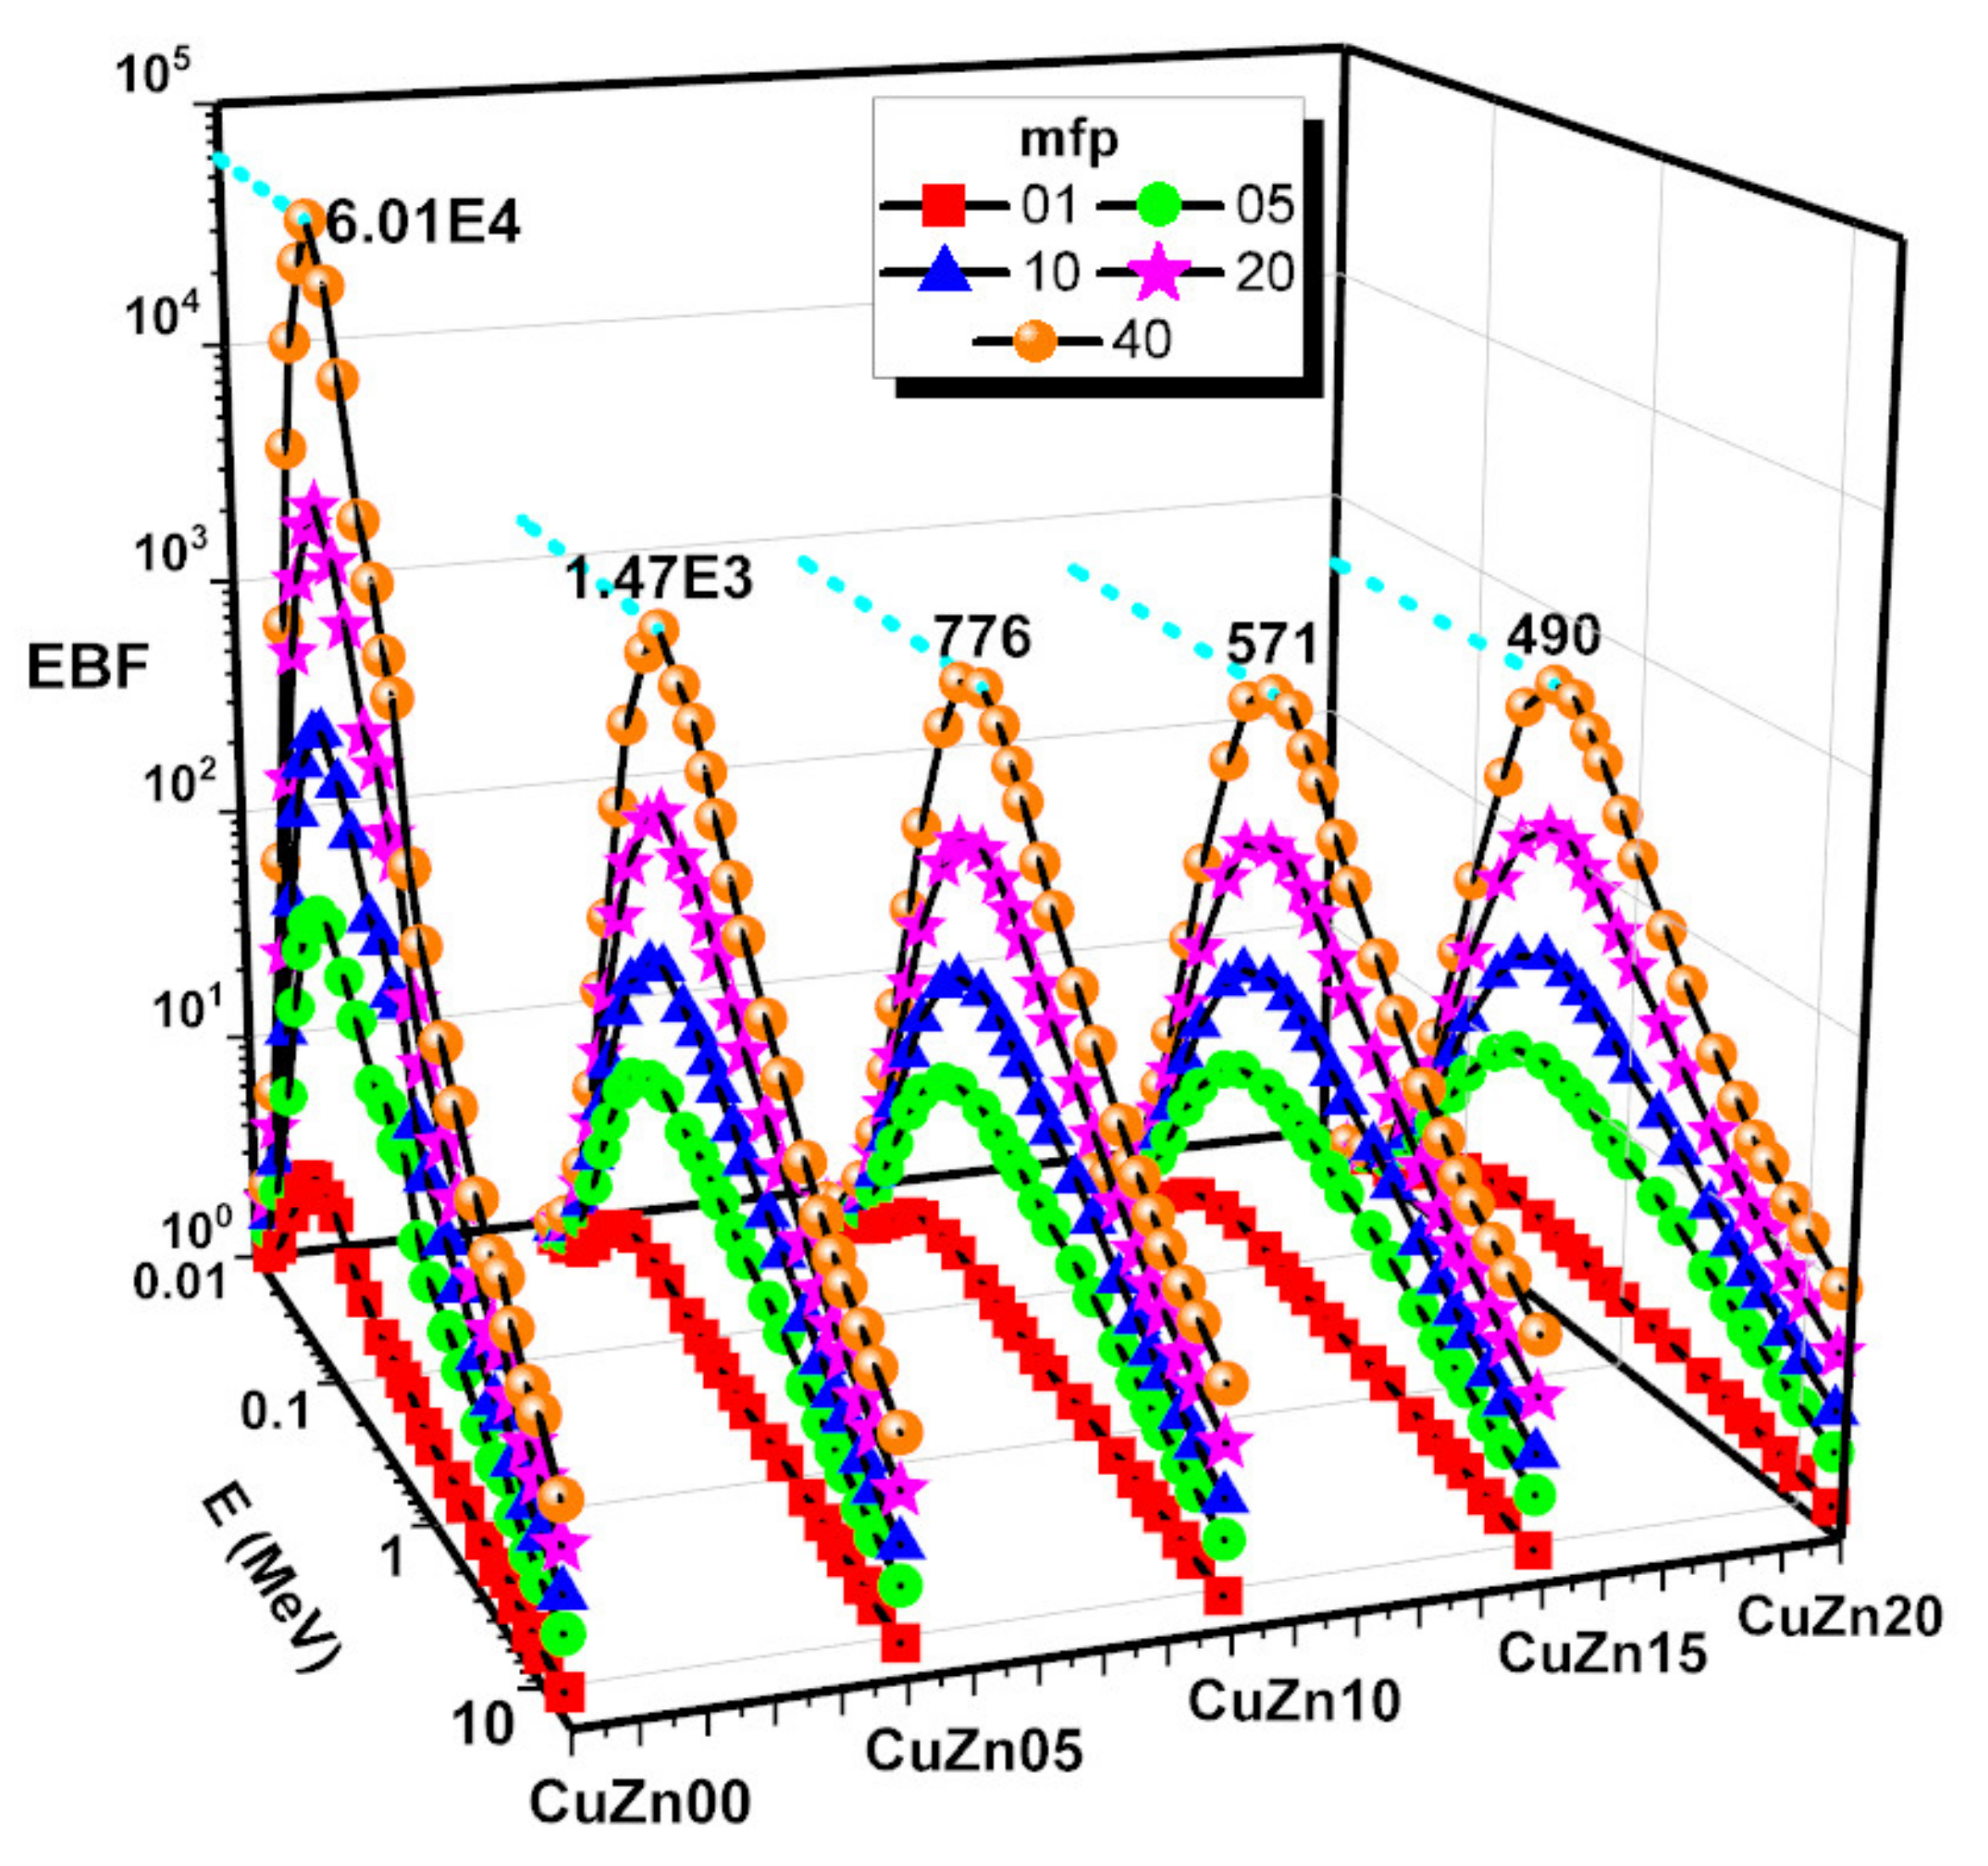
By using the G–P fitting approach (Table 3, Table 4, Table 5, Table 6 and 
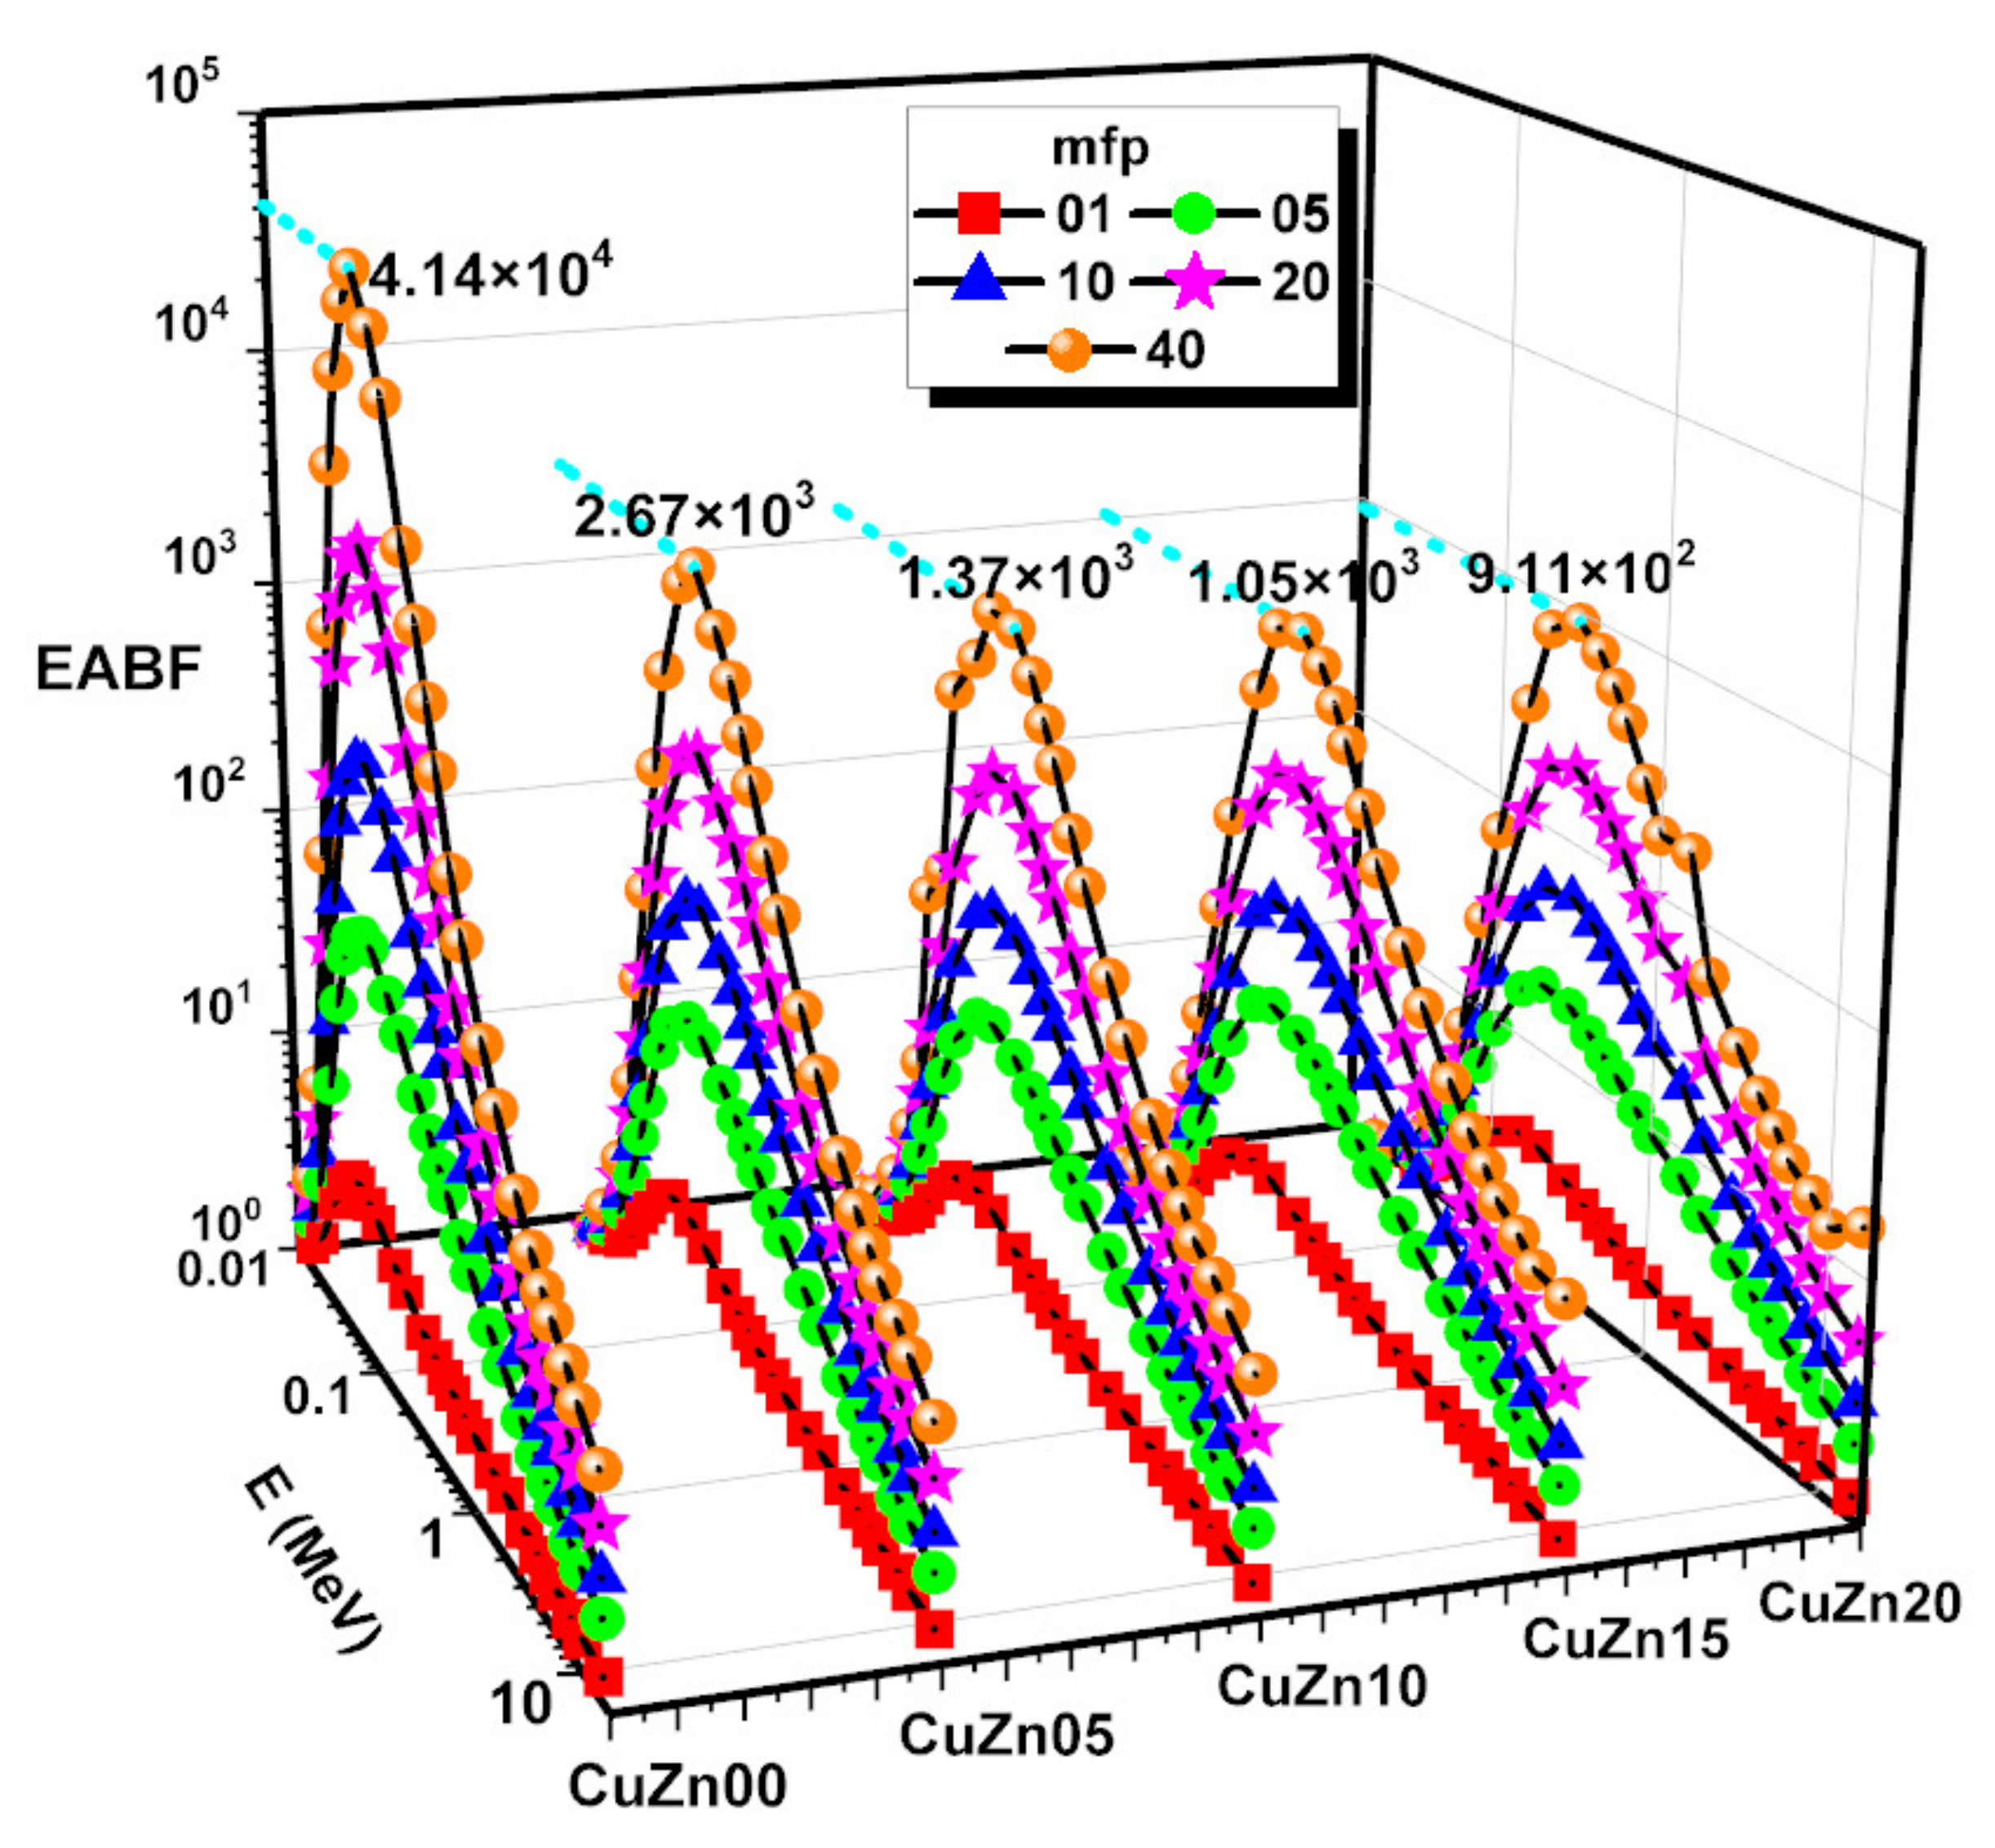
Table 7), the EBF and EABF values were calculated at energies as high as 15 MeV, and penetration depth of 1–5–10–20–40 mfp. The calculated EBF and EABF values of CuZn00, CuZn05, CuZn10, CuZn15, CuZn20 are given in Figure 11 and Figure 12. For each composite, we found that at low energies, when photoelectric effect is dominant, EBF and EABF are low. In comparison, EBF and EABF values rise in the mid-energy range, where Compton Scattering is the main interaction between the incoming gamma-ray and the material. This is because no secondary gamma radiation is released directly, and although the electron absorbing the gamma energy may ionize or excite the atoms along the route, the secondary radiation emitted should be readily reabsorbed by the surrounding atoms. For intermediate energies, EBF and EABF reach a maximum consistent with the maximum of Compton Effect probability. The Compton Effect generates secondary gamma radiation naturally, which adds to the build-up. At high energies, the likelihood of the Compton Effect diminishes, and only positron annihilation caused by pair formation may contribute to the build-up. When we compare the various composites, we see that the lower the brass percentage, the greater the build-up, which is consistent with the more effective shielding that would come from a higher electrical density. As can be seen in Figure 11 and Figure 12, the greatest values of EBF and EABF for each chemical at 40 mfp have been noted. EABF is higher than EABF for every composite except for CuZn00. This is consistent with the idea that in the absence of brass the secondary photons produced by Compton Effect have lower chances to be attenuated in the material, compared to the rest of the compounds.
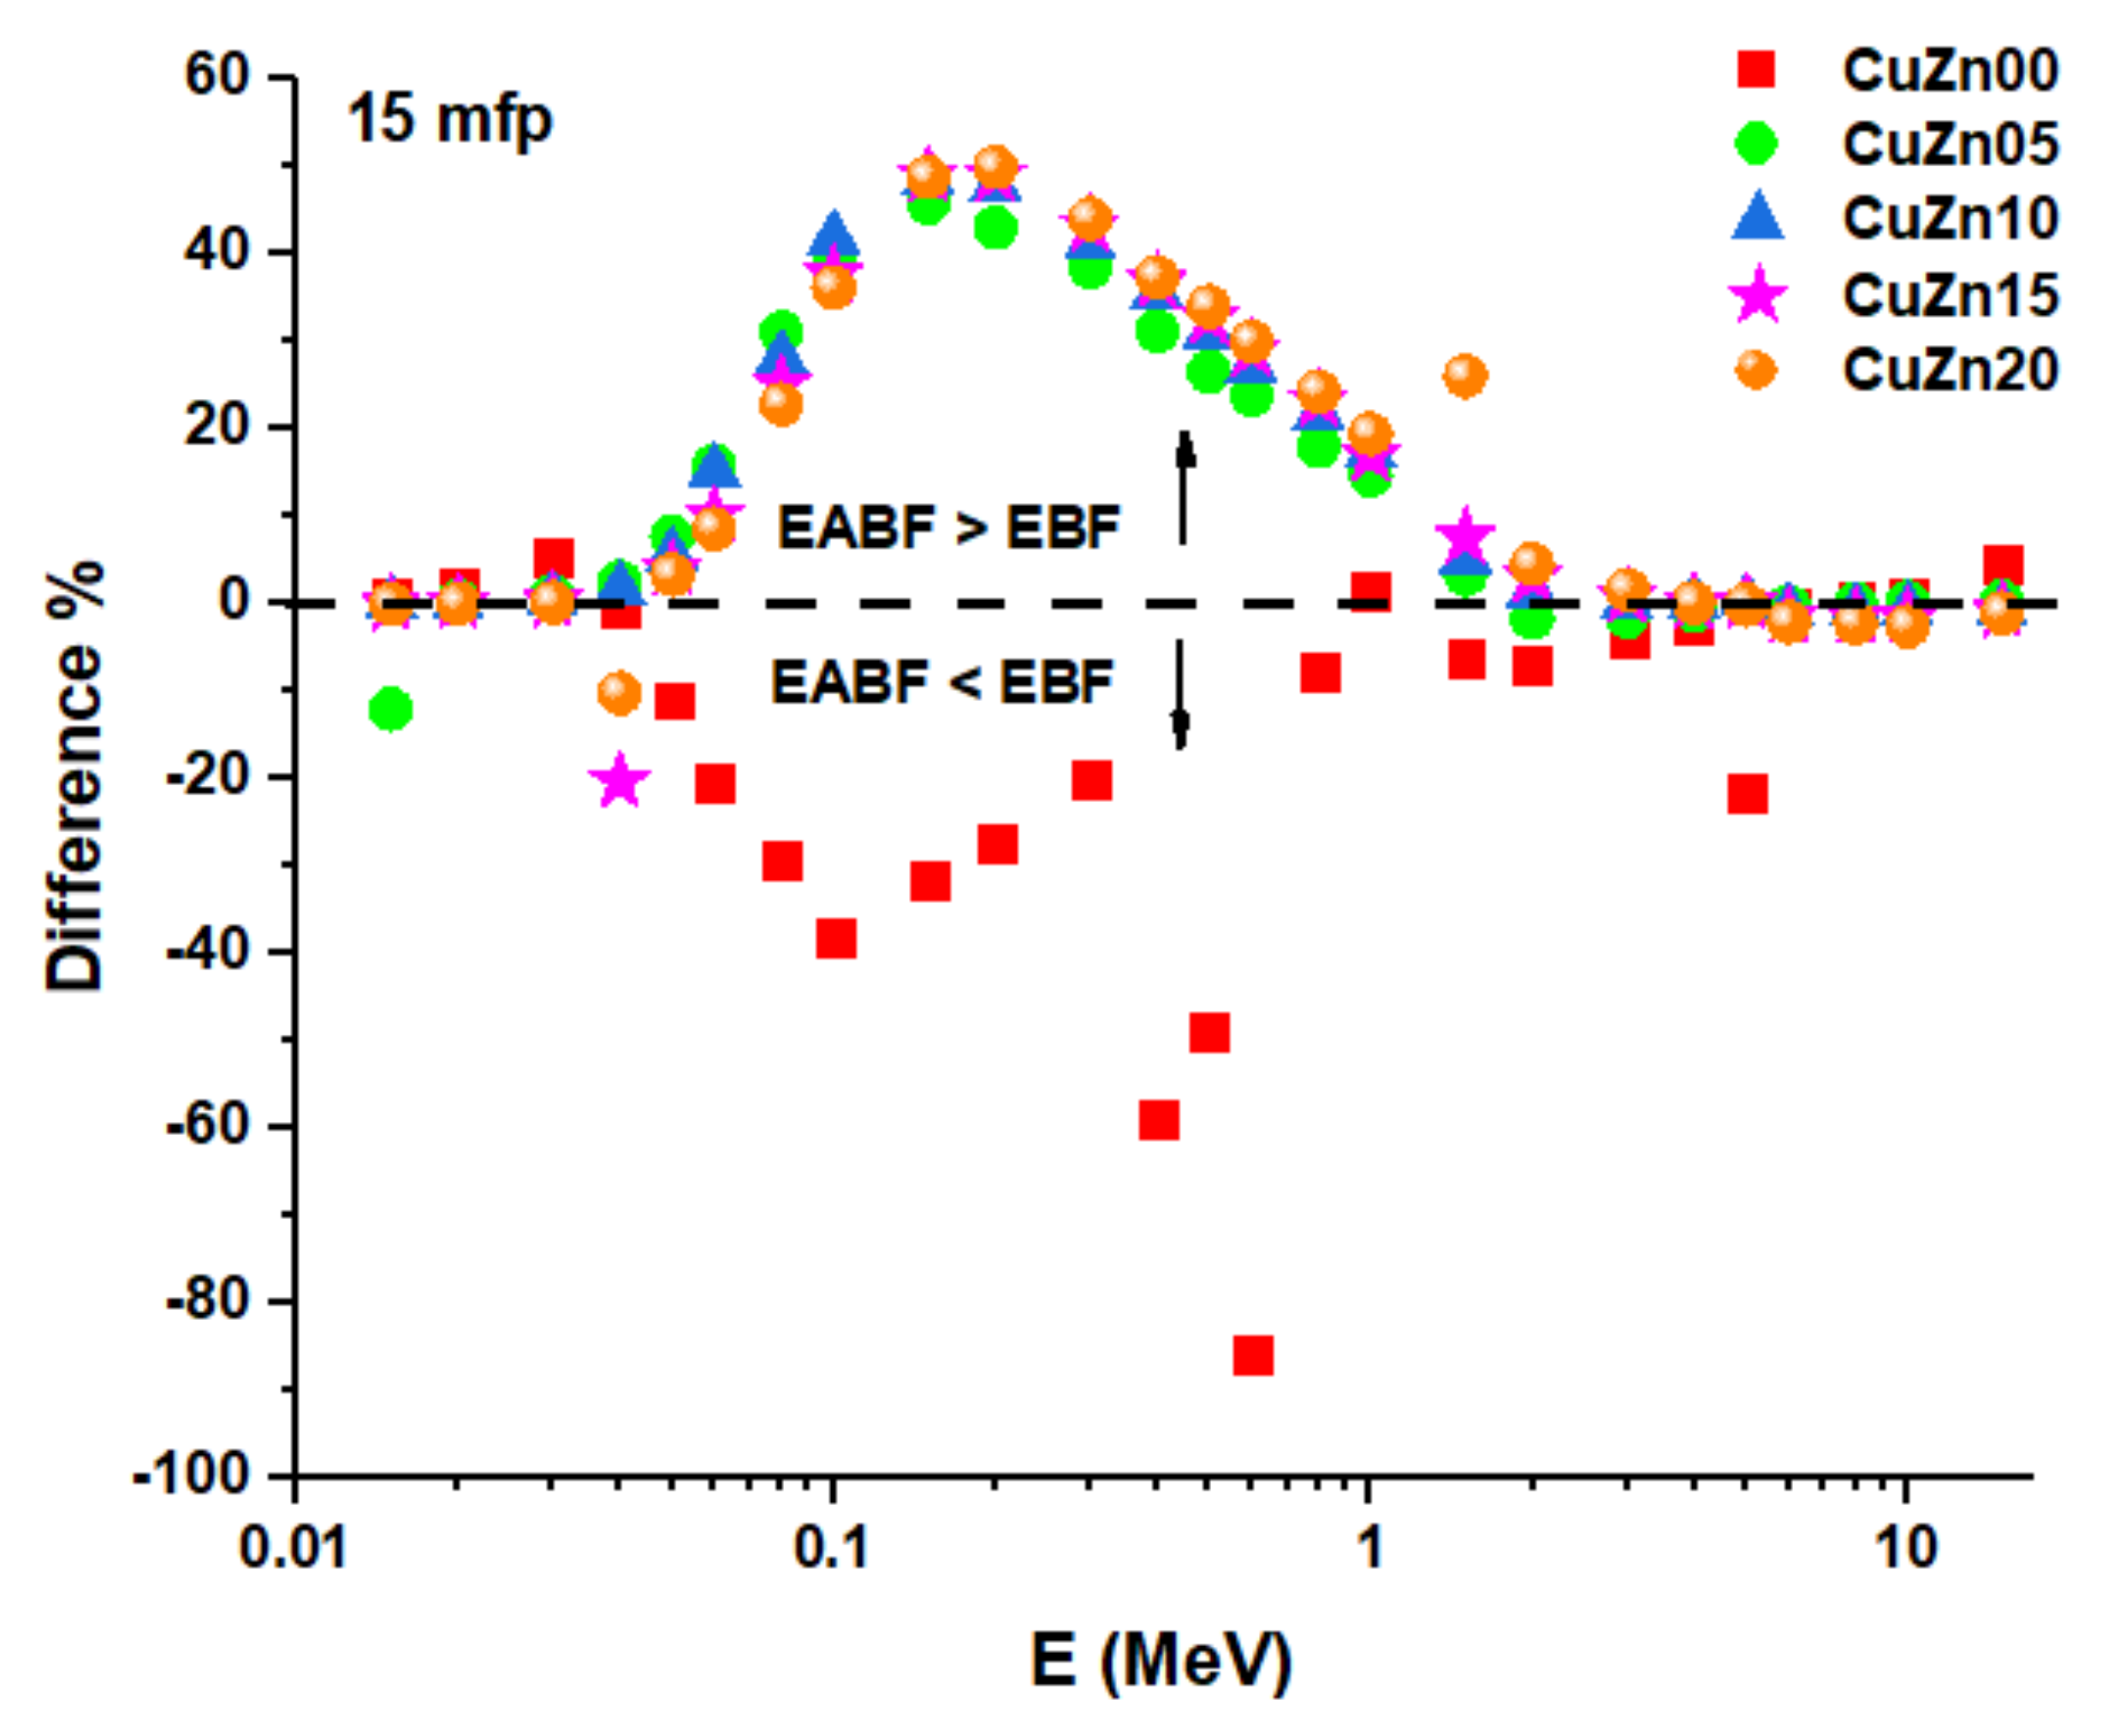
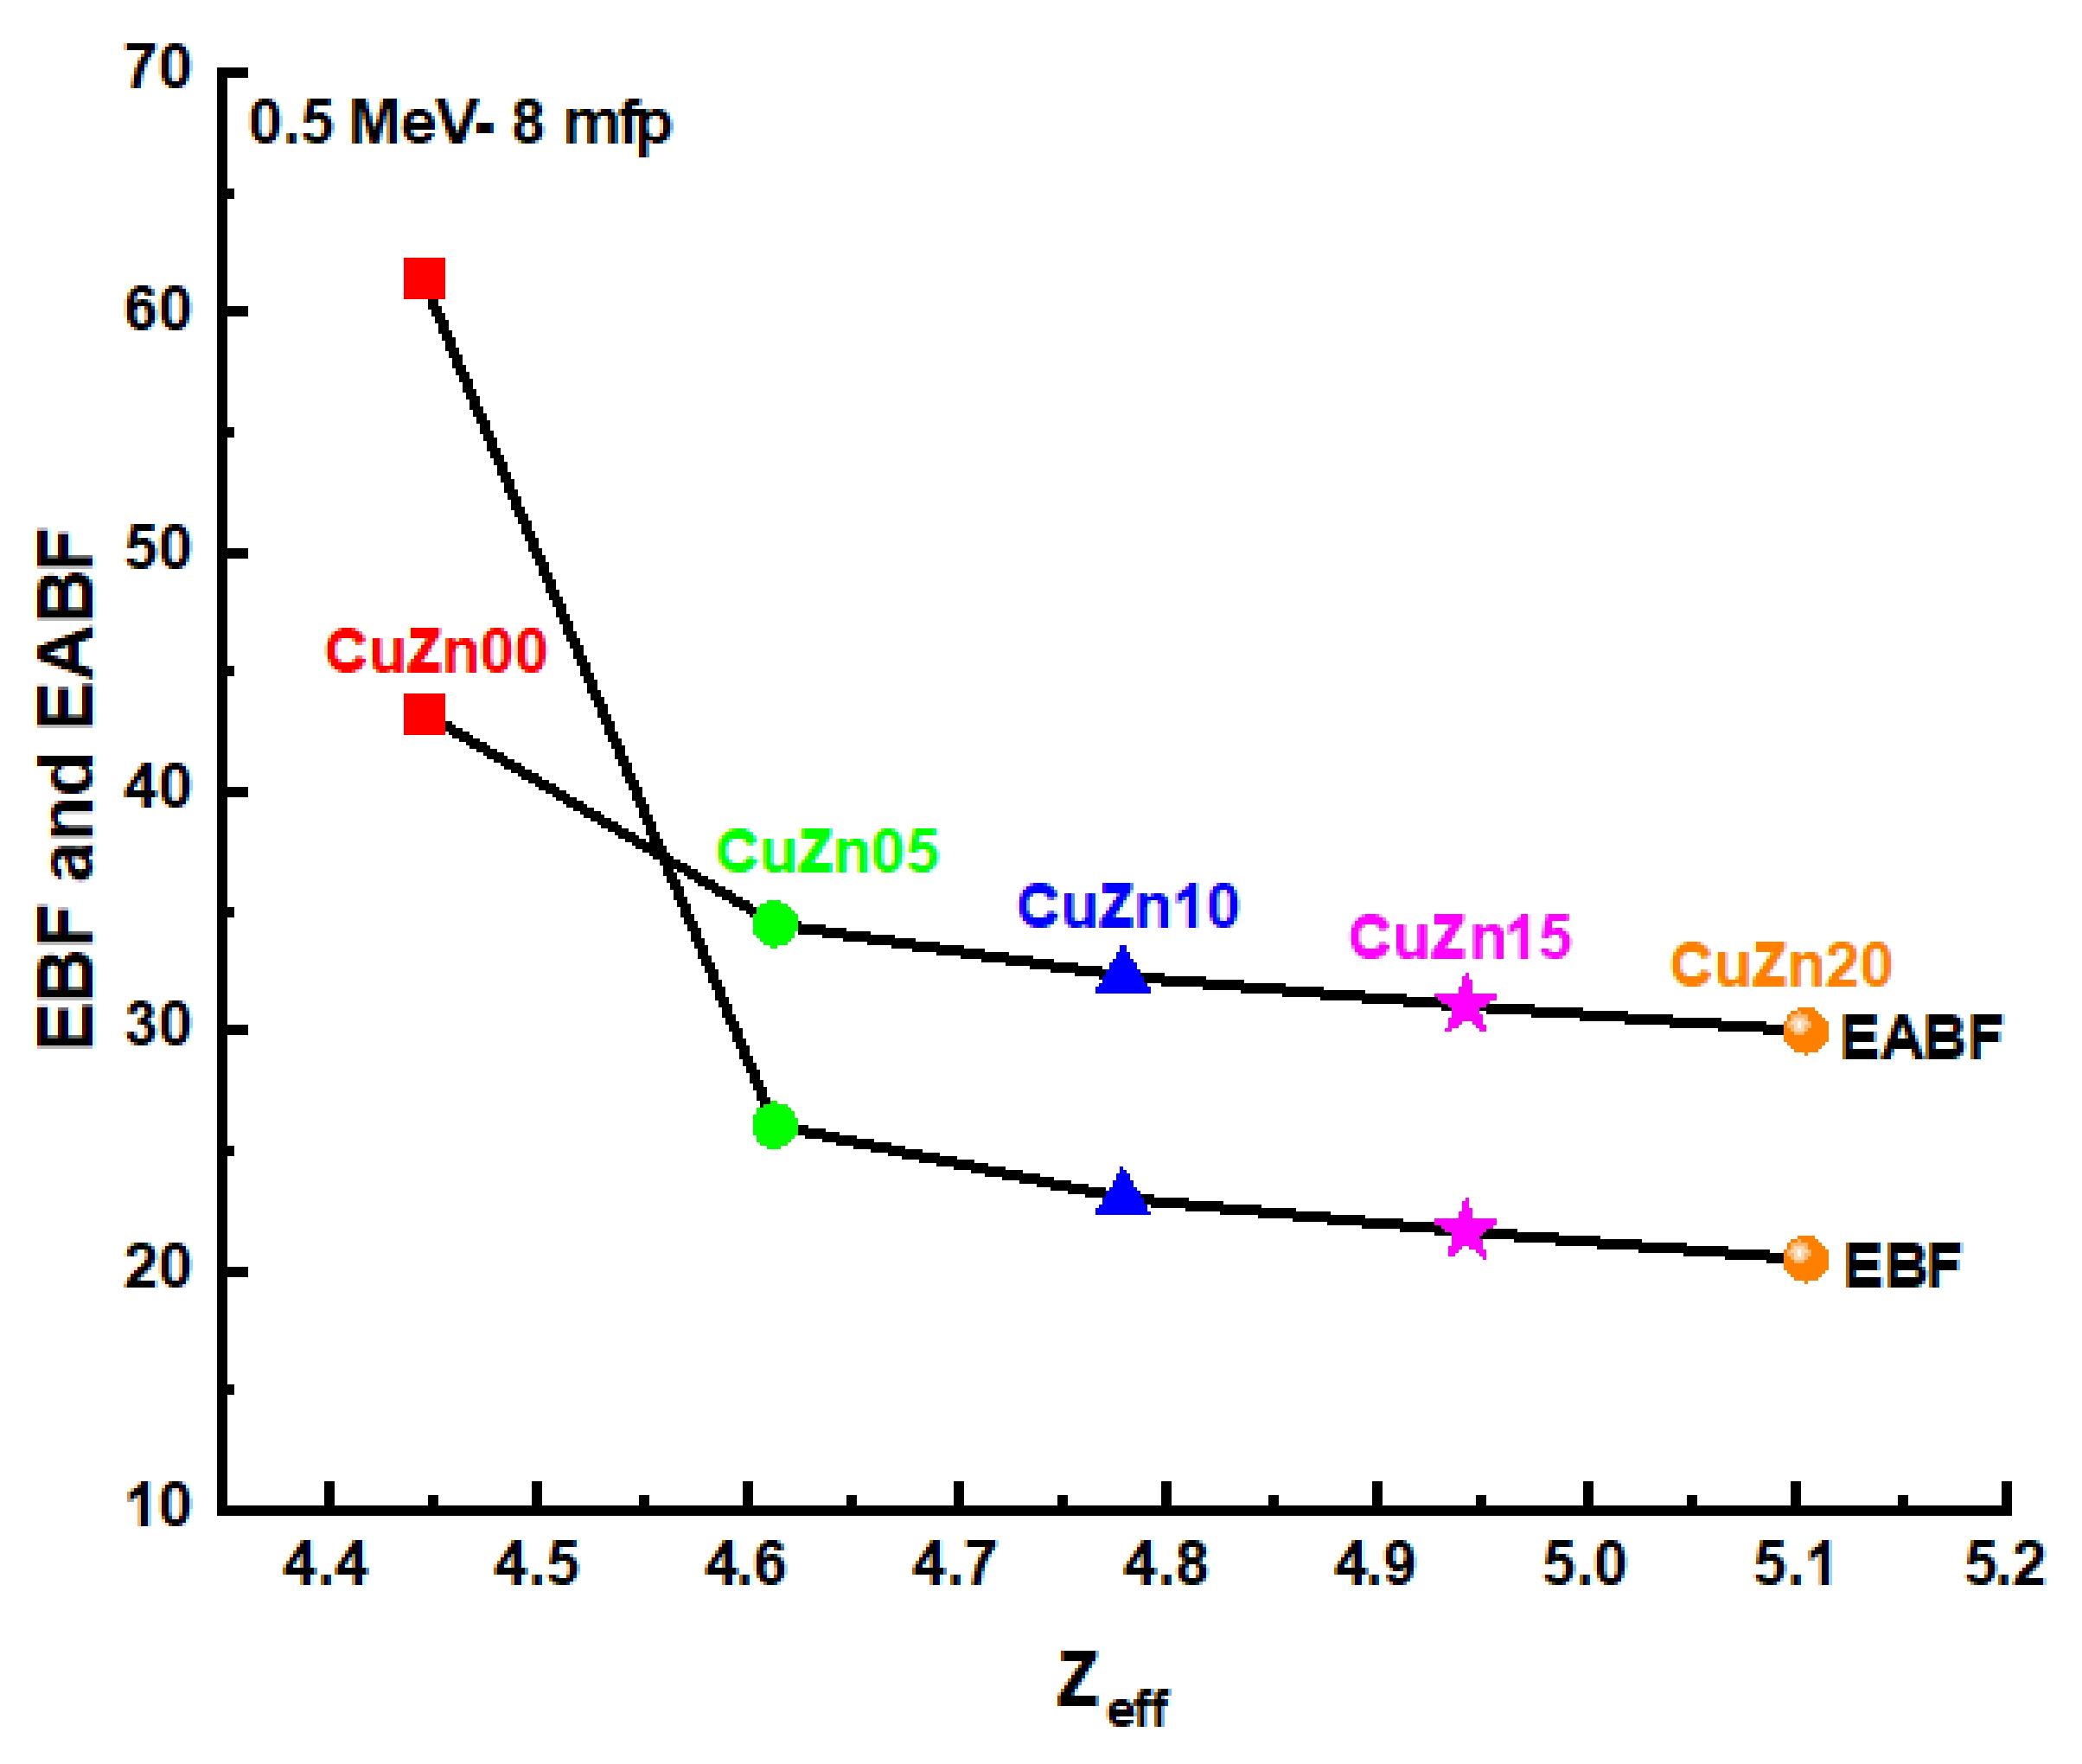
In Figure 13, this comparison is depicted for samples at 15 mfp, where only for CuZn00 it results in EABF smaller than EBF. While Figure 14 illustrate the Variation of energy absorption buildup factor (EABF) and exposure buildup factor (EBF) against the effective atomic number (Zeff) of samples at 8 mfp and 0.5 MeV.
The ΣR values for the sample are given in Figure 15. Higher values of the fast neutron removal cross-section (ΣR) in the CuZn-composite samples, with a maximum in mixture CuZn05, are related with the higher composite densities and amounts of H, C, and O, with the highest in the CuZn05 sample. The concentrations of Cu and Zn have no effect on the ΣR dependence for the considered CuZn-composites. The highest ∑R value was reported for the CuZn05 sample as 0.0931 cm
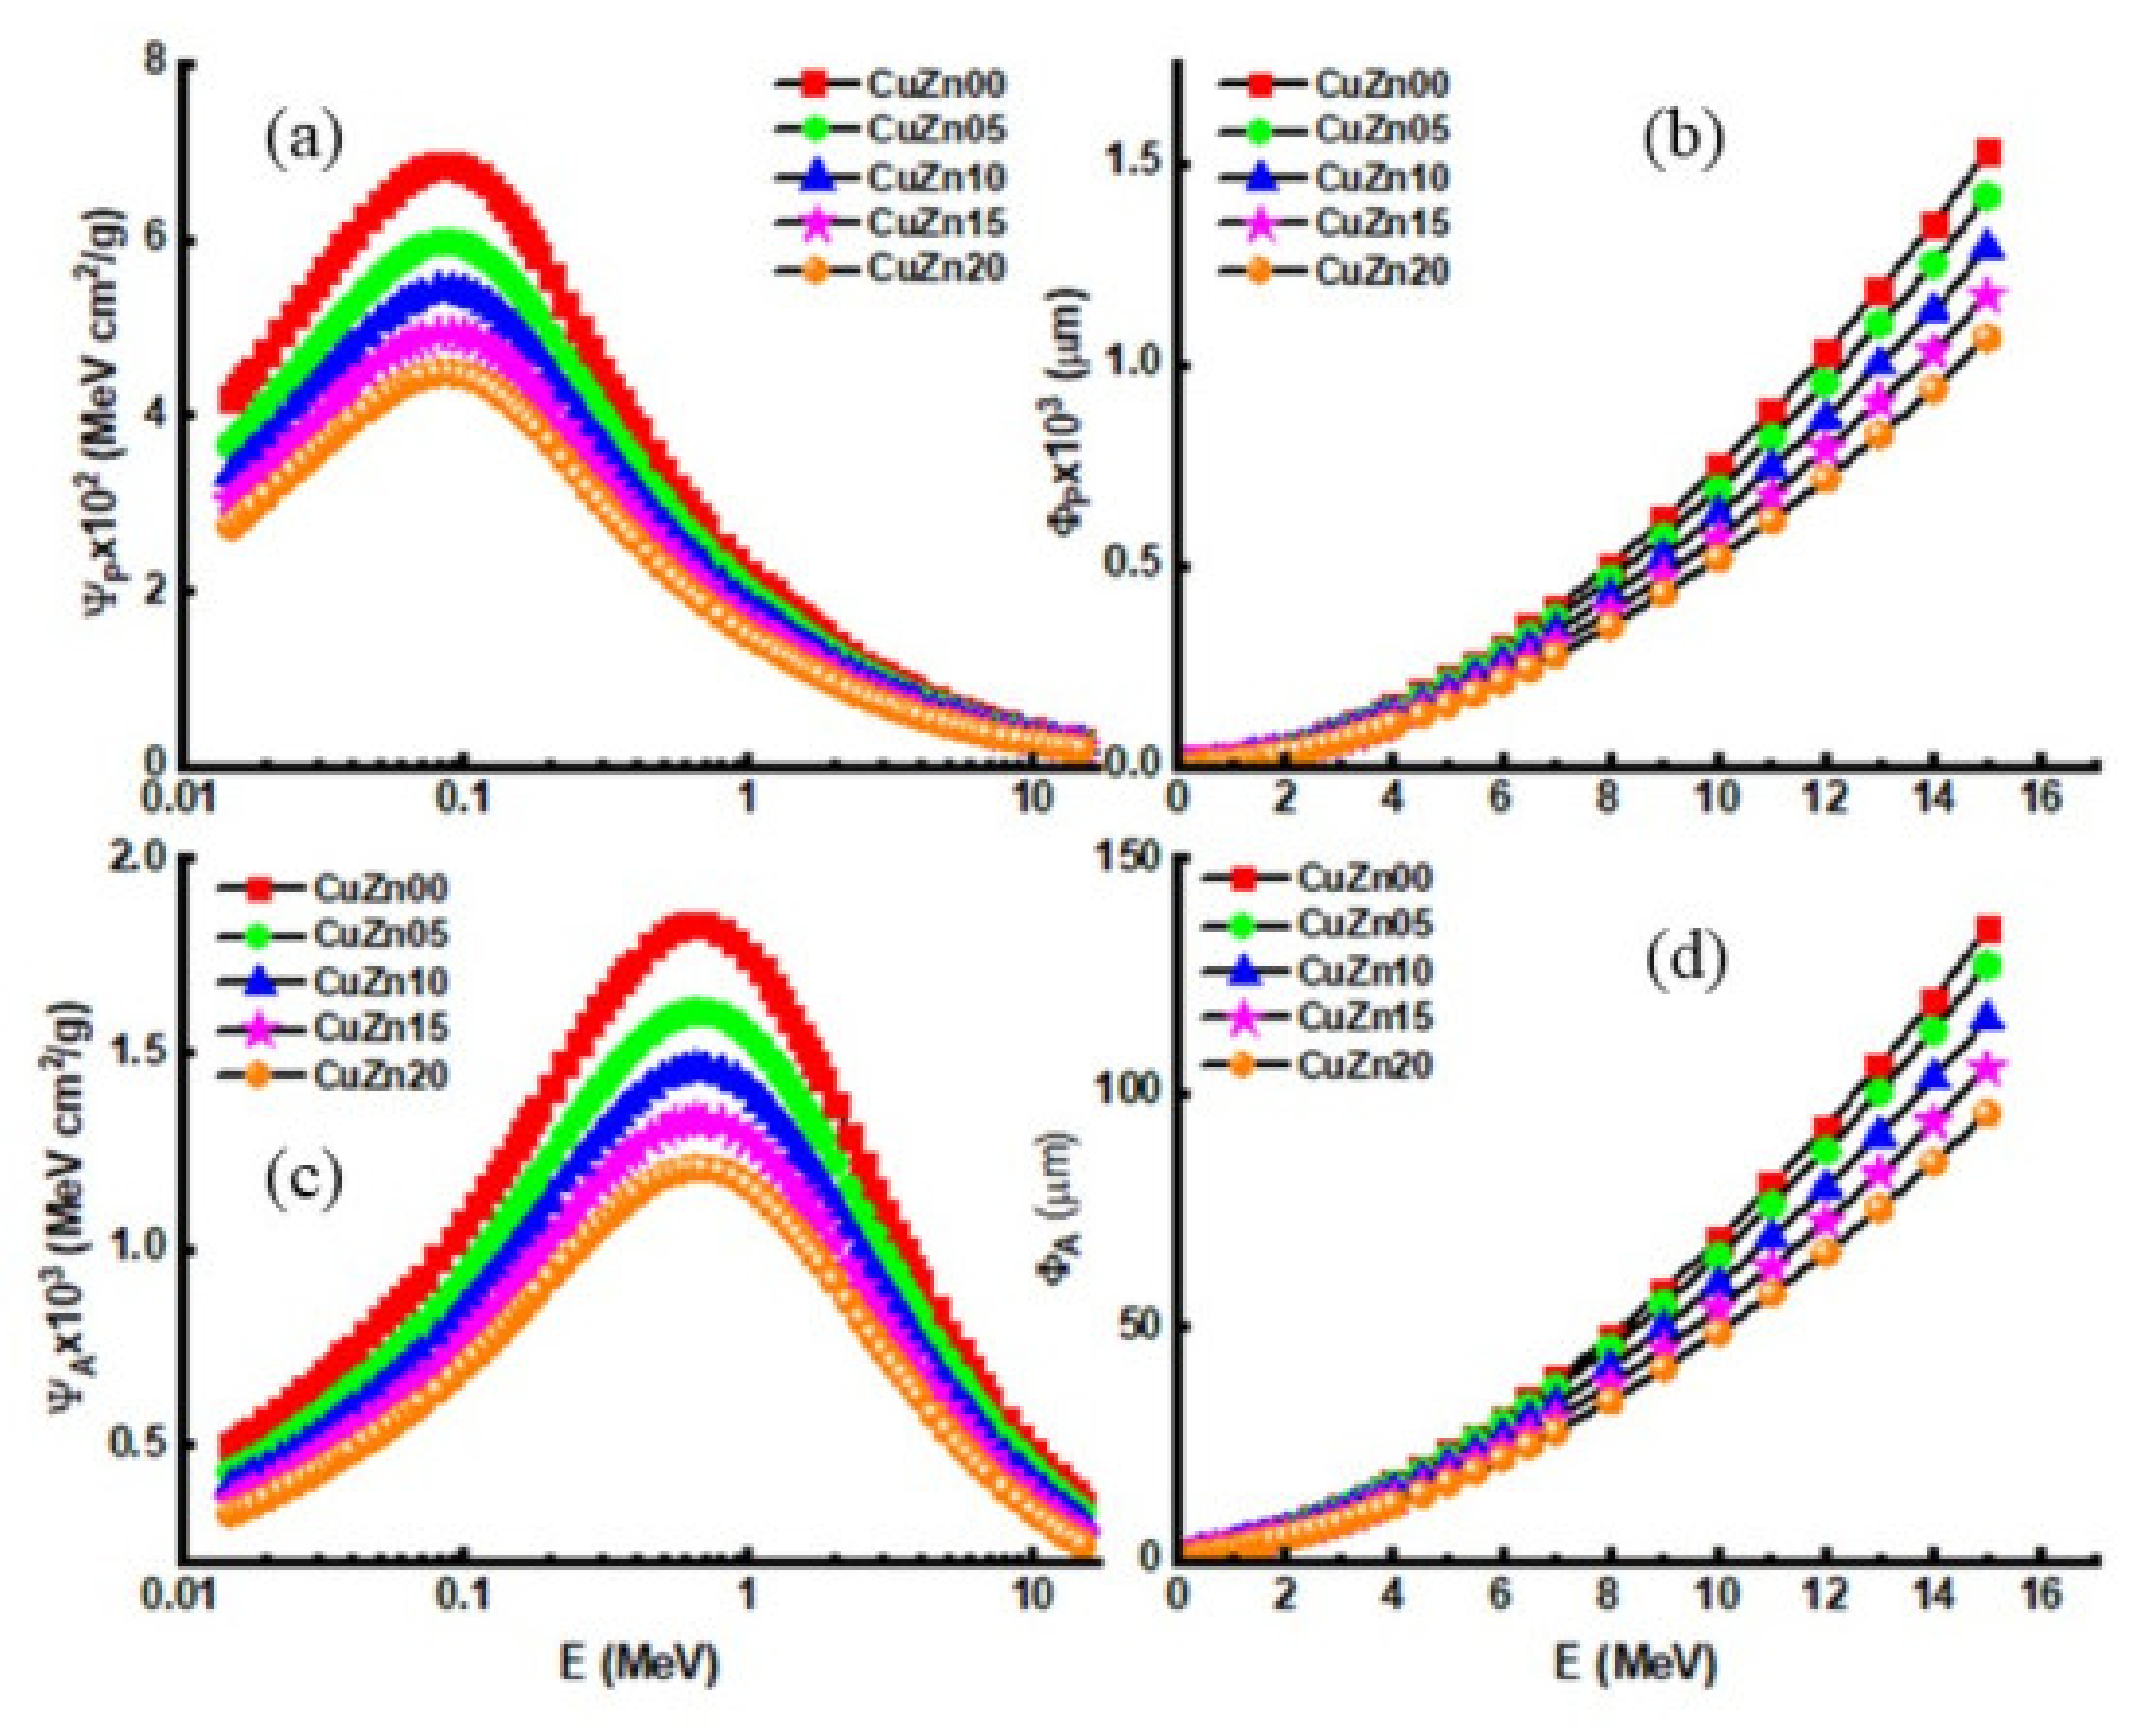
−1. Next, APR, ASP, PPR, PSP values pf CuZn00, CuZn05, CuZn10, CuZn15, and CuZn20 composite samples were calculated using the SRIM code. According to common assumptions, significant energy is lost in the composite samples medium through PMSP and AMSP.
Figure 16 reports the changes in the PMSP and AMSP values for CuZn00, CuZn05, CuZn10, CuZn15 and CuZn20 composite samples with varying energy levels. As seen in Figure 16, PMSP values rise as energy increases up to 0.07 MeV. Similarly, with rising energy up to 0.7 MeV, AMSP values also increase, as shown in Figure 16b. Moreiver, Figure 16a,b shows that AMSP and PMSP values decline depending on the increase in Cu and Zn concentration. Per the results, the lowest possible AMSP-PMSP in the energy range between 0.015–15 MeV is possessed by the CuZn20 sample. This situation mainly occurs because CuZn20 is the sample with the largest atomic numbers (Cu = 29 and Zn = 30) and the highest density (1.3649 g/cm3). Figure 16c,d show that the minimum PPR and ARP values belong to the CuZn20 sample, serving much better in terms of alpha and proton shielding than the others. The term RPE is a helpful metric for comparing the original and attenuated gamma source counts. This study evaluated the RPE values of produced polymer composites at four different thicknesses (0.5, 1.0, 2.0, and 3.0 cm).
Figure 17 illustrates the obtained experimental RPE values. As shown in Figure 17a, the RPE values of the superior composite polymer encoded CuZn20 increased linearly with material thickness. On the other hand, Figure 17b shows that increasing brass reinforces the amount in the composite structure, increasing the RPE at 2 cm material thickness. The purpose of this study was to determine the various effects of increasing the quantity of brass filler in manufactured polymer composites on their nuclear radiation shielding characteristics. Apart from the cross sections for effective removal cross-section for fast neutrons, the findings indicated that increasing the quantity of brass filler has several effects on nuclear radiation shielding characteristics.

4. Conclusions

In the present study, gamma-rays, charged particles and neutron attenuation characteristics of the reinforced composites prepared with adding different amounts of brass powders were investigated. MAC, LAC, RPE, HVL, TVL, mfp and Zeff, which are gamma-ray attenuation parameters, were investigated in the energy range of 0.060–1.408 MeV. To observe the variation of RPE values with thickness, the measurements of samples with 0.5, 1.0, 2.0 and 3.0 cm thicknesses were carried out within the specified energy range. EBF and EABF values of these reinforced composites were calculated up to 15 MeV and 40 mfp penetration depth, and their RDD values were computed for control purposes. While ΨP, ΦP, ΨA and ΦA parameters in terms of charged particle-matter interactions were determined, the ∑R parameter was calculated to investigate neutron attenuation properties. The following observations are reported from the determined parameters with the help of experimental, theoretical, or simulation codes.
It is seen that LAC, MAC, RPE, and Zeff parameters decrease exponentially with increasing photon energy and increase with increasing filler concentration. In addition, it was observed that RPE values increase rapidly with increasing thickness in samples considered in different thicknesses.
It was observed that HVL, TVL and mfp values increase with increasing energy but decrease with increasing filler concentration. This means that these composites are better gamma-ray shielding material in the low energy region than high energies, and a smaller thickness material is required for gamma-ray attenuation when the filler concentration increases.
According to the results of EBF and EABF, it has been reported that in the medium energy region where the Compton scattering cross section is dominant, these parameters take maximum values, whereas in the low and high energy regions, where the photoelectric and pair production cross sections are dominant, respectively, EBF and EABF values have taken relatively low values. In addition, it is noted that these parameters decrease with increasing filler concentration.
It was observed that ΨP and ΨA parameters increase exponentially up to 0.07 MeV and 0.7 MeV energies, respectively, and decrease similarly after these energies, and decrease with increasing filler concentration. ΦP and ΦA parameters increase with increasing photon energy and decrease with increasing filler concentration.
R values, which is another important parameter, decrease with increasing filler concentration. It has been observed from the ∑R results that while the CuZn00 coded sample is a bad neutron shielding material, CuZn20 coded composite is a good neutron shielding material compared to the other composites.
In terms of gamma-ray and charged particle attenuation characteristics, it was observed that a CuZn20 coded sample is a good shielding material compared to other composites.
It was aimed in this study to show how the amount of additive affects the attenuation parameters in prepared composites with a filler concentration between 5% and 20% (in 5% steps). It was noted in this study that the increase of filler concentration in the composites contributes positively for all parameters, except the ∑R parameter, in terms of radiation shielding characteristics. Therefore, these composites, which are recommended in terms of radiation shielding, can be preferred in nuclear power plants, radiation-related units of hospitals, and research laboratories due to their lightness, easy production, and easy formability advantages.

Author Contributions

Conceptualization, S.A.M.I., A.E., G.A. and H.O.T.; methodology, F.A., H.M.H.Z.; S.A.M.I., M.R.K., H.P. and M.O.; software, H.M.H.Z., M.R.K., H.P., M.O. and H.O.T.; validation, F.A., M.R.K., H.P., M.O. and A.E.; formal analysis, F.A., H.O.T., H.M.H.Z. and S.A.M.I.; investigation, M.R.K., H.P., W.S.A., M.O., G.A.; resources, M.R.K., H.P., M.O.; data curation, F.A., H.O.T., H.M.H.Z. and S.A.M.I.; writing—original draft preparation, H.O.T., G.A., H.M.H.Z. and S.A.M.I.; writing—review and editing, F.A., W.S.A., H.O.T., S.A.M.I.; visualization, M.R.K., H.P., M.O.; supervision, F.A., H.O.T. and A.E.; project administration, W.S.A. and S.A.M.I.; funding acquisition, G.A., A.E. All authors have read and agreed to the published version of the manuscript.

Funding

This research was funded by the Deanship of Scientific Research at Princess Nourah bint Abdulrahman University through the Fast-track Research Funding Program. Authors expresses their thanks to “Dunarea de Jos” University of Galati, Romania for APC support.

Data Availability Statement

The data presented in this study are available on request from the corresponding author.

Acknowledgments

This research was funded by the Deanship of Scientific Research at Princess Nourah bint Abdulrahman University through the Fast-track Research Funding Program.

Conflicts of Interest

The authors declare no conflict of interest.

References

  1. McCaffrey, J.P.; Shen, H.; Downton, B.; Mainegra-Hing, E. Radiation attenuation by lead and nonlead materials used in radiation shielding garments. Med. Phys. 2007, 34, 530–537. [Google Scholar] [CrossRef] [PubMed]
  2. Singh, J.; Kumar, V.; Vermani, Y.K.; Al-Buriahi, M.; Alzahrani, J.S.; Singh, T. Fabrication and characterization of barium based bioactive glasses in terms of physical, structural, mechanical and radiation shielding properties. Ceram. Int. 2021, 47, 21730–21743. [Google Scholar] [CrossRef]
  3. More, C.V.; Alsayed, Z.; Badawi, M.S.; Thabet, A.A.; Pawar, P.P. Polymeric composite materials for radiation shielding: A review. Environ. Chem. Lett. 2021, 19, 2057–2090. [Google Scholar] [CrossRef] [PubMed]
  4. Tekin, H.O. MCNP-X Monte Carlo Code Application for Mass Attenuation Coefficients of Concrete at Different Energies by Modeling 3 × 3 Inch NaI(Tl) Detector and Comparison with XCOM and Monte Carlo Data. Sci. Technol. Nucl. Install. 2016, 2016, 6547318. [Google Scholar] [CrossRef] [Green Version]
  5. Tekin, H.; Singh, V.; Manici, T. Effects of micro-sized and nano-sized WO3 on mass attenauation coefficients of concrete by using MCNPX code. Appl. Radiat. Isot. 2017, 121, 122–125. [Google Scholar] [CrossRef] [PubMed]
  6. Dilsiz, K.; Ogul, H.; Akman, F.; Agar, O.; Kacal, M.R.; Polat, H.; Dursun, İ. Evaluation of CdS doped polyester composites regarding gamma and neutron shielding properties. Prog. Nucl. Energy 2021, 139, 103865. [Google Scholar] [CrossRef]
  7. Al-Buriahi, M.; El-Agawany, F.; Sriwunkum, C.; Akyildirim, H.; Arslan, H.; Tonguc, B.; El-Mallawany, R.; Rammah, Y. Influence of Bi2O3/PbO on nuclear shielding characteristics of lead-zinc-tellurite glasses. Phys. B Condens. Matter 2020, 581, 411946. [Google Scholar] [CrossRef]
  8. Al-Buriahi, M.S.; Sriwunkum, C.; Arslan, H.; Tonguc, B.T.; Bourham, M.A. Investigation of barium borate glasses for radiation shielding applications. Appl. Phys. A 2020, 126, 68. [Google Scholar] [CrossRef]
  9. Abouhaswa, A.S.; Al-Buriahi, M.S.; Chalermpon, M.; Rammah, Y.S. Influence of ZrO2 on gamma shielding properties of lead borate glasses. Appl. Phys. A 2020, 126, 78. [Google Scholar] [CrossRef]
  10. Akman, F.; Sayyed, M.; Kaçal, M.; Tekin, H. Investigation of photon shielding performances of some selected alloys by experimental data, theoretical and MCNPX code in the energy range of 81 keV–1333 keV. J. Alloys Compd. 2019, 772, 516–524. [Google Scholar] [CrossRef]
  11. Agar, O.; Sayyed, M.; Akman, F.; Tekin, H.O.; Kaçal, M. An extensive investigation on gamma ray shielding features of Pd/Ag-based alloys. Nucl. Eng. Technol. 2019, 51, 853–859. [Google Scholar] [CrossRef]
  12. Tekin, H.; Kilicoglu, O. The influence of gallium (Ga) additive on nuclear radiation shielding effectiveness of Pd/Mn binary alloys. J. Alloys Compd. 2020, 815, 152484. [Google Scholar] [CrossRef]
  13. Mesbahi, A.; Ghiasi, H. Shielding properties of the ordinary concrete loaded with micro- and nano-particles against neutron and gamma radiations. Appl. Radiat. Isot. 2018, 136, 27–31. [Google Scholar] [CrossRef] [PubMed]
  14. Mesbahi, A.; Azarpeyvand, A.-A.; Shirazi, A. Photoneutron production and backscattering in high density concretes used for radiation therapy shielding. Ann. Nucl. Energy 2011, 38, 2752–2756. [Google Scholar] [CrossRef]
  15. Akman, F.; Kaçal, M.; Almousa, N.; Sayyed, M.; Polat, H. Gamma-ray attenuation parameters for polymer composites reinforced with BaTiO3 and CaWO4 compounds. Prog. Nucl. Energy 2020, 121, 103257. [Google Scholar] [CrossRef]
  16. AL-Dhuhaibat, M.J.R. Study of the shielding properties for some composite materials manufactured from polymer epoxy supported by cement, aluminum, iron and lead against gamma rays of the cobalt radioactive source (Co-60). Int. J. Appl. Innov. Eng. Manag. 2015, 4, 090–098. [Google Scholar]
  17. RSICC Computer Code Collection. MCNPX User’s Manual Version 2.4.0. Monte Carlo N-Particle Transport Code System for Multiple and High Energy Applications. 2002. Available online: http://www.nea.fr/abs/html/ccc-0715.html (accessed on 24 July 2021).
  18. National Nuclear Data Center (NNDC) in Brookhaven National Laboratory, National Nuclear Data Center (NNDC) in Brookhaven National Laboratory (n.d.). Available online: https://www.nndc.bnl.gov/nudat2/ (accessed on 24 July 2021).
  19. Maestro, No Title. 2018. Available online: http://www.Ortec-Online.Com/Download/Maest (accessed on 24 July 2021).
  20. Agar, O.; Boztosun, I.; Segebade, C. Multielemental analysis of some soils in Karaman by PAA using a cLINAC. Appl. Radiat. Isot. 2017, 122, 57–62. [Google Scholar] [CrossRef] [PubMed]
  21. Al-Buriahi, M.S.; Tonguc, B.T. Mass attenuation coefficients, effective atomic numbers and electron densities of some contrast agents for computed tomography. Radiat. Phys. Chem. 2020, 166, 108507. [Google Scholar] [CrossRef]
  22. Issa, S.A.; Zakaly, H.M.; Pyshkina, M.; Mostafa, M.Y.; Rashad, M.; Soliman, T. Structure, optical, and radiation shielding properties of PVA–BaTiO3 nanocomposite films: An experimental investigation. Radiat. Phys. Chem. 2021, 180, 109281. [Google Scholar] [CrossRef]
  23. Harima, Y.; Sakamoto, Y.; Tanaka, S.; Kawai, M. Validity of the Geometric-Progression Formula in Approximating Gamma-Ray Buildup Factors. Nucl. Sci. Eng. 1986, 94, 24–35. [Google Scholar] [CrossRef]
  24. Kurtuluş, R.; Kavas, T.; Agar, O.; Turhan, M.F.; Kaçal, M.R.; Dursun, I.; Akman, F. Study on recycled Er-incorporated waste CRT glasses for photon and neutron shielding. Ceram. Int. 2021, 47, 26335–26349. [Google Scholar] [CrossRef]
  25. Kumar, A. Gamma ray shielding properties of PbO-Li2O-B2O3 glasses. Radiat. Phys. Chem. 2017, 136, 50–53. [Google Scholar] [CrossRef]
  26. Ziegler, J.F.; Ziegler, M.; Biersack, J. SRIM—The stopping and range of ions in matter. Nucl. Instrum. Methods Phys. Res. B 2010, 268, 1818–1823. [Google Scholar] [CrossRef] [Green Version]
  27. Belgin, E.E.; Aycik, G.; Kalemtas, A.; Pelit, A.; Dilek, D.; Kavak, M. Preparation and characterization of a novel ionizing electromagnetic radiation shielding material: Hematite filled polyester based composites. Radiat. Phys. Chem. 2015, 115, 43–48. [Google Scholar] [CrossRef]
  28. Lamarash, J.R.; Baratta, A.J. Introduction to Nuclear Engineering, 3rd ed.; Prentice Hall: Upper Saddle River, NJ, USA, 2001. [Google Scholar]
  29. Ahmed, B.; Shah, G.; Malik, A.H.; Rizwan, M. Gamma-ray shielding characteristics of flexible silicone tungsten composites. Appl. Radiat. Isot. 2020, 155, 108901. [Google Scholar] [CrossRef] [PubMed]
  30. Alsayed, Z.; Badawi, M.S.; Awad, R.; El-Khatib, A.M.; Thabet, A.A. Investigation of γ-ray attenuation coefficients, effective atomic number and electron density for ZnO/HDPE composite. Phys. Scr. 2020, 95, 085301. [Google Scholar] [CrossRef]
Figure 1. Fabricated brass composites: (a) unreinforced (CuZn00) reference polymer composite samples, (b) 5% brass reinforced (CuZn05) polymer composite samples, (c) 10% brass reinforced (CuZn10) polymer composite samples, (d) 15% brass reinforced (CuZn15) polymer composite samples, and (e) 20% brass reinforced (CuZn20) polymer composite samples.
Polymers 13 03157 g001
Figure 2. Production scheme of composite materials.
Polymers 13 03157 g002
Figure 3. Narrow beam transmission geometry for experimental mass attenuation coefficient calculations.
Polymers 13 03157 g003
Figure 4. MCNPX simulation setup used for gamma-ray transmission simulations (a direct screenshot from the MCNPX Visual Editor VE X_22S).
Polymers 13 03157 g004
Figure 5. Mass attenuation coefficient (μm) values as a function of photon energy and Cu-Zn content of samples.
Polymers 13 03157 g005
Figure 6. Linear attenuation coefficient (LAC) values as a function of photon energy and Cu-Zn content of samples.
Polymers 13 03157 g006
Figure 7. Half value layer (HVL) values as a function of photon energy and Cu-Zn content of samples.
Polymers 13 03157 g007
Figure 8. Tenth value layer (TVL) values as a function of photon energy and Cu-Zn content of samples.
Polymers 13 03157 g008
Figure 9. Mean free path (MFP) values as a function of photon energy and Cu-Zn content of samples.
Polymers 13 03157 g009
Figure 10. Effective atomic number (Zeff) values as a function of photon energy and Cu-Zn content of samples.
Polymers 13 03157 g010
Figure 11. Exposure buildup factor (EBF) against photon energy of samples at 1, 5, 10, 20 and 40 mfp.
Polymers 13 03157 g011
Figure 12. Energy absorption buildup factor (EABF) against photon energy of samples at 1, 5, 10, 20 and 40 mfp.
Polymers 13 03157 g012
Figure 13. Difference between energy absorption buildup factor (EABF) and exposure buildup factor (EBF) of samples at 15 mfp.
Polymers 13 03157 g013
Figure 14. Variation of energy absorption buildup factor (EABF) and exposure buildup factor (EBF) against effective atomic number (Zeff) of samples at 8 mfp and 0.5 MeV.
Polymers 13 03157 g014
Figure 15. Fast neutron removal cross sections (ΣR) values for the selected samples.
Polymers 13 03157 g015
Figure 16. (a) Proton mass stopping power (ΨP), (b) proton projected range (ΦP), (c) alpha mass stopping power (ΨA) and (d) alpha projected range (ΦA) of samples.
Polymers 13 03157 g016
Figure 17. (a) Radiation protection efficiency (RPE) of CuZn20 sample at different thicknesses (b) Radiation protection efficiency (RPE) of fabricated composites at 2 cm.
Polymers 13 03157 g017
Table 1. Samples codes, elemental compositions (wt%) and density (ρ) of samples.
CodeCoCHOCuZnρ (g/cm3)
CuZn000.034759.96934.586735.4093--1.1881
CuZn050.033157.20834.375633.7792.73071.87331.3436
CuZn100.031754.69024.18332.29235.22113.58171.3496
CuZn150.030452.38454.006630.93097.50155.14611.3577
CuZn200.029150.26553.844629.67969.59736.58391.3649
Table 2. Experimental, theoretical and Monte Carlo mass attenuation coefficients (cm2/g) results of brass reinforced composites.
CuZn00CuZn05CuZn10CuZn15CuZn20
Energy (keV)ExperimentalWinXcomMCNPXExperimentalWinXcomMCNPXExperimentalWinXcomMCNPXExperimentalWinXcomMCNPXExperimentalWinXcomMCNPX
59.540.19040.18870.19090.25340.25830.25910.32800.32150.32240.36130.37950.38040.41490.43250.4331
81.000.16220.16970.17010.19170.19740.19830.21930.22260.22310.24250.24570.24610.26420.26680.2671
122.060.14270.15020.15160.15360.15800.15840.17140.16510.16630.17020.17160.17240.17100.17750.1783
136.470.14730.14530.14650.15710.15070.15120.15140.15560.15610.15500.16020.16120.16560.16430.1645
276.400.11680.11500.11620.11140.11520.11280.11230.11540.11580.11130.11560.11630.11440.11570.1163
302.850.11490.11120.11170.11130.11120.11190.10820.11120.11170.10600.11130.11270.11540.11130.1118
356.020.10560.10450.10510.10520.10440.10480.10820.10420.10480.10880.10410.10590.10550.10400.1051
383.850.09760.10150.10190.10490.10130.10190.10580.10110.10140.10320.10090.10070.10190.10070.1014
511.000.08960.09030.09100.09130.09000.09140.09330.08970.09050.08760.08940.08990.09040.08910.0905
661.660.08420.08070.08150.08350.08030.08120.08320.08000.08220.08300.07970.08060.07950.07940.0799
778.900.07260.07490.07610.07670.07460.07500.07090.07420.07530.07740.07390.07410.07020.07370.0738
834.850.07540.07250.07340.07460.07220.07280.07230.07190.07250.07460.07160.07240.06920.07130.0710
867.380.06840.07120.07230.06970.07090.07110.07110.07060.07210.06940.07030.07130.07250.07000.0707
964.080.06460.06770.06820.06880.06740.06810.06400.06710.06830.06580.06680.06710.06440.06650.0661
1085.870.06490.06390.06430.06200.06360.06390.06540.06330.06380.06220.06300.06440.06350.06270.0633
1112.070.06090.06310.06350.06540.06280.06310.05940.06250.06310.06060.06220.06320.06090.06200.0624
1173.240.05980.06150.06260.06310.06110.06140.06250.06080.06170.05820.06060.06150.06130.06030.0615
1212.950.05940.06040.06100.06060.06010.06100.06240.05980.06090.06190.05950.05910.05750.05930.0606
1274.530.05590.05890.05930.06110.05860.05910.05540.05830.05910.06010.05800.05840.06050.05780.0581
1299.140.05640.05830.05870.05870.05800.05840.05890.05770.05810.05960.05750.05850.05970.05730.0561
1332.500.05470.05760.05790.05460.05730.05710.05910.05700.05760.05760.05670.05730.05820.05650.0577
1408.010.05810.05600.05640.05410.05570.05590.05390.05540.05580.05280.05520.05580.05410.05490.0551
Table 3. (EBF and EABF) G-P fitting coefficients (b. c. a. Xk and d) of CuZn00 sample.
E (MeV)ZeqEBFEABF
bcaXkdbcaXkd
0.0156.751.27020.49030.165014.2795−0.08251.27460.49480.160614.5342−0.0782
0.0206.761.61830.61890.118515.3538−0.05791.63590.61430.120915.2516−0.0594
0.0306.782.80800.90730.036215.1029−0.02962.92480.90810.035415.3190−0.0277
0.0406.794.20271.3703−0.067913.64470.02654.19651.3627−0.065913.85880.0245
0.0506.785.38011.7358−0.124713.95030.05395.03721.7192−0.121814.06640.0518
0.0606.795.84322.0245−0.162613.84670.07465.19891.9912−0.157913.94450.0709
0.0806.845.62972.3435−0.198913.46910.09084.90542.2640−0.188713.63470.0825
0.1006.805.33642.4076−0.200014.39190.08674.59402.3045−0.187914.55530.0782
0.1506.894.01212.4953−0.212814.11310.09563.72582.3187−0.190614.46640.0767
0.2006.913.42412.4317−0.210013.46410.09053.34932.2089−0.180414.79750.0761
0.3006.962.96942.1529−0.181214.07410.07632.83922.0589−0.168314.24010.0669
0.4005.962.84382.2142−0.194113.43460.08172.62521.9291−0.153614.82010.0632
0.5005.962.65792.0255−0.173014.12980.08052.45501.8034−0.138415.98940.0618
0.6005.002.54702.1610−0.198013.69000.10202.35801.7200−0.129014.73000.0510
0.8007.002.24101.5800−0.112014.03000.04842.20201.5440−0.105014.20000.0434
1.0008.002.09801.4180−0.084014.35000.03332.10401.4270−0.086014.20000.0347
1.5006.611.98411.2853−0.062114.39080.02781.93471.2763−0.060014.34630.0263
2.0006.251.88761.1878−0.043013.97960.01981.84091.1693−0.037814.37870.0151
3.0006.291.74161.0589−0.014012.58380.00561.71291.0521−0.011613.90090.0032
4.0006.231.64760.98670.004023.1851−0.00711.62670.98750.004013.1886−0.0032
5.0006.251.70450.93930.017314.2524−0.01141.56480.94270.015914.6355−0.0090
6.0006.241.52290.90620.027013.8686−0.01591.51280.90910.026913.5889−0.0178
8.0006.261.43540.87310.036615.6143−0.02991.43000.87990.034912.0910−0.0179
10.0006.261.36970.85990.040612.8557−0.02121.37420.86200.039514.3227−0.0222
15.0006.251.27470.84100.043615.2093−0.03071.28010.83830.047515.6699−0.0332
Table 4. (EBF and EABF) G–P fitting coefficients (b. c. a. Xk and d) of CuZn05 sample.
E (MeV)ZeqEBFEABF
bcaXkdbcaXkd
0.01510.491.06710.38690.217912.1098−0.11191.06640.09850.197111.6964−0.0931
0.02010.801.13570.40430.209113.6052−0.11211.13510.41540.199814.5453−0.1093
0.03011.201.36770.47370.178614.5553−0.09411.37930.46650.182214.6027−0.0957
0.04011.461.70320.61290.119615.8297−0.06091.75310.59530.127115.7675−0.0666
0.05011.642.20220.67040.111714.2060−0.06202.32760.66290.115314.0830−0.0669
0.06011.782.54420.81830.064114.5671−0.05162.86020.80970.067813.4014−0.0476
0.08011.992.94601.03990.004813.6992−0.02003.78041.0590−0.001214.3334−0.0149
0.10012.153.06171.2102−0.030912.3990−0.00614.21751.2634−0.044412.76370.0055
0.15012.392.97071.4156−0.068317.70970.01124.11561.5317−0.092313.65960.0293
0.20012.372.82041.5059−0.082716.38000.01673.66451.6465−0.109913.86800.0375
0.30013.202.53291.5015−0.083516.35960.01653.10291.6248−0.107114.29960.0337
0.40012.712.41241.5099−0.087216.17250.02022.77991.6085−0.105814.69060.0326
0.50012.762.29361.4813−0.084416.31350.02042.59561.5442−0.096315.22760.0276
0.60013.102.19501.4456−0.080517.19220.02262.42851.5186−0.095514.81180.0318
0.80012.732.08531.3885−0.073116.08190.02102.23731.4416−0.084514.71690.0288
1.00012.791.99601.3388−0.066615.81780.02192.11821.3700−0.073415.08010.0259
1.5008.911.91211.2545−0.054314.70700.02121.94061.2583−0.055314.29990.0217
2.0007.291.85161.1723−0.038814.39520.01631.83621.1732−0.039114.15570.0163
3.0007.241.71621.0587−0.013213.67620.00401.70851.0557−0.012512.97590.0036
4.0007.241.62930.98920.004016.8470−0.00501.62700.98150.006813.9861−0.0070
5.0007.191.56020.94140.017613.7491−0.01251.56480.93320.020413.4637−0.0144
6.0007.201.51450.90430.029013.1225−0.01951.49730.92900.020316.7108−0.0177
8.0007.171.42190.88770.033011.7862−0.01651.42650.87400.038312.0935−0.0224
10.0007.171.36050.87280.037414.1703−0.02271.36260.86950.038514.2524−0.0232
15.0007.151.27000.84120.048315.0384−0.03471.26990.84040.048814.9603−0.0357
Table 5. (EBF and EABF) G–P fitting coefficients (b. c. a. Xk and d) of CuZn10 sample.
E (MeV)ZeqEBFEABF
bcaXkdbcaXkd
0.01512.301.03450.39880.209514.0027−0.13491.0350.3900.22013.574−0.145
0.02012.691.07240.40050.207413.9690−0.11161.0760.3720.22414.220−0.118
0.03013.161.21550.41740.201114.9117−0.10631.2180.4120.20814.118−0.114
0.04013.481.43350.48200.176814.5599−0.09771.4540.4740.18014.722−0.100
0.05013.701.67630.60430.124515.4743−0.06511.7520.5940.12716.208−0.069
0.06013.861.93280.70130.093614.9754−0.05242.2120.6140.13539.767−0.078
0.08014.102.37990.82970.060714.4832−0.05063.0290.8100.06713.942−0.051
0.10014.262.57480.99690.017113.7637−0.03263.6420.9990.01613.7480.008
0.15014.542.66661.2322−0.033811.0916−0.01033.9921.297−0.05017.2360.005
0.20014.662.61861.3376−0.05138.5939−0.00763.7001.442−0.07515.5670.016
0.30014.712.44591.4433−0.073718.51490.01283.1261.544−0.09414.2430.025
0.40014.912.32761.4429−0.075517.05090.01412.8031.531−0.09315.1720.026
0.50015.062.22271.4320−0.075816.30830.01562.5911.502−0.09015.3110.025
0.60015.012.14691.4157−0.074916.45730.01802.4431.475−0.08714.9470.026
0.80015.182.03391.3709−0.070115.81870.01982.2461.407−0.07715.2420.024
1.00014.721.96481.3230−0.063016.68560.01982.1171.358−0.07115.0020.024
1.5009.771.89761.2455−0.052014.92750.01931.9391.256−0.05514.2910.021
2.0008.451.82981.1623−0.035715.23350.01341.8401.165−0.03614.6420.014
3.0008.171.70921.0523−0.011012.71740.00191.7101.052−0.01114.1080.002
4.0008.091.62340.99010.004120.2274−0.00711.6210.9860.00612.977−0.007
5.0008.081.55250.94730.016014.4433−0.01141.5560.9420.01813.262−0.013
6.0008.071.50470.91690.025215.5315−0.02291.5050.9070.02915.103−0.026
8.0008.021.41690.89110.033012.3083−0.01941.4110.8960.03112.330−0.017
10.0008.031.35790.87210.039113.9794−0.02531.3560.8670.04113.900−0.027
15.0007.991.26510.84200.050015.0301−0.03861.2590.8480.04814.753−0.036
Table 6. (EBF and EABF) G–P fitting coefficients (b. c. a. Xk and d) of CuZn15 sample.
E (MeV)ZeqEBFEABF
bcaXkdbcaXkd
0.01513.591.02540.36720.239413.4062−0.16281.02480.39440.210212.3559−0.1150
0.02014.011.05090.42610.178917.5870−0.10741.05090.42580.179217.5836−0.1076
0.03014.541.15830.39450.214414.2188−0.11561.15880.39230.217214.1113−0.1202
0.04014.871.32320.87690.194114.4170−0.10821.33140.44110.193414.6535−0.1067
0.05015.101.52360.51670.163414.6819−0.09101.56320.52050.158215.1865−0.0851
0.06015.281.71800.61680.123514.7374−0.06761.91270.54720.158914.1375−0.0836
0.08015.532.07640.76020.078713.9917−0.04782.63990.68440.112013.3225−0.0743
0.10015.682.32470.89020.044813.3232−0.04293.26180.86660.052613.6278−0.0497
0.15015.942.49931.1370−0.014812.5436−0.01923.84201.1705−0.024213.3164−0.0100
0.20016.112.49081.2633−0.037911.0356−0.01273.67511.3306−0.054319.26650.0042
0.30016.412.38371.3528−0.05438.0921−0.01003.15321.4525−0.077317.27750.0177
0.40016.432.27351.4000−0.067217.69730.00992.83751.4639−0.080216.87030.0182
0.50016.392.18961.4075−0.071617.49400.01542.60231.4662−0.083015.83160.0213
0.60016.672.11871.3840−0.068618.35540.01562.44821.4394−0.079916.14140.0216
0.80016.662.01701.3489−0.065316.57290.01662.25061.3881−0.073615.47940.0217
1.00016.621.94271.3098−0.060415.90770.01712.12621.3313−0.066015.39900.0209
1.50010.921.88011.2347−0.049215.19340.01691.93621.2532−0.054014.28070.0205
2.0009.411.81561.1589−0.035014.90530.01291.84211.1604−0.035514.68630.0134
3.0008.991.70111.0535−0.011012.00030.00161.70851.0513−0.010312.99850.0007
4.0008.911.61790.99070.004717.9186−0.00761.61860.98500.007013.0340−0.0087
5.0008.881.54740.94990.016014.6750−0.01421.55140.94330.018313.0806−0.0135
6.0008.841.50150.91610.026914.3029−0.02351.49750.91320.027415.3593−0.0263
8.0008.801.41370.89430.033012.6694−0.02141.40410.89810.031612.3150−0.0186
10.0008.801.35470.87320.040213.7516−0.02771.34650.87500.039513.9089−0.0277
15.0008.791.26440.83640.054114.8293−0.04391.24900.86100.045014.7411−0.0161
Table 7. (EBF and EABF) G–P fitting coefficients (b. c. a. Xk and d) of CuZn20 sample.
E (MeV)ZeqEBFEABF
bcaXkdbcaXkd
0.01514.591.02000.37830.232111.9979−0.14851.01960.40480.203211.6685−0.1077
0.02015.041.04090.42790.177414.4564−0.09081.04100.40620.197114.2506−0.1145
0.03015.591.12540.38980.214214.0982−0.11531.12540.38820.216613.8820−0.1184
0.04015.931.26080.45280.203414.5887−0.11231.27060.40730.211714.7440−0.1228
0.05016.171.42830.48200.178414.5750−0.10031.46320.47450.180914.6741−0.1010
0.06016.361.60140.56320.145314.5774−0.08111.69330.56500.140915.2738−0.0771
0.08016.621.89200.72840.085914.7435−0.05032.40250.61340.140113.2621−0.0879
0.10016.792.14270.84590.054313.6113−0.04282.98860.78300.079213.4774−0.0628
0.15017.082.36111.0817−0.004113.0417−0.02233.68211.0778−0.002613.2058−0.0218
0.20017.212.40511.2107−0.027811.6463−0.01663.62971.2521−0.038015.0416−0.0071
0.30017.232.33921.3314−0.05108.5743−0.01033.15731.4134−0.070319.39590.0150
0.40017.542.24531.3586−0.057810.9611−0.00372.83141.4368−0.075816.74860.0161
0.50017.522.15791.3865−0.067620.87200.01722.61131.4362−0.077316.78220.0185
0.60017.562.09791.3738−0.066818.73090.01532.45351.4195−0.075916.80400.0194
0.80017.701.99891.3427−0.064316.54700.01662.24861.3778−0.071615.62930.0205
1.00017.551.93051.3051−0.059415.99160.01672.12061.3331−0.066015.07700.0208
1.50012.251.86391.2322−0.048714.90520.01691.94001.2784−0.052714.56430.0200
2.00010.241.80441.1562−0.034414.64660.01251.84371.1569−0.034714.72100.0129
3.0009.861.69331.0546−0.011011.29650.00131.70741.0507−0.009711.9092−0.0002
4.0009.671.61330.99120.005215.9460−0.00811.61680.98420.007813.0832−0.0100
5.0009.631.54310.95220.016014.8733−0.01661.54790.94430.018612.9255−0.0141
6.0009.581.49880.91530.028413.2343−0.02391.49080.91900.026215.5826−0.0266
8.0009.561.41080.89720.033012.9880−0.02311.39810.89990.032112.3020−0.0203
10.0009.541.35190.87420.041213.5487−0.02981.33830.88190.038213.9165−0.0280
15.0009.511.26390.83170.057614.6614−0.04821.24060.87190.042614.73370.0010
Publisher’s Note: MDPI stays neutral with regard to jurisdictional claims in published maps and institutional affiliations.

