
Catalysis of the Thermal Decomposition of Transition Metal Nitrate Hydrates by Poly(vinylidene difluoride)


Abstract
:
1. Introduction
2. Experimental
3. Results and Discussion
4. Conclusions
Supplementary Materials
Author Contributions
Funding
Institutional Review Board Statement
Informed Consent Statement
Data Availability Statement
Acknowledgments
Conflicts of Interest
References
- Tashiro, K.; Kobayashi, M.; Tadokoro, H. Vibrational Spectra and Disorder-Order Transition of Poly(Vinylidene Fluoride) Form III. Macromolecules 1981, 14, 1757–1764. [Google Scholar] [CrossRef]
- Benz, M.; Euler, W.B.; Gregory, O.J. The Influence of Preparation Conditions on the Surface Morphology of Poly(Vinylidene Fluoride) Films. Langmuir 2001, 17, 239–243. [Google Scholar] [CrossRef]
- Benz, M.; Euler, W.B.; Gregory, O.J. The Role of Solution Phase Water on the Deposition of Thin Films of Poly(Vinylidene Fluoride). Macromolecules 2002, 35, 2682–2688. [Google Scholar] [CrossRef]
- Benz, M.; Euler, W.B. Determination of the Crystalline Phases of Poly(Vinylidene Fluoride) under Different Preparation Conditions Using Differential Scanning Calorimetry and Infrared Spectroscopy. J. Appl. Polym. Sci. 2003, 89, 1093–1100. [Google Scholar] [CrossRef]
- Lopes, A.C.; Costa, C.M.; Tavares, C.J.; Neves, I.C.; Lanceros-Mendez, S. Nucleation of the Electroactive γ Phase and Enhancement of the Optical Transparency in Low Filler Content Poly(Vinylidene)/Clay Nanocomposites. J. Phys. Chem. C 2011, 115, 18076–18082. [Google Scholar] [CrossRef]
- Martins, P.; Lopes, A.C.; Lanceros-Mendez, S. Electroactive Phases of Poly(Vinylidene Fluoride): Determination, Processing and Applications. Prog. Polym. Sci. 2014, 39, 683–706. [Google Scholar] [CrossRef]
- Singh, H.H.; Singh, S.; Khare, N. Enhanced β-Phase in PVDF Polymer Nanocomposite and Its Application for Nanogenerator. Polym. Adv. Technol. 2018, 29, 143–150. [Google Scholar] [CrossRef]
- Cardoso, V.; Correia, D.; Ribeiro, C.; Fernandes, M.; Lanceros-Méndez, S. Fluorinated Polymers as Smart Materials for Advanced Biomedical Applications. Polymers 2018, 10, 161. [Google Scholar] [CrossRef] [Green Version]
- Ruan, L.; Yao, X.; Chang, Y.; Zhou, L.; Qin, G.; Zhang, X. Properties and Applications of the β Phase Poly(Vinylidene Fluoride). Polymers 2018, 10, 228. [Google Scholar] [CrossRef] [Green Version]
- Correia, D.M.; Barbosa, J.C.; Costa, C.M.; Reis, P.M.; Esperança, J.M.S.S.; de Zea Bermudez, V.; Lanceros-Méndez, S. Ionic Liquid Cation Size-Dependent Electromechanical Response of Ionic Liquid/Poly(Vinylidene Fluoride)-Based Soft Actuators. J. Phys. Chem. C 2019, 123, 12744–12752. [Google Scholar] [CrossRef]
- Tawansi, A.; Abdel-Razek, E.M.; Zidan, H.M. Electron Spin Resonance, Electrical and Magnetic Properties of Polyvinylidene Fluoride Films Filled with Equal Amounts of FeCl3 and CuCl2. J. Mater. Sci. 1997, 32, 6243–6248. [Google Scholar] [CrossRef]
- Abdelaziz, M. Characterization, Electrical and Magnetic Properties of PVDF Films Filled with FeCl3 and MnCl2 Mixed Fillers. J. Magn. Magn. Mater. 2004, 279, 184–194. [Google Scholar] [CrossRef]
- Fontaine, K.; Lopez, W.; Crisman, E.; Derov, J.; Euler, W.B. Doping of Polyvinylidene Difluoride with Cobalt Nitrate: Structural, Electrical, and Magnetic Properties. J. Polym. Sci. Part Polym. Chem. 2012, 50, 3970–3975. [Google Scholar] [CrossRef]
- Ghosh, S.K.; Xie, M.; Bowen, C.R.; Davies, P.R.; Morgan, D.J.; Mandal, D. A Hybrid Strain and Thermal Energy Harvester Based on an Infra-Red Sensitive Er3+ Modified Poly(Vinylidene Fluoride) Ferroelectret Structure. Sci. Rep. 2017, 7, 16703. [Google Scholar] [CrossRef] [Green Version]
- Alhasani, M.; Gupta, A.; Euler, W.B. Modulation of the Fluorescent Properties of Rhodamine 6G by Zn2+-Doped PVDF Films. J. Lumin. 2018, 196, 116–125. [Google Scholar] [CrossRef]
- Yang, Y.; Pan, H.; Xie, G.; Jiang, Y.; Chen, C.; Su, Y.; Wang, Y.; Tai, H. Flexible Piezoelectric Pressure Sensor Based on Polydopamine-Modified BaTiO3/PVDF Composite Film for Human Motion Monitoring. Sens. Actuators Phys. 2020, 301, 111789. [Google Scholar] [CrossRef]
- Maneva, M.; Petrov, N. On the Thermal Decomposition of Zn(NO3)2·6H2O and Its Deuterated Analogue. J. Therm. Anal. Calor. 1989, 35, 2297–2303. [Google Scholar] [CrossRef]
- Sessler, C.D.; Rahm, M.; Becker, S.; Goldberg, J.M.; Wang, F.; Lippard, S.J. CF2H, a Hydrogen Bond Donor. J. Am. Chem. Soc. 2017, 139, 9325–9332. [Google Scholar] [CrossRef] [PubMed]
- García-Gutiérrez, M.-C.; Linares, A.; Martín-Fabiani, I.; Hernández, J.J.; Soccio, M.; Rueda, D.R.; Ezquerra, T.A.; Reynolds, M. Understanding Crystallization Features of P(VDF-TrFE) Copolymers under Confinement to Optimize Ferroelectricity in Nanostructures. Nanoscale 2013, 5, 6006–6012. [Google Scholar] [CrossRef]
- Ma, W.; Yuan, H.; Wang, X. The Effect of Chain Structures on the Crystallization Behavior and Membrane Formation of Poly(Vinylidene Fluoride) Copolymers. Membranes 2014, 4, 243–256. [Google Scholar] [CrossRef] [Green Version]
- Liu, W.-G.; Wang, S.; Dasgupta, S.; Thynell, S.T.; Goddard, W.A.; Zybin, S.; Yetter, R.A. Experimental and Quantum Mechanics Investigations of Early Reactions of Monomethylhydrazine with Mixtures of NO2 and N2O4. Combust. Flame 2013, 160, 970–981. [Google Scholar] [CrossRef]
- Janakiraman, S.; Surendran, A.; Ghosh, S.; Anandhan, S.; Venimadhav, A. Electroactive Poly(Vinylidene Fluoride) Fluoride Separator for Sodium Ion Battery with High Coulombic Efficiency. Solid State Ion. 2016, 292, 130–135. [Google Scholar] [CrossRef]
- Jiyong, H.; Yinda, Z.; Hele, Z.; Yuanyuan, G.; Xudong, Y. Mixed Effect of Main Electrospinning Parameters on the β-Phase Crystallinity of Electrospun PVDF Nanofibers. Smart Mater. Struct. 2017, 26, 085019. [Google Scholar] [CrossRef]
- Ryu, S.K.; Lee, W.K.; Park, S.J. Thermal Decomposition of Hydrated Copper Nitrate [Cu(NO3)2·3H2O] on Activated Carbon Fibers. Carbon Lett. 2004, 5, 180–185. [Google Scholar]
- Melnikov, P.; Nascimento, V.A.; Arkhangelsky, I.V.; Zanoni Consolo, L.Z.; de Oliveira, L.C.S. Thermal Decomposition Mechanism of Iron(III) Nitrate and Characterization of Intermediate Products by the Technique of Computerized Modeling. J. Therm. Anal. Calorim. 2014, 115, 145–151. [Google Scholar] [CrossRef]
- Małecki, A. Thermal Decomposition of Chromium(III) Nitrate(V) Nonahydrate. J. Therm. Anal. Calorim. 2003, 72, 135–144. [Google Scholar] [CrossRef]
- Ehrhardt, C.; Gjikaj, M.; Brockner, W. Thermal Decomposition of Cobalt Nitrato Compounds: Preparation of Anhydrous Cobalt(II)Nitrate and Its Characterisation by Infrared and Raman Spectra. Thermochim. Acta 2005, 432, 36–40. [Google Scholar] [CrossRef]
- Hakkarainen, T.; Mikkola, E.; Laperre, J.; Gensous, F.; Fardell, P.; Tallec, Y.L.; Baiocchi, C.; Paul, K.; Simonson, M.; Deleu, C.; et al. Smoke Gas Analysis by Fourier Transform Infrared Spectroscopy—Summary of the SAFIR Project Results. Fire Mater. 2000, 24, 101–112. [Google Scholar] [CrossRef]
- Miser, C.S.; Davis, W.R. Measurement of Carbonyl Fluoride, Hydrogen Fluoride, and Other Combustion Byproducts During Fire Suppression Testing by Fourier Transform Infrared Spectroscopy. In Proceedings of the Halon Options Technical Working Conference, Albuquerque, NM, USA, 12–14 May 1998; pp. 190–203. [Google Scholar]
- Schaffert, R. The Infrared Absorption Spectra of NO2 and N2O4. J. Chem. Phys. 1933, 1, 507–511. [Google Scholar] [CrossRef]
- Lindblom, T. Reactions in the System Nitrocellulose/ Diphenylamine with Special Reference to the Formation of a Stabilizing Product Bonded to Nitrocellulose. Ph.D. Dissertation, Uppsalla University, Uppsalla, Sweden, 2004. [Google Scholar] [CrossRef]
- Luckhaus, D.; Quack, M. High-Resolution FTIR Spectra of NO2 and N2O4 in Supersonic Jet Expansions and Their Rovibrational Analysis. Chem. Phys. Lett. 1992, 199, 293–301. [Google Scholar] [CrossRef]
- Lin, F.; Wang, Z.; Ma, Q.; He, Y.; Whiddon, R.; Zhu, Y.; Liu, J. N2O5 Formation Mechanism during the Ozone-Based Low-Temperature Oxidation DeNOx Process. Energy Fuels 2016, 30, 5101–5107. [Google Scholar] [CrossRef]
- Wängberg, I.; Etzkorn, T.; Barnes, I.; Platt, U.; Becker, K.H. Absolute Determination of the Temperature Behavior of the NO2 + NO3 + (M) ↔ N2O5 + (M) Equilibrium. J. Phys. Chem. A 1997, 101, 9694–9698. [Google Scholar] [CrossRef]
- Available online: https://webbook.nist.gov/chemistry/form-ser/ (accessed on 25 June 2021).
- Barnes, I.; Solignac, G.; Mellouki, A.; Becker, K.H. Aspects of the Atmospheric Chemistry of Amides. ChemPhysChem 2010, 11, 3844–3857. [Google Scholar] [CrossRef]
- Damma, D.; Boningari, T.; Ettireddy, P.R.; Reddy, B.M.; Smirniotis, P.G. Direct Decomposition of NOx over TiO2 Supported Transition Metal Oxides at Low Temperatures. Ind. Eng. Chem. Res. 2018, 57, 16615–16621. [Google Scholar] [CrossRef]


| Sample | p in M(NO3)x·pH2O (±0.1) | Mole Fraction of M in Casting Solution (±0.05) | Mole Fraction of M in Films (±0.05) | β-Phase Fraction, FTIR (±0.08) | β-Phase Fraction, XRD (±0.04) | ΔT, Oxide Onset T in Mn+/PVDF (°C, ±5°) |
|---|---|---|---|---|---|---|
| Zn2+/PVDF | 5.8 | 4.05 | 4.80 | 0.70 | 0.31 | −114 |
| Cu2+/PVDF | 2.8 | 3.91 | 4.90 | 0.67 | 0.48 | −24 |
| Ni2+/PVDF | 5.3 | 4.17 | 3.44 | 0.67 | 0.23 | −170 |
| Co2+/PVDF | 5.7 | 4.07 | 4.60 | 0.69 | 0.32 | −157 |
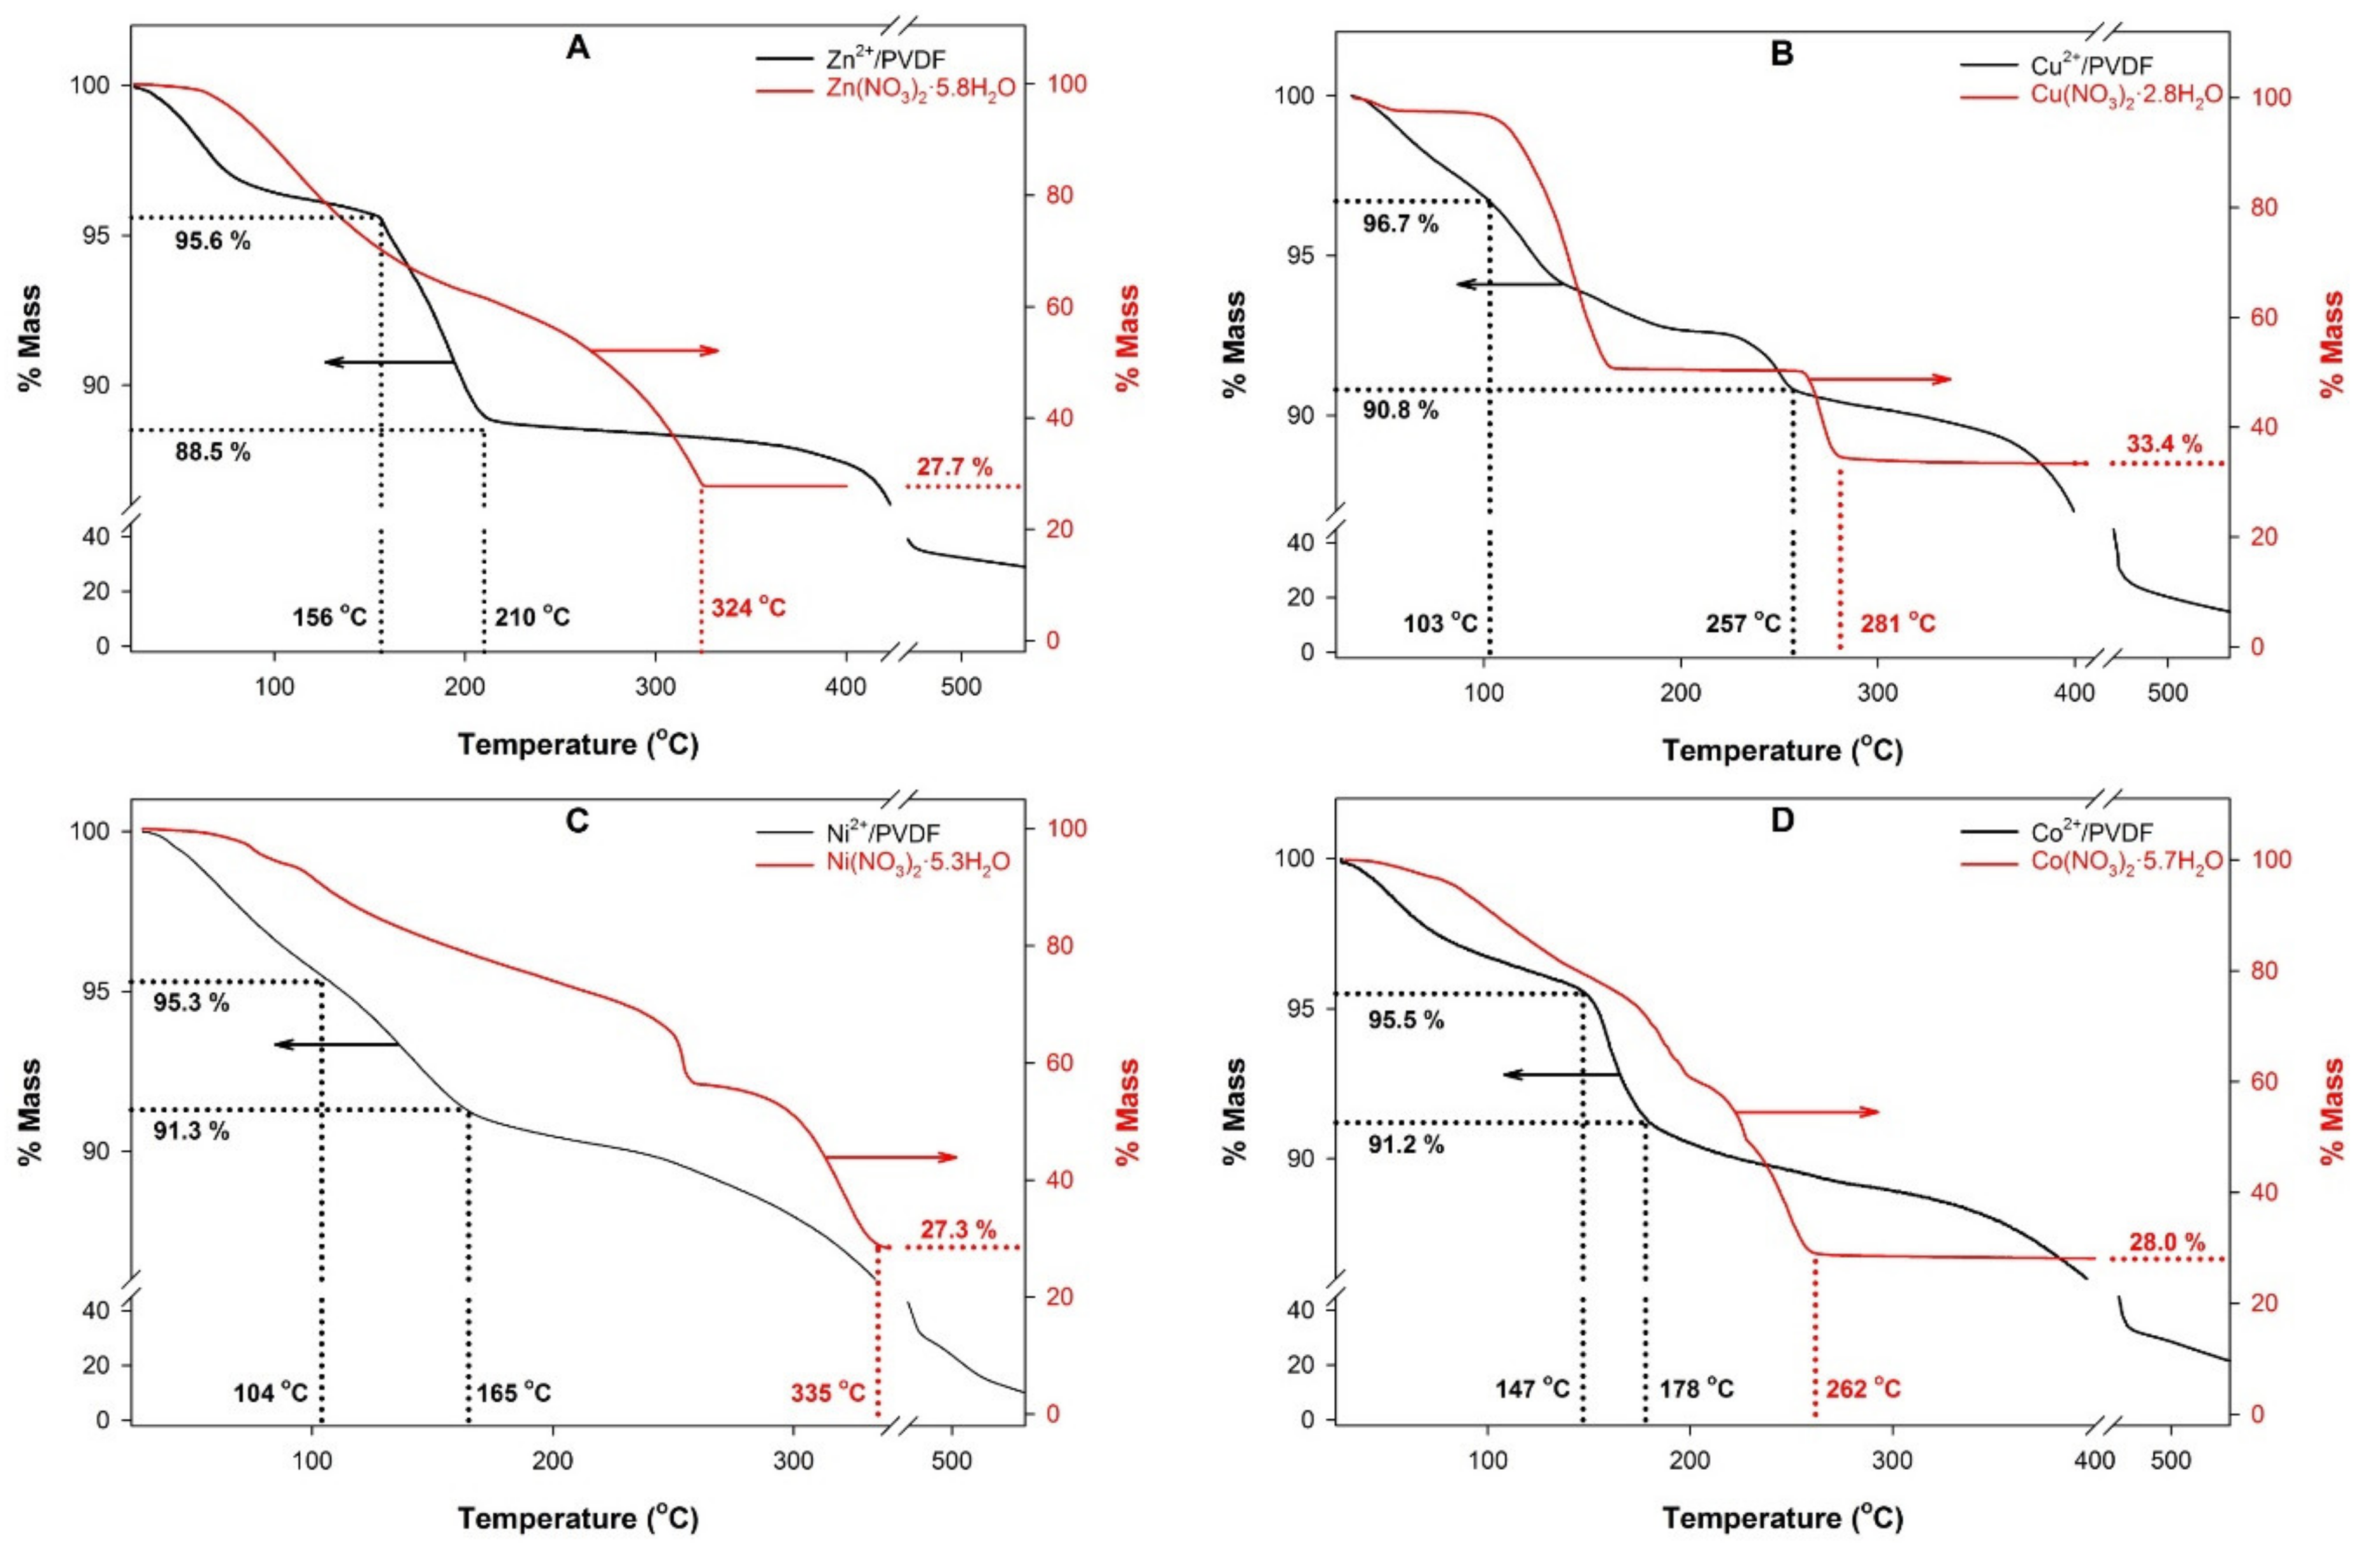
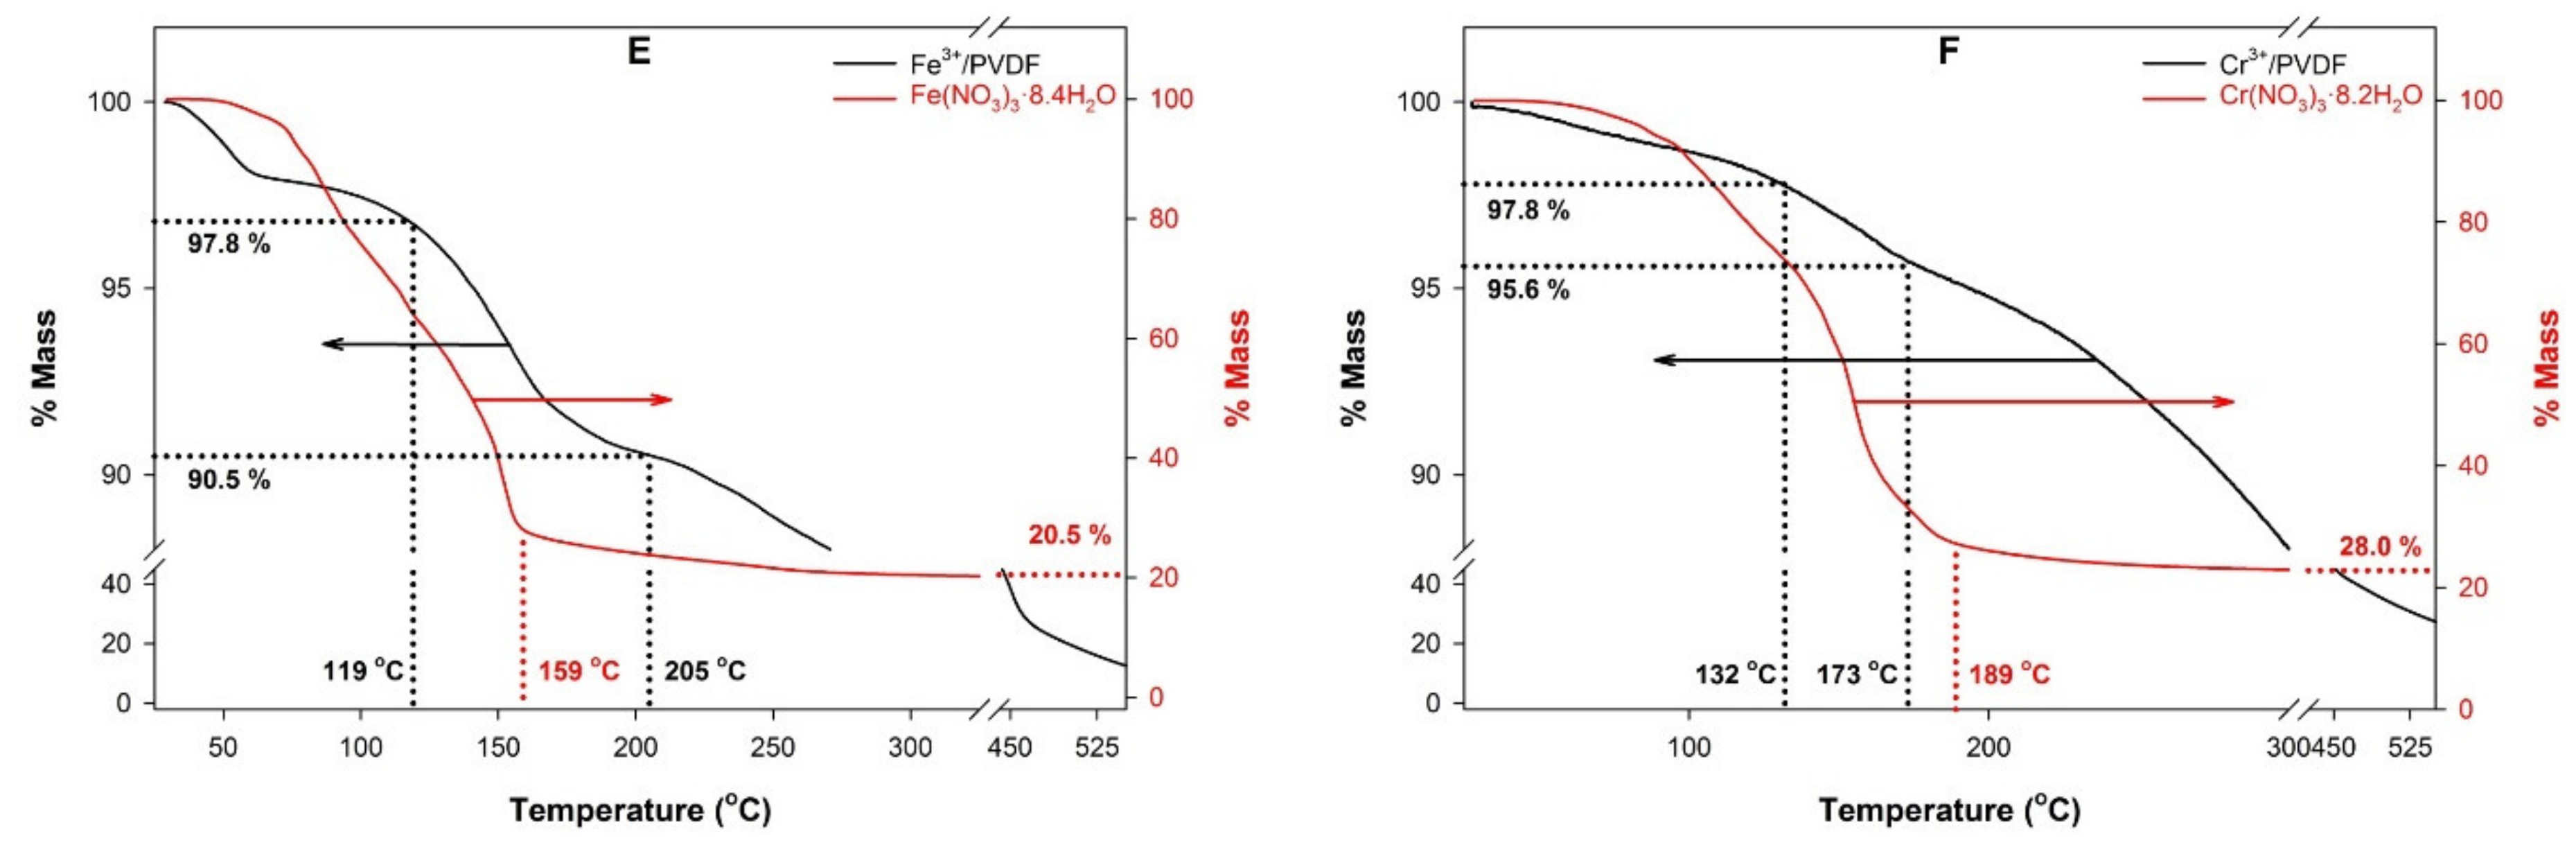
| Fe3+/PVDF | 8.4 | 4.14 | 3.21 | 0.69 | 0.30 | +66 |
| Cr3+/PVDF | 8.2 | 4.14 | 4.44 | 0.69 | 0.47 | −16 |
| PVDF | 0.64 | 0.16 |
Publisher’s Note: MDPI stays neutral with regard to jurisdictional claims in published maps and institutional affiliations. |
© 2021 by the authors. Licensee MDPI, Basel, Switzerland. This article is an open access article distributed under the terms and conditions of the Creative Commons Attribution (CC BY) license (https://creativecommons.org/licenses/by/4.0/).
Share and Cite
Sumathirathne, L.; Euler, W.B. Catalysis of the Thermal Decomposition of Transition Metal Nitrate Hydrates by Poly(vinylidene difluoride). Polymers 2021, 13, 3112. https://doi.org/10.3390/polym13183112
Sumathirathne L, Euler WB. Catalysis of the Thermal Decomposition of Transition Metal Nitrate Hydrates by Poly(vinylidene difluoride). Polymers. 2021; 13(18):3112. https://doi.org/10.3390/polym13183112
Chicago/Turabian StyleSumathirathne, Lasanthi, and William B. Euler. 2021. "Catalysis of the Thermal Decomposition of Transition Metal Nitrate Hydrates by Poly(vinylidene difluoride)" Polymers 13, no. 18: 3112. https://doi.org/10.3390/polym13183112
APA StyleSumathirathne, L., & Euler, W. B. (2021). Catalysis of the Thermal Decomposition of Transition Metal Nitrate Hydrates by Poly(vinylidene difluoride). Polymers, 13(18), 3112. https://doi.org/10.3390/polym13183112