
Weibull Modeling of Controlled Drug Release from Ag-PMA Nanosystems


Abstract
:1. Introduction
2. Materials and Methods
2.1. Ag-PMA NPs Formulation Strategy and Characterization
2.2. Drug Loading
- −
- DL% = (drug weight encapsulated in the NPs/weight of the NPs) × 100
- −
- EE% = (drug weight encapsulated in the NPs/weight of drug used in encapsulation strategy) × 100
2.3. Ag-PMA Nanofibres Preparation and Characterization
2.4. Drug Release
3. Results
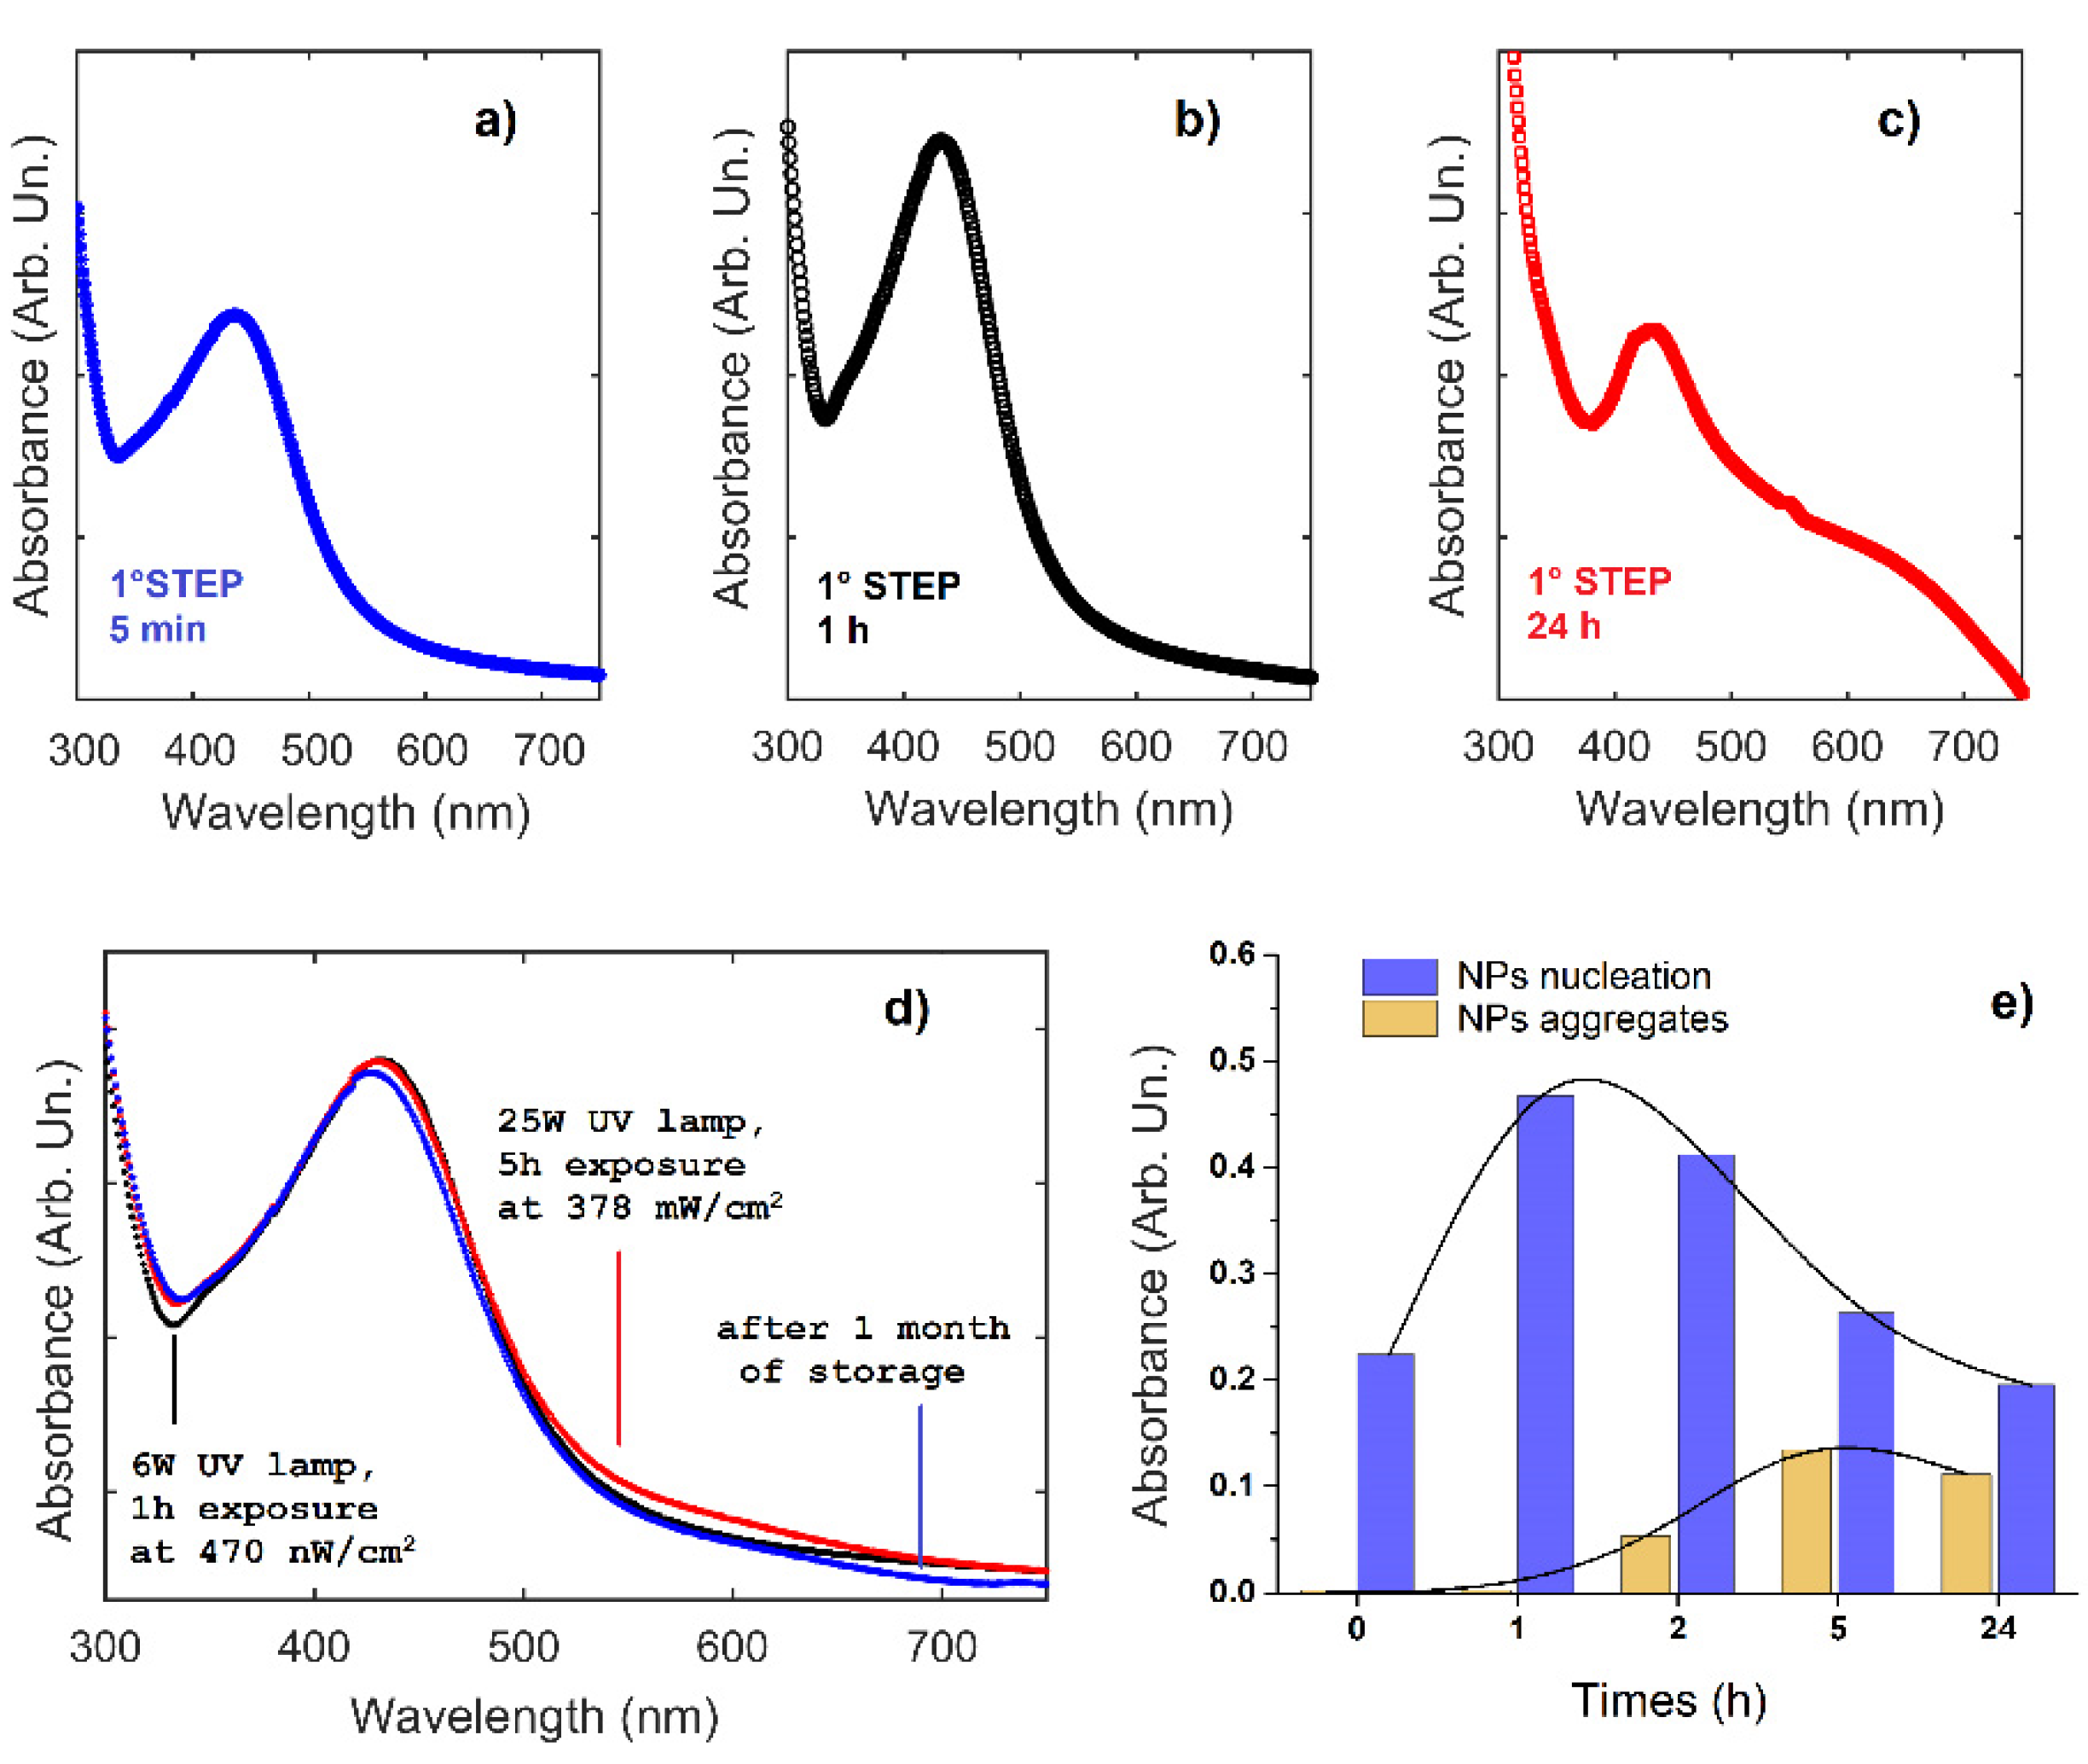
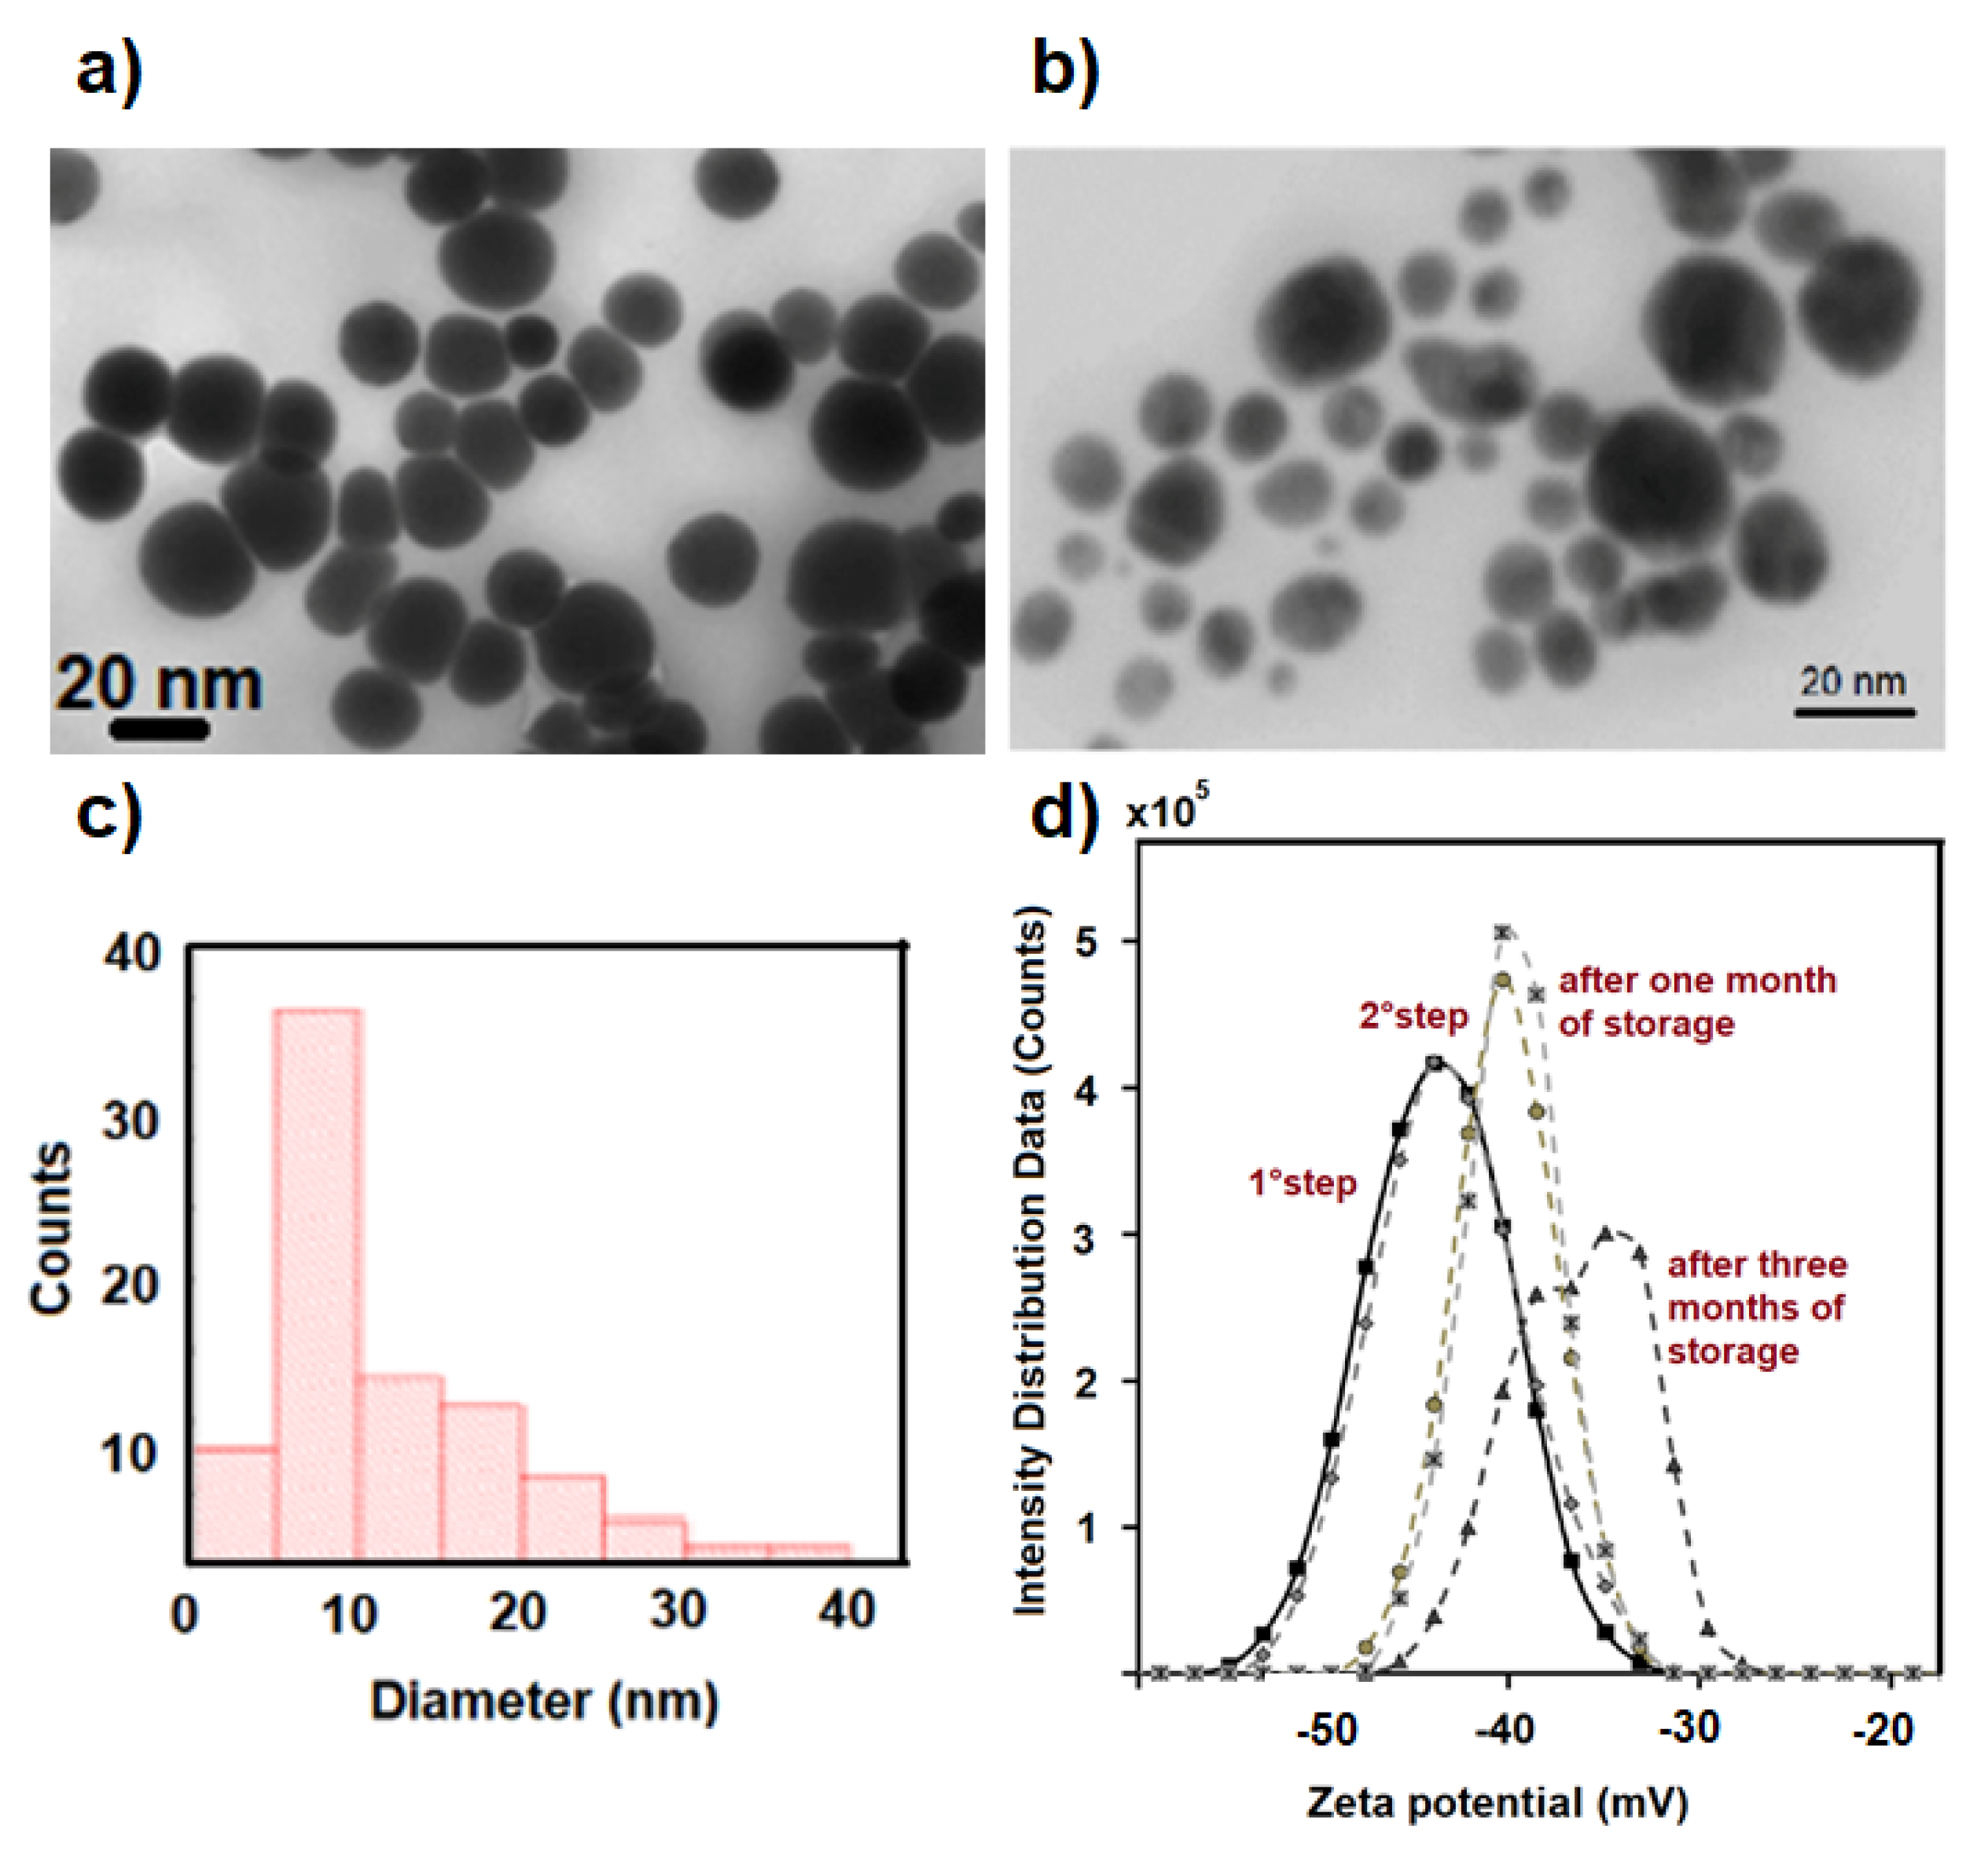
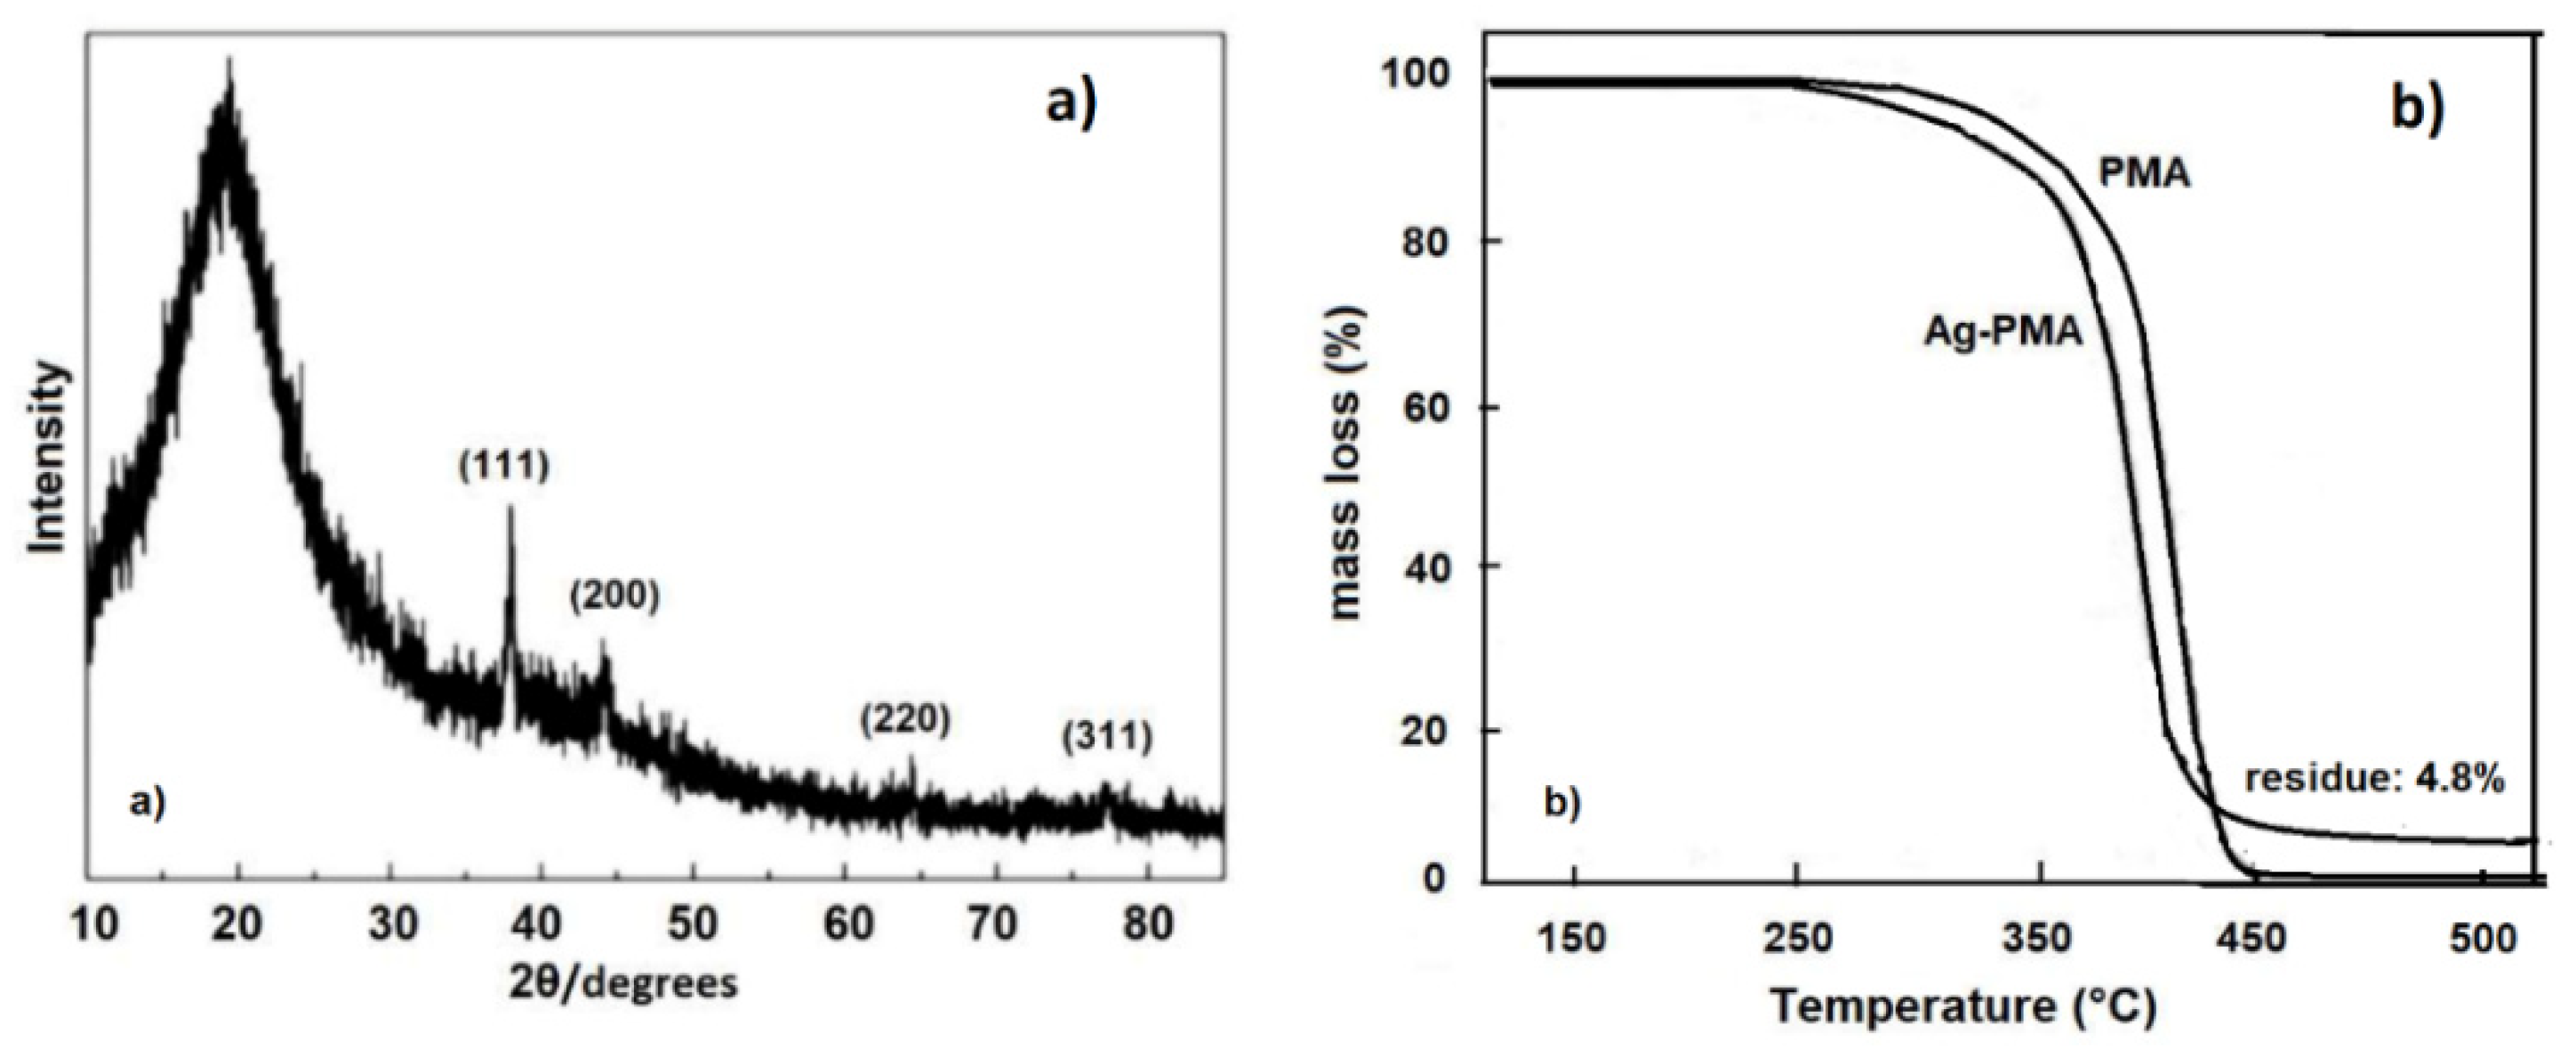
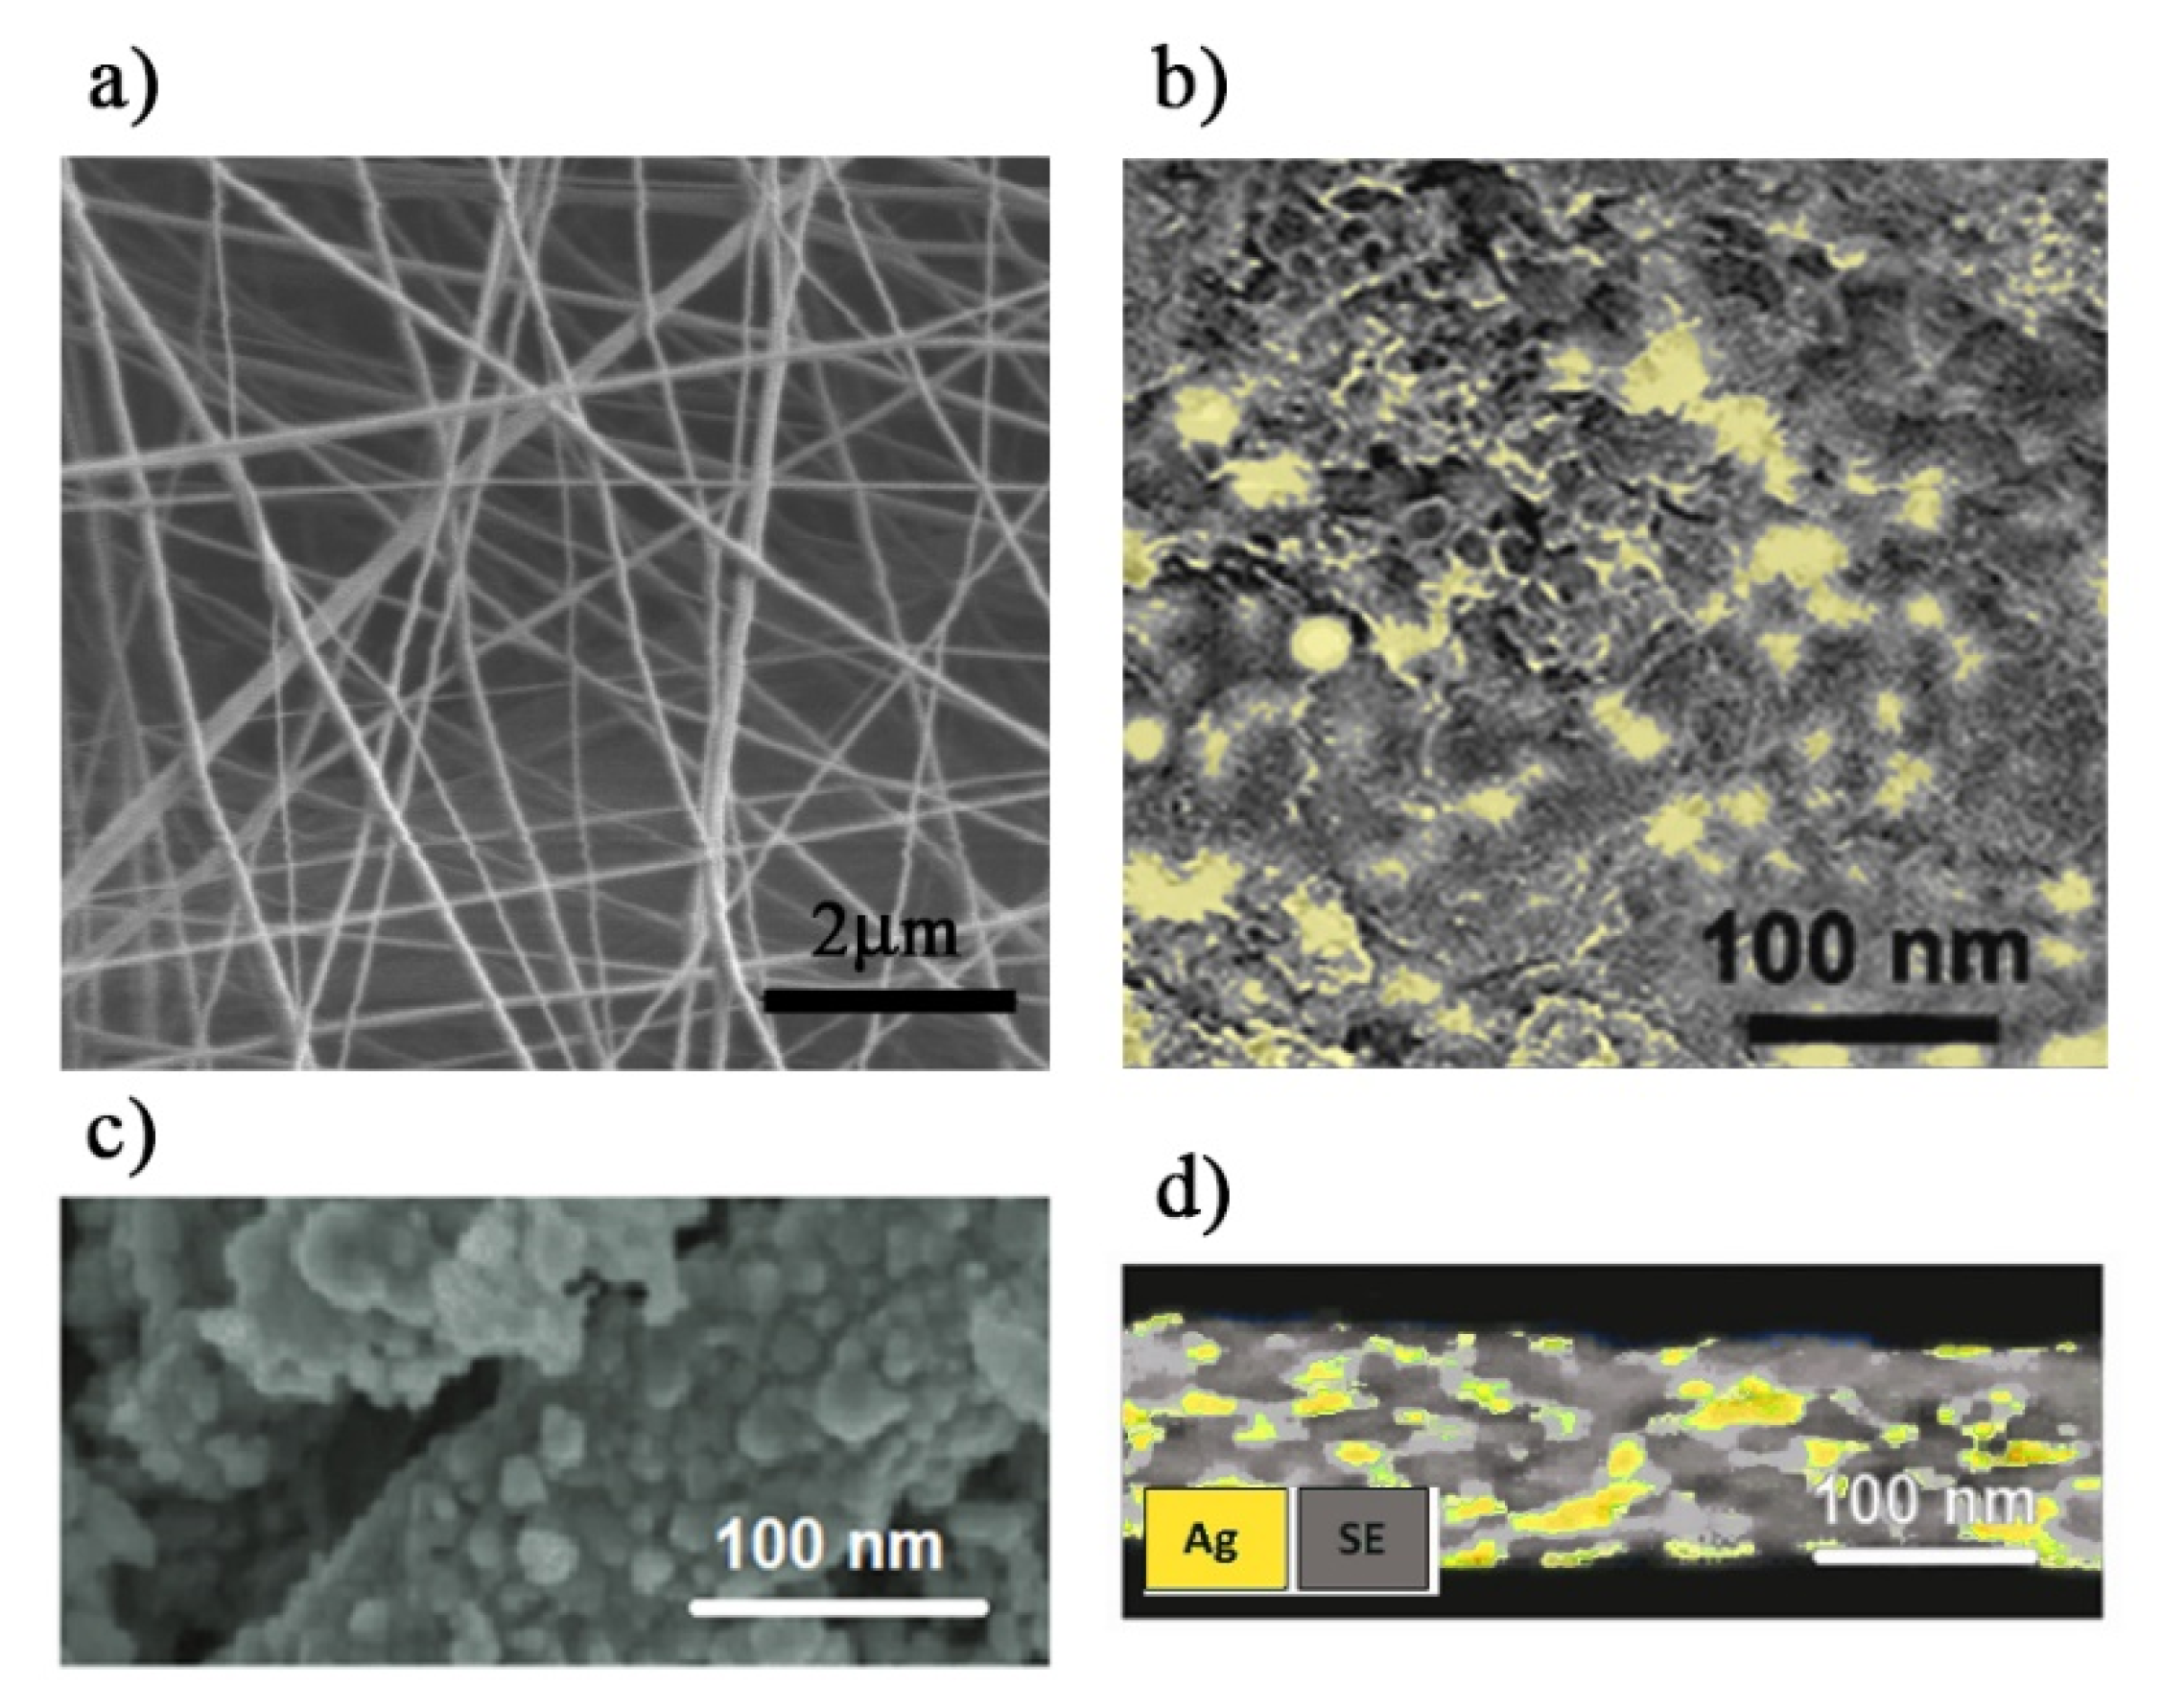
3.1. Ag-PMA Nanosystems Formulation and Characterization
3.2. Drug Release
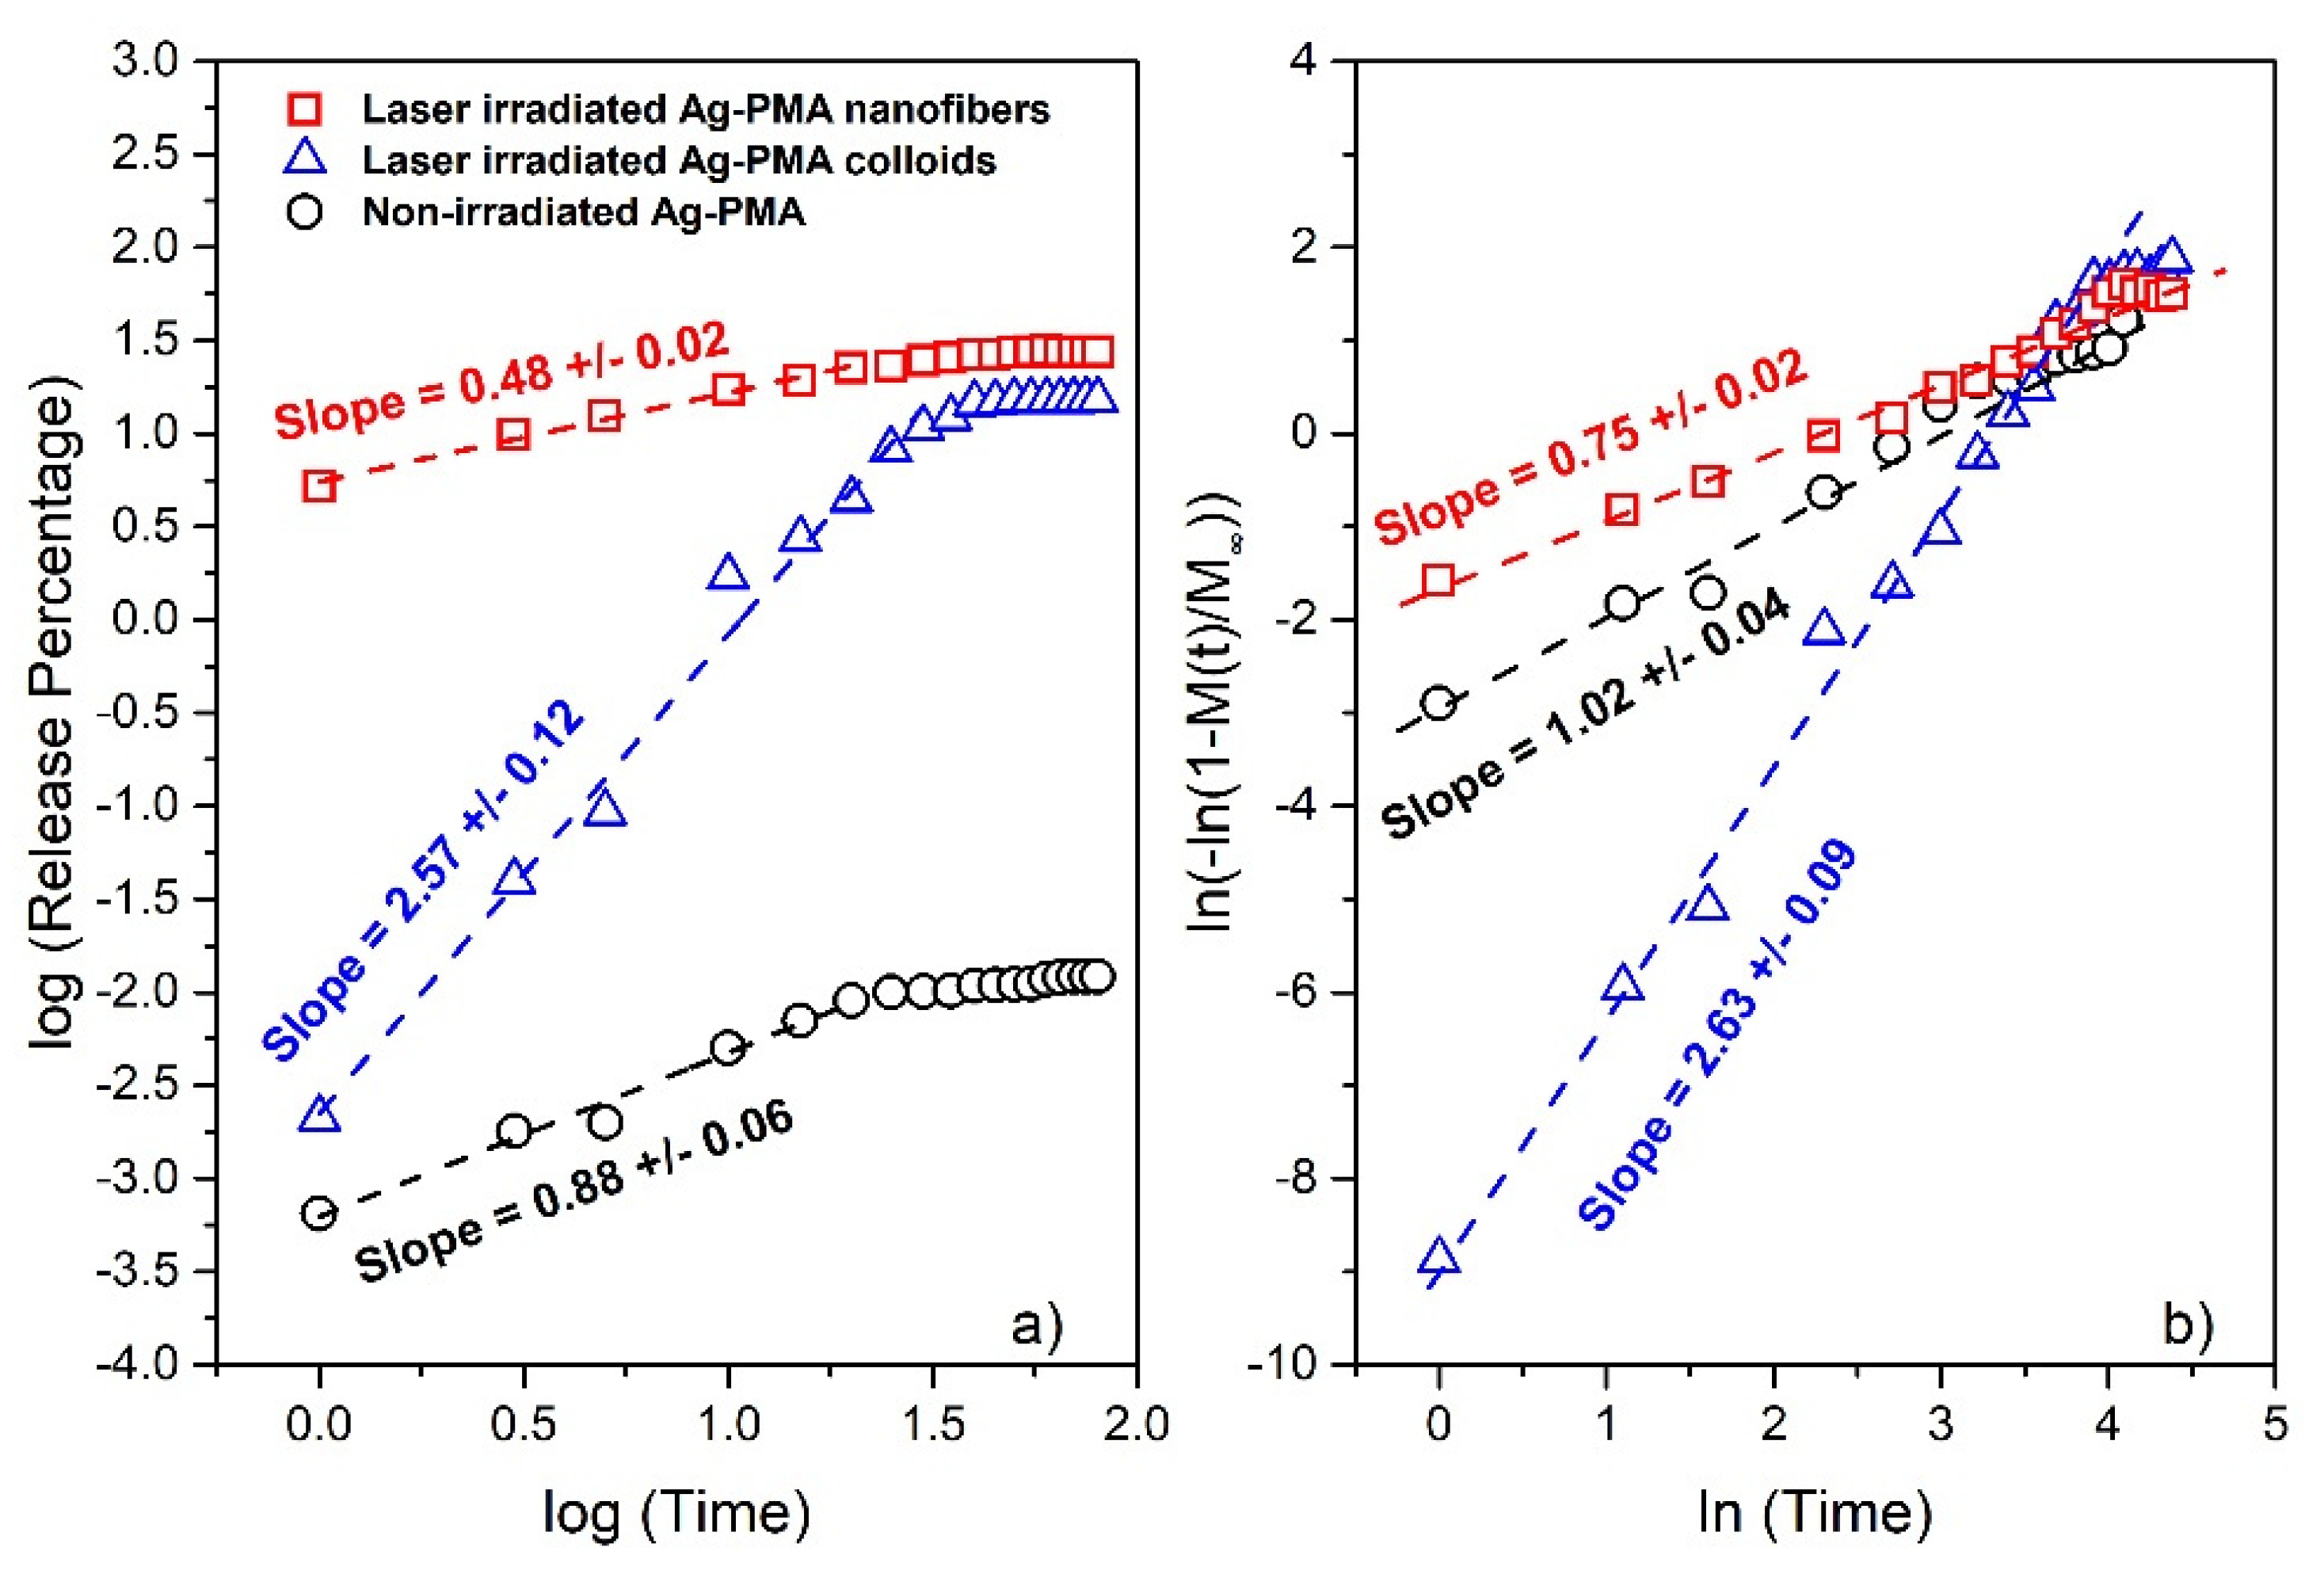
4. Discussion
- -
- for the colloidal systemsβ = (2.67 ± 0.09), = (27.90 ± 0.04) h, = 24.8 h and = 8.8 h.
- -
- for the scaffold systemsβ = (0.71 ± 0.02), = (10.51 ± 0.03) h, = 13.1 h, and = 23.6 h.
5. Conclusions
Supplementary Materials
Author Contributions
Funding
Institutional Review Board Statement
Informed Consent Statement
Data Availability Statement
Conflicts of Interest
References
- Santoro, A.; Holub, J.; Fik-Jaskółka, M.A.; Vantomme, G.; Lehn, J.-M. Dynamic Helicates Self-Assembly from Homo- and Heterotopic Dynamic Covalent Ligand Strands. Chem. A Eur. J. 2020, 26, 15664–15671. [Google Scholar] [CrossRef]
- Puntoriero, F.; Arrigo, A.; Santoro, A.; Ganga, G.L.; Tuyèras, F.; Campagna, S.; Dupeyre, G.; Lainé, P.P. Photoinduced Intercomponent Processes in Selectively Addressable Bichromophoric Dyads Made of Linearly Arranged Ru(II) Terpyridine and Expanded Pyridinium Components. Inorg. Chem. 2019, 58, 5807–5817. [Google Scholar] [CrossRef] [PubMed] [Green Version]
- Nastasi, F.; Santoro, A.; Serroni, S.; Campagna, S.; Kaveevivitchai, N.; Thummel, R.P. Early photophysical events of a ruthenium(ii) molecular dyad capable of performing photochemical water oxidation and of its model compounds. Photochem. Photobiol. Sci. 2019, 18, 2164–2173. [Google Scholar] [CrossRef] [PubMed]
- Mancuso, A.; Barattucci, A.; Bonaccorsi, P.; Giannetto, A.; La Ganga, G.; Musarra-Pizzo, M.; Salerno, T.M.G.; Santoro, A.; Sciortino, M.T.; Puntoriero, F.; et al. Carbohydrates and Charges on Oligo (phenylenethynylenes): Towards the Design of Cancer Bullets. Chem. A Eur. J. 2018, 24, 16972–16976. [Google Scholar] [CrossRef] [PubMed]
- Caccamo, D.; Currò, M.; Ientile, R.; Verderio, E.A.; Scala, A.; Mazzaglia, A.; Pennisi, R.; Musarra-Pizzo, M.; Zagami, R.; Neri, G.; et al. Intracellular Fate and Impact on Gene Expression of Doxorubicin/Cyclodextrin-Graphene Nanomaterials at Sub-Toxic Concentration. Int. J. Mol. Sci. 2020, 21, 4891. [Google Scholar] [CrossRef]
- Cordaro, A.; Neri, G.; Sciortino, M.T.; Scala, A.; Piperno, A. Graphene-Based Strategies in Liquid Biopsy and in Viral Diseases Diagnosis. Nanomaterials 2020, 10, 1014. [Google Scholar] [CrossRef] [PubMed]
- Celentano, W.; Neri, G.; Distante, F.; Li, M.; Messa, P.; Chirizzi, C.; Chaabane, L.; De Campo, F.; Metrangolo, P.; Baldelli Bombelli, F.; et al. Design of fluorinated hyperbranched polyether copolymers for 19F MRI nanotheranostics. Polym. Chem. 2020, 11, 3951–3963. [Google Scholar] [CrossRef]
- Atta, O.M.; Manan, S.; Ahmed, A.A.Q.; Awad, M.F.; Ul-Islam, M.; Subhan, F.; Ullah, M.W.; Yang, G. Development and Characterization of Yeast-Incorporated Antimicrobial Cellulose Biofilms for Edible Food Packaging Application. Polymers 2021, 13, 2310. [Google Scholar] [CrossRef]
- Khan, N.A.; Niazi, M.B.K.; Sher, F.; Jahan, Z.; Noor, T.; Azhar, O.; Rashid, T.; Iqbal, N. Metal Organic Frameworks Derived Sustainable Polyvinyl Alcohol/Starch Nanocomposite Films as Robust Materials for Packaging Applications. Polymers 2021, 13, 2307. [Google Scholar] [CrossRef]
- Al-Tayyar, N.A.; Youssef, A.M.; Al-hindi, R. Antimicrobial food packaging based on sustainable Bio-based materials for reducing foodborne Pathogens: A review. Food Chem. 2020, 310, 125915. [Google Scholar] [CrossRef]
- Zheng, L.; Sun, B.; Chen, Y.; Li, T.; Mao, S.; Zhu, S.; Wang, H.; Zhang, Y.; Lei, M.; Zhao, Y. The redox of hydroxyl-assisted metallic filament induced resistive switching memory based on a biomaterial-constructed sustainable and environment-friendly device. Mater. Today Chem. 2018, 10, 167–174. [Google Scholar] [CrossRef]
- Zhang, A.; Jung, K.; Li, A.; Liu, J.; Boyer, C. Recent advances in stimuli-responsive polymer systems for remotely controlled drug release. Prog. Polym. Sci. 2019, 99, 101164. [Google Scholar] [CrossRef]
- Raza, A.; Rasheed, T.; Nabeel, F.; Hayat, U.; Bilal, M.; Iqbal, H.M.N. Endogenous and Exogenous Stimuli-Responsive Drug Delivery Systems for Programmed Site-Specific Release. Molecules 2019, 24, 1117. [Google Scholar] [CrossRef] [PubMed] [Green Version]
- He, Q.; Chen, J.; Yan, J.; Cai, S.; Xiong, H.; Liu, Y.; Peng, D.; Mo, M.; Liu, Z. Tumor microenvironment responsive drug delivery systems. Asian J. Pharm. Sci. 2020, 15, 416–448. [Google Scholar] [CrossRef]
- Lionetto, F.; Esposito Corcione, C. Recent Applications of Biopolymers Derived from Fish Industry Waste in Food Packaging. Polymers 2021, 13, 2337. [Google Scholar] [CrossRef] [PubMed]
- Abasian, P.; Ghanavati, S.; Rahebi, S.; Nouri Khorasani, S.; Khalili, S. Polymeric nanocarriers in targeted drug delivery systems: A review. Polym. Adv. Technol. 2020, 31, 2939–2954. [Google Scholar] [CrossRef]
- Petlin, D.G.; Amarah, A.A.; Tverdokhlebov, S.I.; Anissimov, Y.G. A fiber distribution model for predicting drug release rates. J. Control. Release 2017, 258, 218–225. [Google Scholar] [CrossRef] [PubMed]
- Sebe, I.; Szabó, P.; Kállai-Szabó, B.; Zelkó, R. Incorporating small molecules or biologics into nanofibers for optimized drug release: A review. Int. J. Pharm. 2015, 494, 516–530. [Google Scholar] [CrossRef]
- Alkahtani, M.E.; Aodah, A.H.; Abu Asab, O.A.; Basit, A.W.; Orlu, M.; Tawfik, E.A. Fabrication and Characterization of Fast-Dissolving Films Containing Escitalopram/Quetiapine for the Treatment of Major Depressive Disorder. Pharmaceutics 2021, 13, 891. [Google Scholar] [CrossRef]
- Gorrasi, G.; Longo, R.; Viscusi, G. Fabrication and Characterization of Electrospun Membranes Based on “Poly (ε-caprolactone)”, “Poly(3-hydroxybutyrate)” and Their Blend for Tunable Drug Delivery of Curcumin. Polymers 2020, 12, 2239. [Google Scholar] [CrossRef]
- Brockgreitens, J.; Abbas, A. Responsive Food Packaging: Recent Progress and Technological Prospects. Compr. Rev. Food Sci. Food Saf. 2016, 15, 3–15. [Google Scholar] [CrossRef] [Green Version]
- Babikova, D.; Kalinova, R.; Momekova, D.; Ugrinova, I.; Momekov, G.; Dimitrov, I. Multifunctional Polymer Nanocarrier for Efficient Targeted Cellular and Subcellular Anticancer Drug Delivery. ACS Biomater. Sci. Eng. 2019, 5, 2271–2283. [Google Scholar] [CrossRef] [PubMed]
- Van Gheluwe, L.; Chourpa, I.; Gaigne, C.; Munnier, E. Polymer-Based Smart Drug Delivery Systems for Skin Application and Demonstration of Stimuli-Responsiveness. Polymers 2021, 13, 1285. [Google Scholar] [CrossRef] [PubMed]
- Krystyjan, M.; Khachatryan, G.; Grabacka, M.; Krzan, M.; Witczak, M.; Grzyb, J.; Woszczak, L. Physicochemical, Bacteriostatic, and Biological Properties of Starch/Chitosan Polymer Composites Modified by Graphene Oxide, Designed as New Bionanomaterials. Polymers 2021, 13, 2327. [Google Scholar] [CrossRef]
- Gherasim, O.; Puiu, R.A.; Bîrcă, A.C.; Burdușel, A.-C.; Grumezescu, A.M. An Updated Review on Silver Nanoparticles in Biomedicine. Nanomaterials 2020, 10, 2318. [Google Scholar] [CrossRef] [PubMed]
- Calabrese, G.; Petralia, S.; Franco, D.; Nocito, G.; Fabbi, C.; Forte, L.; Guglielmino, S.; Squarzoni, S.; Traina, F.; Conoci, S. A new Ag-nanostructured hydroxyapatite porous scaffold: Antibacterial effect and cytotoxicity study. Mater. Sci. Eng. C 2021, 118, 111394. [Google Scholar] [CrossRef]
- Batista, R.A.; Espitia, P.J.P.; Quintans, J.d.S.S.; Freitas, M.M.; Cerqueira, M.Â.; Teixeira, J.A.; Cardoso, J.C. Hydrogel as an alternative structure for food packaging systems. Carbohydr. Polym. 2019, 205, 106–116. [Google Scholar] [CrossRef] [Green Version]
- Mao, B.-H.; Chen, Z.-Y.; Wang, Y.-J.; Yan, S.-J. Silver nanoparticles have lethal and sublethal adverse effects on development and longevity by inducing ROS-mediated stress responses. Sci. Rep. 2018, 8, 2445. [Google Scholar] [CrossRef] [Green Version]
- Domingo, G.; Bracale, M.; Vannini, C. Chapter 8—Phytotoxicity of Silver Nanoparticles to Aquatic Plants, Algae, and Microorganisms. In Nanomaterials in Plants, Algae and Microorganisms; Tripathi, D.K., Ahmad, P., Sharma, S., Chauhan, D.K., Dubey, N.K., Eds.; Academic Press: Cambridge, MA, USA, 2019; pp. 143–168. [Google Scholar] [CrossRef]
- Bacchetta, C.; Ale, A.; Simoniello, M.F.; Gervasio, S.; Davico, C.; Rossi, A.S.; Desimone, M.F.; Poletta, G.; López, G.; Monserrat, J.M.; et al. Genotoxicity and oxidative stress in fish after a short-term exposure to silver nanoparticles. Ecol. Indic. 2017, 76, 230–239. [Google Scholar] [CrossRef]
- Sulatha, M.S.; Natarajan, U. Molecular Dynamics Simulations of PAA–PMA Polyelectrolyte Copolymers in Dilute Aqueous Solution: Chain Conformations and Hydration Properties. Ind. Eng. Chem. Res. 2012, 51, 10833–10839. [Google Scholar] [CrossRef]
- Yessine, M.-A.; Leroux, J.-C. Membrane-destabilizing polyanions: Interaction with lipid bilayers and endosomal escape of biomacromolecules. Adv. Drug Deliv. Rev. 2004, 56, 999–1021. [Google Scholar] [CrossRef] [PubMed]
- Cárdenas, G.; Muñoz, C.; Carbacho, H. Thermal properties and TGA–FTIR studies of polyacrylic and polymethacrylic acid doped with metal clusters. Eur. Polym. J. 2000, 36, 1091–1099. [Google Scholar] [CrossRef]
- Städler, B.; Price, A.D.; Zelikin, A.N. A Critical Look at Multilayered Polymer Capsules in Biomedicine: Drug Carriers, Artificial Organelles, and Cell Mimics. Adv. Funct. Mater. 2011, 21, 14–28. [Google Scholar] [CrossRef]
- Neri, G.; Corsaro, C.; Fazio, E. Plasmon-Enhanced Controlled Drug Release from Ag-PMA Capsules. Molecules 2020, 25, 2267. [Google Scholar] [CrossRef]
- Lumbreras-Aguayo, A.; Meléndez-Ortiz, H.I.; Puente-Urbina, B.; Alvarado-Canché, C.; Ledezma, A.; Romero-García, J.; Betancourt-Galindo, R. Poly (methacrylic acid)-modified medical cotton gauzes with antimicrobial and drug delivery properties for their use as wound dressings. Carbohydr. Polym. 2019, 205, 203–210. [Google Scholar] [CrossRef]
- Lin, J.W.-P.; Dudek, L.P.; Majumdar, D. Wetting properties of homopolymers and copolymers of pentafluorostyrene and methylacrylate and homopolymer blends. J. Appl. Polym. Sci. 1987, 33, 657–667. [Google Scholar] [CrossRef]
- Papra, A.; Gadegaard, N.; Larsen, N.B. Characterization of Ultrathin Poly (ethylene glycol) Monolayers on Silicon Substrates. Langmuir 2001, 17, 1457–1460. [Google Scholar] [CrossRef]
- Ma, Y.; Cao, X.; Feng, X.; Ma, Y.; Zou, H. Fabrication of super-hydrophobic film from PMMA with intrinsic water contact angle below 90°. Polymer 2007, 48, 7455–7460. [Google Scholar] [CrossRef]
- Spadaro, D.; Barletta, E.; Barreca, F.; Currò, G.; Neri, F. PMA capped silver nanoparticles produced by UV-enhanced chemical process. Appl. Surf. Sci. 2009, 255, 8403–8408. [Google Scholar] [CrossRef]
- Spadaro, D.; Barletta, E.; Barreca, F.; Currò, G.; Neri, F. Synthesis of PMA stabilized silver nanoparticles by chemical reduction process under a two-step UV irradiation. Appl. Surf. Sci. 2010, 256, 3812–3816. [Google Scholar] [CrossRef]
- Park, S.Y.; Kang, Z.; Thapa, P.; Jin, Y.S.; Park, J.W.; Lim, H.J.; Lee, J.Y.; Lee, S.-W.; Seo, M.-H.; Kim, M.-S.; et al. Development of sorafenib loaded nanoparticles to improve oral bioavailability using a quality by design approach. Int. J. Pharm. 2019, 566, 229–238. [Google Scholar] [CrossRef]
- Weibull, W. A Statistical Distribution Function of Wide Applicability. J. Appl. Mech. 2021, 18, 293–297. [Google Scholar] [CrossRef]
- Kolar-Anić, L.; Veljković, S.; Kapor, S.; Dubljević, B. Weibull distribution and kinetics of heterogeneous processes. J. Chem. Phys. 1975, 63, 663–668. [Google Scholar] [CrossRef]
- Pourtalebi Jahromi, L.; Ghazali, M.; Ashrafi, H.; Azadi, A. A comparison of models for the analysis of the kinetics of drug release from PLGA-based nanoparticles. Heliyon 2020, 6, e03451. [Google Scholar] [CrossRef] [Green Version]
- Koester, L.c.S.; Ortega, G.G.; Mayorga, P.; Bassani, V.L. Mathematical evaluation of in vitro release profiles of hydroxypropylmethylcellulose matrix tablets containing carbamazepine associated to β-cyclodextrin. Eur. J. Pharm. Biopharm. 2004, 58, 177–179. [Google Scholar] [CrossRef] [PubMed]
- Ignacio, M.; Chubynsky, M.V.; Slater, G.W. Interpreting the Weibull fitting parameters for diffusion-controlled release data. Phys. A Stat. Mech. Appl. 2017, 486, 486–496. [Google Scholar] [CrossRef]
- Paolino, D.; Tudose, A.; Celia, C.; Di Marzio, L.; Cilurzo, F.; Mircioiu, C. Mathematical Models as Tools to Predict the Release Kinetic of Fluorescein from Lyotropic Colloidal Liquid Crystals. Materials 2019, 12, 693. [Google Scholar] [CrossRef] [Green Version]
- Mauro, J.C.; Smedskjaer, M.M. Unified physics of stretched exponential relaxation and Weibull fracture statistics. Phys. A Stat. Mech. Appl. 2012, 391, 6121–6127. [Google Scholar] [CrossRef]
- Neri, G.; Spadaro, S.; Barreca, F.; Santangelo, S.; Neri, F.; Fazio, E. Electrospun Ag/PMA Nanofibrous Scaffold as a Drug Delivery System. Curr. Nanomater. 2019, 4, 32–38. [Google Scholar] [CrossRef]
- Neri, G.; Mion, G.; Pizzi, A.; Celentano, W.; Chaabane, L.; Chierotti, M.R.; Gobetto, R.; Li, M.; Messa, P.; De Campo, F.; et al. Fluorinated PLGA Nanoparticles for Enhanced Drug Encapsulation and 19F NMR Detection. Chem. A Eur. J. 2020, 26, 10057–10063. [Google Scholar] [CrossRef]
- Fazio, E.; Scala, A.; Grimato, S.; Ridolfo, A.; Grassi, G.; Neri, F. Laser light triggered smart release of silibinin from a PEGylated–PLGA gold nanocomposite. J. Mater. Chem. B 2015, 3, 9023–9032. [Google Scholar] [CrossRef]
- Spadaro, S.; Santoro, M.; Barreca, F.; Scala, A.; Grimato, S.; Neri, F.; Fazio, E. PEG-PLGA electrospun nanofibrous membranes loaded with Au@Fe2O3 nanoparticles for drug delivery applications. Front. Phys. 2017, 13, 136201. [Google Scholar] [CrossRef]
- Zou, K.; Zhang, X.H.; Duan, X.F.; Meng, X.M.; Wu, S.K. Seed-mediated synthesis of silver nanostructures and polymer/silver nanocables by UV irradiation. J. Cryst. Growth 2004, 273, 285–291. [Google Scholar] [CrossRef]
- Kora, A.J.; Rastogi, L. Enhancement of Antibacterial Activity of Capped Silver Nanoparticles in Combination with Antibiotics, on Model Gram-Negative and Gram-Positive Bacteria. Bioinorg. Chem. Appl. 2013, 2013, 871097. [Google Scholar] [CrossRef]
- Mircioiu, C.; Voicu, V.; Anuta, V.; Tudose, A.; Celia, C.; Paolino, D.; Fresta, M.; Sandulovici, R.; Mircioiu, I. Mathematical Modeling of Release Kinetics from Supramolecular Drug Delivery Systems. Pharmaceutics 2019, 11, 140. [Google Scholar] [CrossRef] [PubMed] [Green Version]
- Geraili, A.; Mequanint, K. Systematic Studies on Surface Erosion of Photocrosslinked Polyanhydride Tablets and Data Correlation with Release Kinetic Models. Polymers 2020, 12, 1105. [Google Scholar] [CrossRef]
- Papadopoulou, V.; Kosmidis, K.; Vlachou, M.; Macheras, P. On the use of the Weibull function for the discernment of drug release mechanisms. Int. J. Pharm. 2006, 309, 44–50. [Google Scholar] [CrossRef] [PubMed]
- Bruschi, M.L. Preface. In Strategies to Modify the Drug Release from Pharmaceutical Systems; Bruschi, M.L., Ed.; Woodhead Publishing: Cambridge, UK, 2015; pp. vii–viii. [Google Scholar] [CrossRef]
- Higuchi, T. Rate of Release of Medicaments from Ointment Bases Containing Drugs in Suspension. J. Pharm. Sci. 1961, 50, 874–875. [Google Scholar] [CrossRef] [PubMed]
- D’Souza, S.S.; Faraj, J.A.; DeLuca, P.P. A model-dependent approach to correlate accelerated with real-time release from biodegradable microspheres. AAPS Pharm. Sci. Tech. 2005, 6, E553–E564. [Google Scholar] [CrossRef] [Green Version]
- Kosmidis, K.; Macheras, P. Monte Carlo simulations for the study of drug release from matrices with high and low diffusivity areas. Int. J. Pharm. 2007, 343, 166–172. [Google Scholar] [CrossRef]
- Kohlrausch, R. Theorie des elektrischen Rückstandes in der Leidener Flasche. Ann. Phys. 1854, 167, 56–82. [Google Scholar] [CrossRef] [Green Version]
- Rinaki, E.; Dokoumetzidis, A.; Macheras, P. The Mean Dissolution Time Depends on the Dose/Solubility Ratio. Pharm. Res. 2003, 20, 406–408. [Google Scholar] [CrossRef]
- Kobryń, J.; Sowa, S.; Gasztych, M.; Dryś, A.; Musiał, W. Influence of Hydrophilic Polymers on the β Factor in Weibull Equation Applied to the Release Kinetics of a Biologically Active Complex of Aesculus hippocastanum. Int. J. Polym. Sci. 2017, 2017, 3486384. [Google Scholar] [CrossRef]
- Zaborenko, N.; Shi, Z.; Corredor, C.C.; Smith-Goettler, B.M.; Zhang, L.; Hermans, A.; Neu, C.M.; Alam, M.A.; Cohen, M.J.; Lu, X.; et al. First-Principles and Empirical Approaches to Predicting In Vitro Dissolution for Pharmaceutical Formulation and Process Development and for Product Release Testing. AAPS J. 2019, 21, 32. [Google Scholar] [CrossRef] [PubMed]
- Cid, A.G.; Sonvico, F.; Bettini, R.; Colombo, P.; Gonzo, E.; Jimenez-Kairuz, A.F.; Bermúdez, J.M. Evaluation of the Drug Release Kinetics in Assembled Modular Systems Based on the Dome Matrix Technology. J. Pharm. Sci. 2020, 109, 2819–2826. [Google Scholar] [CrossRef]
- Bagchi, B. Water in Biological and Chemical Processes: From Structure and Dynamics to Function; Cambridge University Press: Cambridge, UK, 2013. [Google Scholar] [CrossRef] [Green Version]


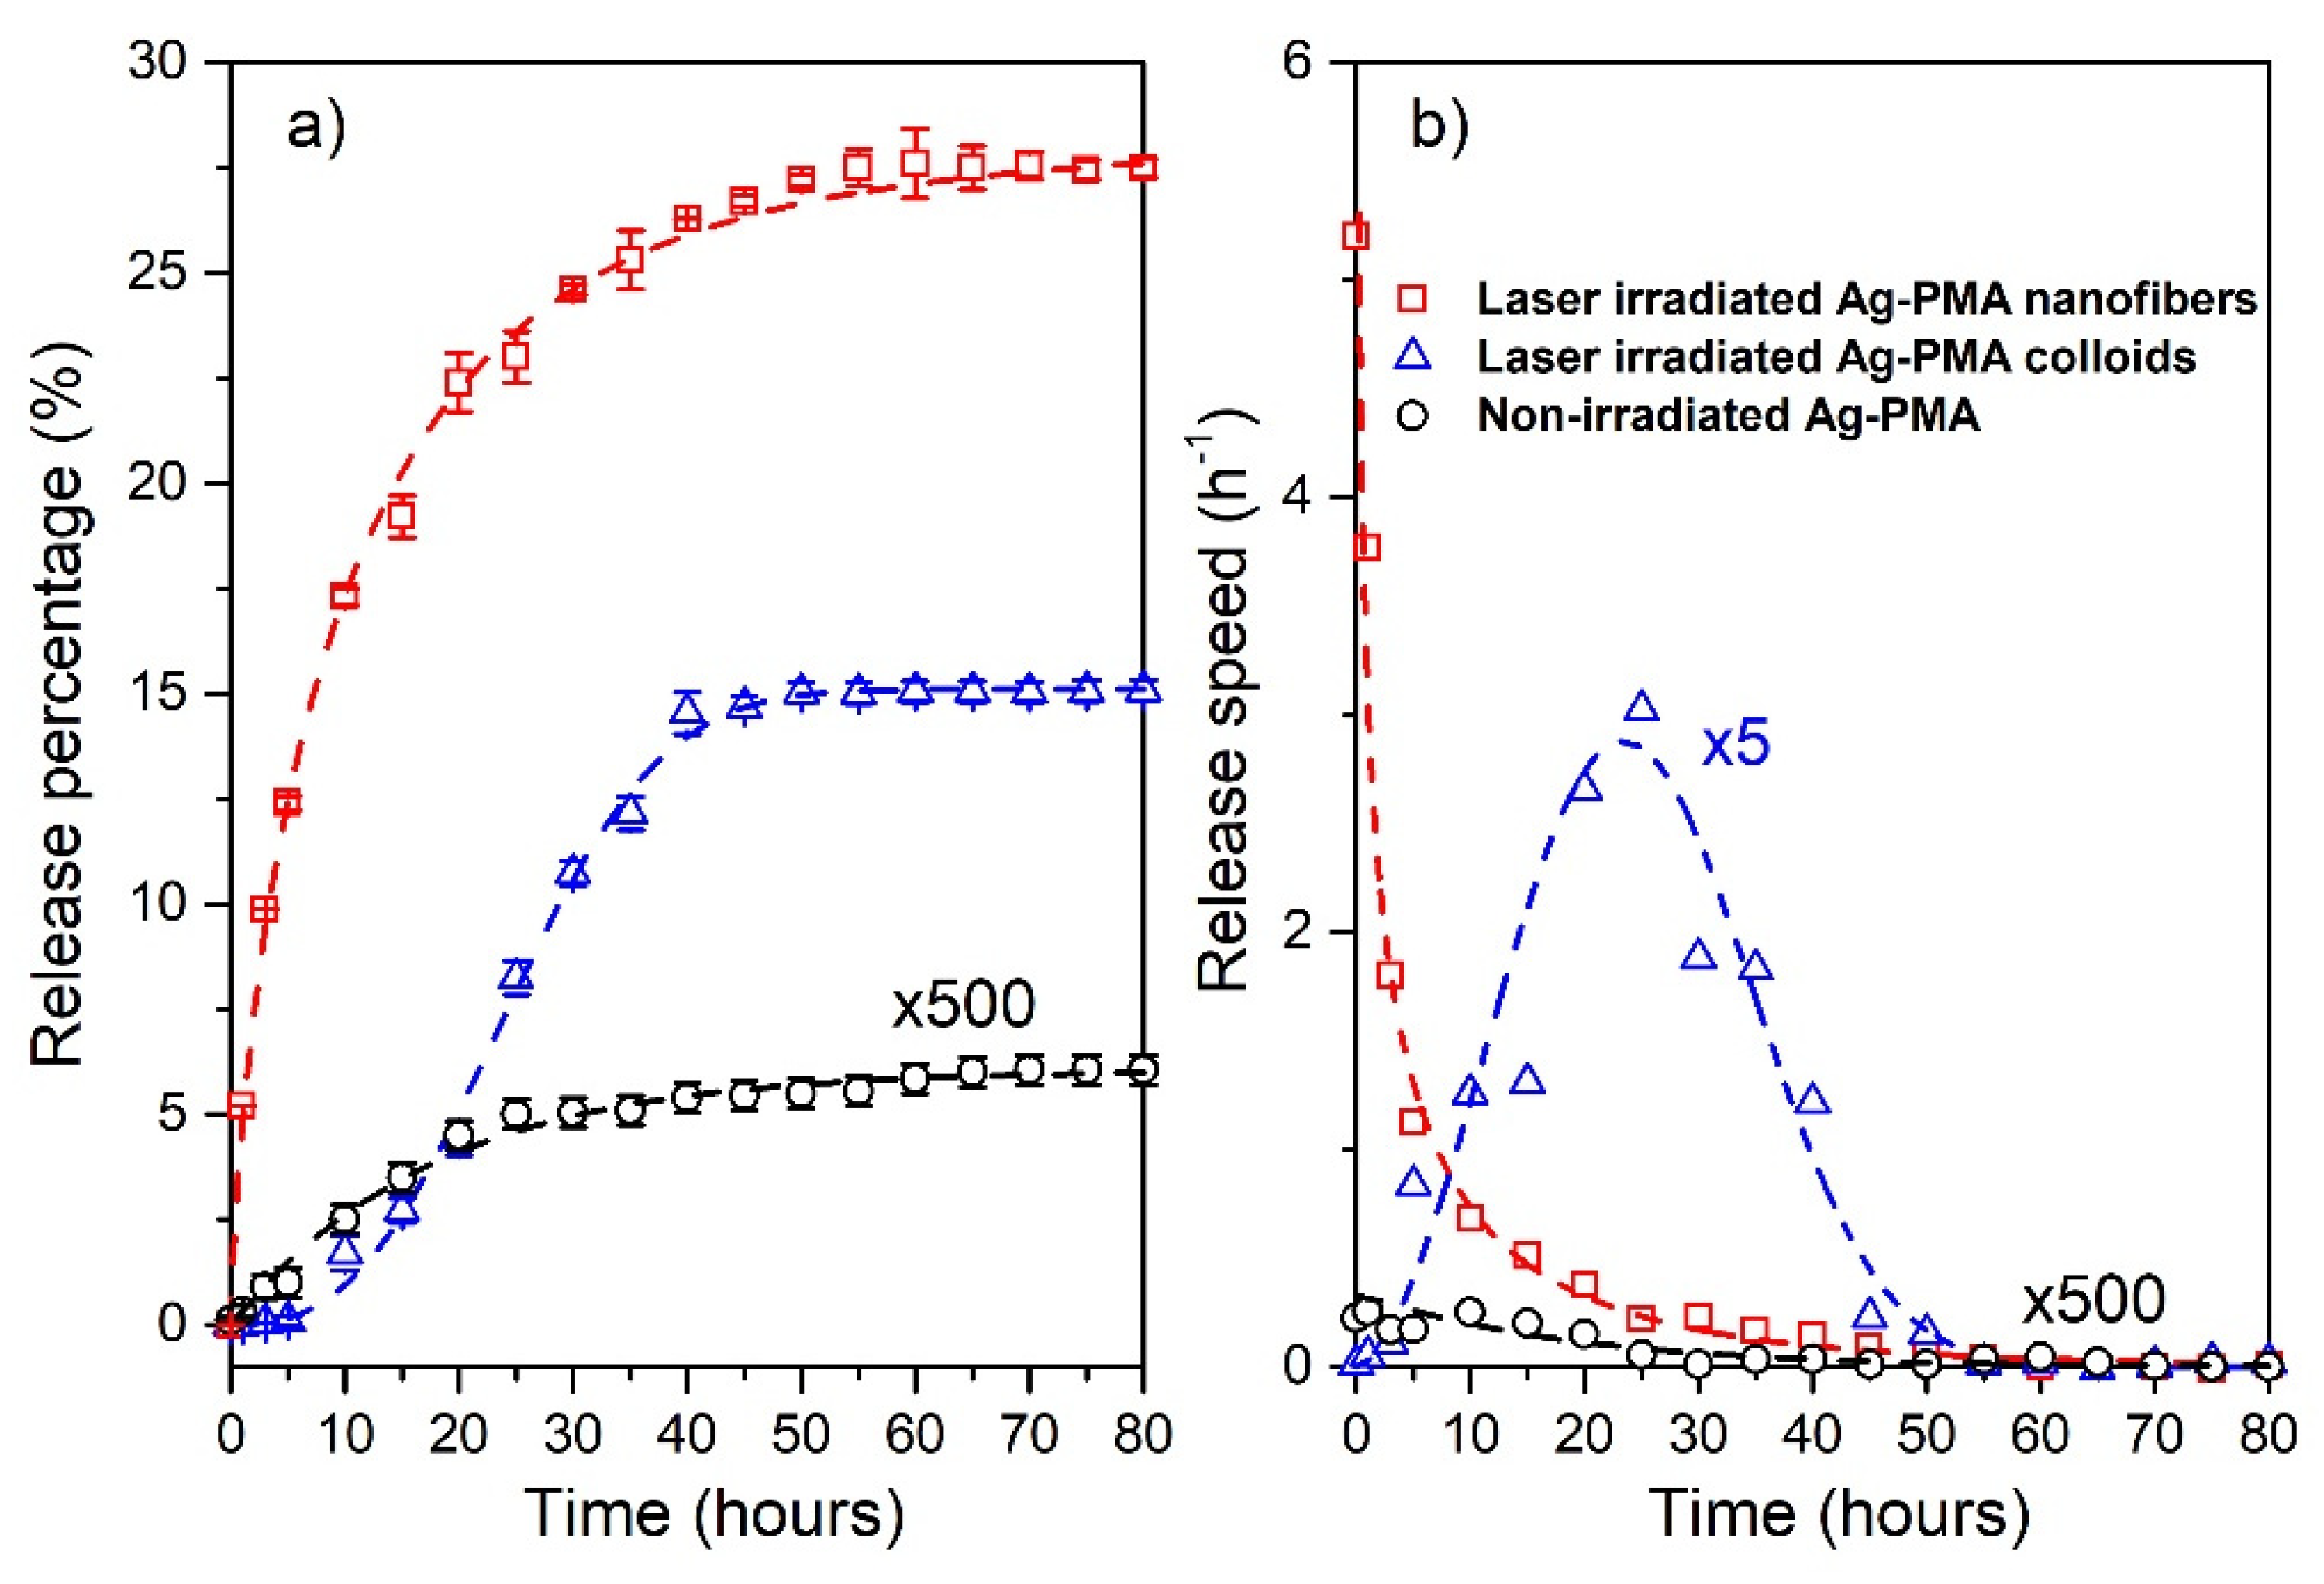
| Time (hours) | Release (%) | DE (%) | |
| Nanofibers | 1 | 5 | 3 |
| 3.5 | 10 | 6.3 | |
| 40 | 26 | 20.2 | |
| 80 | 28 | 23.6 | |
| Colloids | 20 | 5 | 1.5 |
| 29 | 10 | 3.4 | |
| 40 | 14 | 5.9 | |
| 80 | 15 | 10.4 |
Publisher’s Note: MDPI stays neutral with regard to jurisdictional claims in published maps and institutional affiliations. |
© 2021 by the authors. Licensee MDPI, Basel, Switzerland. This article is an open access article distributed under the terms and conditions of the Creative Commons Attribution (CC BY) license (https://creativecommons.org/licenses/by/4.0/).
Share and Cite
Corsaro, C.; Neri, G.; Mezzasalma, A.M.; Fazio, E. Weibull Modeling of Controlled Drug Release from Ag-PMA Nanosystems. Polymers 2021, 13, 2897. https://doi.org/10.3390/polym13172897
Corsaro C, Neri G, Mezzasalma AM, Fazio E. Weibull Modeling of Controlled Drug Release from Ag-PMA Nanosystems. Polymers. 2021; 13(17):2897. https://doi.org/10.3390/polym13172897
Chicago/Turabian StyleCorsaro, Carmelo, Giulia Neri, Angela Maria Mezzasalma, and Enza Fazio. 2021. "Weibull Modeling of Controlled Drug Release from Ag-PMA Nanosystems" Polymers 13, no. 17: 2897. https://doi.org/10.3390/polym13172897
APA StyleCorsaro, C., Neri, G., Mezzasalma, A. M., & Fazio, E. (2021). Weibull Modeling of Controlled Drug Release from Ag-PMA Nanosystems. Polymers, 13(17), 2897. https://doi.org/10.3390/polym13172897