
Evaluating Orientation Effects on the Fire Reaction Properties of Flax-Polypropylene Composites


Abstract
: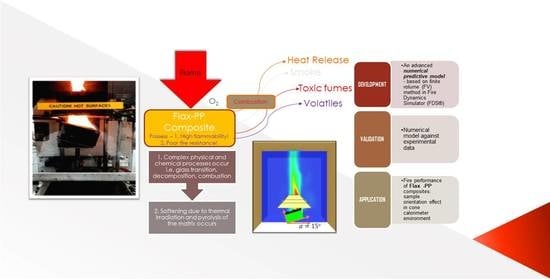
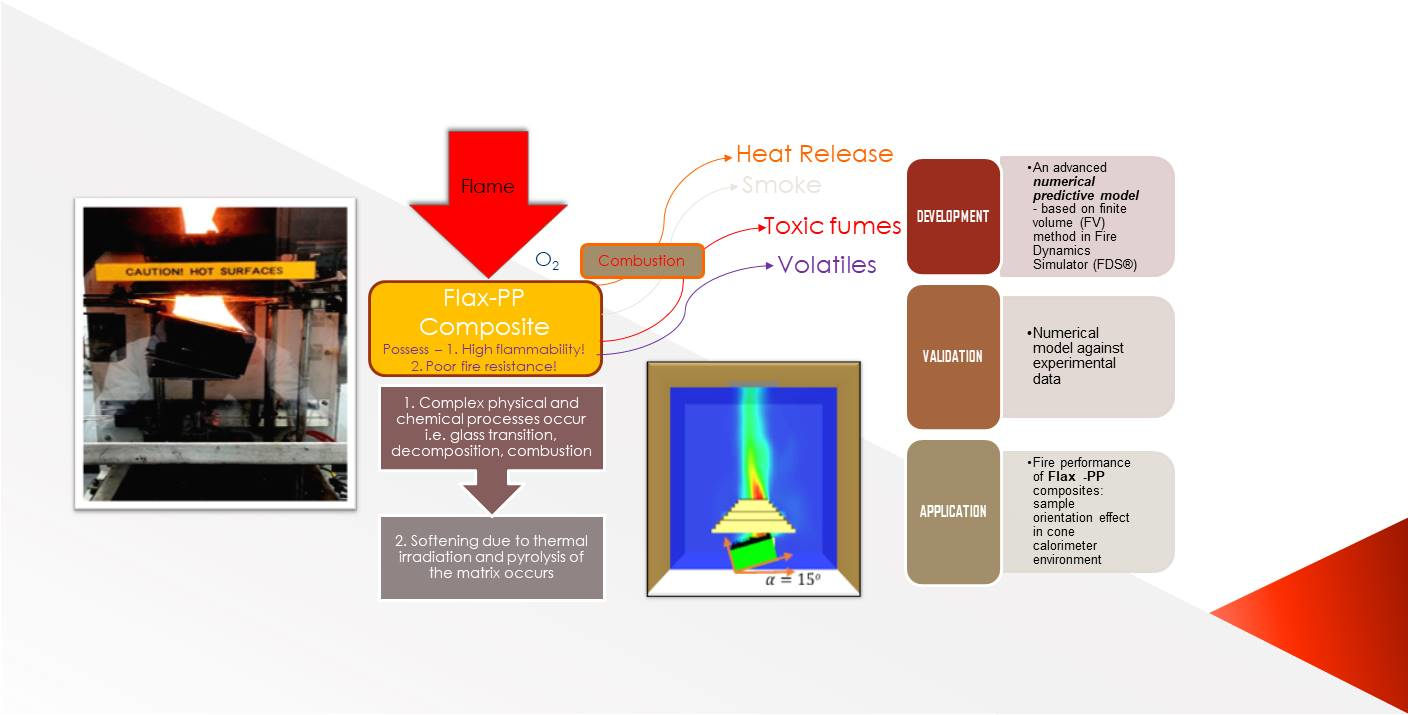
1. Introduction
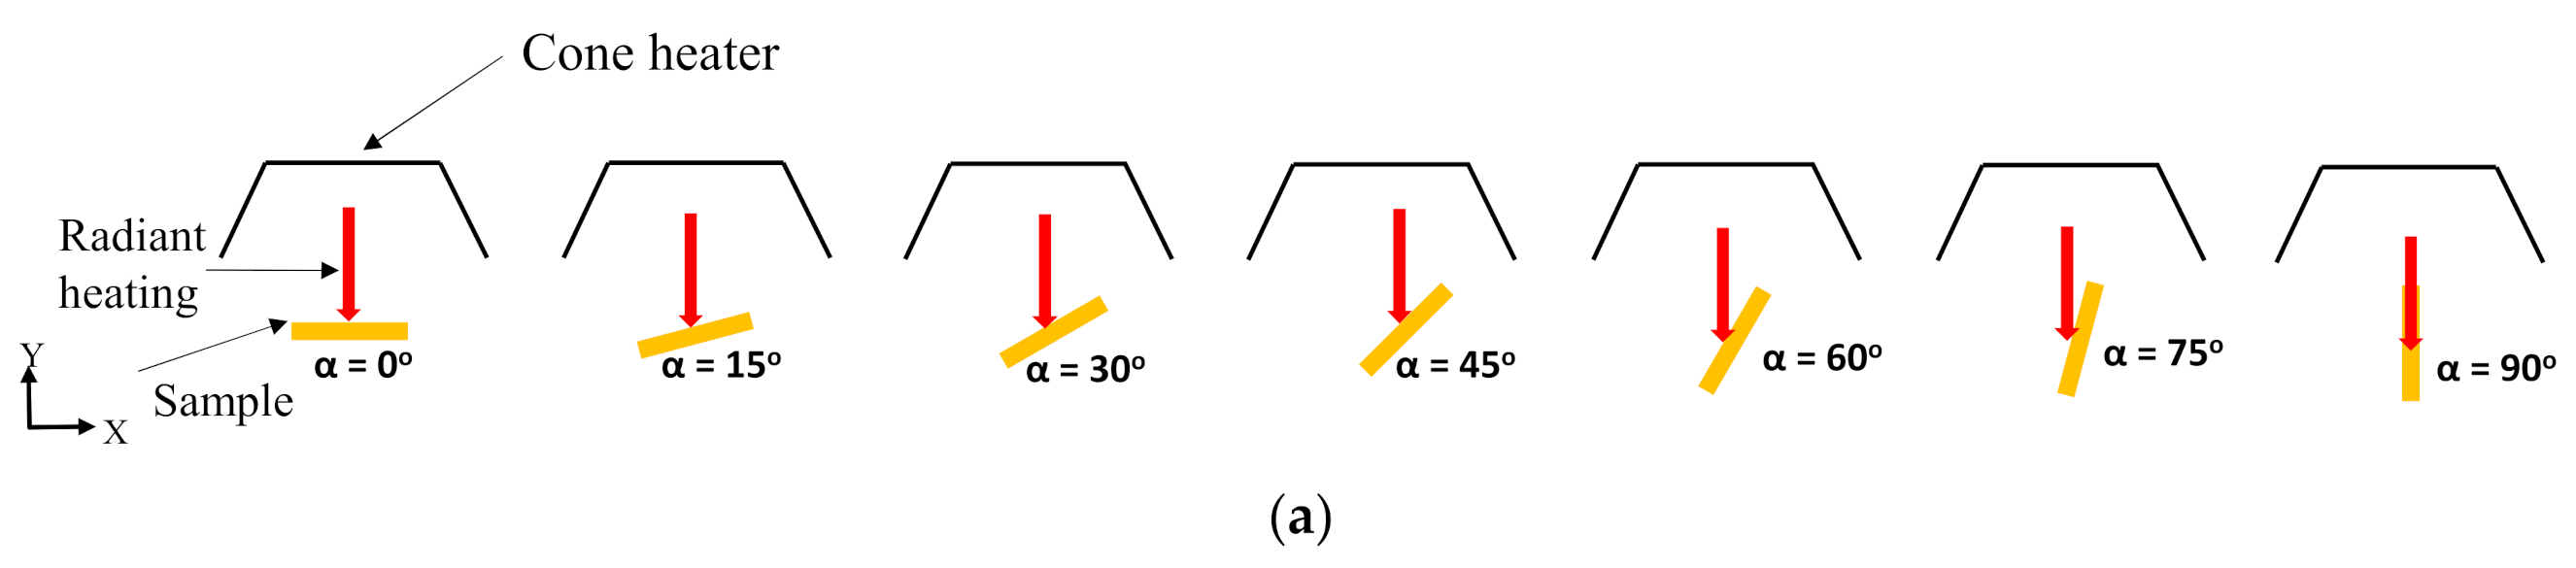
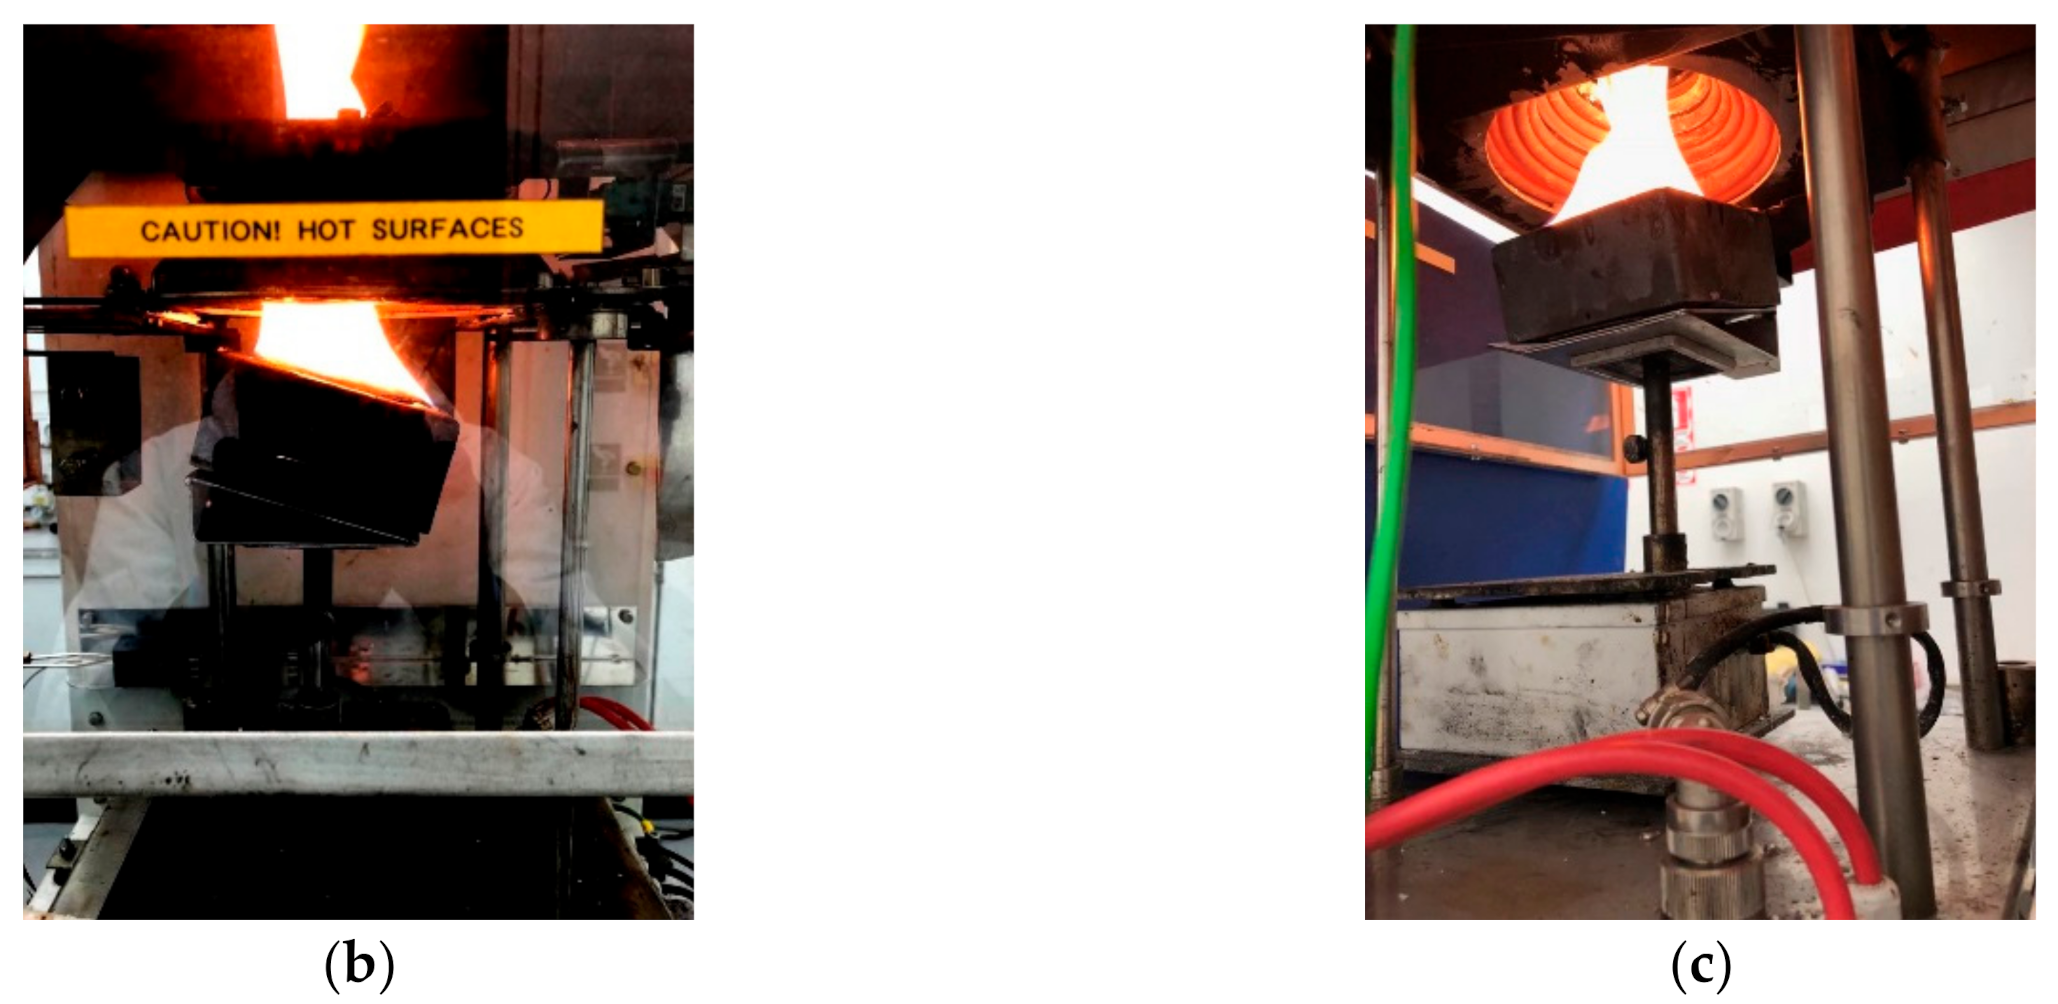
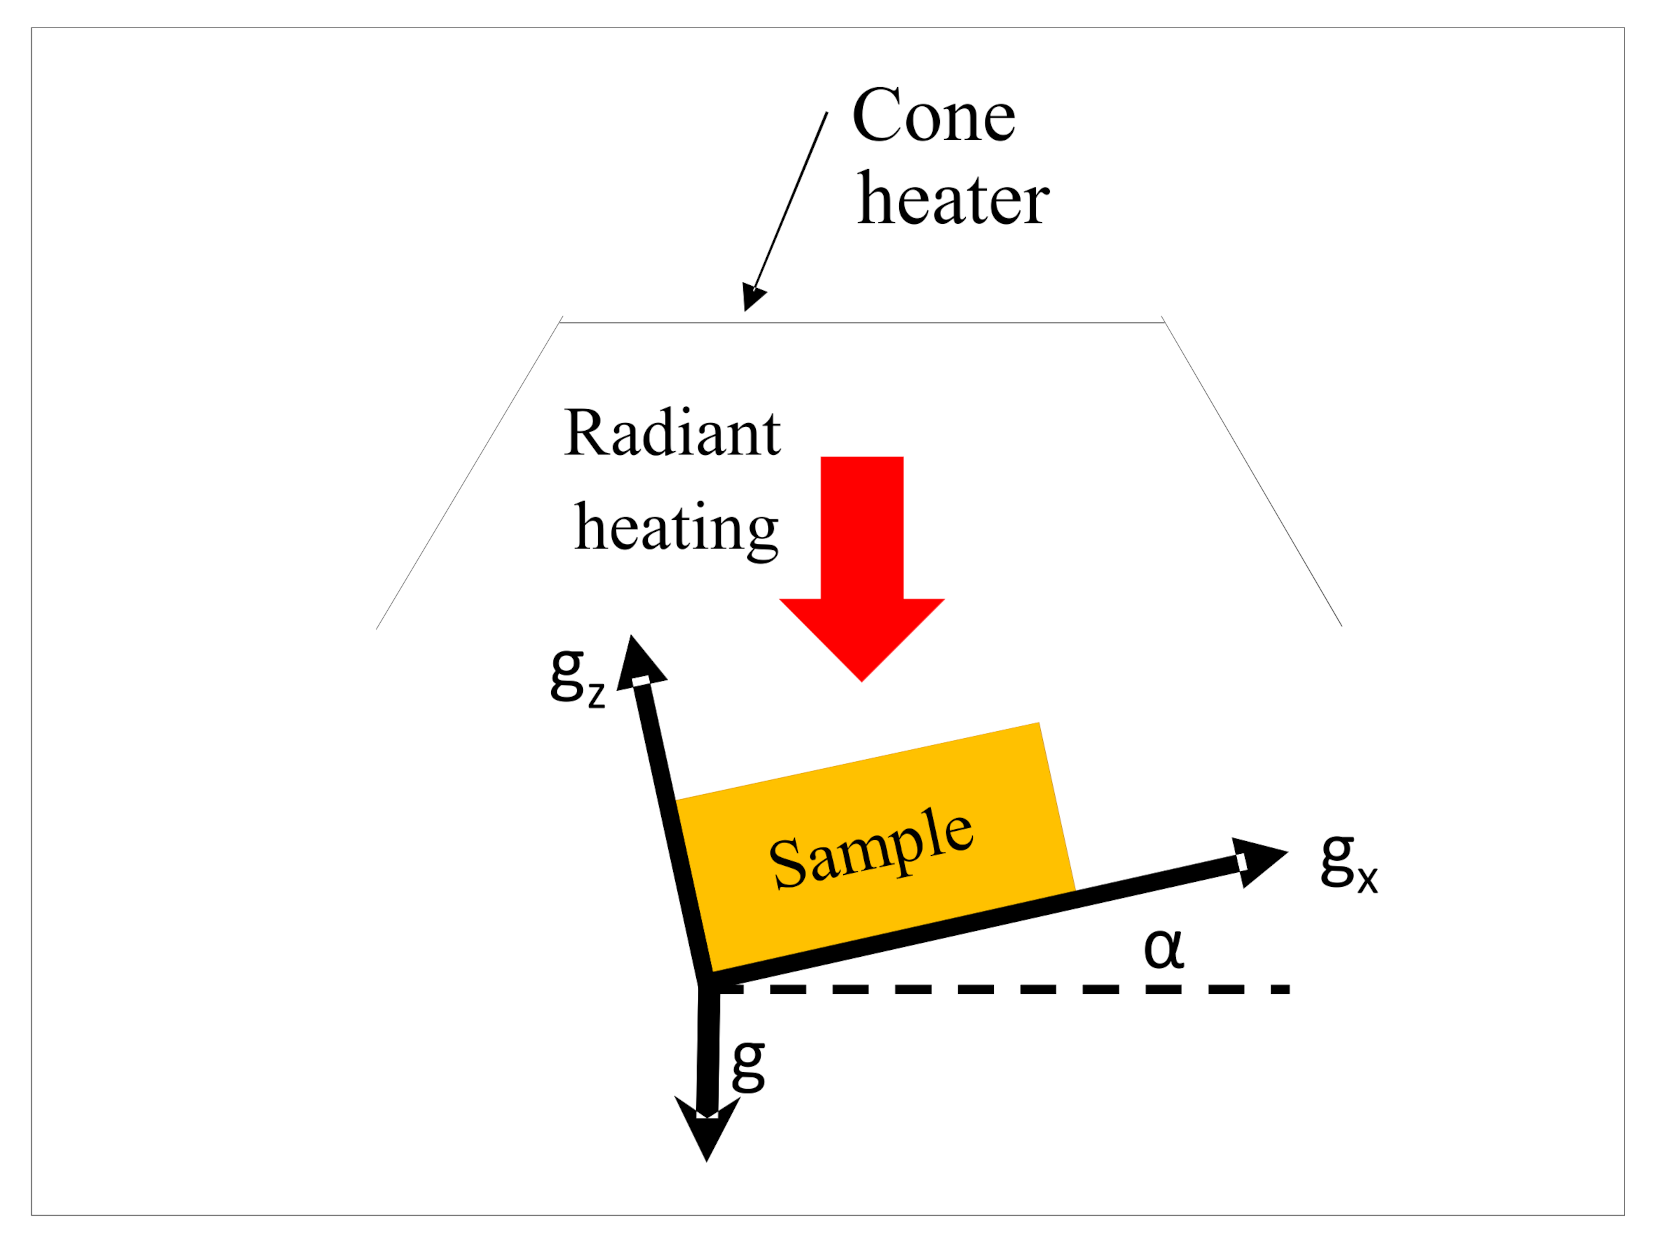
2. Materials and Experiments
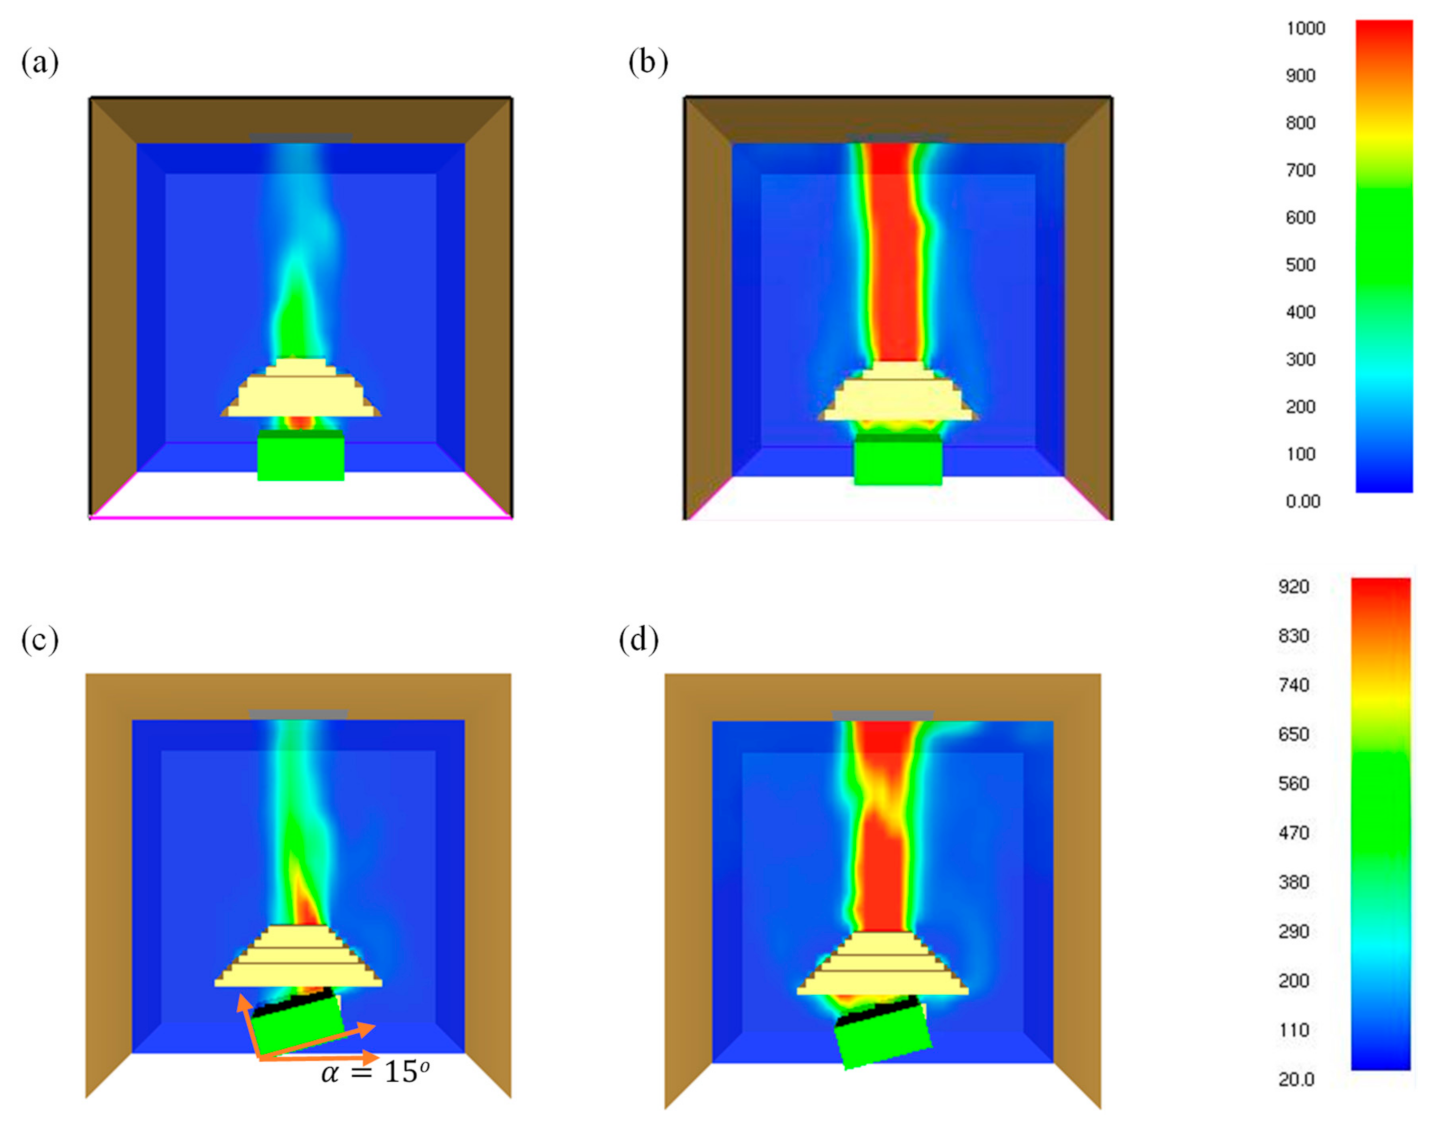
3. Numerical Modelling
4. Results and Discussion
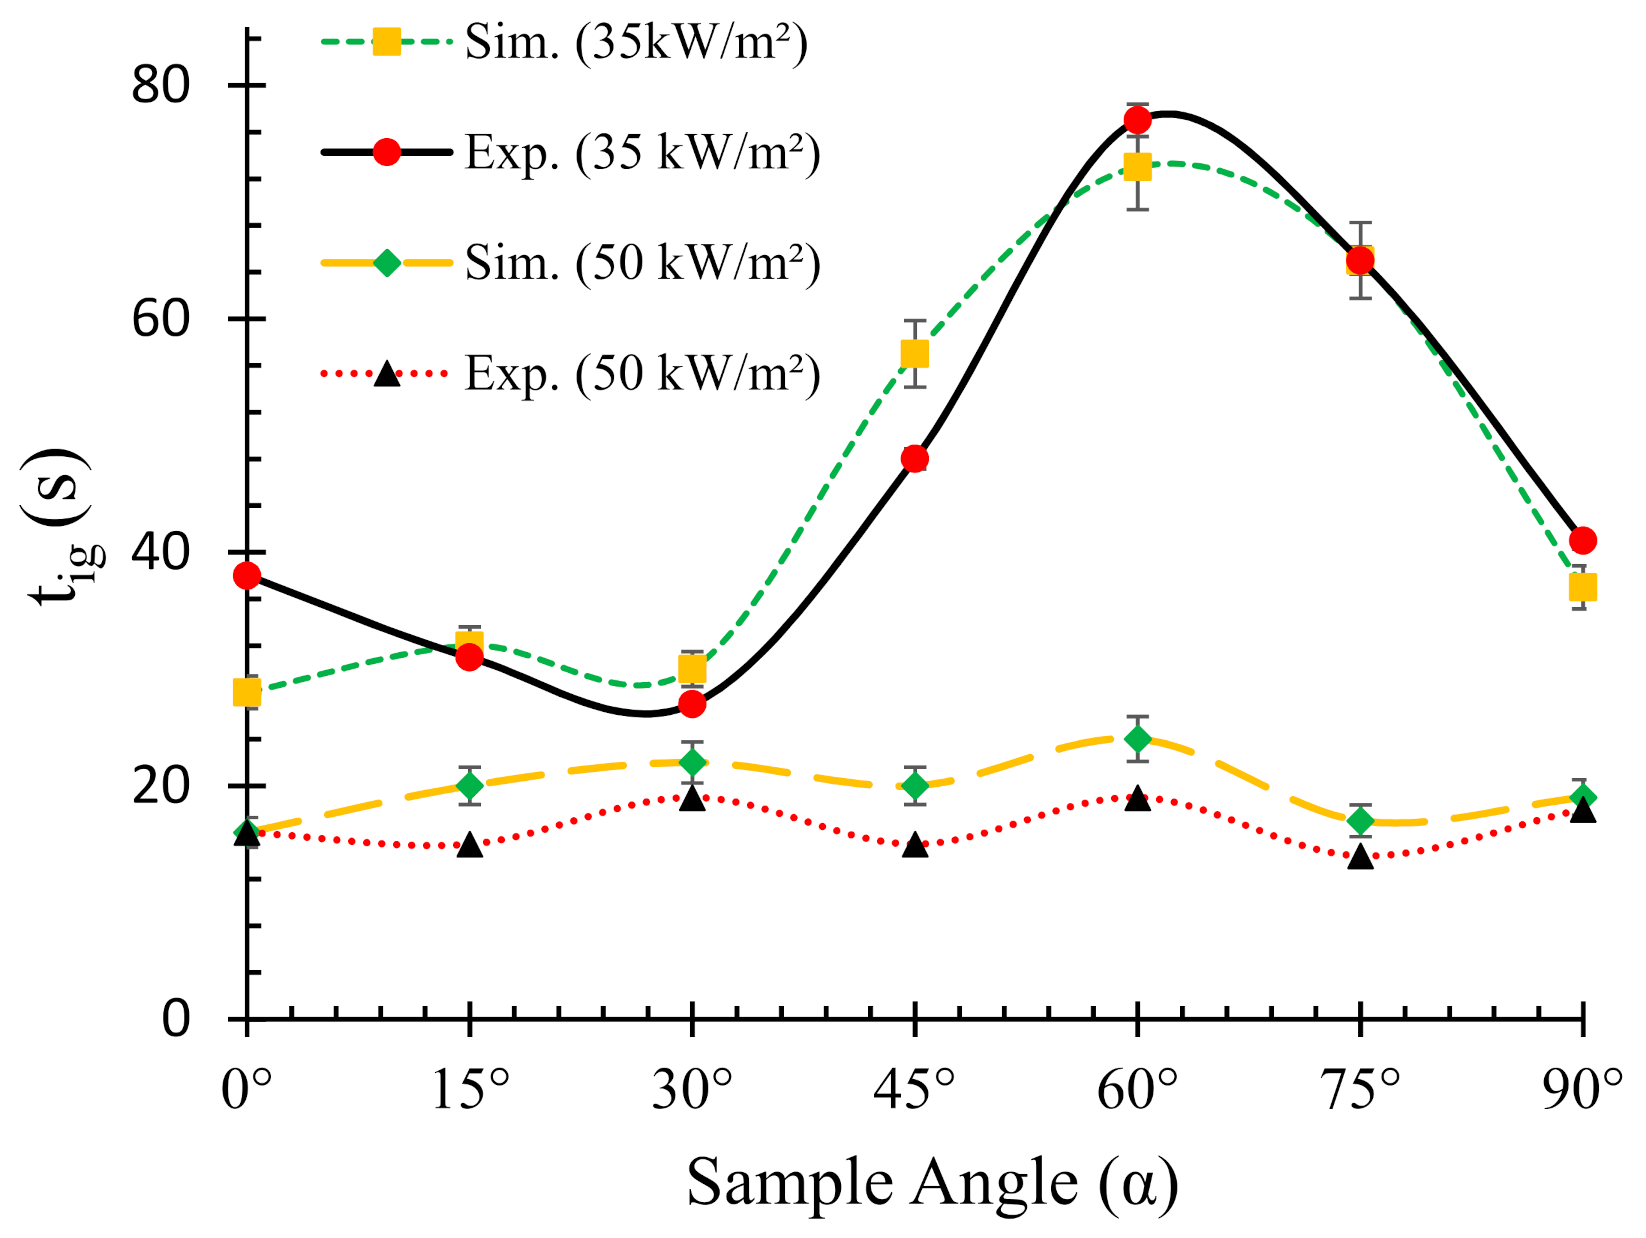
4.1. Effects of Sample Orientation Angle (α) on the Time to Ignition (tig)
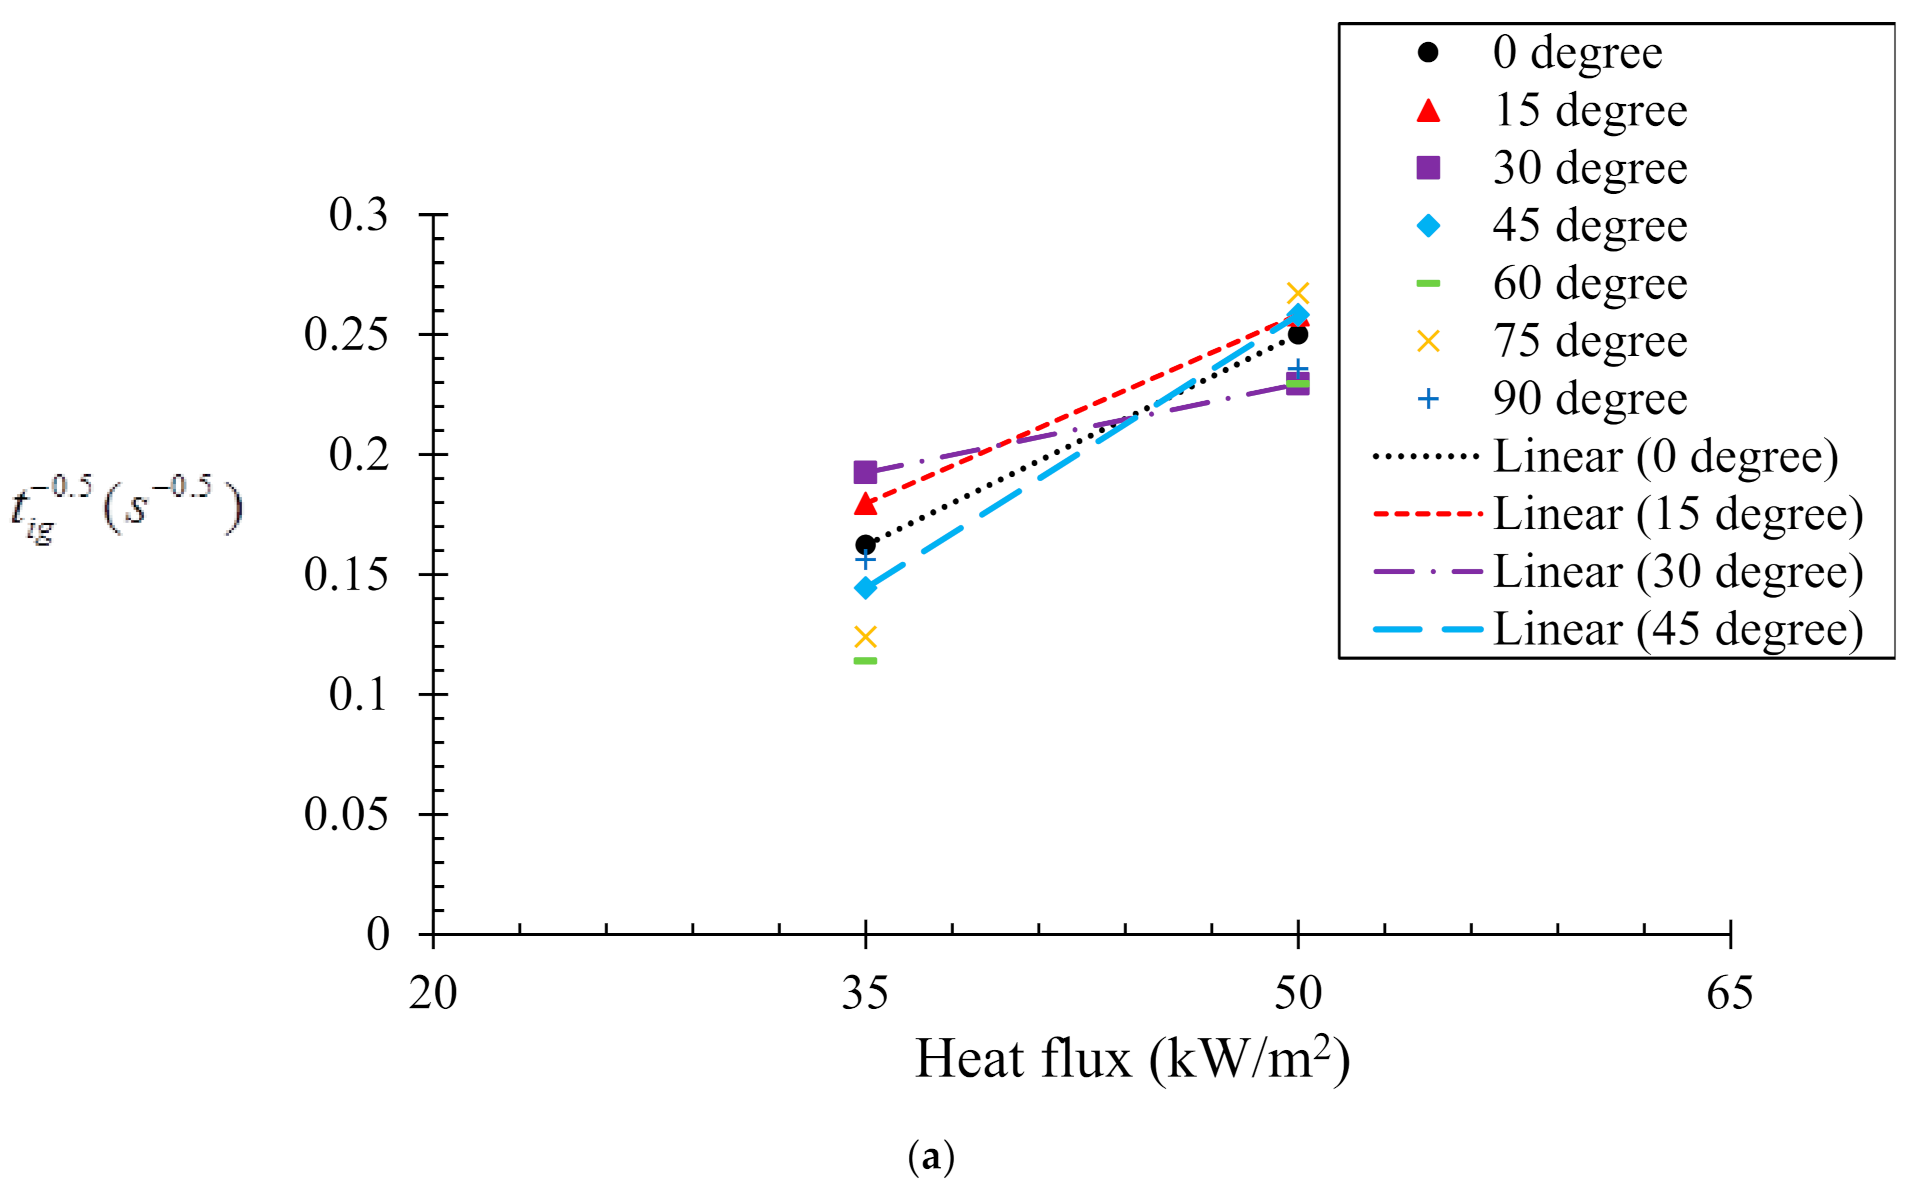
Determination of Critical Heat Flux, ()
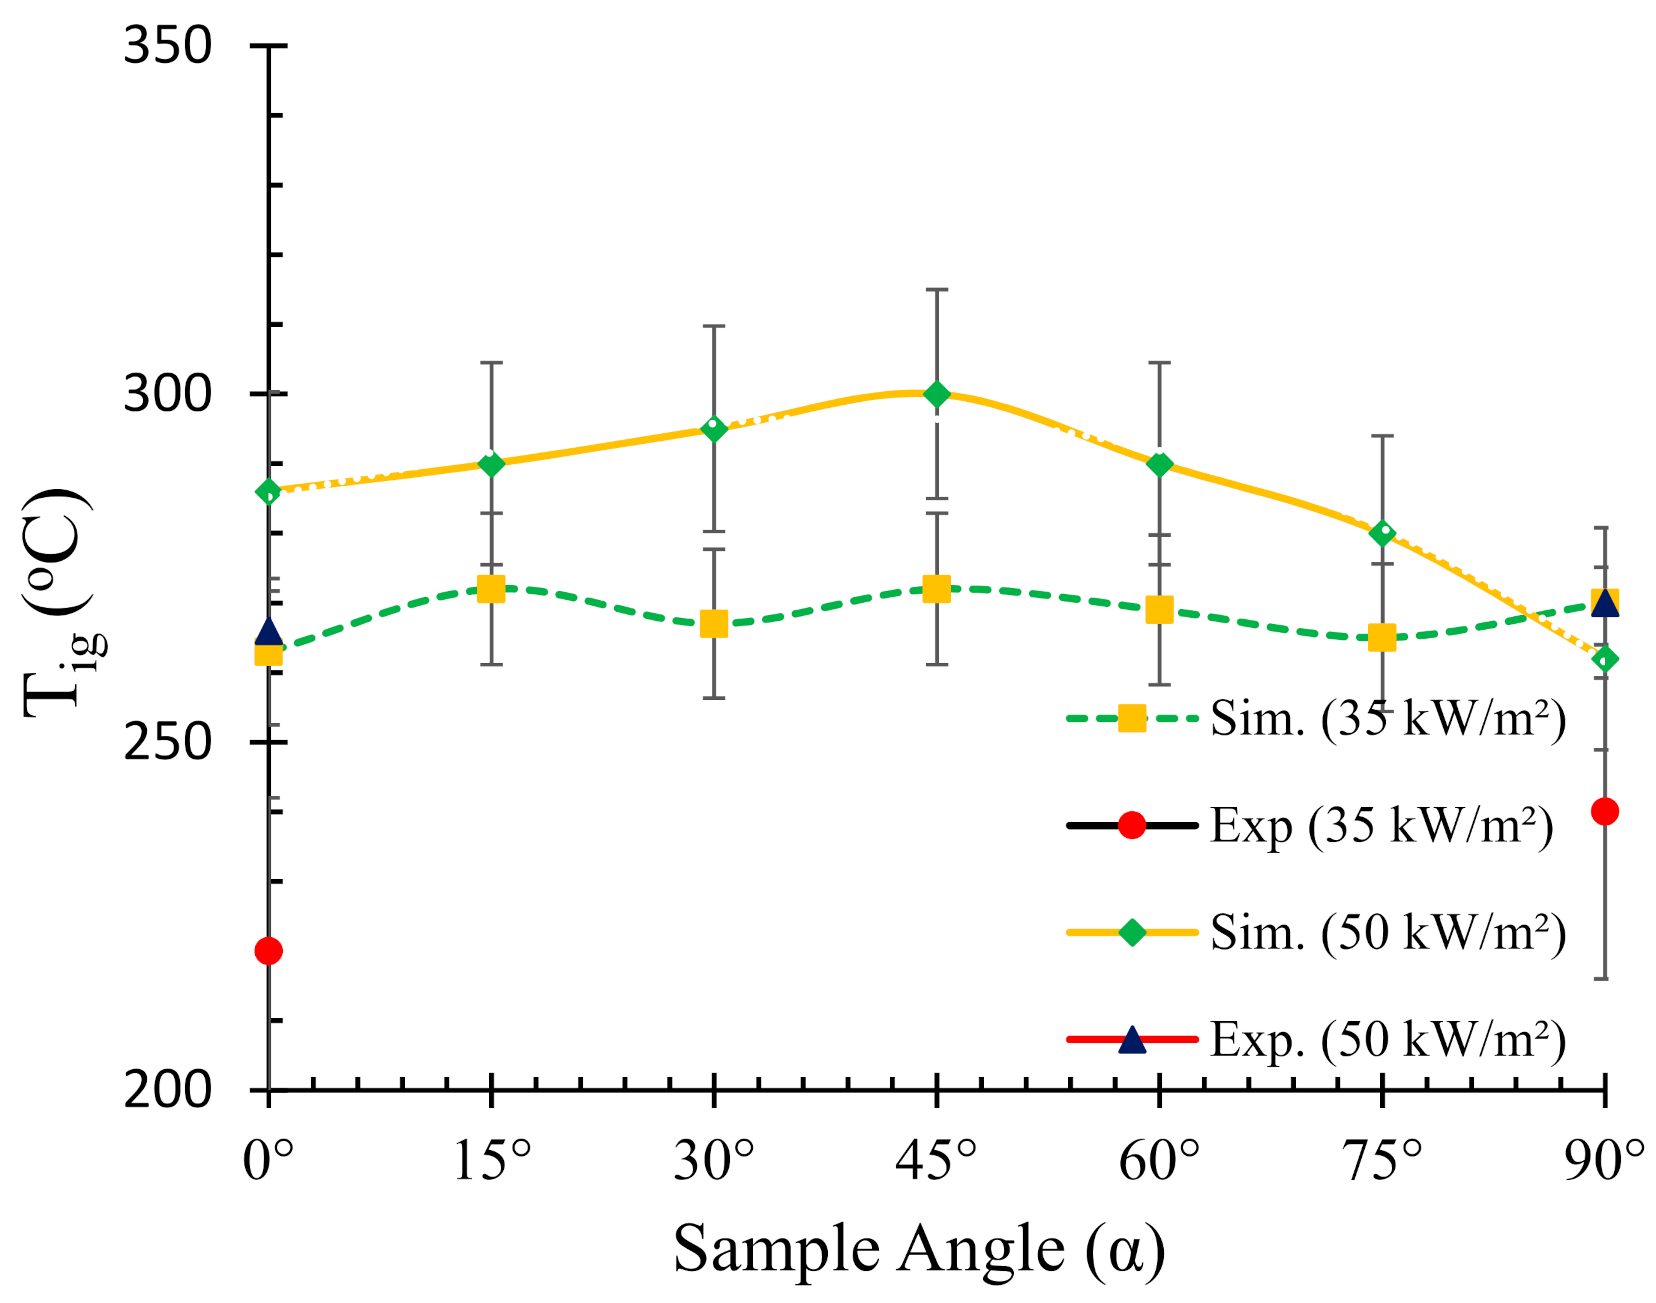
4.2. Effects of Sample Orientation Angle (α) on the Ignition Temperature (Tig)
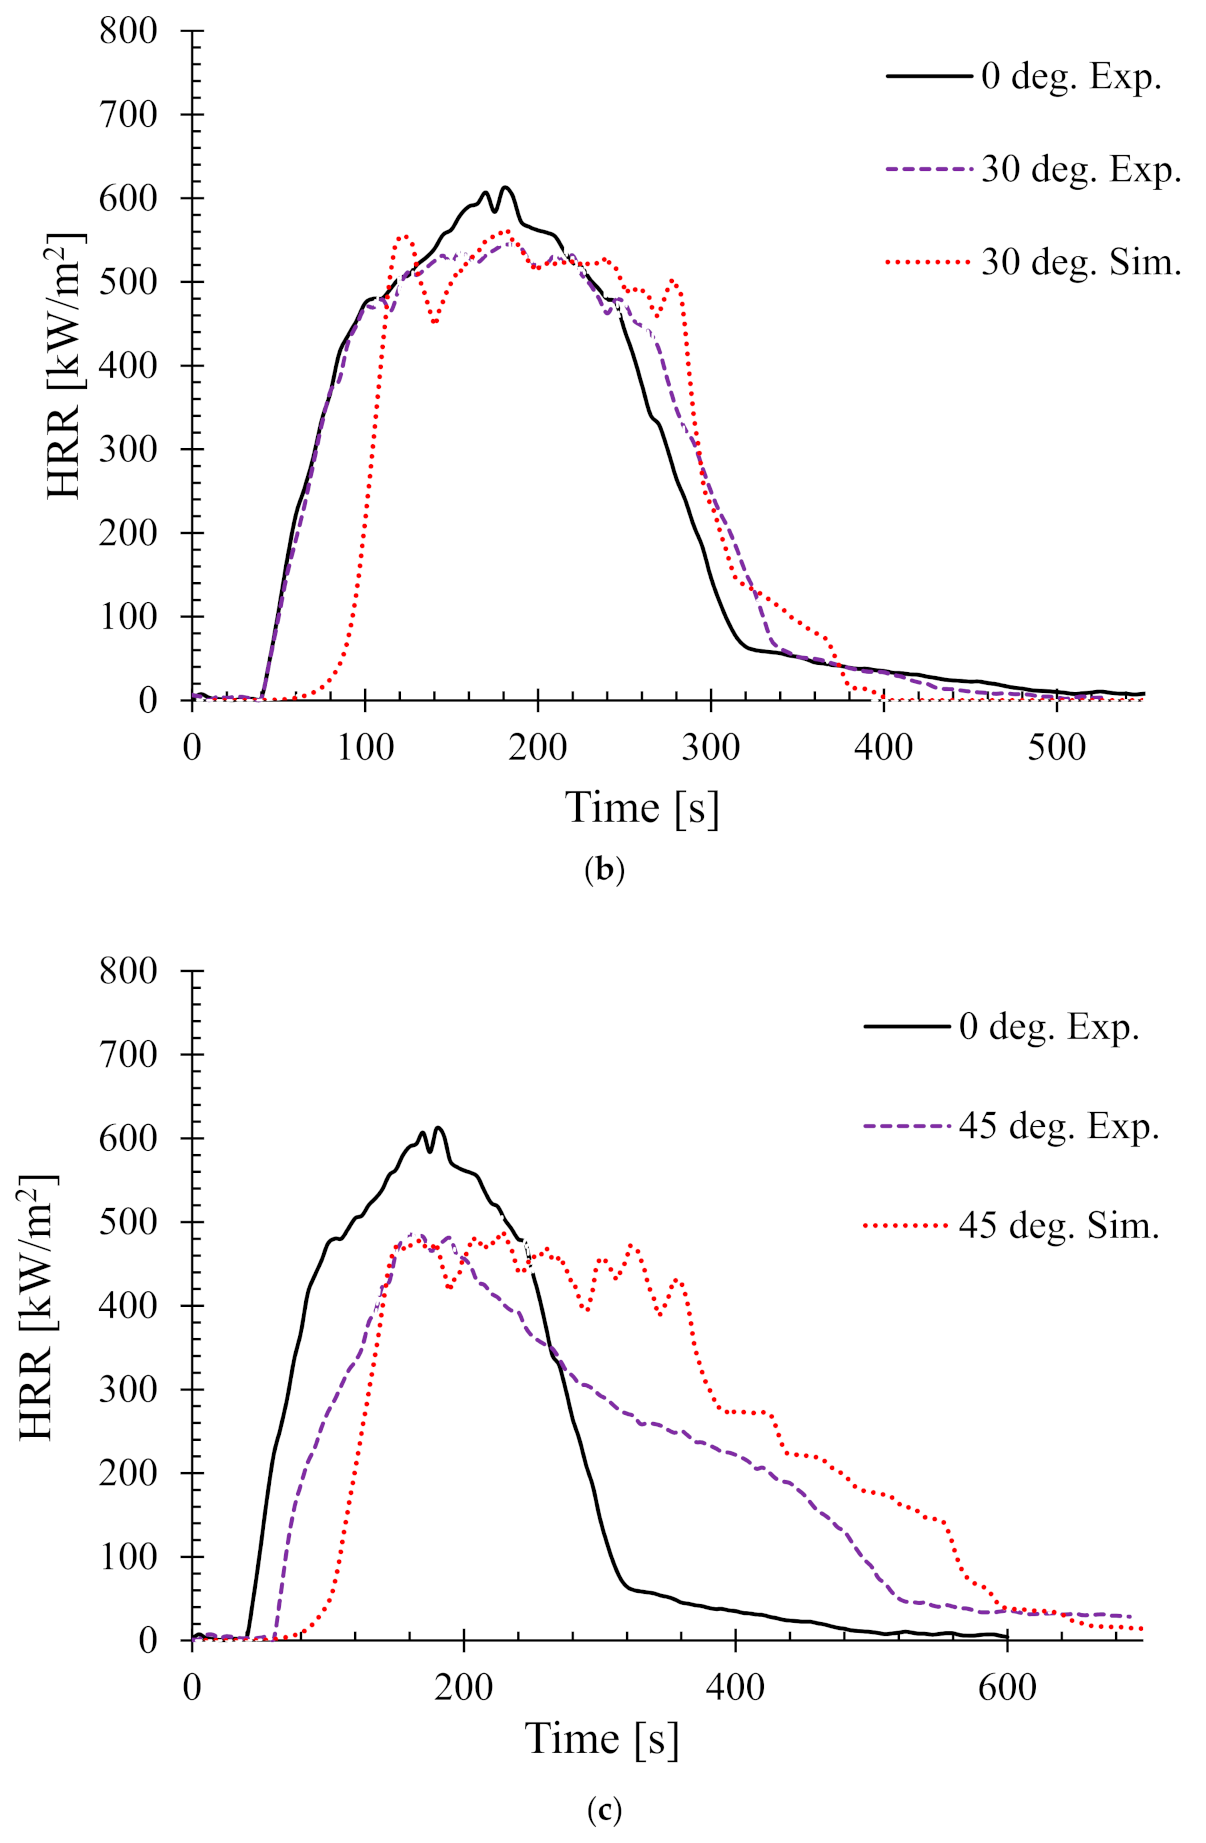
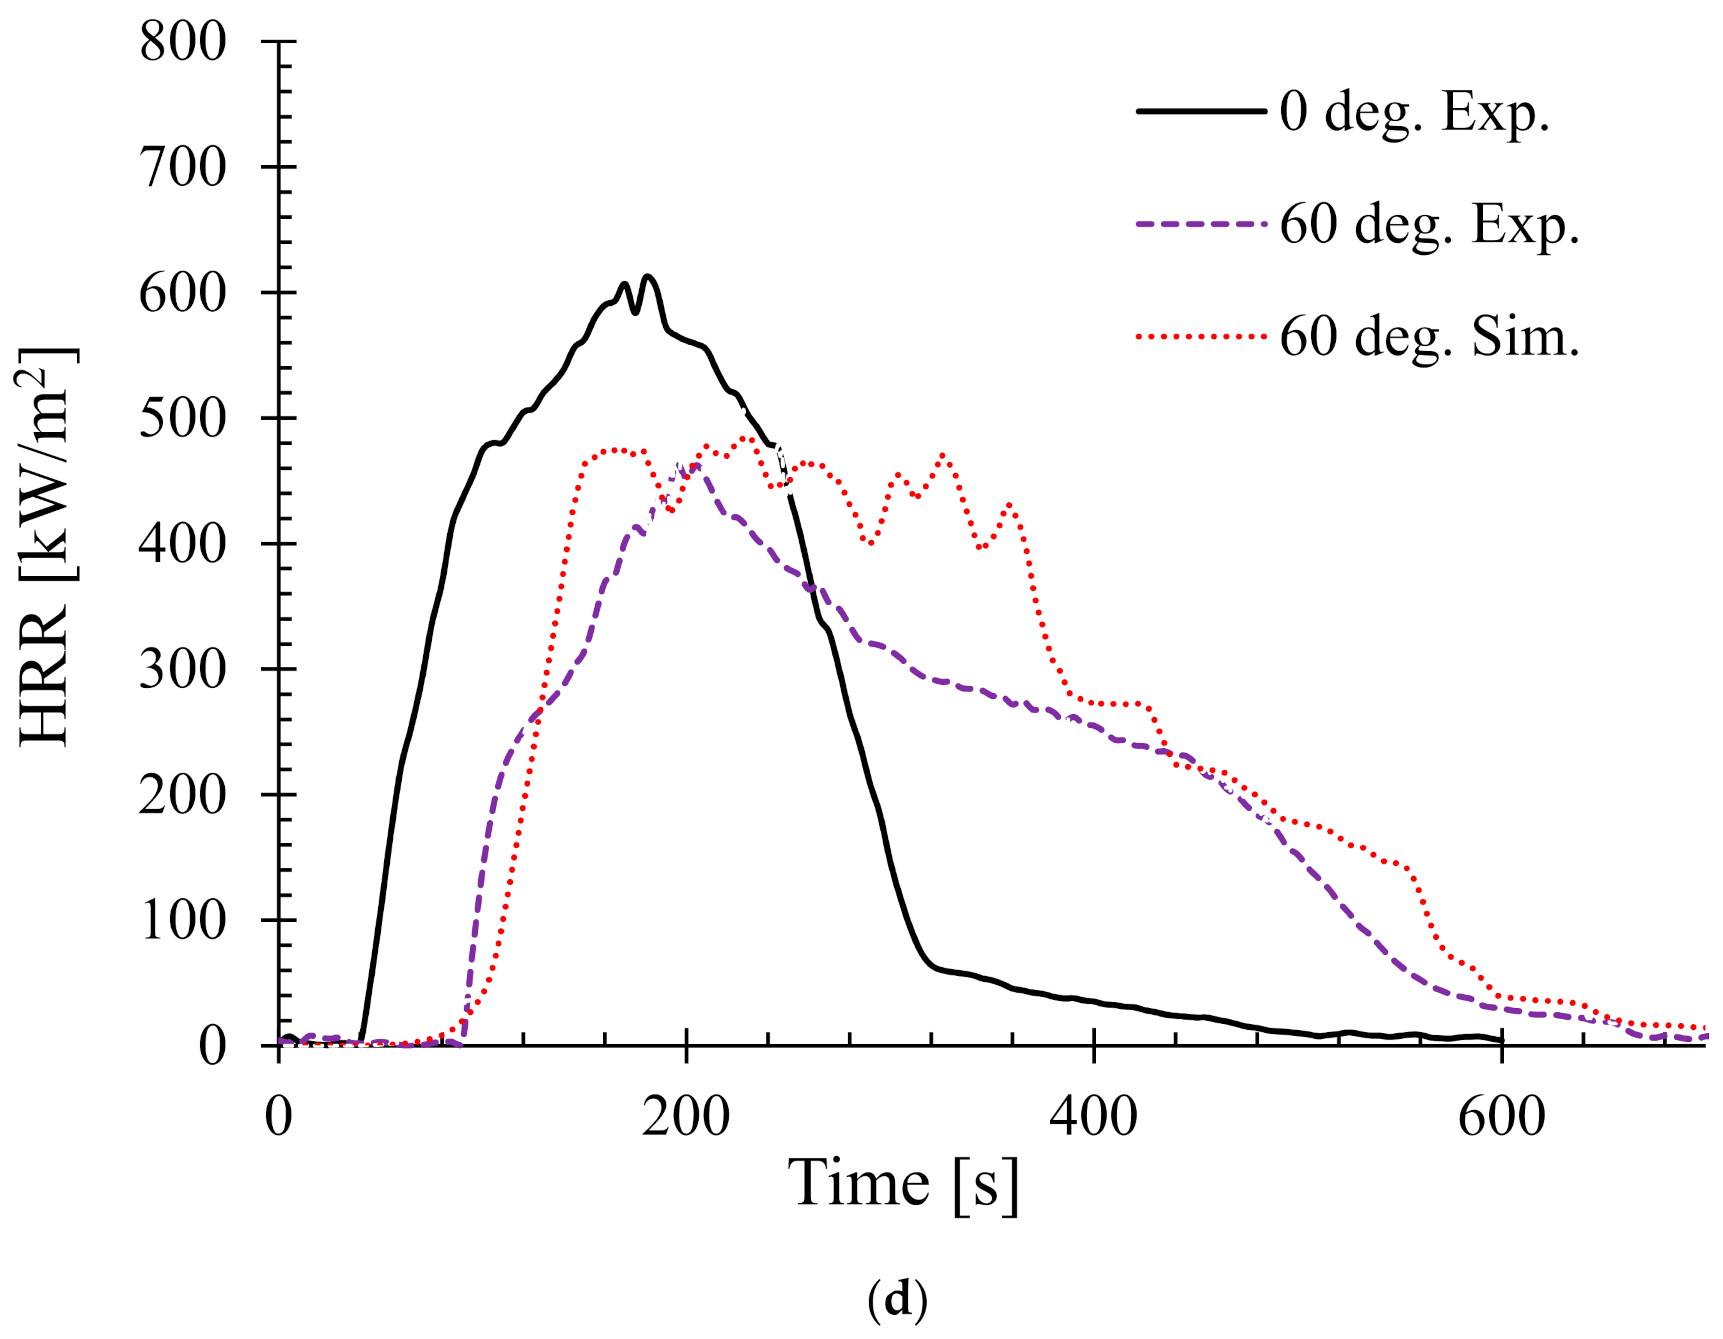
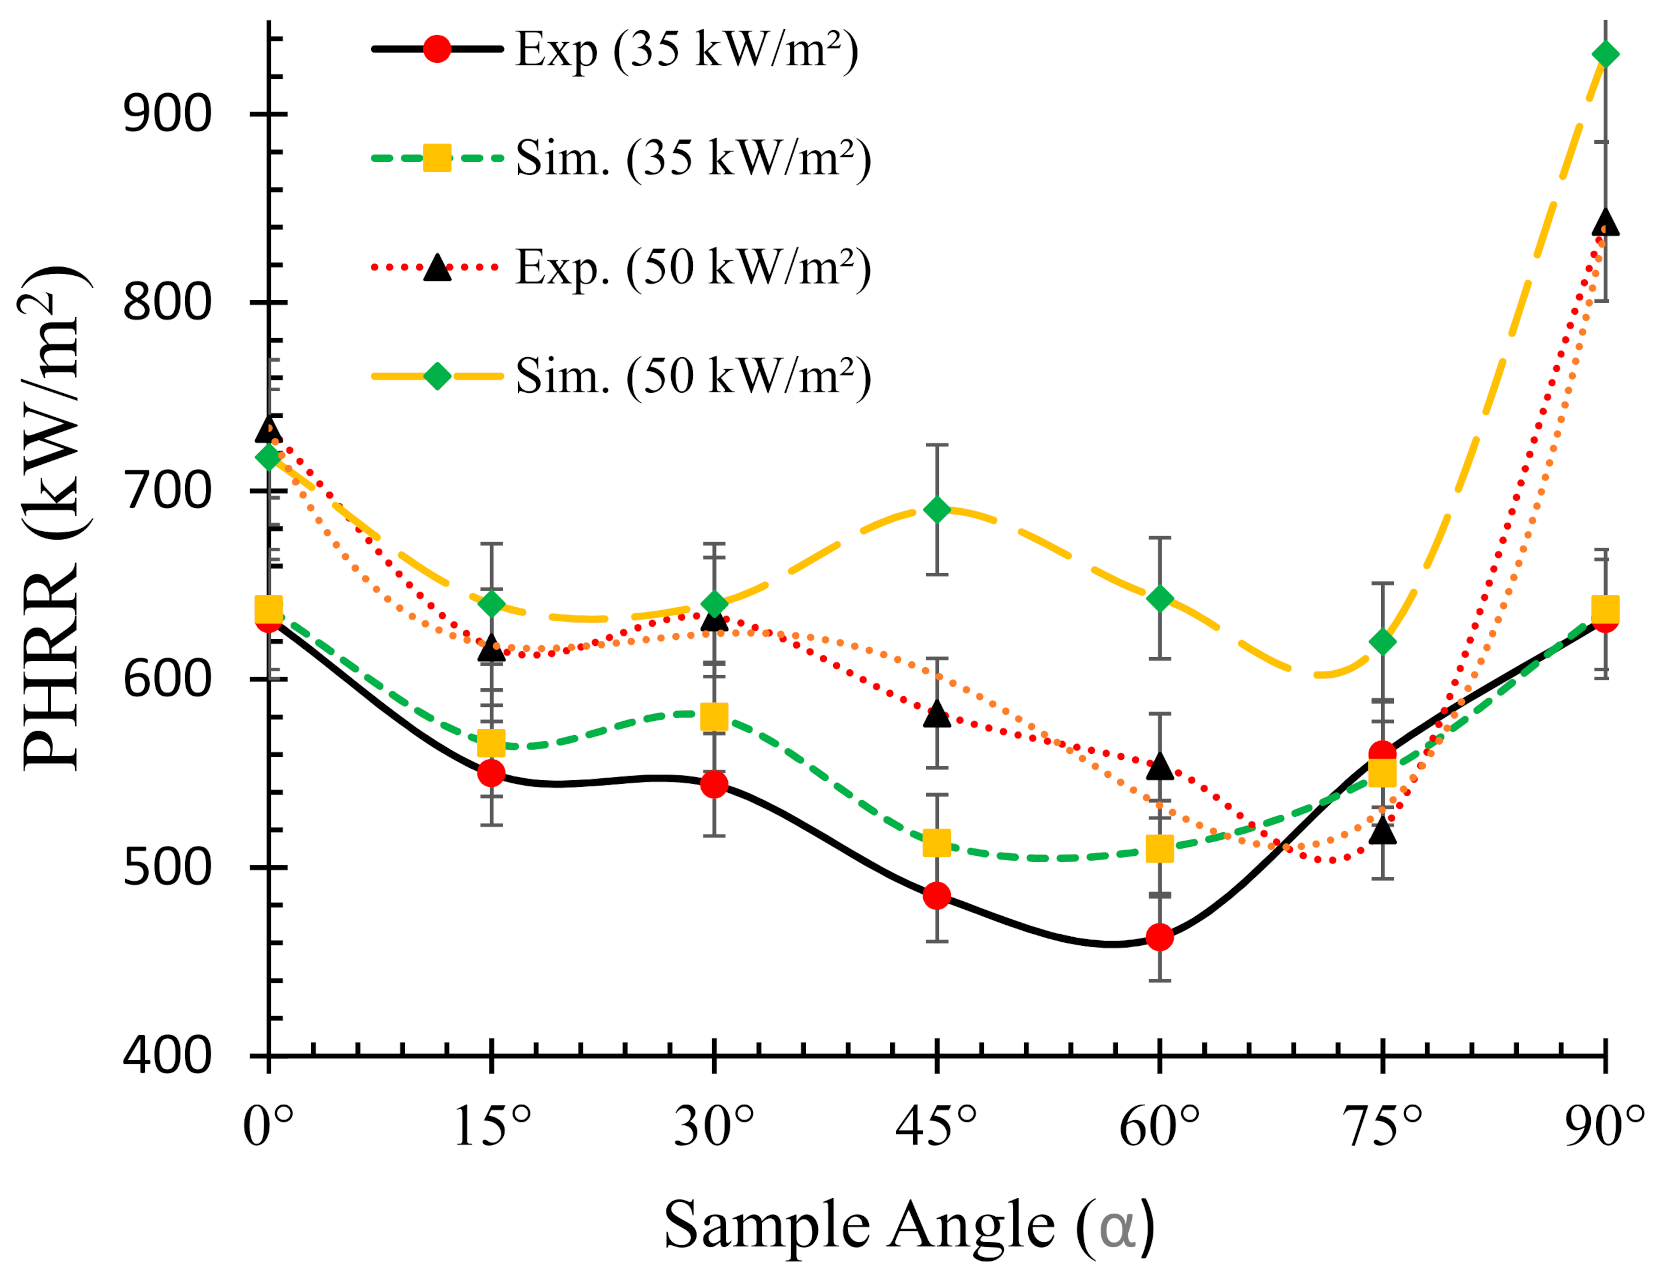
4.3. Effects of Sample Orientation Angle (α) on the Heat Release Rate (HRR)
4.4. Effects of Sample Angle on the Burn Time (tb)
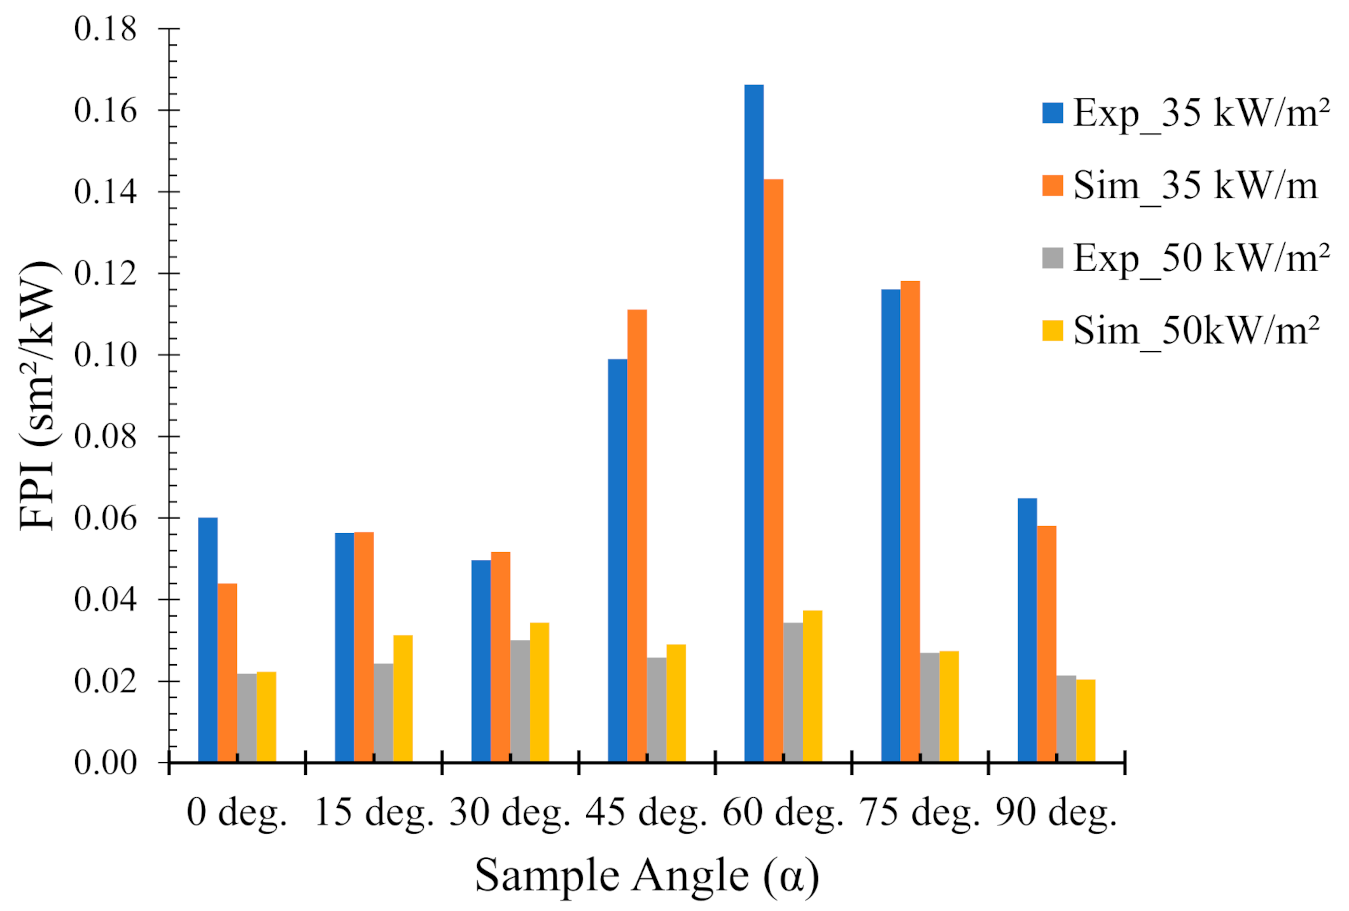
4.5. Fire Performance Index (FPI)
4.6. Heat and Smoke Flow Temperature (Ts)
5. Conclusions
Author Contributions
Funding
Institutional Review Board Statement
Informed Consent Statement
Data Availability Statement
Conflicts of Interest
References
- Babrauskas, V.; Peacock, R.D. Heat release rate: The single most important variable in fire hazard. Fire Saf. J. 1992, 18, 255–272. [Google Scholar] [CrossRef]
- Quintiere, J.Q.; Lee, C.H. Ignitor and Thickness Effects on Upward Flame Spread. Fire Technol. 1998, 34, 18–38. [Google Scholar] [CrossRef]
- Anderson, M.; McKeever, C.; Pehrson, R.; Barnett, J. An experimental study of upward flame spread on cellulosic materials. In Proceedings of the INTERFLAM-7 Conference, Cambridge, UK, 26–28 March 1996; pp. 169–178. [Google Scholar]
- Hirschler, M.M. Use of heat release rate to predict whether individual furnishings would cause self propagating fires. Fire Saf. J. 1999, 32, 273–296. [Google Scholar] [CrossRef]
- Lefebvre, J.; Bastin, B.; Le Bras, M.; Duquesne, S.; Ritter, C.; Paleja, R.; Poutch, F. Flame spread of flexible polyurethane foam: Comprehensive study. Polym. Test. 2004, 23, 281–290. [Google Scholar] [CrossRef]
- Lattimer, B.Y.; Hunt, S.P.; Wright, M.; Sorathia, U. Modeling fire growth in a combustible corner. Fire Saf. J. 2003, 38, 771–796. [Google Scholar] [CrossRef]
- Schartel, B.; Hull, T.R. Development of fire-retarded materials—Interpretation of cone calorimeter data. Fire Mater. 2007, 31, 327–354. [Google Scholar] [CrossRef]
- Schartel, B.; Pötschke, P.; Knoll, U.; Abdel-Goad, M. Fire behaviour of polyamide 6/multiwall carbon nanotube nanocomposites. Eur. Polym. J. 2005, 41, 1061–1070. [Google Scholar] [CrossRef]
- Mouritz, A.; Gardiner, C. Post-fire properties of sandwich polymer composites. Compos. Part A Appl. S. 2002, 33, 609–620. [Google Scholar] [CrossRef]
- Chow, W. Fire hazard assessment on polyurethane sandwich panels for temporary accommodation units. Polym. Test. 2004, 23, 973–977. [Google Scholar] [CrossRef]
- Tsai, K.-C. Orientation effect on cone calorimeter test results to assess fire hazard of materials. J. Hazard. Mater. 2009, 172, 763–772. [Google Scholar] [CrossRef]
- Chai, M. Flammability Performance of Bio-Derived Composite Materials for Aircraft Interiors. Ph.D. Thesis, Department of Mechanical Engineering, The University of Auckland, Auckland, New Zealand, 2014. [Google Scholar]
- Bourbigot, S.; Duquesne, S.; Leroy, J.-M. Modeling of Heat Transfer of a Polypropylene-Based Intumescent System during Combustion. J. Fire Sci. 1999, 17, 42–56. [Google Scholar] [CrossRef]
- Linteris, G.; Lyon, R.; Stoliarov, S. Prediction of the gasification rate of thermoplastic polymers in fire-like environments. Fire Saf. J. 2013, 60, 14–24. [Google Scholar] [CrossRef]
- Mei-Fang, Z.; Yang, H. Polypropylene fibres. In Handbook of Fibre Chemistry; Menachem, L., Pearce, E.M., Eds.; CRC Press: New York, NY, USA, 2006. [Google Scholar]
- Kim, N.; Lin, R.; Bhattacharyya, D. Extruded short wool fibre composites: Mechanical and fire retardant properties. Compos. Part B Eng. 2014, 67, 472–480. [Google Scholar] [CrossRef]
- Kim, N.; Bhattacharyya, D. Development of fire resistant wool polymer composites: Mechanical performance and fire simulation with design perspectives. Mater. Des. 2016, 106, 391–403. [Google Scholar] [CrossRef]
- Hedskog, B.; Ryber, F. The Classification System for Surface Lining Materials Used in Buildings in Europe and Japan; Report No. 5023; Department of Fire Safety Engineering, Lund University: Lund, Sweden, 1998. [Google Scholar]
- Peças, P.; Carvalho, H.; Salman, H.; Leite, M. Natural Fibre Composites and Their Applications: A Review. J. Compos. Sci. 2018, 2, 66. [Google Scholar] [CrossRef] [Green Version]
- Kandola, B.; Mistik, S.; Pornwannachai, W.; Anand, S. Natural fibre-reinforced thermoplastic composites from woven-nonwoven textile preforms: Mechanical and fire performance study. Compos. Part B Eng. 2018, 153, 456–464. [Google Scholar] [CrossRef]
- Pornwannachai, W.; Ebdon, J.R.; Kandola, B.K. Fire-Resistant Flax—Reinforced Polypropylene/Polylactic Acid Composites with Optimised Fire and Mechanical Performances. J. Thermoplas. Comp. Mater. 2019, 33, 898–914. [Google Scholar] [CrossRef]
- Babrauskas, V. Ignition Handbook; Fire Science Publishers: Washington, DC, USA, 2003. [Google Scholar]
- Shields, T.J.; Silcock, G.W.; Murray, J.J. The effects of geometry and ignition mode on ignition times obtained using a cone calorimeter and ISO ignitability apparatus. Fire Mater. 1993, 17, 25–32. [Google Scholar] [CrossRef]
- Yang, L.; Wang, Y.; Zhou, X.; Dai, J.; Deng, Z. Experimental and numerical study of the effect of sample orientation on the pyrolysis and ignition of wood slabs exposed to radiation. J. Fire Sci. 2012, 30, 211–223. [Google Scholar] [CrossRef]
- Dutta, S.; Kim, N.K.; Das, R.; Bhattacharyya, D. Effects of sample orientation on the fire reaction properties of natural fibre composites. Compos. Part B Eng. 2019, 157, 195–206. [Google Scholar] [CrossRef]
- Kim, N.; Dutta, S.; Bhattacharyya, D. Heat and smoke production of flax fibre reinforced composites under horizontal and vertical orientations. Compos. Part B Eng. 2019, 178, 107467. [Google Scholar] [CrossRef]
- McGrattan, K.; Hostikka, S.; Floyd, J.; Baum, H.; Rehm, R.; Mell, W.; McDermott, R. Fire Dynamics Simulator (Version 5) Technical Reference Guide; Report No. NIST.SP.1018; National Institute of Standards and Technology: Gaithersburg, MD, USA, 2010. [Google Scholar]
- Chen, X.; Zhou, Z.; Li, P.; Zhou, D.; Wang, J. Effects of sample orientation on pyrolysis and piloted ignition of wood. J. Fire Sci. 2014, 32, 483–497. [Google Scholar] [CrossRef]
- McGrattan, K.; Hostikka, S.; Floyd, J. Fire Dynamics Simulator (Version 5) User’s Guide; Report No. NIST.SP.1019; National Institute of Standards and Technology: Gaithersburg, MD, USA, 2010. [Google Scholar]
- Delichatsios, M.; Paroz, B.; Bhargava, A. Flammability properties for charring materials. Fire Saf. J. 2003, 38, 219–228. [Google Scholar] [CrossRef]
- Peng, F.; Zhou, X.D.; Zhao, K.; Wu, Z.B.; Yang, L.Z. Experimental and numerical study on effect of sample orientation on auto-ignition and piloted ignition of poly(methyl methaacrylate). Materials 2015, 8, 4004–4021. [Google Scholar] [CrossRef] [Green Version]
- Tzeng, L.; Atreya, A.; Wichman, I.S. A one-dimensional model of piloted ignition. Combust. Flame 1990, 80, 94–107. [Google Scholar] [CrossRef]
- Yang, L.; Chen, X.; Zhou, X.; Fan, W. The pyrolysis and ignition of charring materials under an external heat flux. Combust. Flame 2003, 133, 407–413. [Google Scholar] [CrossRef]
- Schartel, B.; Bartholmai, M.; Knoll, U. Some comments on the main fire retardancy mechanisms in polymer nanocomposites. Polym. Adv. Technol. 2006, 17, 772–777. [Google Scholar] [CrossRef]


| Orientation | 0° | 15° | 30° | 45° | 60° | 75° | 90° |
|---|---|---|---|---|---|---|---|
| gx | 0 | −2.539 | −4.905 | −6.937 | −8.496 | −9.476 | −9.81 |
| gz | −9.81 | −9.476 | −8.496 | −6.937 | −4.905 | −2.539 | 0 |
| Angle (α) | Experiment | Simulation | ||||||
|---|---|---|---|---|---|---|---|---|
| a | b | R2 | a | b | R2 | Exp. | Sim. | |
| 0° | 0.0053 | 0.0463 | 0.99 | 0.0027 | 0.0249 | 0.96 | 8.75 | 9.25 |
| 15° | 0.0052 | 0.0821 | 0.96 | 0.0027 | 0.0382 | 0.99 | 15.80 | 14.15 |
| 30° | 0.0025 | 0.0542 | 0.91 | 0.0021 | 0.0359 | 0.99 | 21.70 | 17.12 |
| 45° | 0.0076 | 0.1858 | 0.94 | 0.0027 | 0.0560 | 0.87 | 24.45 | 20.75 |
Publisher’s Note: MDPI stays neutral with regard to jurisdictional claims in published maps and institutional affiliations. |
© 2021 by the authors. Licensee MDPI, Basel, Switzerland. This article is an open access article distributed under the terms and conditions of the Creative Commons Attribution (CC BY) license (https://creativecommons.org/licenses/by/4.0/).
Share and Cite
Dutta, S.; Kim, N.K.; Das, R.; Bhattacharyya, D. Evaluating Orientation Effects on the Fire Reaction Properties of Flax-Polypropylene Composites. Polymers 2021, 13, 2586. https://doi.org/10.3390/polym13162586
Dutta S, Kim NK, Das R, Bhattacharyya D. Evaluating Orientation Effects on the Fire Reaction Properties of Flax-Polypropylene Composites. Polymers. 2021; 13(16):2586. https://doi.org/10.3390/polym13162586
Chicago/Turabian StyleDutta, Swagata, Nam Kyeun Kim, Raj Das, and Debes Bhattacharyya. 2021. "Evaluating Orientation Effects on the Fire Reaction Properties of Flax-Polypropylene Composites" Polymers 13, no. 16: 2586. https://doi.org/10.3390/polym13162586
APA StyleDutta, S., Kim, N. K., Das, R., & Bhattacharyya, D. (2021). Evaluating Orientation Effects on the Fire Reaction Properties of Flax-Polypropylene Composites. Polymers, 13(16), 2586. https://doi.org/10.3390/polym13162586