
Investigation on the Durability of E-Glass/Epoxy Composite Exposed to Seawater at Elevated Temperature


 ,
, 

Abstract
:
1. Introduction
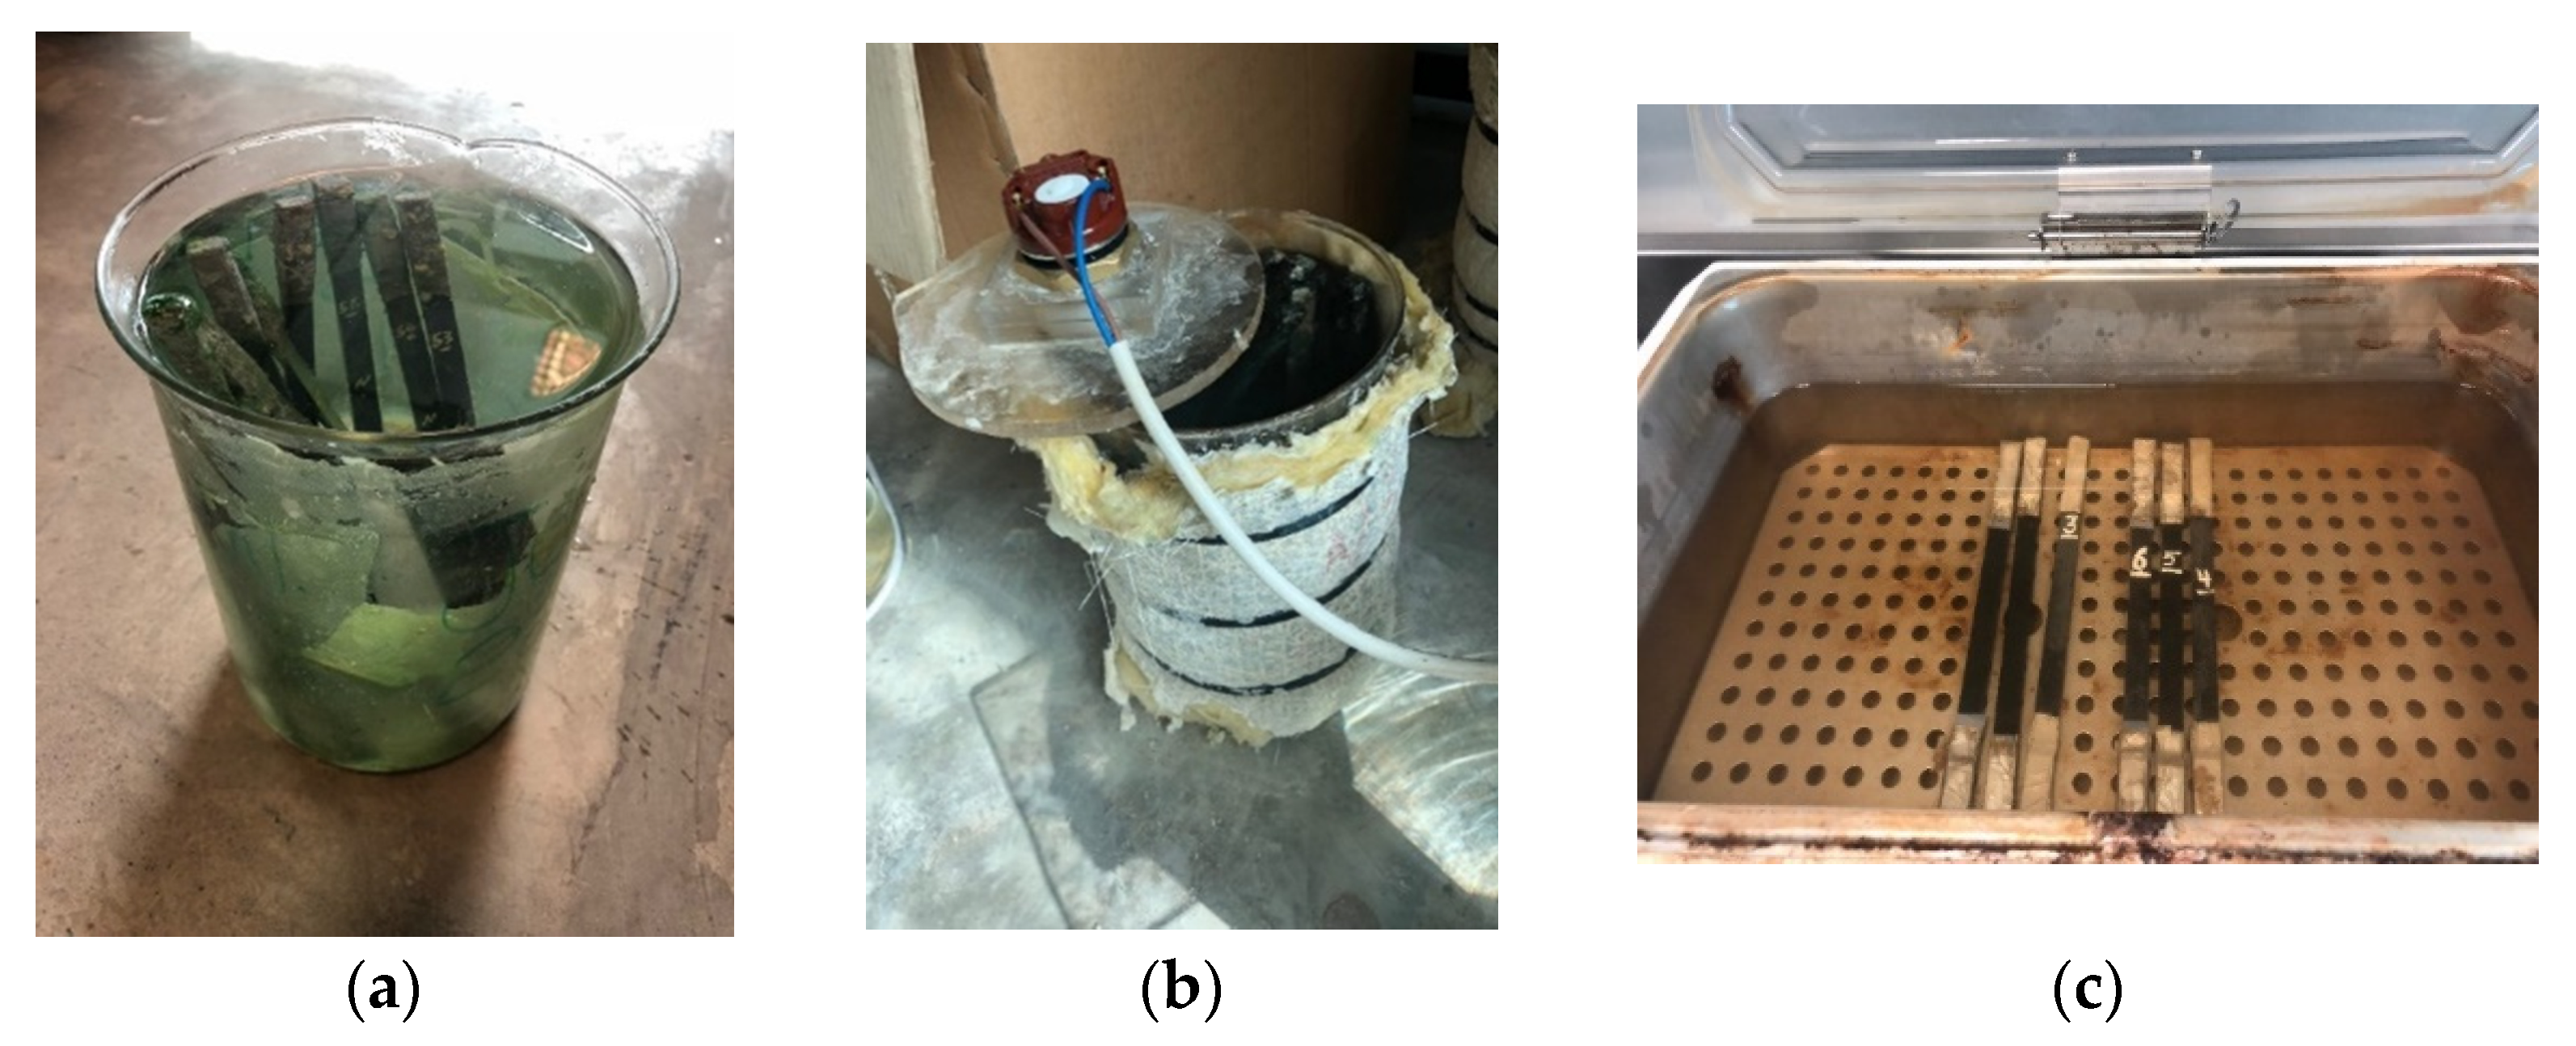
2. Experimentation
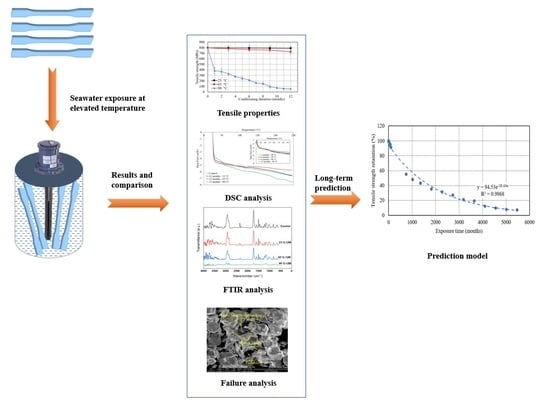
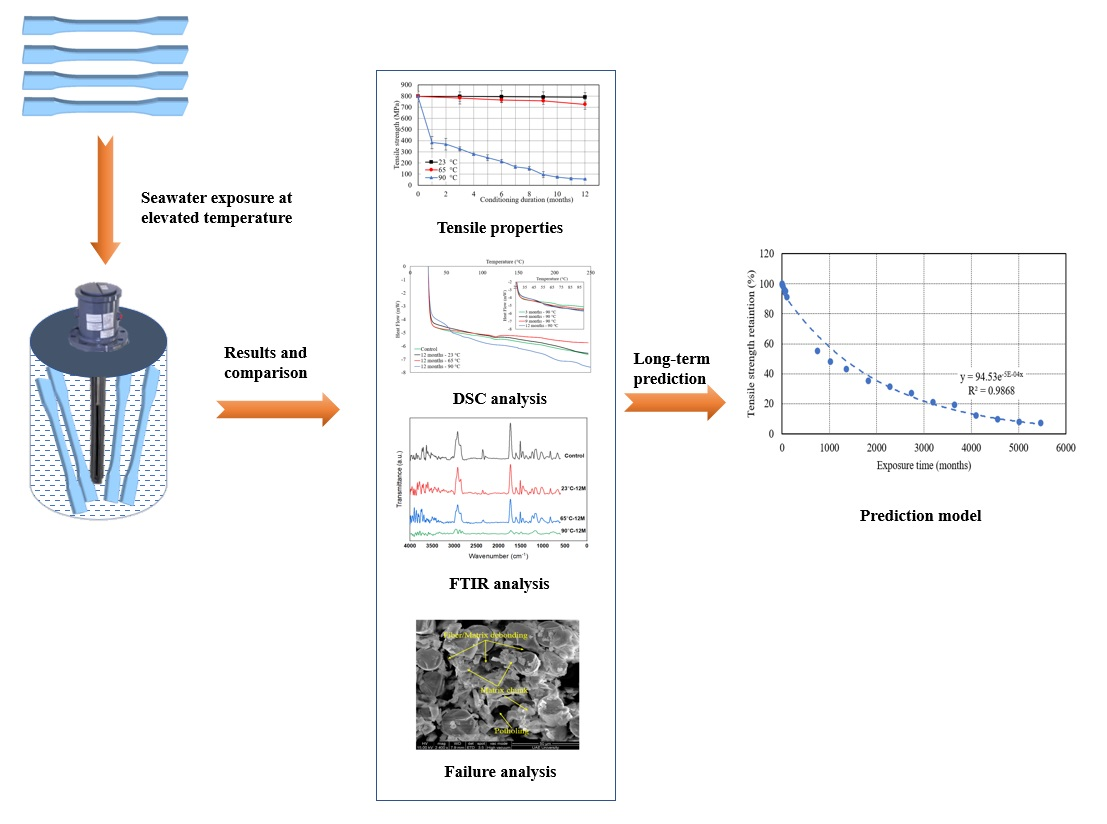
3. Results and Discussion
3.1. Water Absorption Test
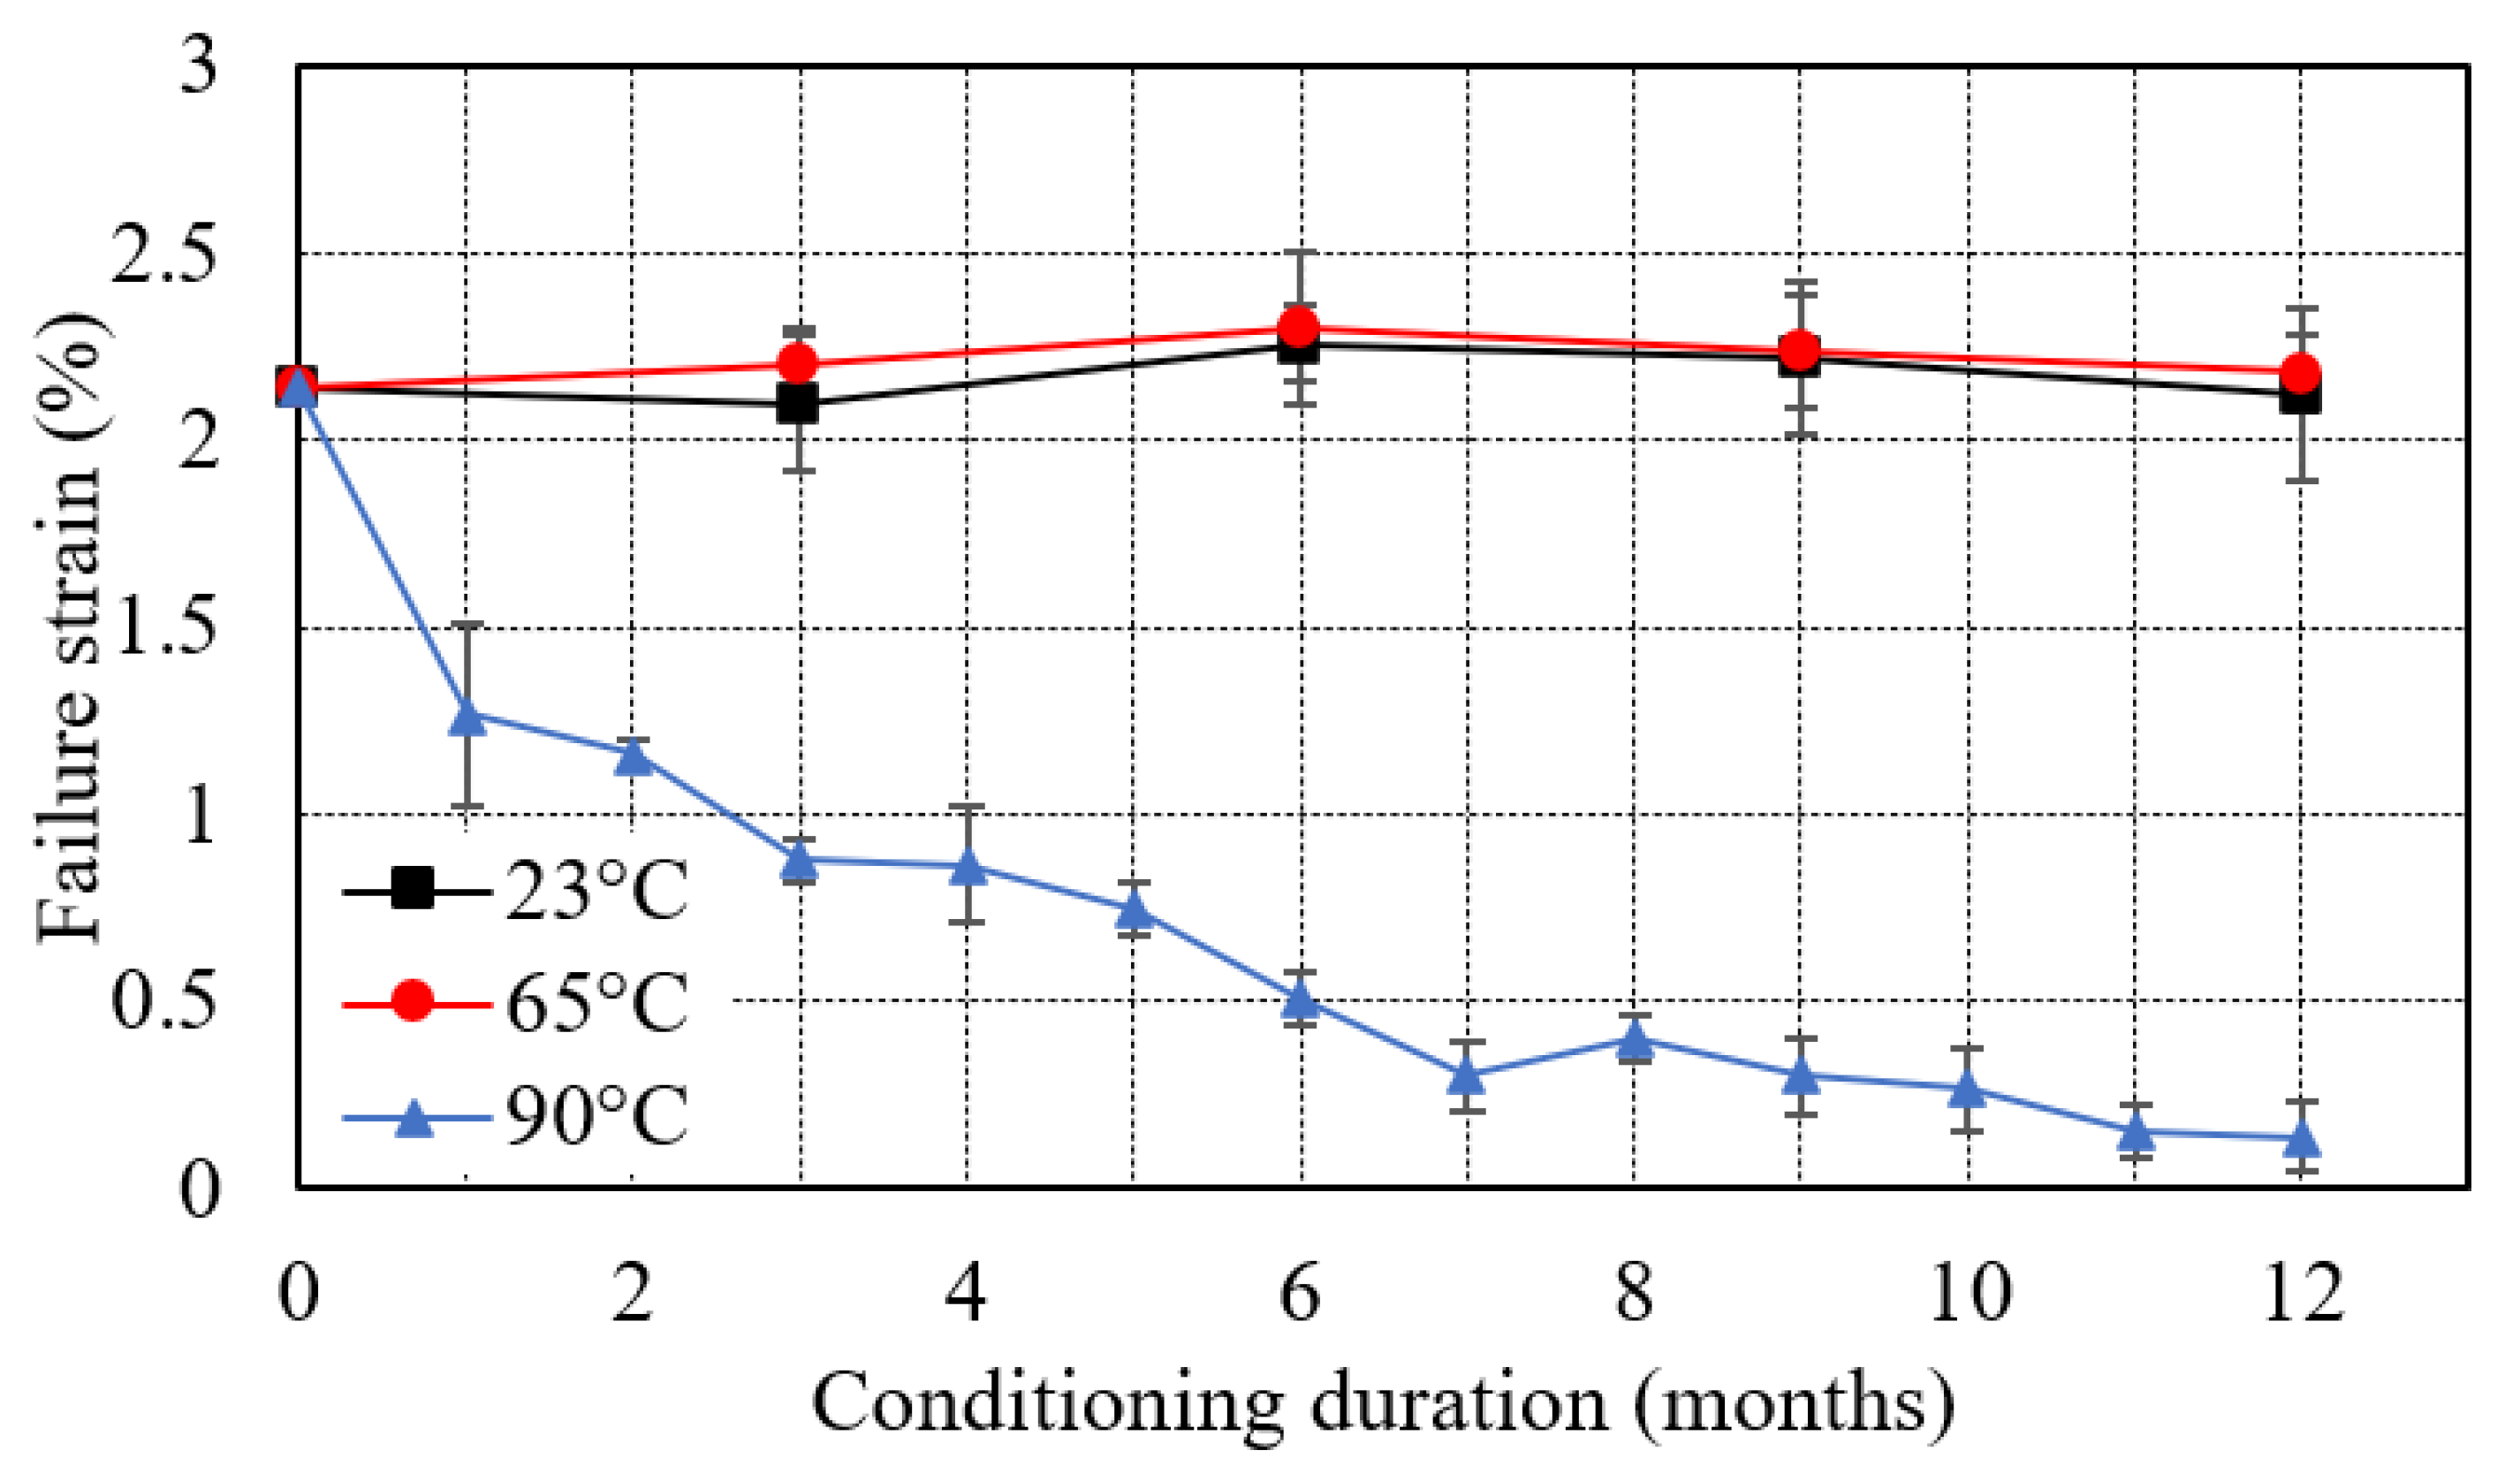
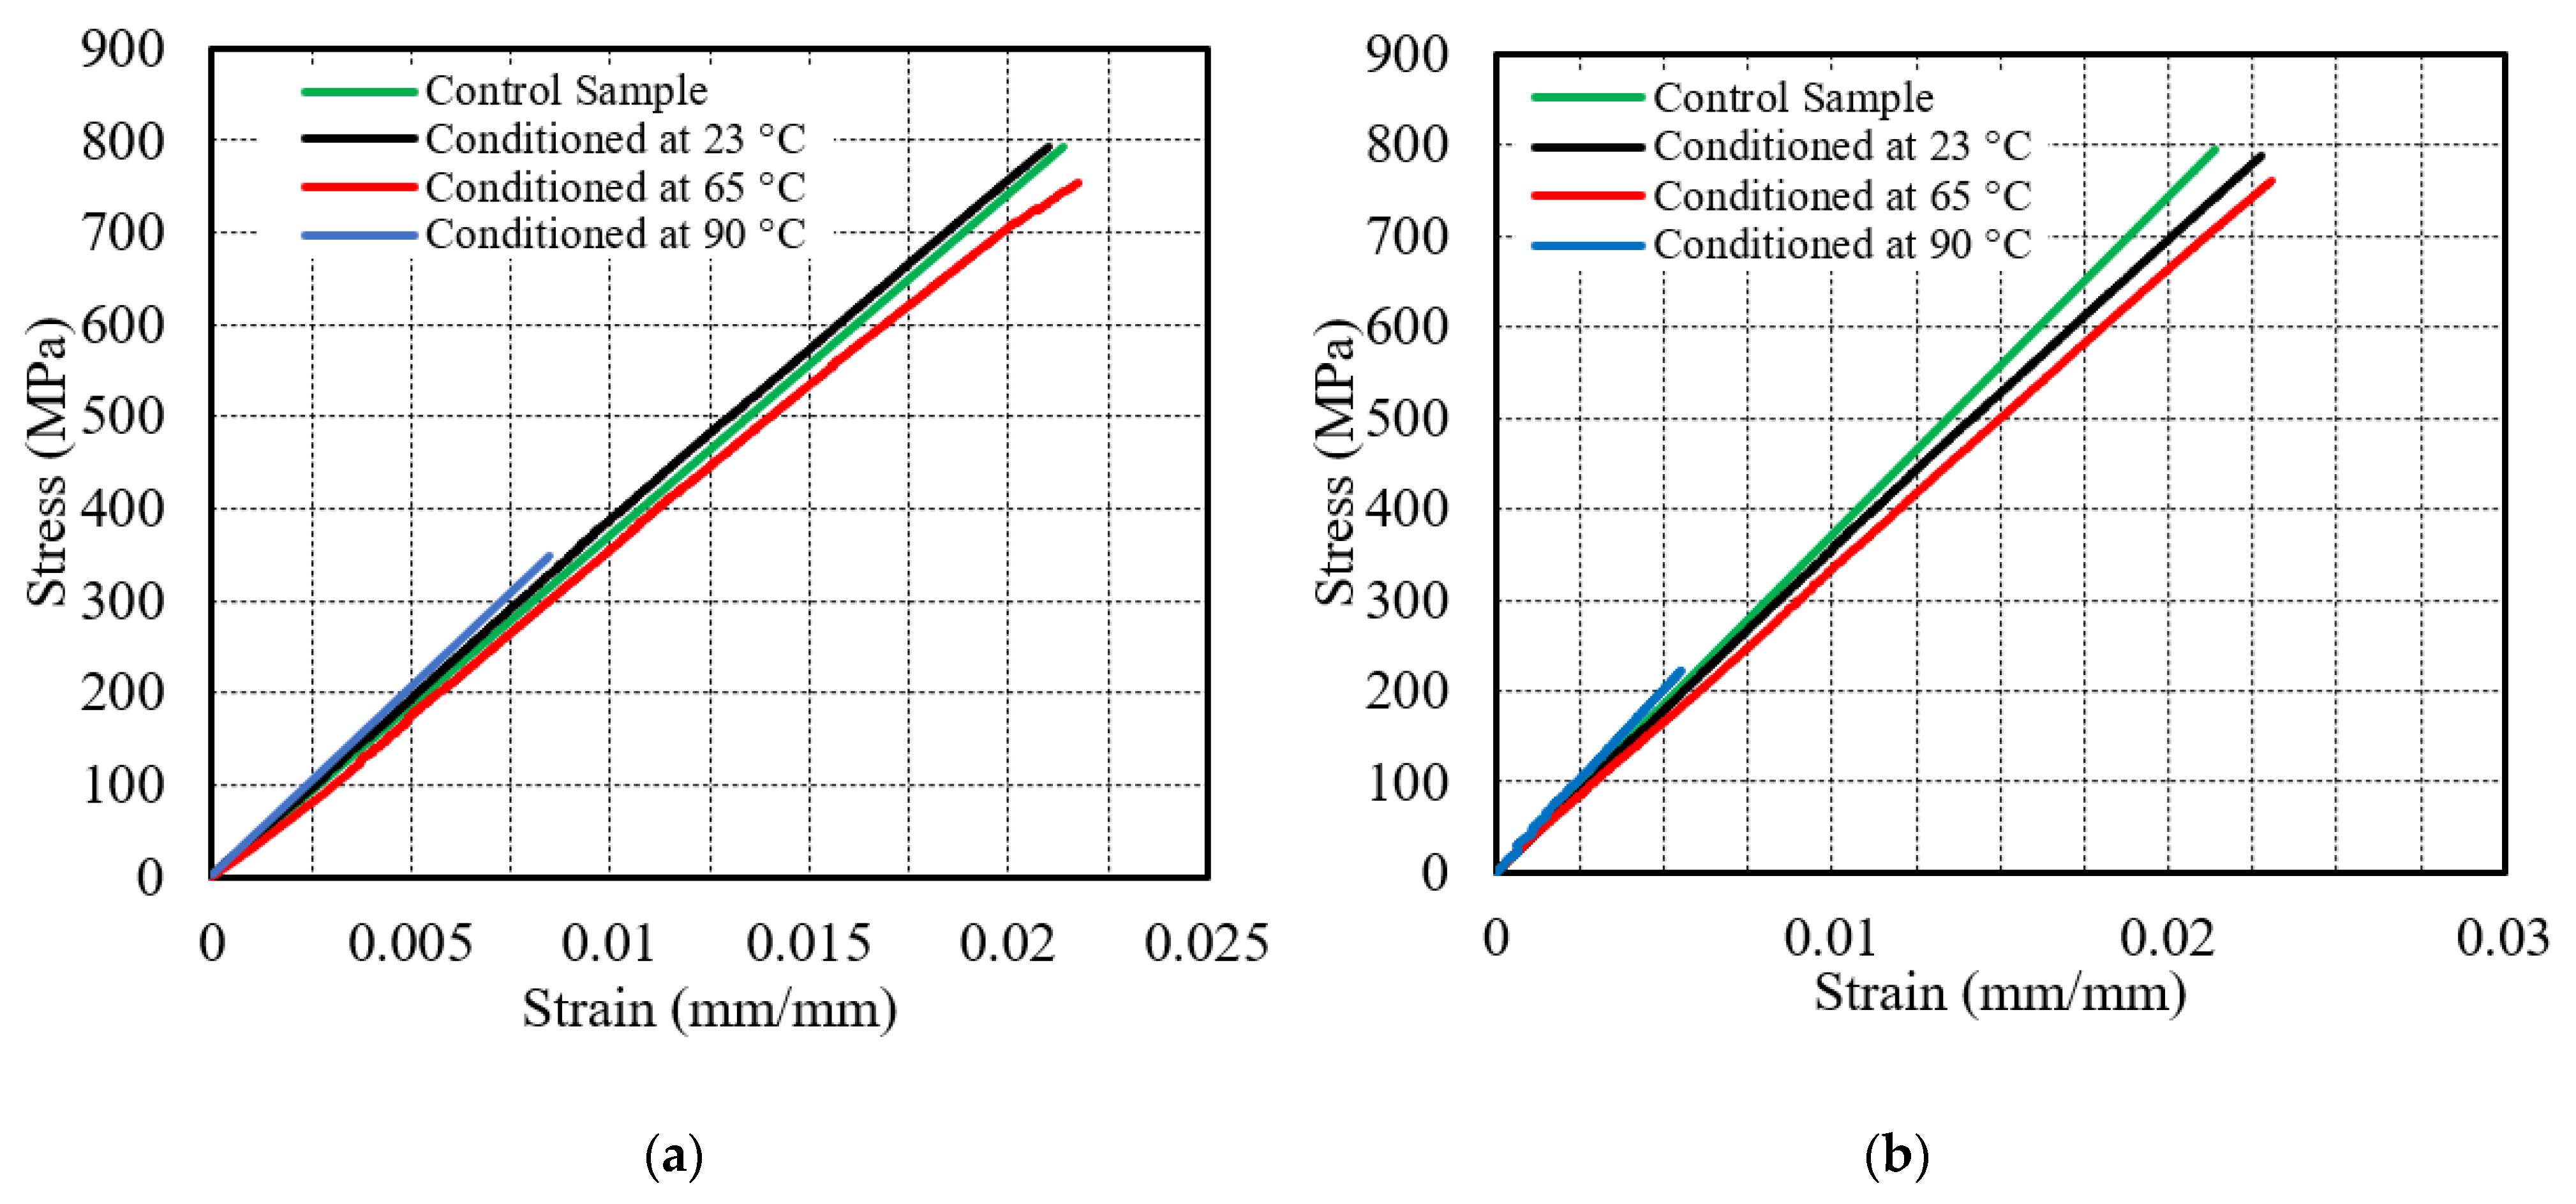
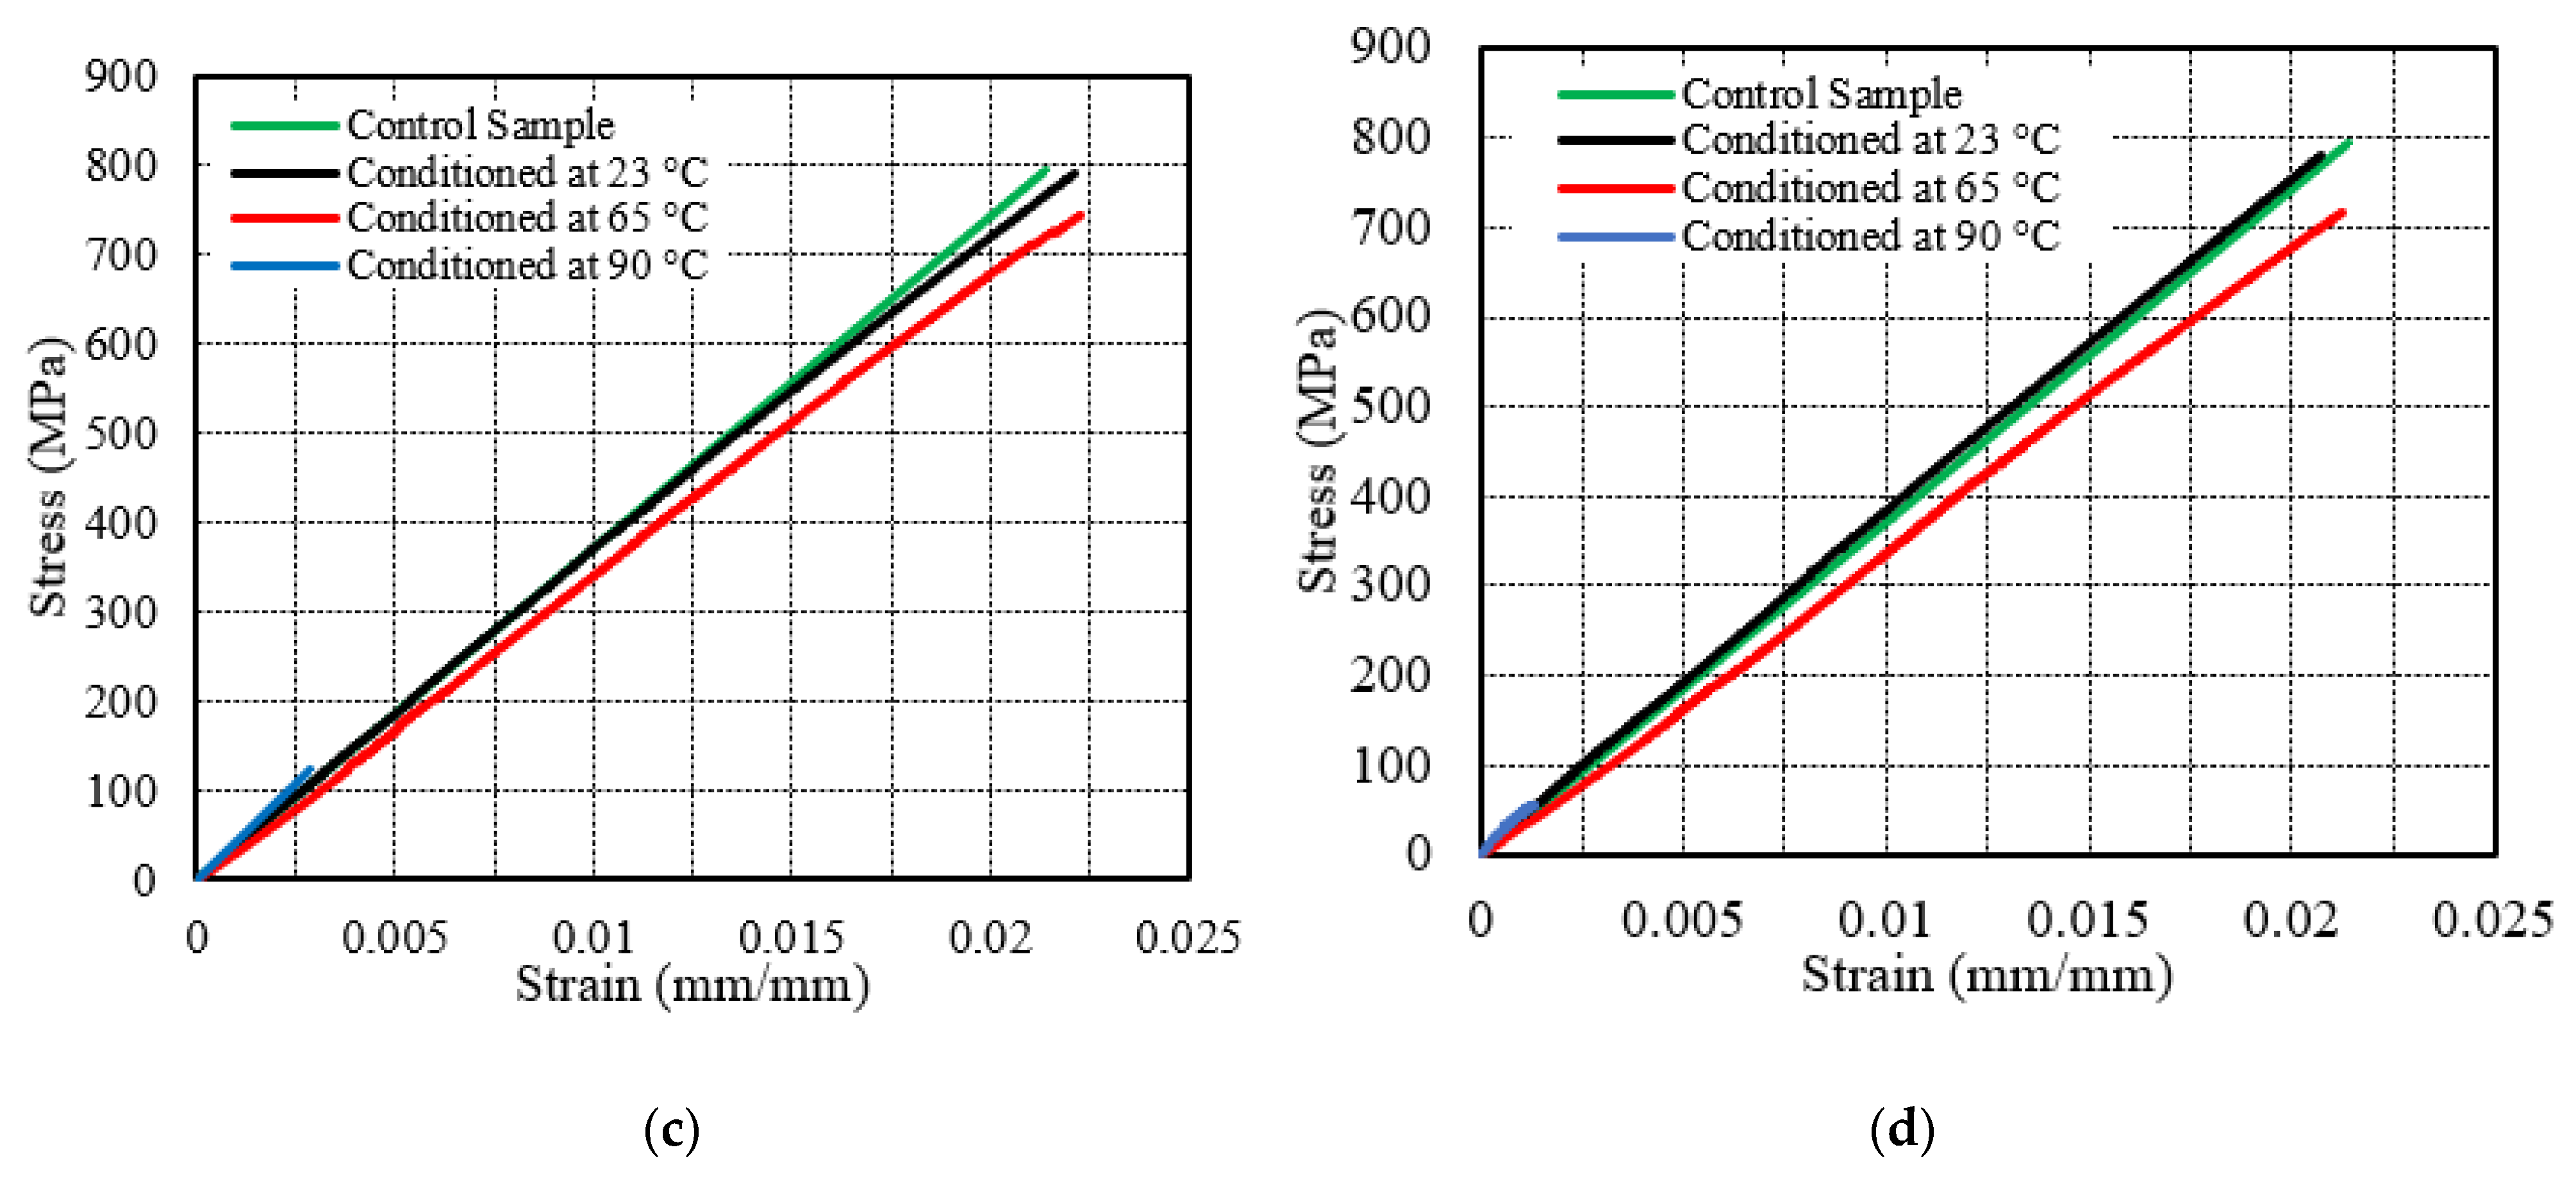
3.2. Tensile Properties
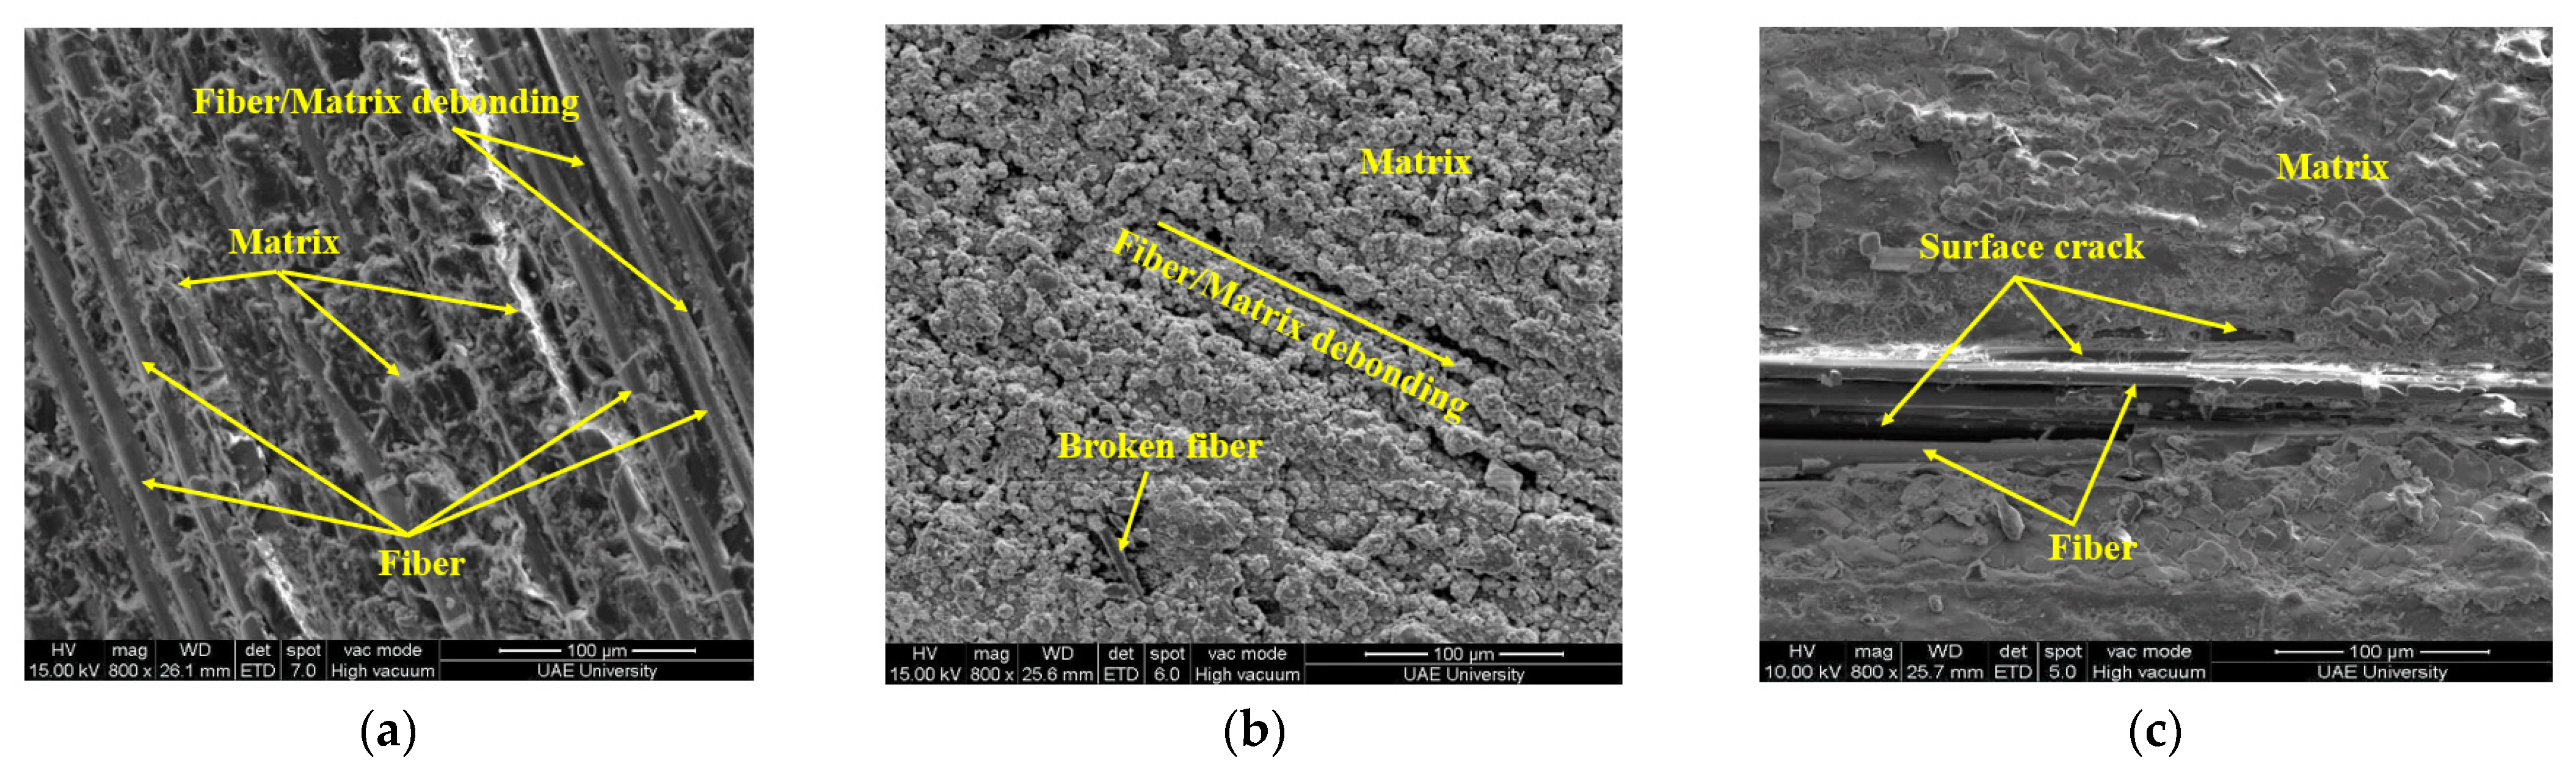
3.3. SEM Analysis
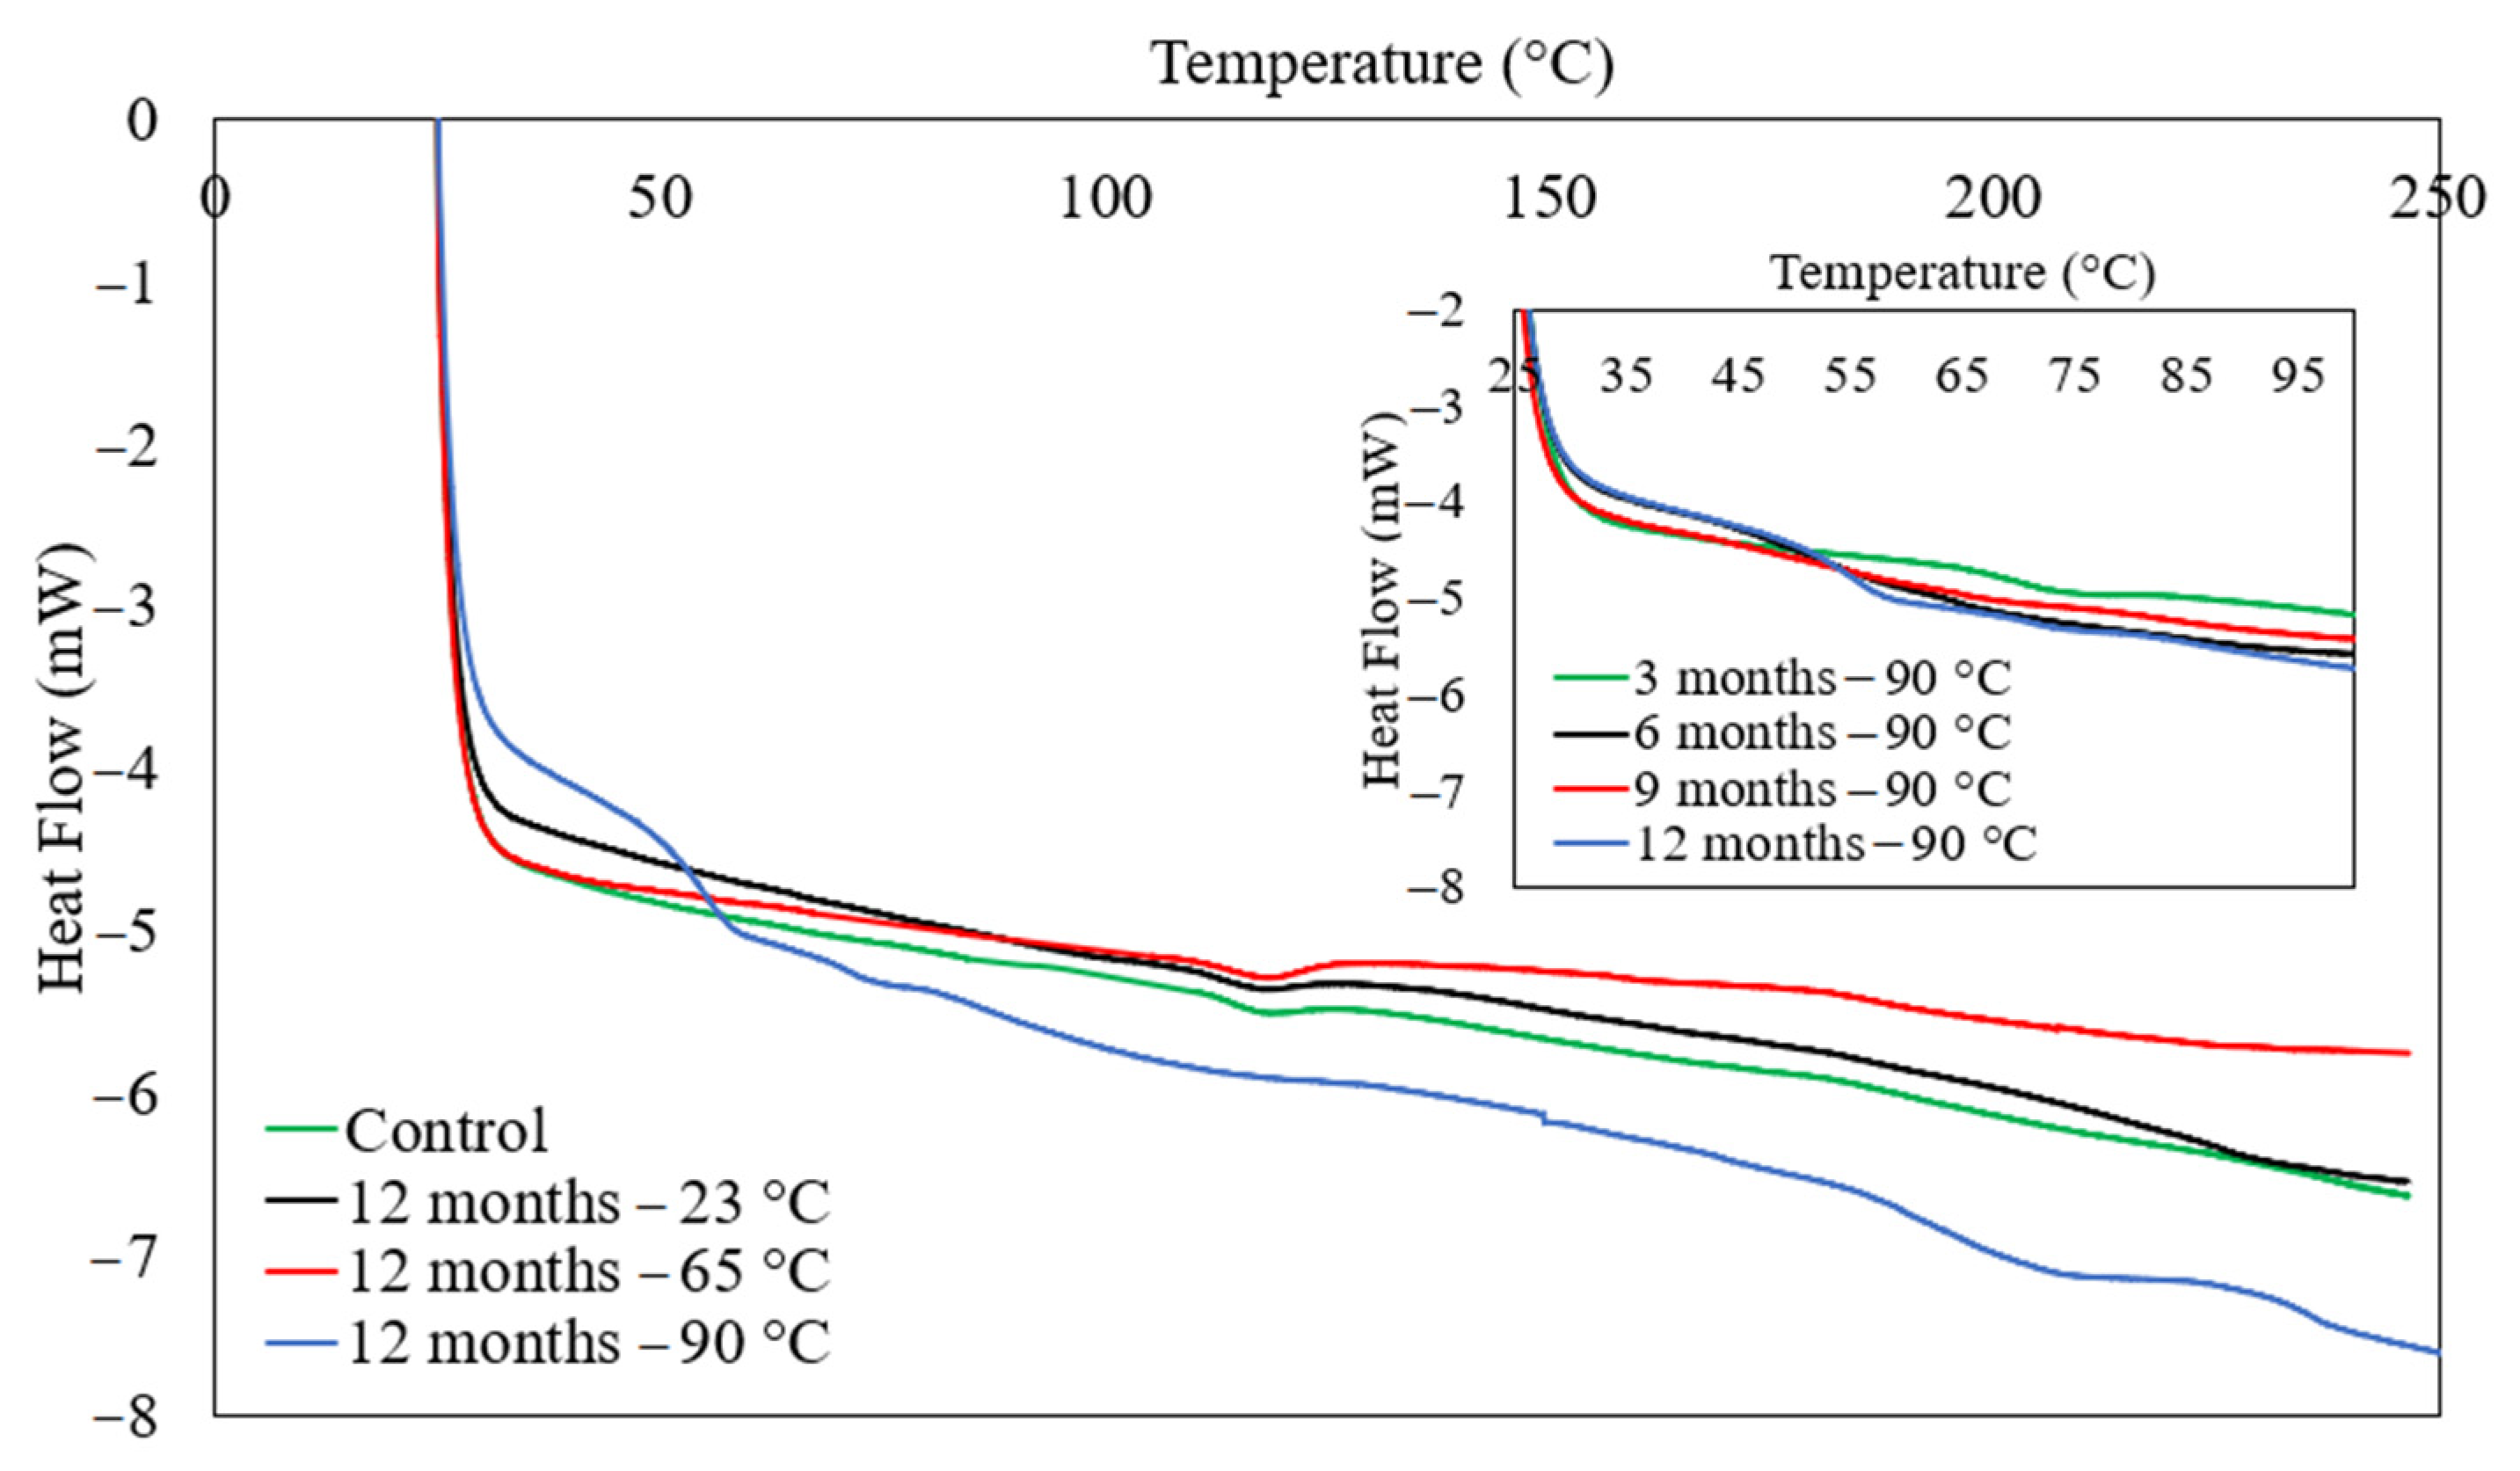
3.4. Differential Scanning Calorimetry (DSC) Test
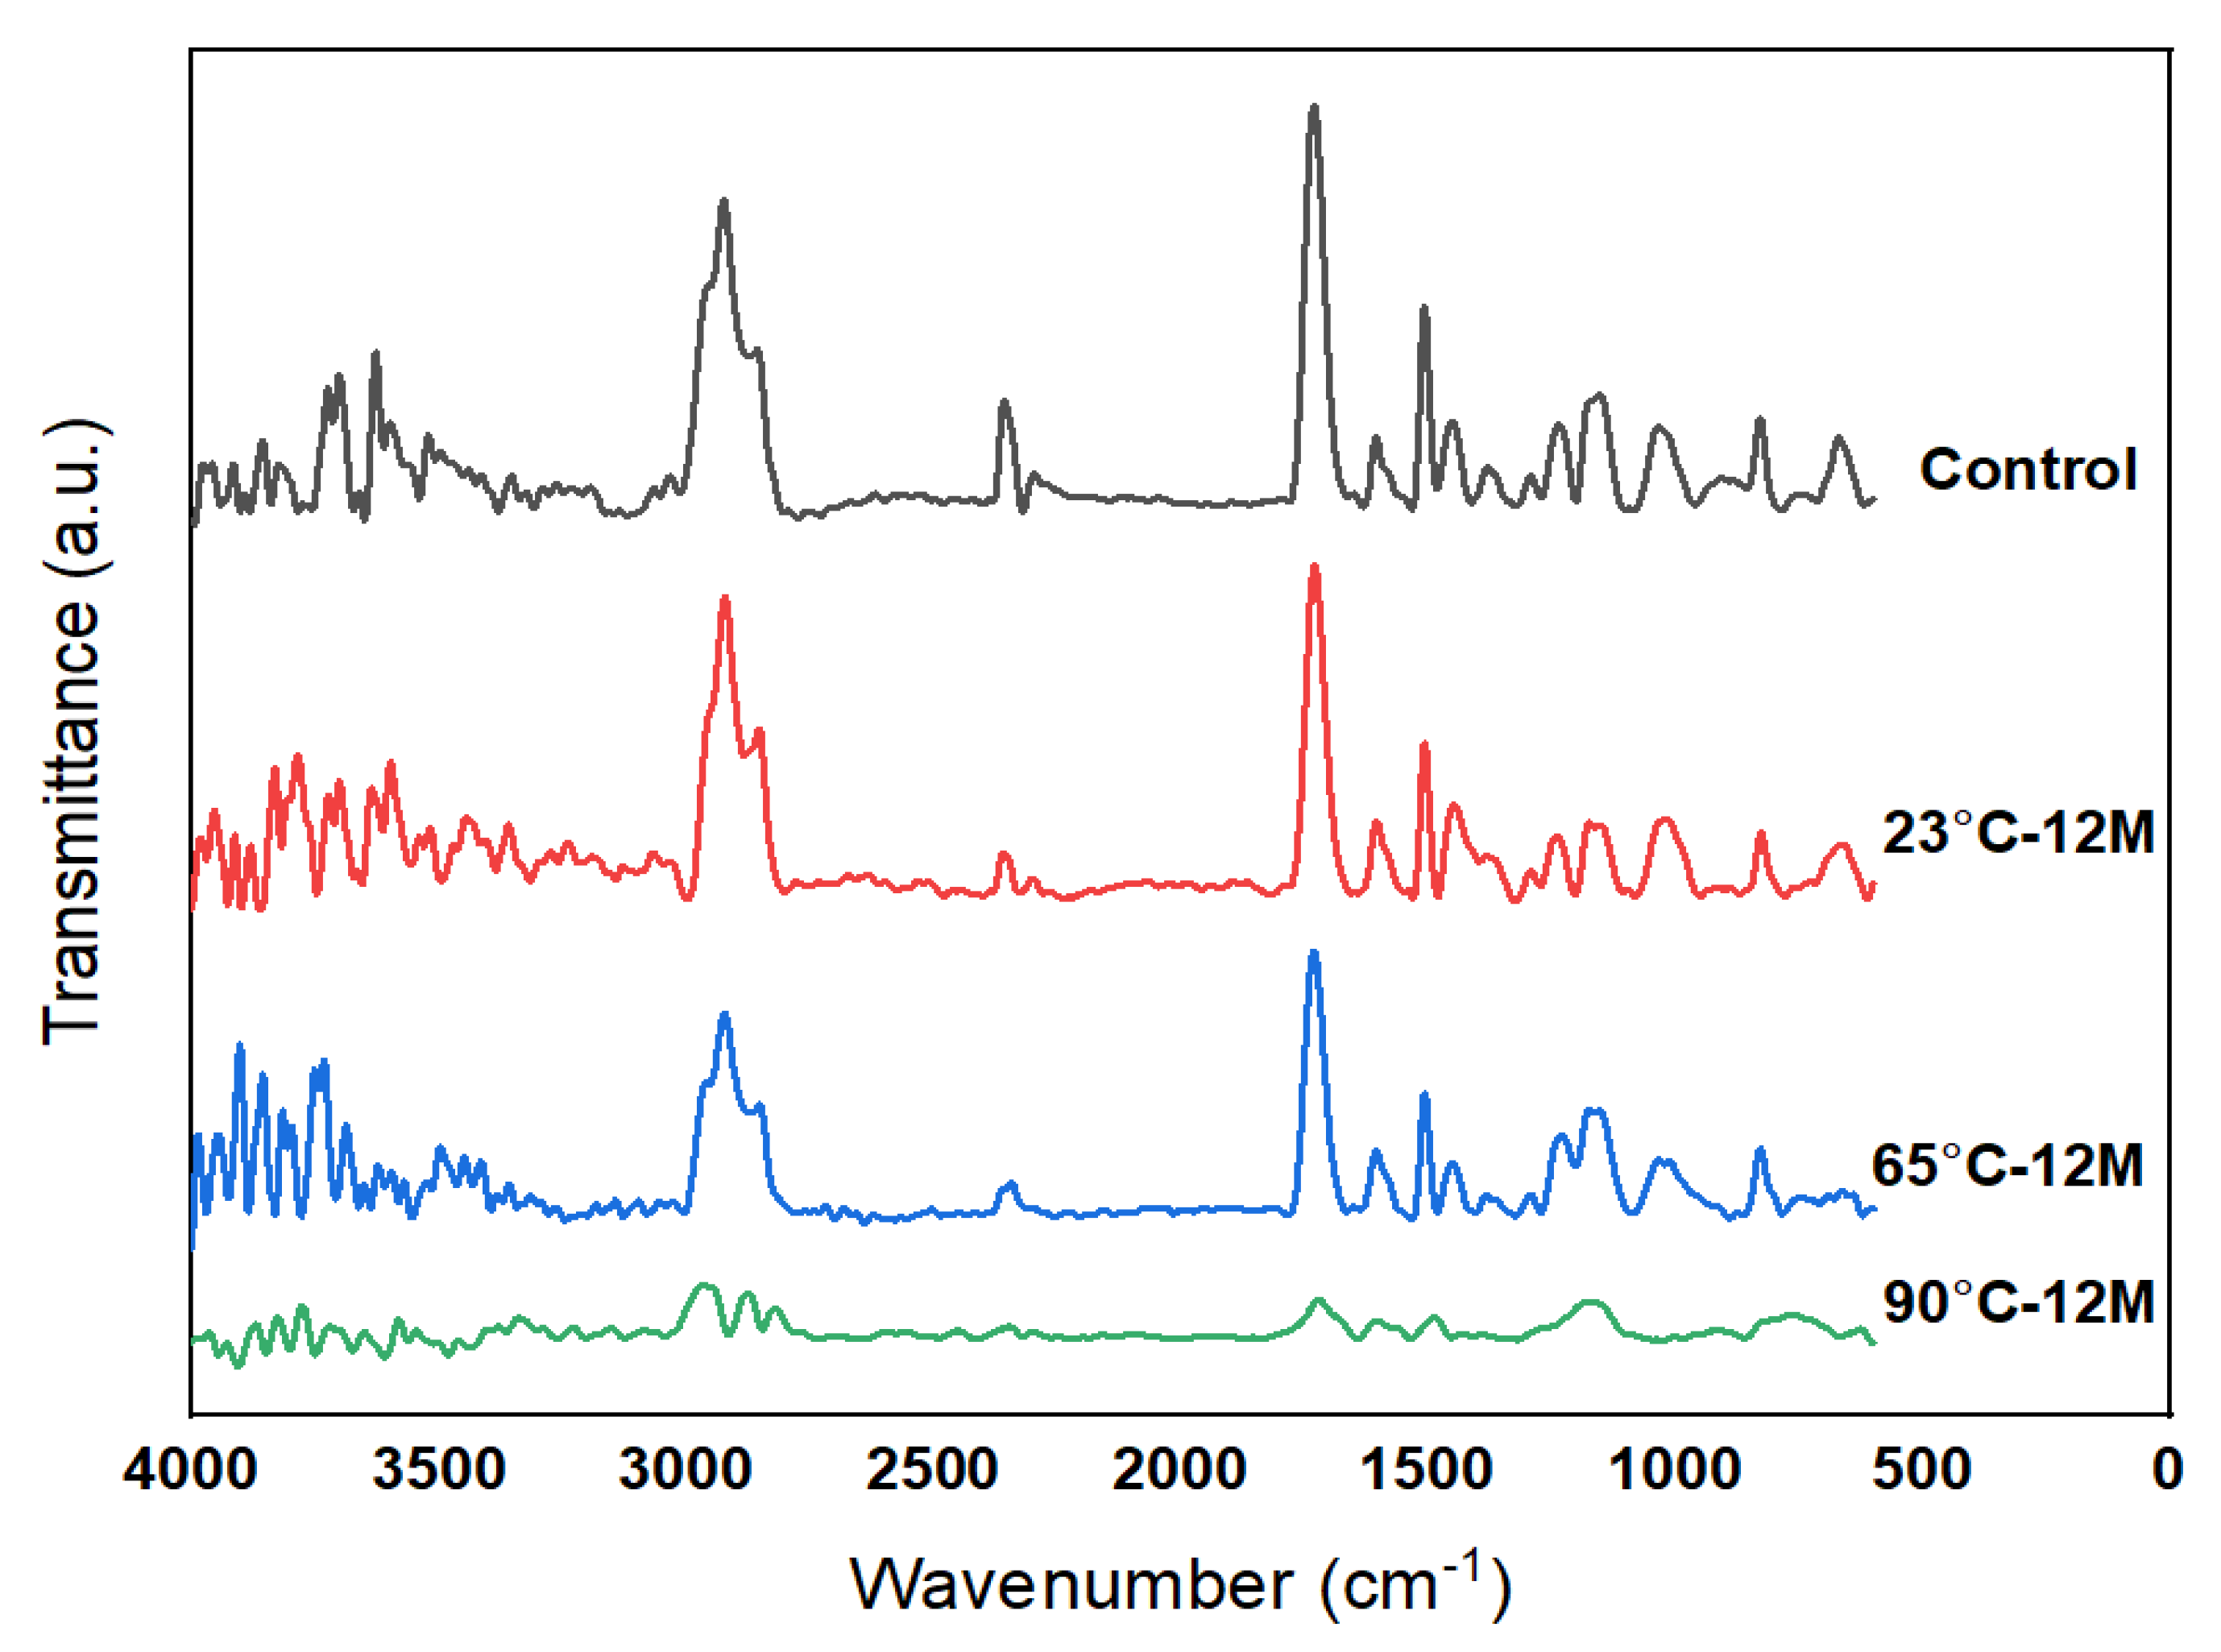
3.5. FTIR Results
4. Prediction
5. Conclusions
- (1)
- The mass of the specimen increased by 2.5% and 5% after the immersion of 12 months at 23 °C and 65 °C respectively. An opposite tendency was observed for the specimen immersed at 90 °C in which the mass of the sample reduced by 12.7% for the same immersion period.
- (2)
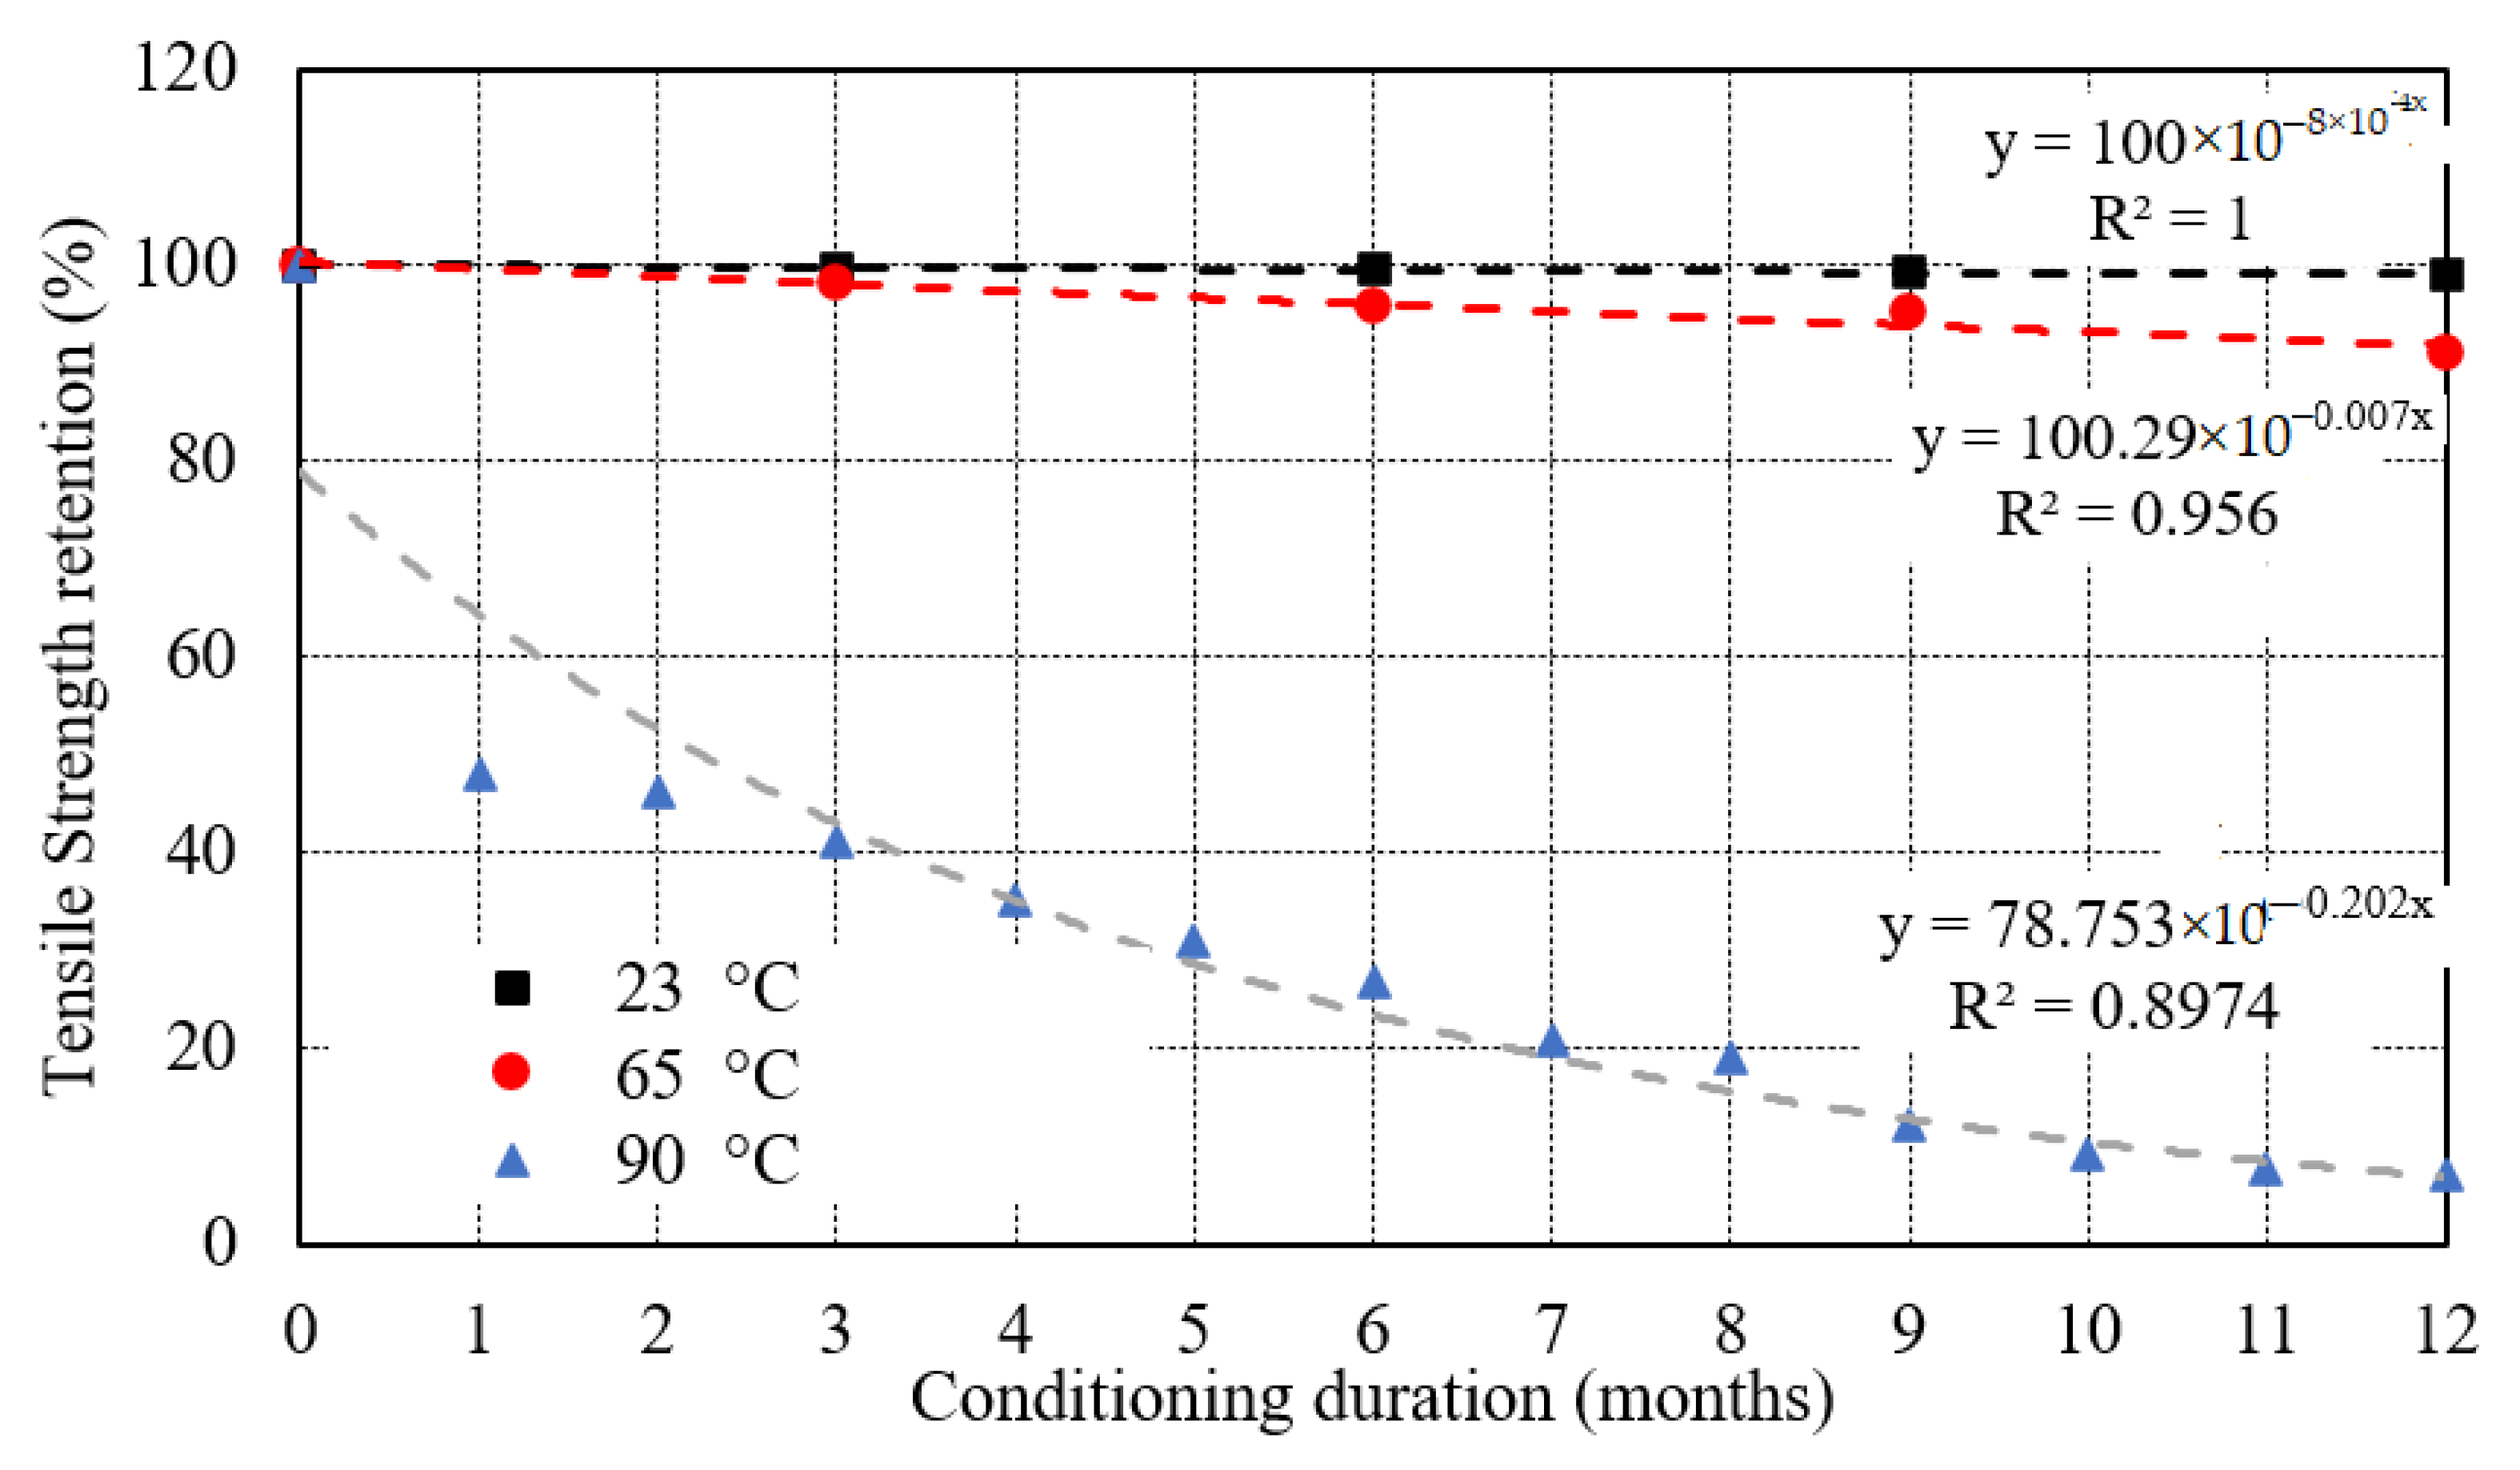
- The tensile strength reduced by 1% and 9% after immersion of 12 months at 23 °C and 65 °C respectively. The durability of the composite was significantly affected at at 90 °C and tensile strength was reduced to 48.4% in 1 month.
- (3)
- Slight variation in the tensile modulus observed for specimen immersed at 23 °C and 65 °C where it increased significantly at 90 °C. However, the failure strain slightly increased for specimens at 23 °C and 65 °C but it decreased drastically for the immersion at 90 °C.
- (4)
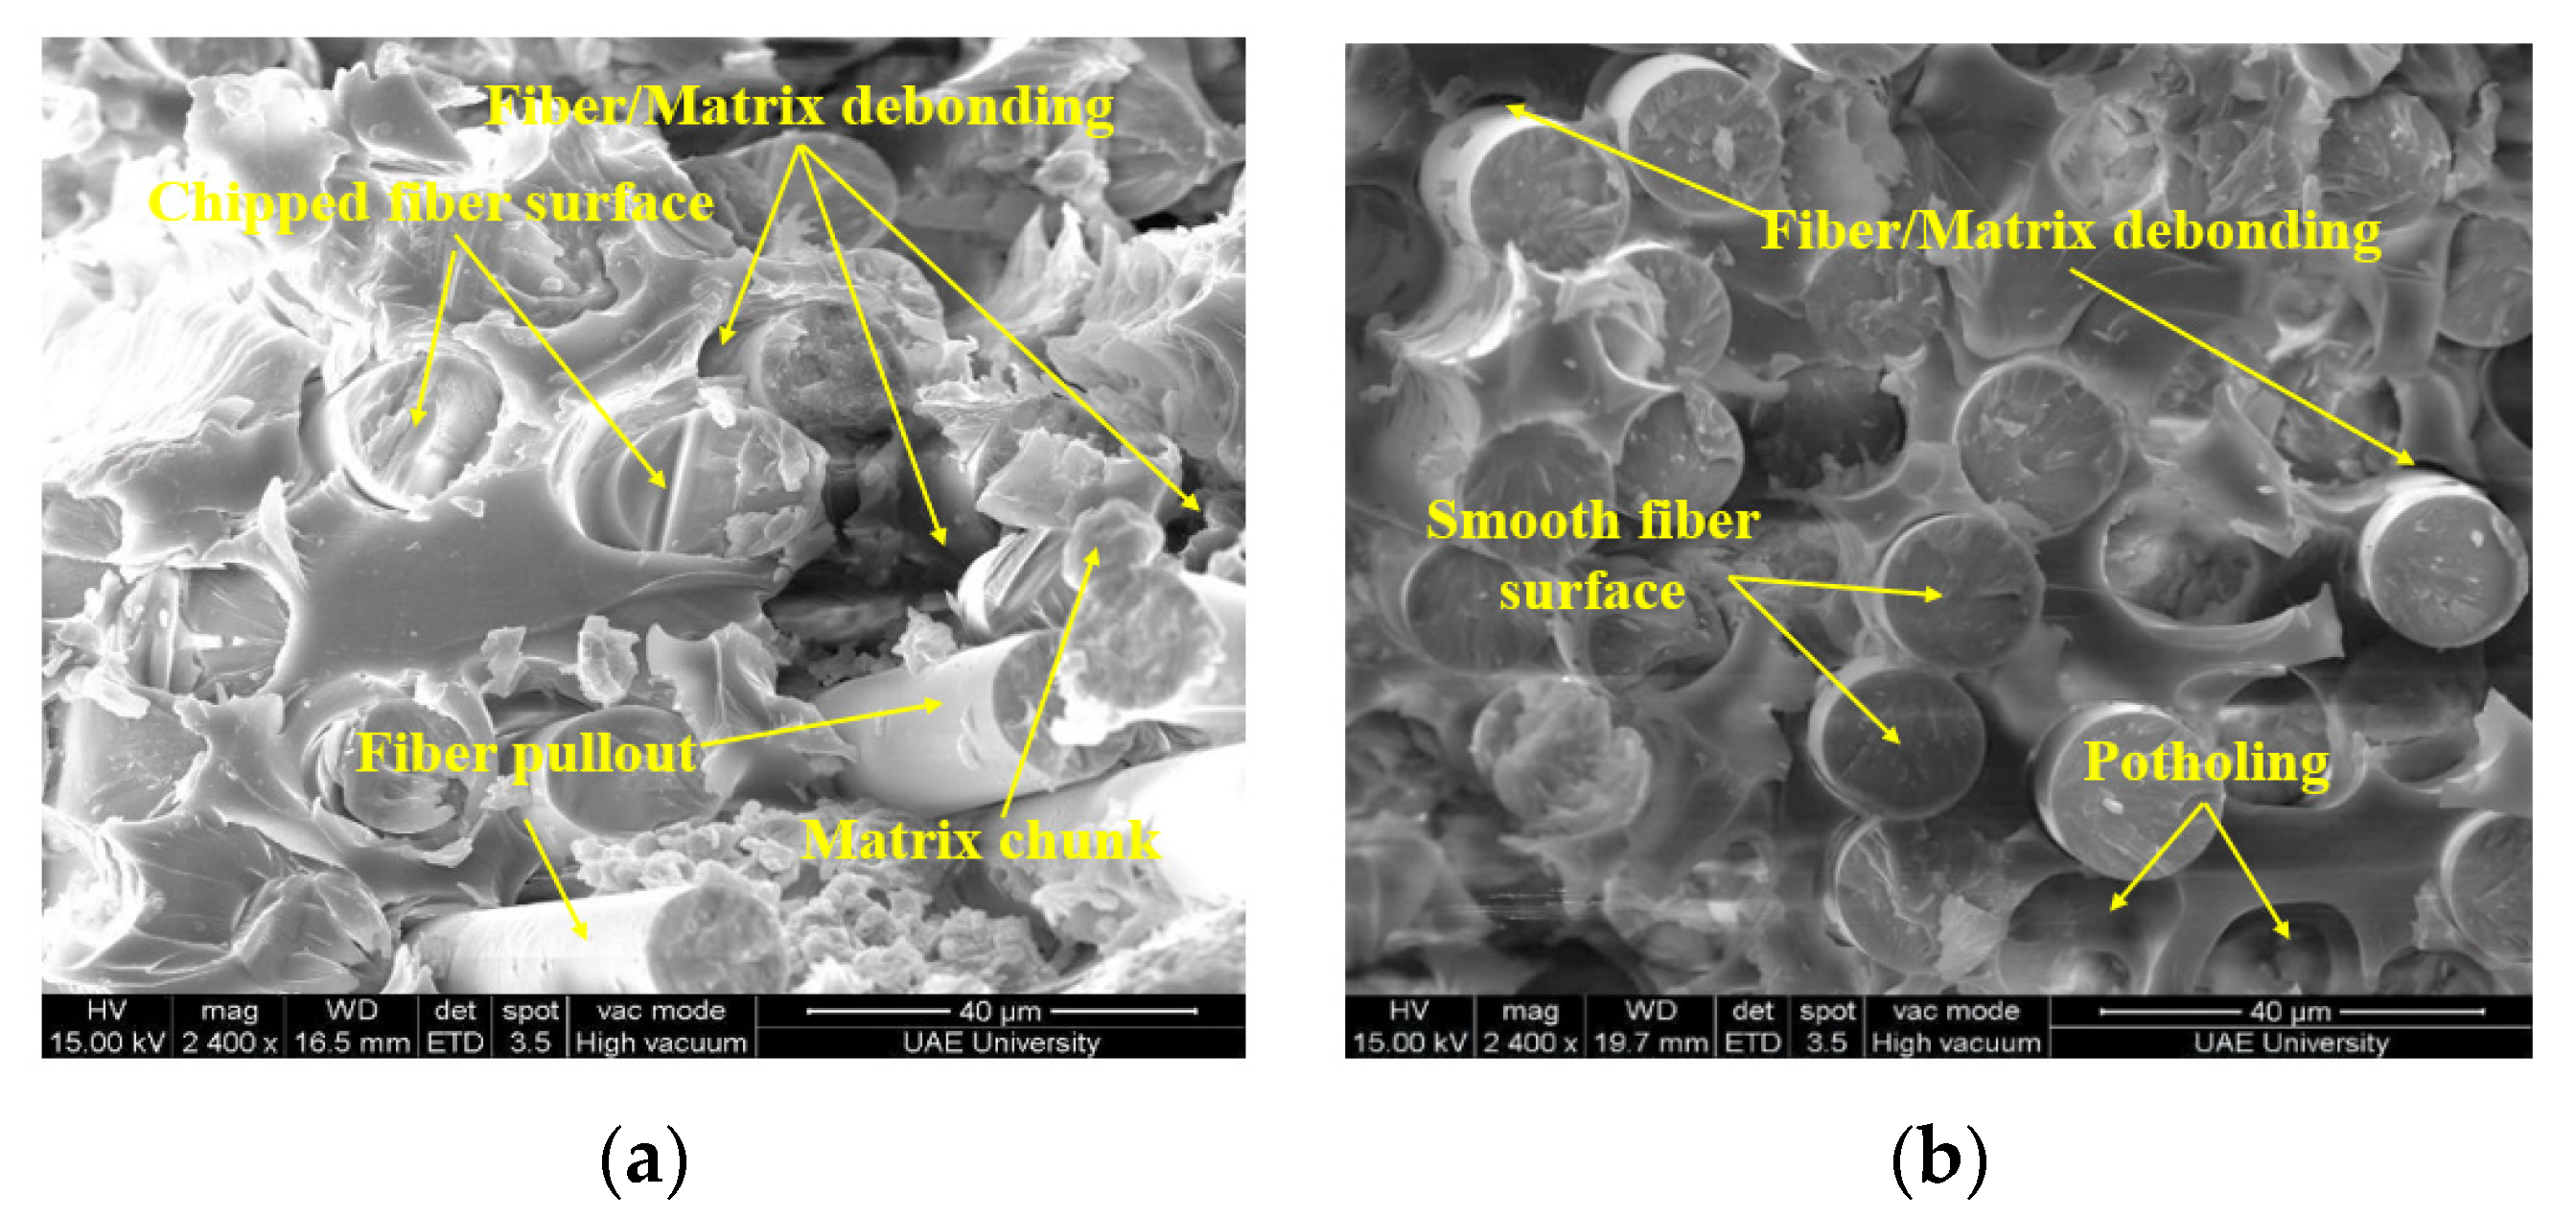
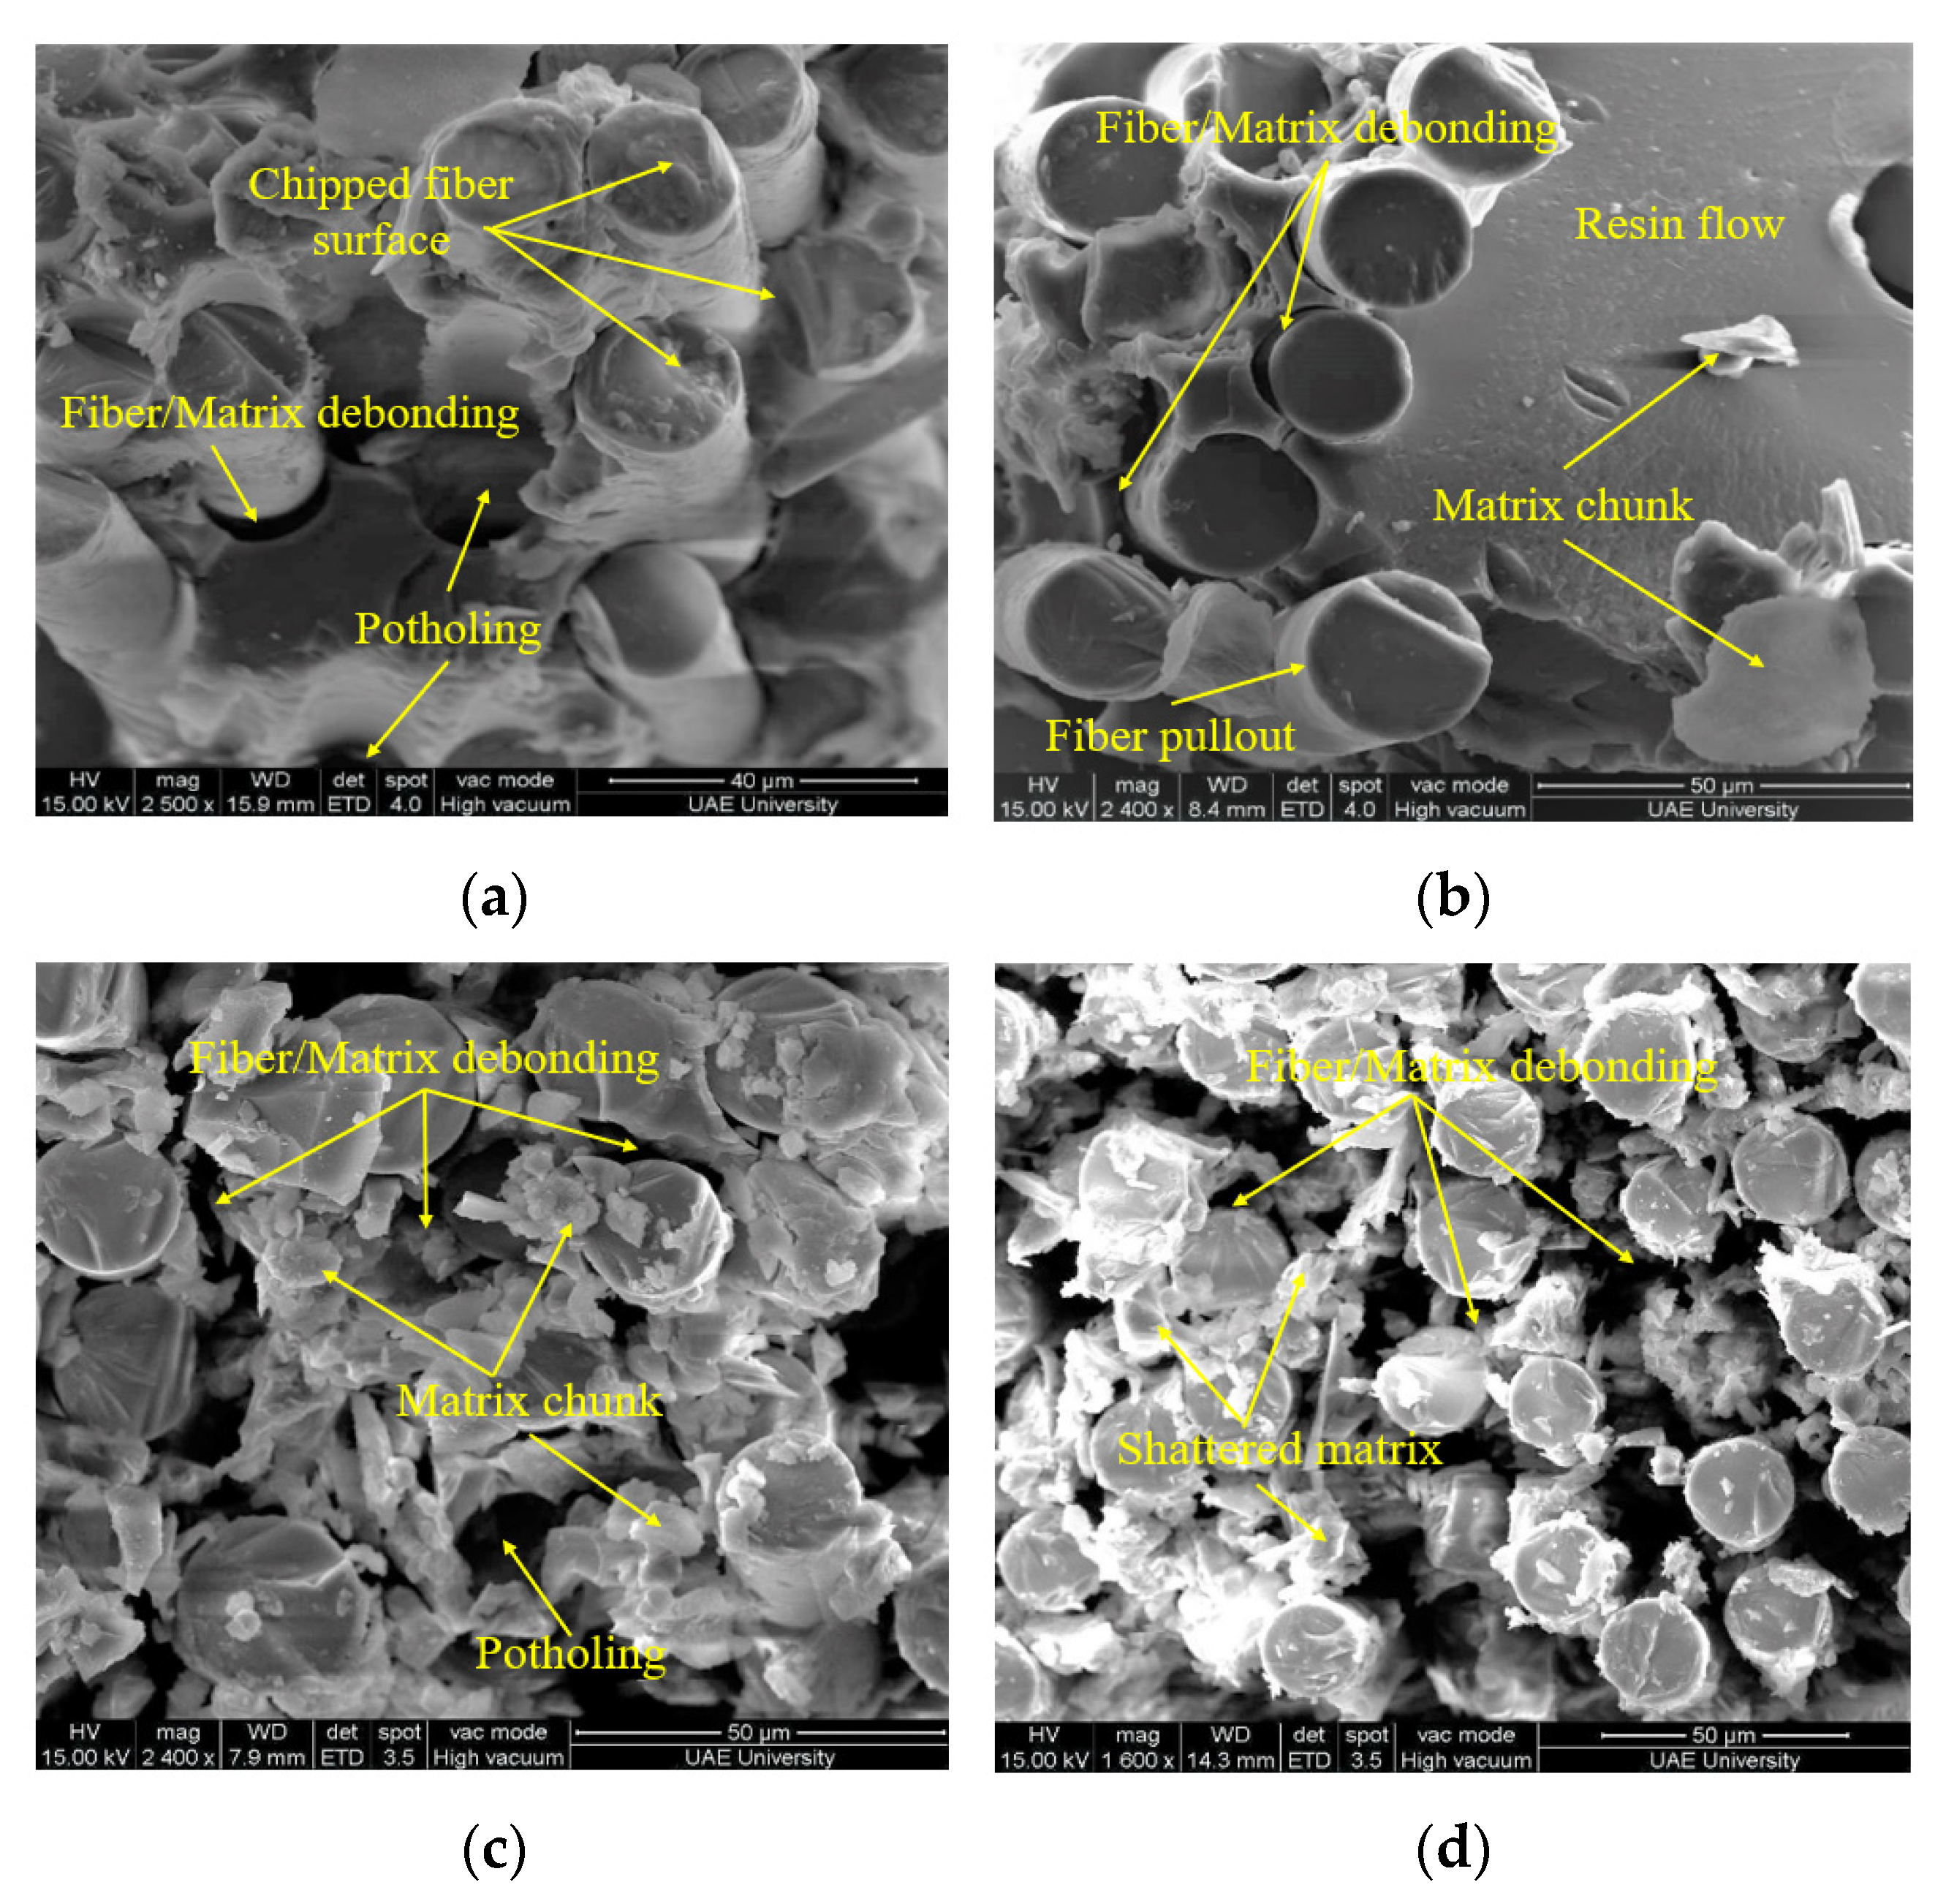
- SEM micrographs indicate fiber/matrix debonding, potholing, fiber pull-out and matrix cracking which indicates deterioration in the tensile properties of the composite. The deterioration mainly owes to breakage of chemical bonding between fiber and resin due to chemical corrosion, and poor interlocking between fibers and resin due to resin swelling through water absorption especially at 90 °C immersion, mainly from the hydrolysis of resin, which was also evidenced by the DSC and FTIR results.
- (5)
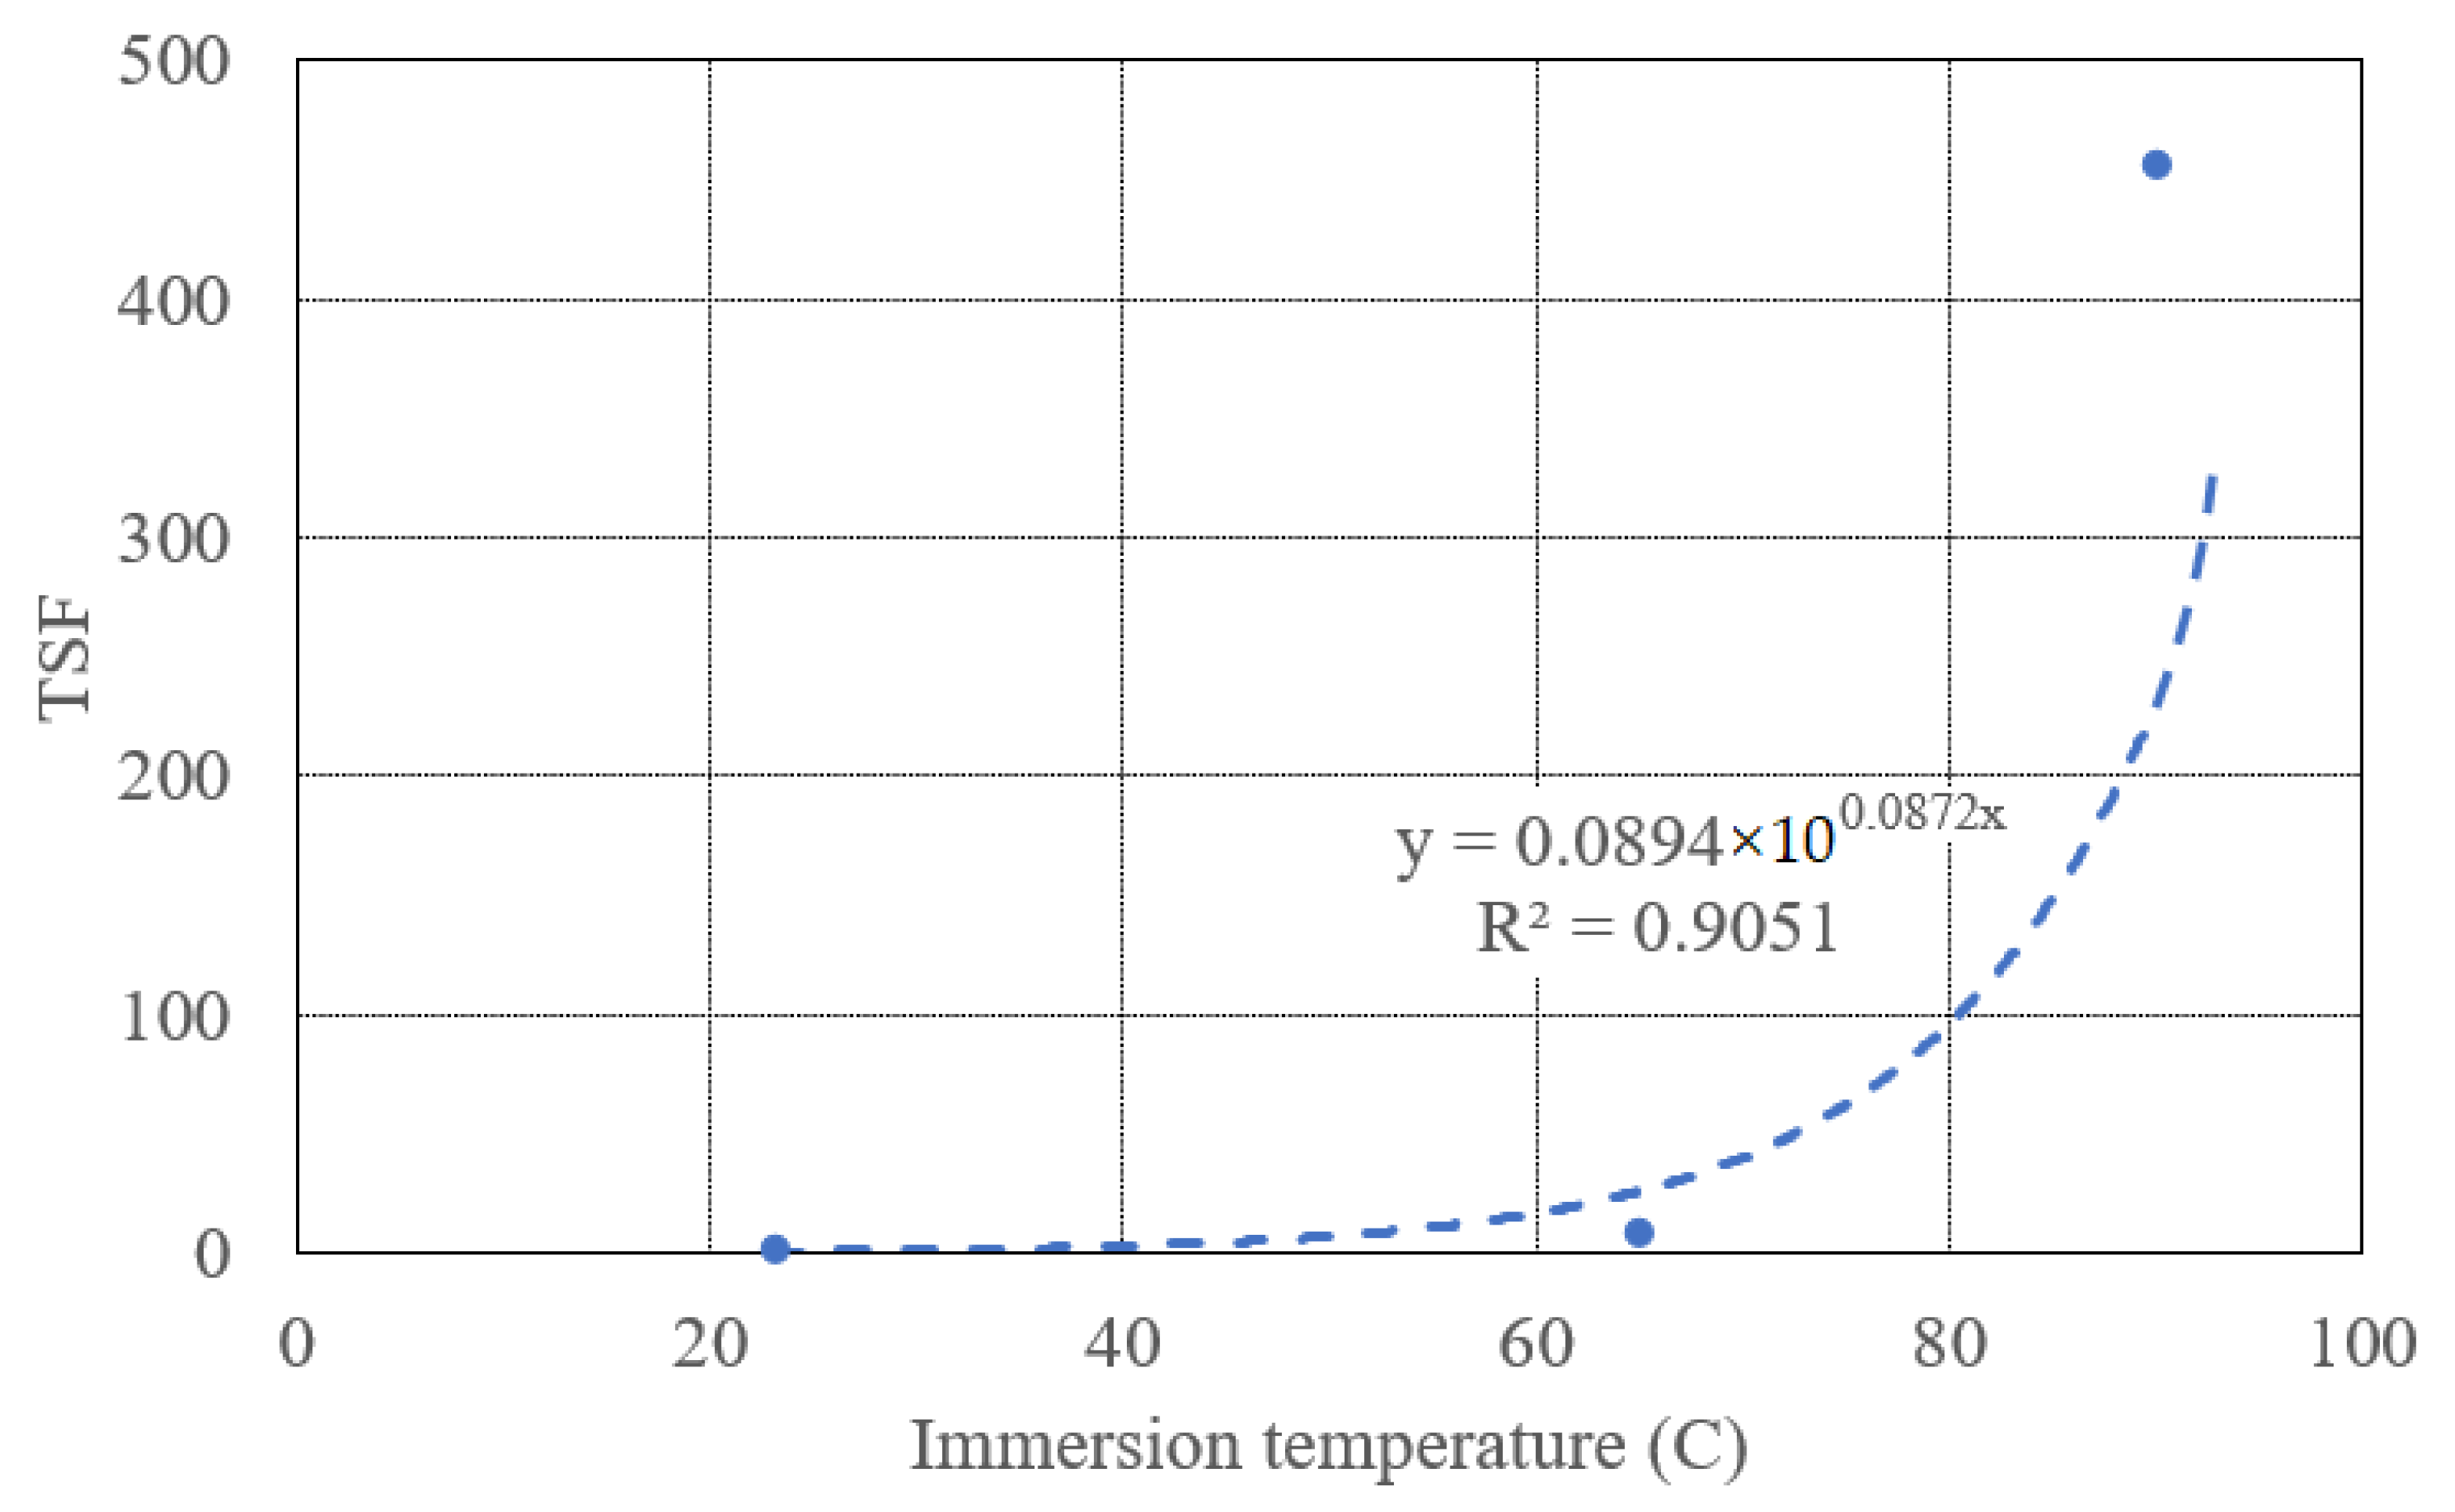
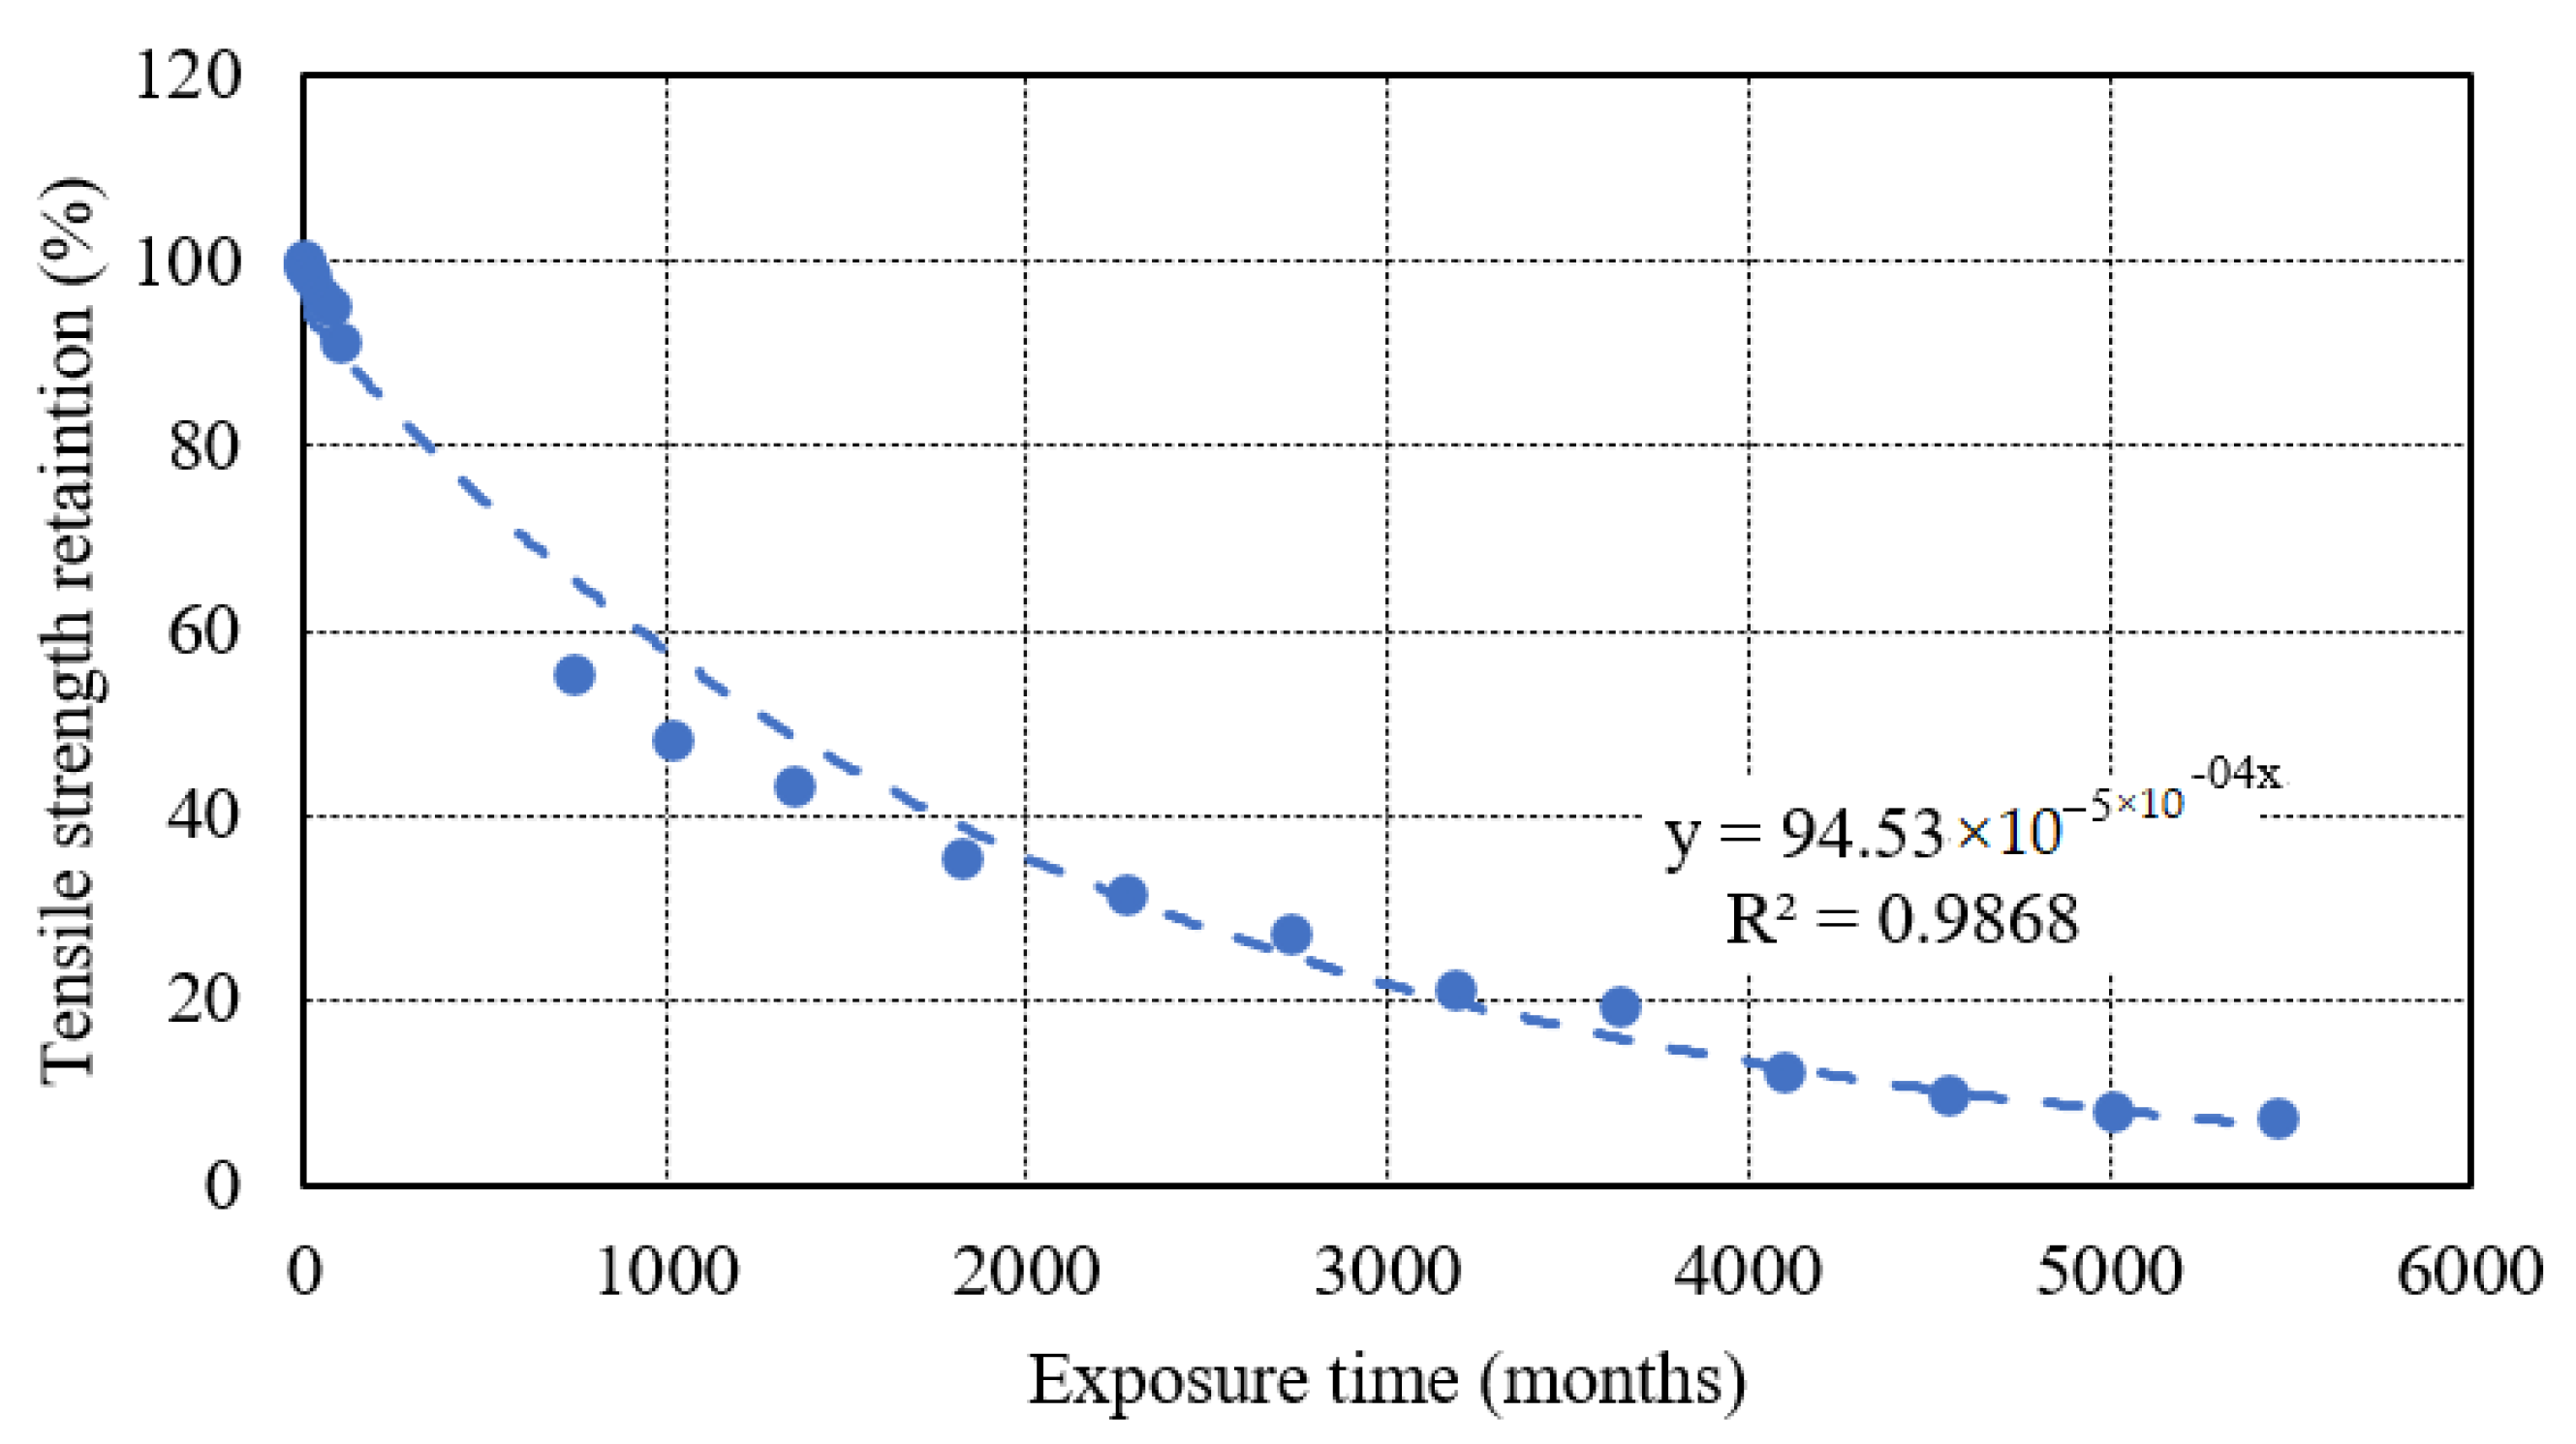
- A prediction approach based on a time-shift factor (TSF) was used which utilizes the accelerated temperature testing results to build a model for the long-term prediction at room temperature. This model predicted that the tensile strength retention of E-glass/Epoxy composite will be reduced to 7% 450 years after immersion in seawater at 23 °C. Lastly, the activation energy for the degradation of the composite was calculated. It was 5155.713 and 9731.482 for composite immersed at 65 °C and 90 °C respectively.
Author Contributions
Funding
Institutional Review Board Statement
Informed Consent Statement
Data Availability Statement
Acknowledgments
Conflicts of Interest
References
- Jamali, J.; Mourad, A.-H.I.; Fan, Y.; Wood, J. Through-thickness fracture behavior of unidirectional glass fibers/epoxy composites under various in-plane loading using the CTS test. Eng. Fract. Mech. 2016, 156, 83–95. [Google Scholar] [CrossRef]
- Mourad, A.-H.I.; Al Mansoori, M.S.; Al Marzooqi, L.A.; Genena, F.A.; Cherupurakal, N. Optimization of Curing Conditions and Nanofiller Incorporation for Production of High Performance Laminated Kevlar/Epoxy Nanocomposites. In Proceedings of the ASME 2018 Pressure Vessels and Piping Conference, Prague, Czech Republic, 15–20 July 2018. [Google Scholar]
- Idrisi, A.H.; Mourad, A.-H.I. Impact of the Harsh Environment on GFRE and GFRPol Composite; IEEE: Piscataway, NJ, USA, 2019; pp. 1–5. [Google Scholar]
- Idrisi, A.H.; Mourad, A.-H.I.; Abdel-Magid, B.; Mozumder, M.; Afifi, Y. Impact of the Harsh Environment on E-Glass Epoxy Composite. In Proceedings of the ASME 2019 Pressure Vessels & Piping Conference, San Antonio, TX, USA, 14–19 July 2019. [Google Scholar]
- Sathishkumar, T.P.; Satheeshkumar, S.; Naveen, J. Glass fiber-reinforced polymer composites–a review. J. Reinf. Plast. Compos. 2014, 33, 1258–1275. [Google Scholar] [CrossRef]
- Fouad, H.; Mourad, A.-H.I.; Alshammari, B.; Hassan, M.; Abdallah, M.Y.; Hashem, M. Fracture toughness, vibration modal analysis and viscoelastic behavior of Kevlar, glass, and carbon fiber/epoxy composites for dental-post applications. J. Mech. Behav. Biomed. Mater. 2020, 101, 103456. [Google Scholar] [CrossRef] [PubMed]
- Mourad, A.-H.I.; Abdel-Magid, B. Durability of Thermoset Composites in Seawater Environment; CAMX: Dallas, TX, USA, 2015. [Google Scholar]
- Mourad, A.-H.I.; Idrisi, A.H.; Wrage, M.C.; Abdel-Magid, B.M. Long-term durability of thermoset composites in seawater environment. Compos. Part B Eng. 2019, 168, 243–253. [Google Scholar] [CrossRef]
- Maggana, C.; Pissis, P. Water sorption and diffusion studies in an epoxy resin system. J. Polym. Sci. Part B Polym. Phys. 1999, 37, 1165–1182. [Google Scholar] [CrossRef]
- Ahmed, W.K.; Mourad, A.-H.I. Using fiber reinforced polymer to restore deteriorated structural members. Int. J. Mater. Mech. Eng. 2012, 1, 1–7. [Google Scholar]
- Mourad, A.-H.I. Thermo-mechanical characteristics of thermally aged polyethylene/polypropylene blends. Mater. Des. 2010, 31, 918–929. [Google Scholar] [CrossRef]
- Gonon, P.; Sylvestre, A.; Teysseyre, J.; Prior, C. Combined effects of humidity and thermal stress on the dielectric properties of epoxy-silica composites. Mater. Sci. Eng. B 2001, 83, 158–164. [Google Scholar] [CrossRef]
- Abdel-Magid, B.; Mourad, A.-H.I. LongYterm Effect of Seawater on Glass/Thermoset Composites. In Proceedings of the Fifteenth European Conference on Composite Materials (ECCM 15), Venice, Italy, 24–28 June 2012. [Google Scholar]
- Yilmaz, T.; Sinmazcelik, T. Effects of hydrothermal aging on glass–fiber/polyetherimide (PEI) composites. J. Mater. Sci. 2010, 45, 399–404. [Google Scholar] [CrossRef]
- Gautier, L.; Mortaigne, B.; Bellenger, V. Interface damage study of hydrothermally aged glass-fibre-reinforced polyester composites. Compos. Sci. Technol. 1999, 59, 2329–2337. [Google Scholar] [CrossRef]
- Al Kuwaiti, M.H.; Mourad, A.-H.I. Thermomechanical Characteristics of Compacted and Non-Compacted Plain Weave Woven Laminated Composites. In Proceedings of the ASME 2017 Pressure Vessels & Piping Conference, Waikoloa, HI, USA, 16–20 July 2017. [Google Scholar] [CrossRef]
- Al-Kuwaiti, M.H.H.; Mourad, A.-H.I. Effect of different environmental conditions on the mechanical behavior of plain weave woven laminated composites. Procedia Eng. 2015, 130, 638–643. [Google Scholar] [CrossRef] [Green Version]
- Mourad, A.-H.I.; Abdel-Magid, B.M.; El-Maaddawy, T.; Grami, M.E. Effect of seawater and warm environment on glass/epoxy and glass/polyurethane composites. Appl. Compos. Mater. 2010, 17, 557–573. [Google Scholar] [CrossRef]
- Zheng, Q.; Morgan, R.J. Synergistic Thermal-Moisture Damage Mechanisms of Epoxies and Their Carbon Fiber Composites. J. Compos. Mater. 1993, 27, 1465–1478. [Google Scholar] [CrossRef]
- De’Nève, B.; Shanahan, M. Water absorption by an epoxy resin and its effect on the mechanical properties and infra-red spectra. Polymer 1993, 34, 5099–5105. [Google Scholar] [CrossRef]
- Xiao, G.Z.; Delamar, M.; Shanahan, M.E.R. Irreversible interactions between water and DGEBA/DDA epoxy resin during hygro-thermal aging. J. Appl. Polym. Sci. 1997, 65, 449–458. [Google Scholar] [CrossRef]
- Mourad, A.-H.I.; Elsayed, H.F.; Barton, D.C.; Kenawy, M.; Abdel-Latif, L.A. Ultra high molecular weight polyethylene deformation and fracture behaviour as a function of high strain rate and triaxial state of stress. Int. J. Fract. 2003, 120, 501–515. [Google Scholar] [CrossRef]
- Hodzic, A.; Kim, J.; Lowe, A.; Stachurski, Z. The effects of water aging on the interphase region and interlaminar fracture toughness in polymer–glass composites. Compos. Sci. Technol. 2004, 64, 2185–2195. [Google Scholar] [CrossRef]
- Ellyin, F.; Maser, R. Environmental effects on the mechanical properties of glass-fiber epoxy composite tubular specimens. Compos. Sci. Technol. 2004, 64, 1863–1874. [Google Scholar] [CrossRef]
- Abd-Elhady, A.A.; Meroufel, A.; Sallam, H.E.-D.M.; Atta, M. Experimental and numerical determination of critical osmotic blister size affecting the strength of aged FRP seawater pipe. Polym. Polym. Compos. 2021, 29, 456–469. [Google Scholar] [CrossRef]
- Abd-Elhady, A.A.; Sallam, H.E.-D.M.; Alarifi, I.M.; Malik, R.A.; El-Bagory, T.M. Investigation of fatigue crack propagation in steel pipeline repaired by glass fiber reinforced polymer. Compos. Struct. 2020, 242, 112189. [Google Scholar] [CrossRef]
- Abd-Elhady, A.; Mubaraki, M.; Sallam, H. Progressive failure prediction of pinned joint in quasi-isotropic laminates used in pipelines. Lat. Am. J. Solids Struct. 2018, 15. [Google Scholar] [CrossRef]
- Dehbi, A.; Mourad, A.-H.I.; Djakhdane, K.; Hilal-Alnaqbi, A. Degradation of thermomechanical performance and lifetime esti-mation of multilayer greenhouse polyethylene films under simulated climatic conditions. Polym. Eng. Sci. 2015, 55, 287–298. [Google Scholar] [CrossRef]
- Idrisi, A.H.; Mourad, A.-H.I. Fabrication and Wear Analysis of Aluminium Matrix Composite Reinforced by SiC Micro and Nano Particles. In Proceedings of the ASME 2017 Pressure Vessels & Piping Conference, Waikoloa, HI, USA, 16–20 July 2017. [Google Scholar] [CrossRef]
- Babaghayou, M.I.; Mourad, A.-H.I.; Lorenzo, V.; Chabira, S.F.; Sebaa, M. Anisotropy evolution of low density polyethylene green-house covering films during their service life. Polym. Test. 2018, 66, 146–154. [Google Scholar] [CrossRef]
- Benabid, F.; Kharchi, N.; Zouai, F.; Mourad, A.-H.I.; Benachour, D. Impact of co-mixing technique and surface modification of ZnO nanoparticles using stearic acid on their dispersion into HDPE to produce HDPE/ZnO nanocomposites. Polym. Polym. Compos. 2019, 27, 389–399. [Google Scholar] [CrossRef]
- Deep, G.; Idrisi, A.H.; Siddiqui, T.U. A new bio-filler for polypropylene composites. Int. J. Innov. Res. Sci. Eng. Technol. 2016, 5, 16720–16725. [Google Scholar]
- Fan, X.; Lee, S.; Han, Q. Experimental investigations and model study of moisture behaviors in polymeric materials. Microelectron. Reliab. 2009, 49, 861–871. [Google Scholar] [CrossRef]
- Mourad, A.-H.I.; Zaaroura, N. Impact of nanofillers incorporation on laminated nanocomposites performance. J. Mater. Eng. Perform. 2018, 27, 4453–4461. [Google Scholar] [CrossRef]
- Mourad, A.-H.I.; Idrisi, A.H.; Zaaroura, N.; Sherif, M.M.; Fouad, H. Damage assessment of nanofiller-reinforced woven kevlar KM2plus/Epoxy resin laminated composites. Polym. Test. 2020, 86, 106501. [Google Scholar] [CrossRef]
- Idrisi, A.H.; Mourad, A.-H.I. Wear Performance Analysis of Aluminum Matrix Composites and Optimization of Process Parameters Using Statistical Techniques. Met. Mater. Trans. A 2019, 50, 5395–5409. [Google Scholar] [CrossRef]
- Idrisi, A.H.; Mourad, A.-H.I. Conventional stir casting versus ultrasonic assisted stir casting process: Mechanical and physical characteristics of AMCs. J. Alloy. Compd. 2019, 805, 502–508. [Google Scholar] [CrossRef]
- Dehbi, A.; Djakhdane, K.; Mourad, A.-H.I. Impact of Degradation of Polyethylene Films Under Simulated Climatic Conditions on Their Mechanical Behaviour and Thermal Stability and Lifetime. Rudy Scavuzzo Stud. Paper Symp. Compet. 2012, 55058, 131–135. [Google Scholar] [CrossRef]
- Mourad, A.-H.I.; Cherupurakal, N.; Hafeez, F.; Barsoum, I.; Genena, A.F.; Al Mansoori, S.M.; Al Marzooqi, L.A. Impact Strengthening of Laminated Kevlar/Epoxy Composites by Nanoparticle Reinforcement. Polymers 2020, 12, 2814. [Google Scholar] [CrossRef] [PubMed]
- Dehbi, A.; Mourad, A.-H.I.; Bouaza, A. Degradation assessment of LDPE multilayer films used as a greenhouse cover: Natural and artificial aging impacts. J. Appl. Polym. Sci. 2011, 124, 2702–2716. [Google Scholar] [CrossRef]
- Karbhari, V.M.; Chu, W. Degradation kinetics of pultruded E-glass/vinylester in alkaline media. ACI Mater. J. 2005, 102, 34. [Google Scholar]
- Gellert, E.; Turley, D. Seawater immersion ageing of glass-fibre reinforced polymer laminates for marine applications. Compos. Part A Appl. Sci. Manuf. 1999, 30, 1259–1265. [Google Scholar] [CrossRef]
- Pavan, A.; Dayananda, P.; Vijaya, K.M.; Hegde, S.; Hosagade, P.N. Influence of seawater absorption on vibrational and tensile characteristics of quasi-isotropic glass/epoxy composites. J. Mater. Res. Technol. 2019, 8, 1427–1433. [Google Scholar] [CrossRef]
- Yan, L.; Chouw, N. Effect of water, seawater and alkaline solution ageing on mechanical properties of flax fabric/epoxy com-posites used for civil engineering applications. Constr. Build. Mater. 2015, 99, 118–127. [Google Scholar] [CrossRef]
- Silva, M.A.G.; da Fonseca, B.S.; Biscaia, H. On estimates of durability of FRP based on accelerated tests. Compos. Struct. 2014, 116, 377–387. [Google Scholar] [CrossRef]
- Chakraverty, A.P.; Mohanty, U.K.; Mishra, S.C.; Satapathy, A. Sea Water Ageing of GFRP Composites and the Dissolved salts. IOP Conf. Series Mater. Sci. Eng. 2015, 75, 12029. [Google Scholar] [CrossRef]
- Chen, Y.; Davalos, J.F.; Ray, I. Durability Prediction for GFRP Reinforcing Bars Using Short-Term Data of Accelerated Aging Tests. J. Compos. Constr. 2006, 10, 279–286. [Google Scholar] [CrossRef]
- Ali, A.H.; Mohamed, H.M.; Benmokrane, B.; ElSafty, A.; Chaallal, O. Durability performance and long-term prediction models of sand-coated basalt FRP bars. Compos. Part B Eng. 2019, 157, 248–258. [Google Scholar] [CrossRef]
- Dejke, V. Durability of FRP Reinforcement in Concrete; Chalmers University of Technology: Göteborg, Sweden, 2001. [Google Scholar]
- Hu, Y.; Li, X.; Lang, A.W.; Zhang, Y.; Nutt, S.R. Water immersion aging of polydicyclopentadiene resin and glass fiber composites. Polym. Degrad. Stab. 2016, 124, 35–42. [Google Scholar] [CrossRef]
- Guermazi, N.; Ben Tarjem, A.; Ksouri, I.; Ayedi, H.F. On the durability of FRP composites for aircraft structures in hygrothermal conditioning. Compos. Part B Eng. 2016, 85, 294–304. [Google Scholar] [CrossRef]
- Bobbaa, S.; Lemana, Z.; Zainudina, E.S.; Sapuana, S.M. The influence of hydrothermal aging on E-glass and S-glass fi-ber/epoxyreinforced composite pipes. J. Mater. Environ. Sci. 2019, 10, 790–804. [Google Scholar]
- Feng, P.; Wang, J.; Wang, Y.; Loughery, D.; Niu, D. Effects of corrosive environments on properties of pultruded GFRP plates. Compos. Part B Eng. 2014, 67, 427–433. [Google Scholar] [CrossRef]
- Merah, N.; Nizamuddin, S.; Khan, Z.; Al-Sulaiman, F.; Mehdi, M. Effects of harsh weather and seawater on glass fiber reinforced epoxy composite. J. Reinf. Plast. Compos. 2010, 29, 3104–3110. [Google Scholar] [CrossRef]
- Deniz, M.E.; Karakuzu, R. Seawater effect on impact behavior of glass–epoxy composite pipes. Compos. Part B Eng. 2012, 43, 1130–1138. [Google Scholar] [CrossRef]
- Wei, B.; Cao, H.; Song, S. Degradation of basalt fibre and glass fibre/epoxy resin composites in seawater. Corros. Sci. 2011, 53, 426–431. [Google Scholar] [CrossRef]
- Antunes, M.B.; Almeida, J.H.S., Jr.; Amico, S.C. Curing and seawater aging effects on mechanical and physical properties of glass/epoxy filament wound cylinders. Compos. Commun. 2020, 22, 100517. [Google Scholar] [CrossRef]
- Ghabezi, P.; Harrison, N. Mechanical behavior and long-term life prediction of carbon/epoxy and glass/epoxy composite lami-nates under artificial seawater environment. Mater. Lett. 2020, 261, 127091. [Google Scholar] [CrossRef]
- D3039 ASTM. Standard test method for tensile properties of polymer matrix composite materials. ASTM Int. 2008. [Google Scholar] [CrossRef]
- Ray, B. Temperature effect during humid ageing on interfaces of glass and carbon fibers reinforced epoxy composites. J. Colloid Interface Sci. 2006, 298, 111–117. [Google Scholar] [CrossRef]
- Wang, Z.; Zhao, X.-L.; Xian, G.; Wu, G.; Raman, R.S.; Al-Saadi, S. Durability study on interlaminar shear behaviour of basalt-, glass- and carbon-fibre reinforced polymer (B/G/CFRP) bars in seawater sea sand concrete environment. Constr. Build. Mater. 2017, 156, 985–1004. [Google Scholar] [CrossRef]
- Wang, Z.; Zhao, X.-L.; Xian, G.; Wu, G.; Raman, R.S.; Al-Saadi, S.; Haque, A. Long-term durability of basalt- and glass-fibre reinforced polymer (BFRP/GFRP) bars in seawater and sea sand concrete environment. Constr. Build. Mater. 2017, 139, 467–489. [Google Scholar] [CrossRef]
- Robert, M.; Benmokrane, B. Combined effects of saline solution and moist concrete on long-term durability of GFRP reinforcing bars. Constr. Build. Mater. 2013, 38, 274–284. [Google Scholar] [CrossRef]
- Mourad, A.-H.I.; Fouad, H.; Elleithy, R. Impact of some environmental conditions on the tensile, creep-recovery, relaxation, melting and crystallinity behaviour of UHMWPE-GUR 410-medical grade. Mater. Des. 2009, 30, 4112–4219. [Google Scholar] [CrossRef]
- Mourad, A.-H.I.; Elsayed, H.F.; Barton, D.C. Semicrystalline polymers deformation and fracture behaviour under quasistatic strain rates and triaxial states of stress. Strength Fract. Complex 2004, 2, 149–162. [Google Scholar]
- Mourad, A.-H.I.; Dehbi, A. On use of trilayer low density polyethylene greenhouse cover as substitute for monolayer cover. Plast. Rubber Compos. 2014, 43, 111–121. [Google Scholar] [CrossRef]
- Mourad, A.-H.I.; Akkad, R.O.; Soliman, A.A.; Madkour, T.M. Characterisation of thermally treated and untreated polyethylene–polypropylene blends using DSC, TGA and IR techniques. Plast. Rubber Compos. 2009, 38, 265–278. [Google Scholar] [CrossRef]
- Wang, Z.; Huang, X.; Xian, G.; Li, H. Effects of surface treatment of carbon fiber: Tensile property, surface characteristics, and bonding to epoxy. Polym. Compos. 2015, 37, 2921–2932. [Google Scholar] [CrossRef]
- Zafar, A.; Bertocco, F.; Schjødt-Thomsen, J.; Rauhe, J. Investigation of the long term effects of moisture on carbon fibre and epoxy matrix composites. Compos. Sci. Technol. 2012, 72, 656–666. [Google Scholar] [CrossRef]
- Kawagoe, M.; Takeshima, M.; Nomiya, M.; Qiu, J.; Morita, M.; Mizuno, W.; Kitano, H. Microspectroscopic evaluations of the interfacial degradation by absorbed water in a model composite of an aramid fibre and unsaturated polyester. Polymer 1999, 40, 1373–1380. [Google Scholar] [CrossRef]
- Noobut, W.; Koenig, J.L. Interfacial behavior of epoxy/E-glass fiber composites under wet-dry cycles by fourier transform infrared microspectroscopy. Polym. Compos. 1999, 20, 38–47. [Google Scholar] [CrossRef]
- Ngono, Y.; Maréchal, Y.; Mermilliod, N. Epoxy−Amine Reticulates Observed by Infrared Spectrometry. I: Hydration Process and Interaction Configurations of Embedded H2O Molecules. J. Phys. Chem. B 1999, 103, 4979–4985. [Google Scholar] [CrossRef]
- Yang, Y.; Xian, G.; Li, H.; Sui, L. Thermal aging of an anhydride-cured epoxy resin. Polym. Degrad. Stab. 2015, 118, 111–119. [Google Scholar] [CrossRef]
- Socrates, G. Infrared and Raman Characteristic Group Frequencies: Tables and Charts, 3rd ed.; John Wiley & Sons: New York, NY, USA, 2004. [Google Scholar]
- Smith, R.E.; Larsen, F.N.; Long, C.L. Epoxy resin cure. II. FTIR analysis. J. Appl. Polym. Sci. 1984, 29, 3713–3726. [Google Scholar] [CrossRef]
- Chike, K.E.; Myrick, M.L.; Lyon, R.E.; Angel, S.M. Raman and Near-Infrared Studies of an Epoxy Resin. Appl. Spectrosc. 1993, 47, 1631–1635. [Google Scholar] [CrossRef]
- Guo, F.; Al-Saadi, S.; Raman, R.S.; Zhao, X. Durability of fiber reinforced polymer (FRP) in simulated seawater sea sand concrete (SWSSC) environment. Corros. Sci. 2018, 141, 1–13. [Google Scholar] [CrossRef]
- Zhou, J.; Lucas, J.P. Hygrothermal effects of epoxy resin. Part II: Variations of glass transition temperature. Polymer 1999, 40, 5513–5522. [Google Scholar] [CrossRef]
- Zhou, J.; Lucas, J.P. Hygrothermal effects of epoxy resin. Part I: The nature of water in epoxy. Polymer 1999, 40, 5505–5512. [Google Scholar] [CrossRef]
- Davalos, J.F.; Chen, Y.; Ray, I. Long-term durability prediction models for GFRP bars in concrete environment. J. Compos. Mater. 2011, 46, 1899–1914. [Google Scholar] [CrossRef]
- Chen, Y.; Davalos, J.F.; Ray, I.; Kim, H.-Y. Accelerated aging tests for evaluations of durability performance of FRP reinforcing bars for concrete structures. Compos. Struct. 2007, 78, 101–111. [Google Scholar] [CrossRef]
- Robert, M.; Fam, A. Long-Term Performance of GFRP Tubes Filled with Concrete and Subjected to Salt Solution. J. Compos. Constr. 2012, 16, 217–224. [Google Scholar] [CrossRef]
- Wu, G.; Dong, Z.-Q.; Wang, X.; Zhu, Y.; Wu, Z.-S. Prediction of long-term performance and durability of BFRP bars under the com-bined effect of sustained load and corrosive solutions. J. Compos. Constr. 2015, 19, 4014058. [Google Scholar] [CrossRef]
- Renaud, C.M.; Greenwood, M.E. Effect of glass fibres and environments on long-term durability of GFRP composites. In Proceedings of the 9 EFUC Meeting, Wroclaw, Poland, 4–9 September 2005. [Google Scholar]


| Authors | Composite | Conditioning | Duration |
|---|---|---|---|
| Silva et al. [45] | E-glass/epoxy | Saltwater at 30 °C, 45 °C and 55 °C | 750–5000 h (Approx 7 months) |
| Chakraverty et al. [46] | E-glass/epoxy | Seawater at room temperature | 2, 4, 6, 8, 10, and12 months (1 year) |
| Hu et al. [50] | Glass/polydicycl-opentadiene and glass/epoxy | Saltwater and deionized water at 60 °C | 1, 3, 6, and 12 months (1 year) |
| Guermazi et al. [51] | Glass/epoxy, carbon/epoxy and glass/carbon/epoxy | Tap water at 24 ± 3, 70 and 90 °C | 3 months |
| Bobba et al. [52] | E-glass and S-glass fiber-epoxy | Tap water at 90 °C | 600, 1200, and 1800 h (2.5 months) |
| Feng et al. [53] | Glass/epoxy | H2SO4, NaOH and NaCl at 60 and 90 °C | 7, 15, 30, and 90 days (3 months) |
| Merah et al. [54] | Glass fiber-reinforced epoxy (GFRE) | Seawater at outdoor temperature | 6 and 12 months |
| Mourad et al. [18] | Glass/epoxy and glass/polyurethane | Seawater at 23 °C and 65 °C | 3, 6, 9, and 12 months |
| EminDeniz et al. [55] | Glass/epoxy composite | Seawater at 20 °C | 3, 6, 9, and 12 months |
| Pavan et al. [43] | E-glass/epoxy laminates | Artificial seawater in sub-zero and ambient temperatures | 3600 h (5 months) |
| Wei et al. [56] | Basalt fiber-reinforced plastic (BFRP) and Glass fiber-reinforced plastic (GFRP) | Artificial seawater at 25 °C | 10, 20, 30, 60, and 90 days |
| Antunes et al. [57] | Glass/epoxy filament wound cylinders | Seawater at 80 °C | 7–28 days |
| Ghabezi et al. [58] | Carbon/epoxy and glass/epoxy | Artificial seawater at room temperature and 60 °C | 45 days |
| Conditioning Duration (Months) | Variation in Mass (%) | ||
|---|---|---|---|
| 23 °C | 65 °C | 90 °C | |
| 3 | 0.9 ± 0.2 | 2.8 ± 0.3 | 1.07 ± 0.14 |
| 6 | 1.3 ± 0.4 | 2.9 ± 0.2 | 3.6 ± 0.9 |
| 9 | 1.7 ± 0.7 | 4.1 ± 0.6 | 5.9 ± 0.65 |
| 12 | 2.5 ± 0.5 | 5.0 ± 0.8 | 12.05 ± 1.67 |
| Immersion Time (Months) | Tensile Strength (MPa) | Tensile Modulus (GPa) | Tensile Strain to Failure (%) | |||
|---|---|---|---|---|---|---|
| 23 °C | 65 °C | 23 °C | 65 °C | 23 °C | 65 °C | |
| 0 (Control Sample) | 798 ± 43 | 798 ± 43 | 37.1 ± 2.5 | 37.1 ± 2.5 | 2.14 ± 0.02 | 2.14 ± 0.02 |
| 3 | 796 ± 40 | 783 ± 51 | 37.8 ± 1.6 | 35.4 ± 1.8 | 2.1 ± 0.2 | 2.2 ± 0.0 |
| 6 | 794 ± 49 | 765 ± 17 | 35.1 ± 2.5 | 33.5 ± 0.6 | 2.26 ± 0.03 | 2.3 ± 0.2 |
| 9 | 793 ± 39 | 758 ± 28 | 36.3 ± 1.9 | 33.7 ± 2.3 | 2.22 ± 0.2 | 2.24 ± 0.15 |
| 12 | 790 ± 38 | 726 ± 39 | 38.5 ± 4.5 | 32.7 ± 3.4 | 2.12 ± 0.21 | 2.18 ± 0.1 |
| Immersion Time (Months) | Tensile Strength (MPa) | Tensile Strain to Failure (%) | Tensile Modulus (GPa) |
|---|---|---|---|
| 0 (Control sample) | 798 ± 43 | 2.14 ± 0.02 | 37.1 ± 2.5 |
| 1 | 384 ± 55 | 1.27 ± 0.02 | 35.49 ± 2.13 |
| 2 | 368.7 ± 51 | 1.16 ± 0.023 | 34.07 ± 1.27 |
| 3 | 328.2 ± 19 | 0.88 ± 0.08 | 41.87 ± 2.48 |
| 4 | 279.9 ± 9 | 0.87 ± 0.07 | 42.79 ± 4.05 |
| 5 | 248 ± 27 | 0.75 ± 0.1 | 41.50 ± 2.81 |
| 6 | 215 ± 16 | 0.51 ± 0.14 | 40.43 ± 1.23 |
| 7 | 165.6 ± 14 | 0.31 ± 0.09 | 43.35 ± 4.33 |
| 8 | 151.9 ± 17 | 0.40 ± 0.6 | 42.1 ± 3.9 |
| 9 | 96.3 ± 26 | 0.3 ± 0.1 | 43.8 ± 2.8 |
| 10 | 74.7 ± 9 | 0.27 ± 0.11 | 47.38 ± 2.8 |
| 11 | 60.5 ± 10 | 0.15 ± 0.07 | 47.18 ± 1.13 |
| 12 | 57.3 ± 3.7 | 0.14 ± 0.09 | 46.9 ± 4.7 |
| Bands (cm−1) | Assignment |
|---|---|
| 3400 | Stretching vibration O=H |
| ~2930 and ~2900 | C–H group stretching band |
| ~1732 | C–O non-conjugate ester stretching |
| ~1610 | stretching band of C=C (alkene) |
| ~1509 | C=C (aromatic nucleus) |
| ~1245 | Asymmetric C–O– Φ stretch |
| 1182 | C–O aromatic ring stretching |
| ~1040 | Symmetric C–O– Φ stretch |
| ~827 | Out of plane bending of C–H (benzene) |
| Temperature | τ | R2 |
|---|---|---|
| 23 | 1250 | 1 |
| 65 | 142.86 | 0.9544 |
| 90 | 4.95 | 0.966 |
| Temperature | TSF | Ea/R |
|---|---|---|
| 65 | 8.7 | 5155.713 |
| 90 | 456 | 9731.482 |
Publisher’s Note: MDPI stays neutral with regard to jurisdictional claims in published maps and institutional affiliations. |
© 2021 by the authors. Licensee MDPI, Basel, Switzerland. This article is an open access article distributed under the terms and conditions of the Creative Commons Attribution (CC BY) license (https://creativecommons.org/licenses/by/4.0/).
Share and Cite
Idrisi, A.H.; Mourad, A.-H.I.; Abdel-Magid, B.M.; Shivamurty, B. Investigation on the Durability of E-Glass/Epoxy Composite Exposed to Seawater at Elevated Temperature. Polymers 2021, 13, 2182. https://doi.org/10.3390/polym13132182
Idrisi AH, Mourad A-HI, Abdel-Magid BM, Shivamurty B. Investigation on the Durability of E-Glass/Epoxy Composite Exposed to Seawater at Elevated Temperature. Polymers. 2021; 13(13):2182. https://doi.org/10.3390/polym13132182
Chicago/Turabian StyleIdrisi, Amir Hussain, Abdel-Hamid I. Mourad, Beckry M. Abdel-Magid, and B. Shivamurty. 2021. "Investigation on the Durability of E-Glass/Epoxy Composite Exposed to Seawater at Elevated Temperature" Polymers 13, no. 13: 2182. https://doi.org/10.3390/polym13132182
APA StyleIdrisi, A. H., Mourad, A.-H. I., Abdel-Magid, B. M., & Shivamurty, B. (2021). Investigation on the Durability of E-Glass/Epoxy Composite Exposed to Seawater at Elevated Temperature. Polymers, 13(13), 2182. https://doi.org/10.3390/polym13132182