
The Effects of Nanosilica on Mechanical Properties and Fracture Toughness of Geopolymer Cement

 ,
,
Abstract
:1. Introduction
2. Materials and Methods
2.1. Materials
2.2. Geopolymer Mixes Containing Nanosilica
2.3. Testing Procedures
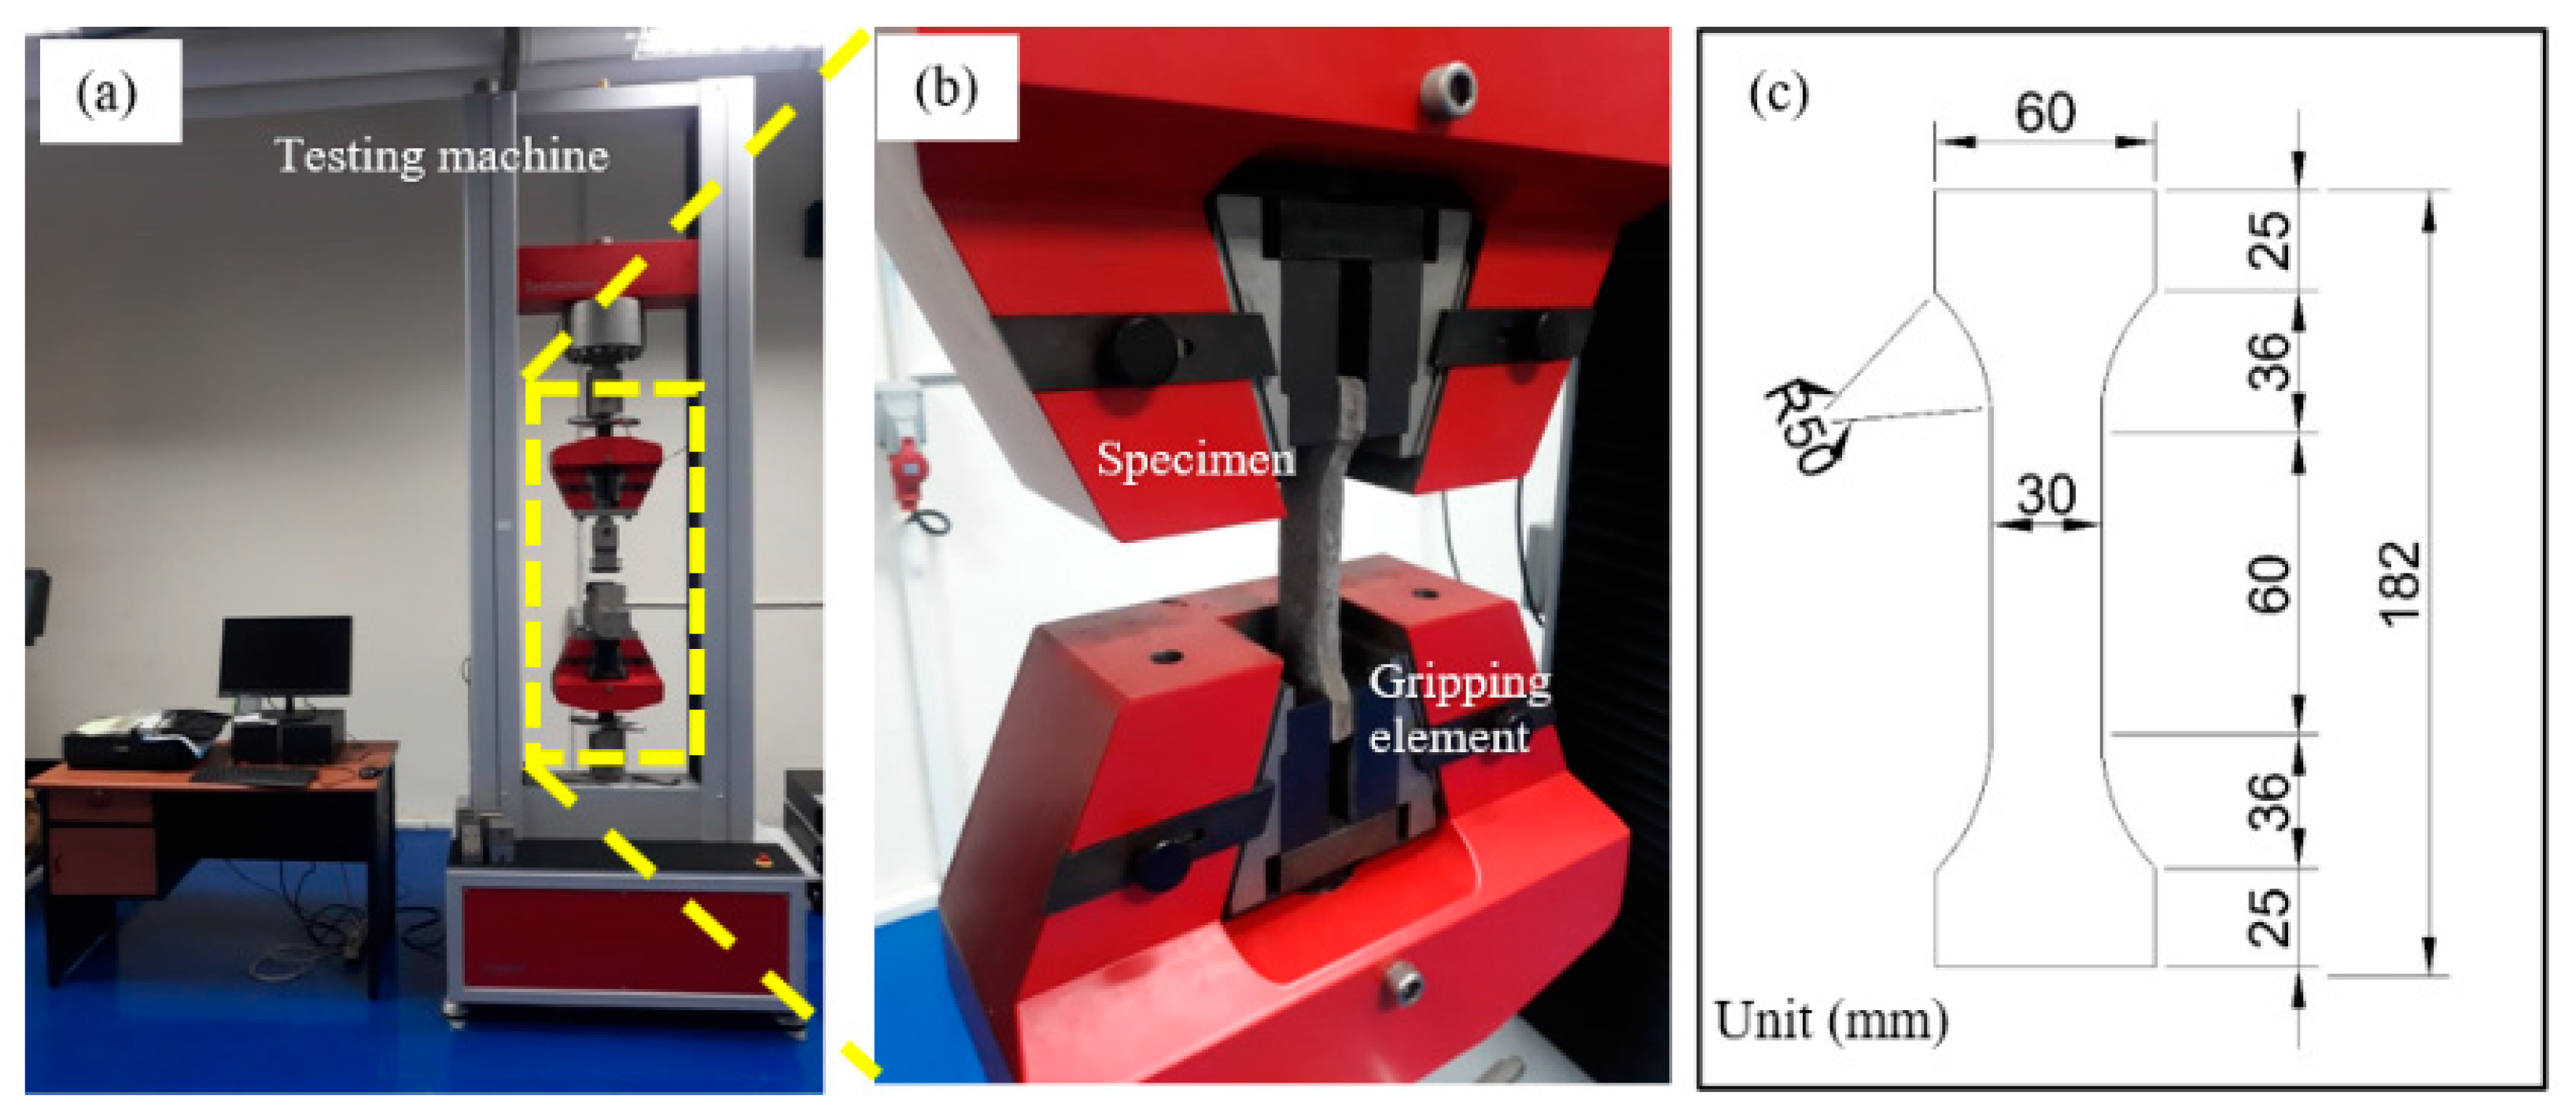
2.3.1. Mechanical Properties
2.3.2. Characterization of Materials
3. Results
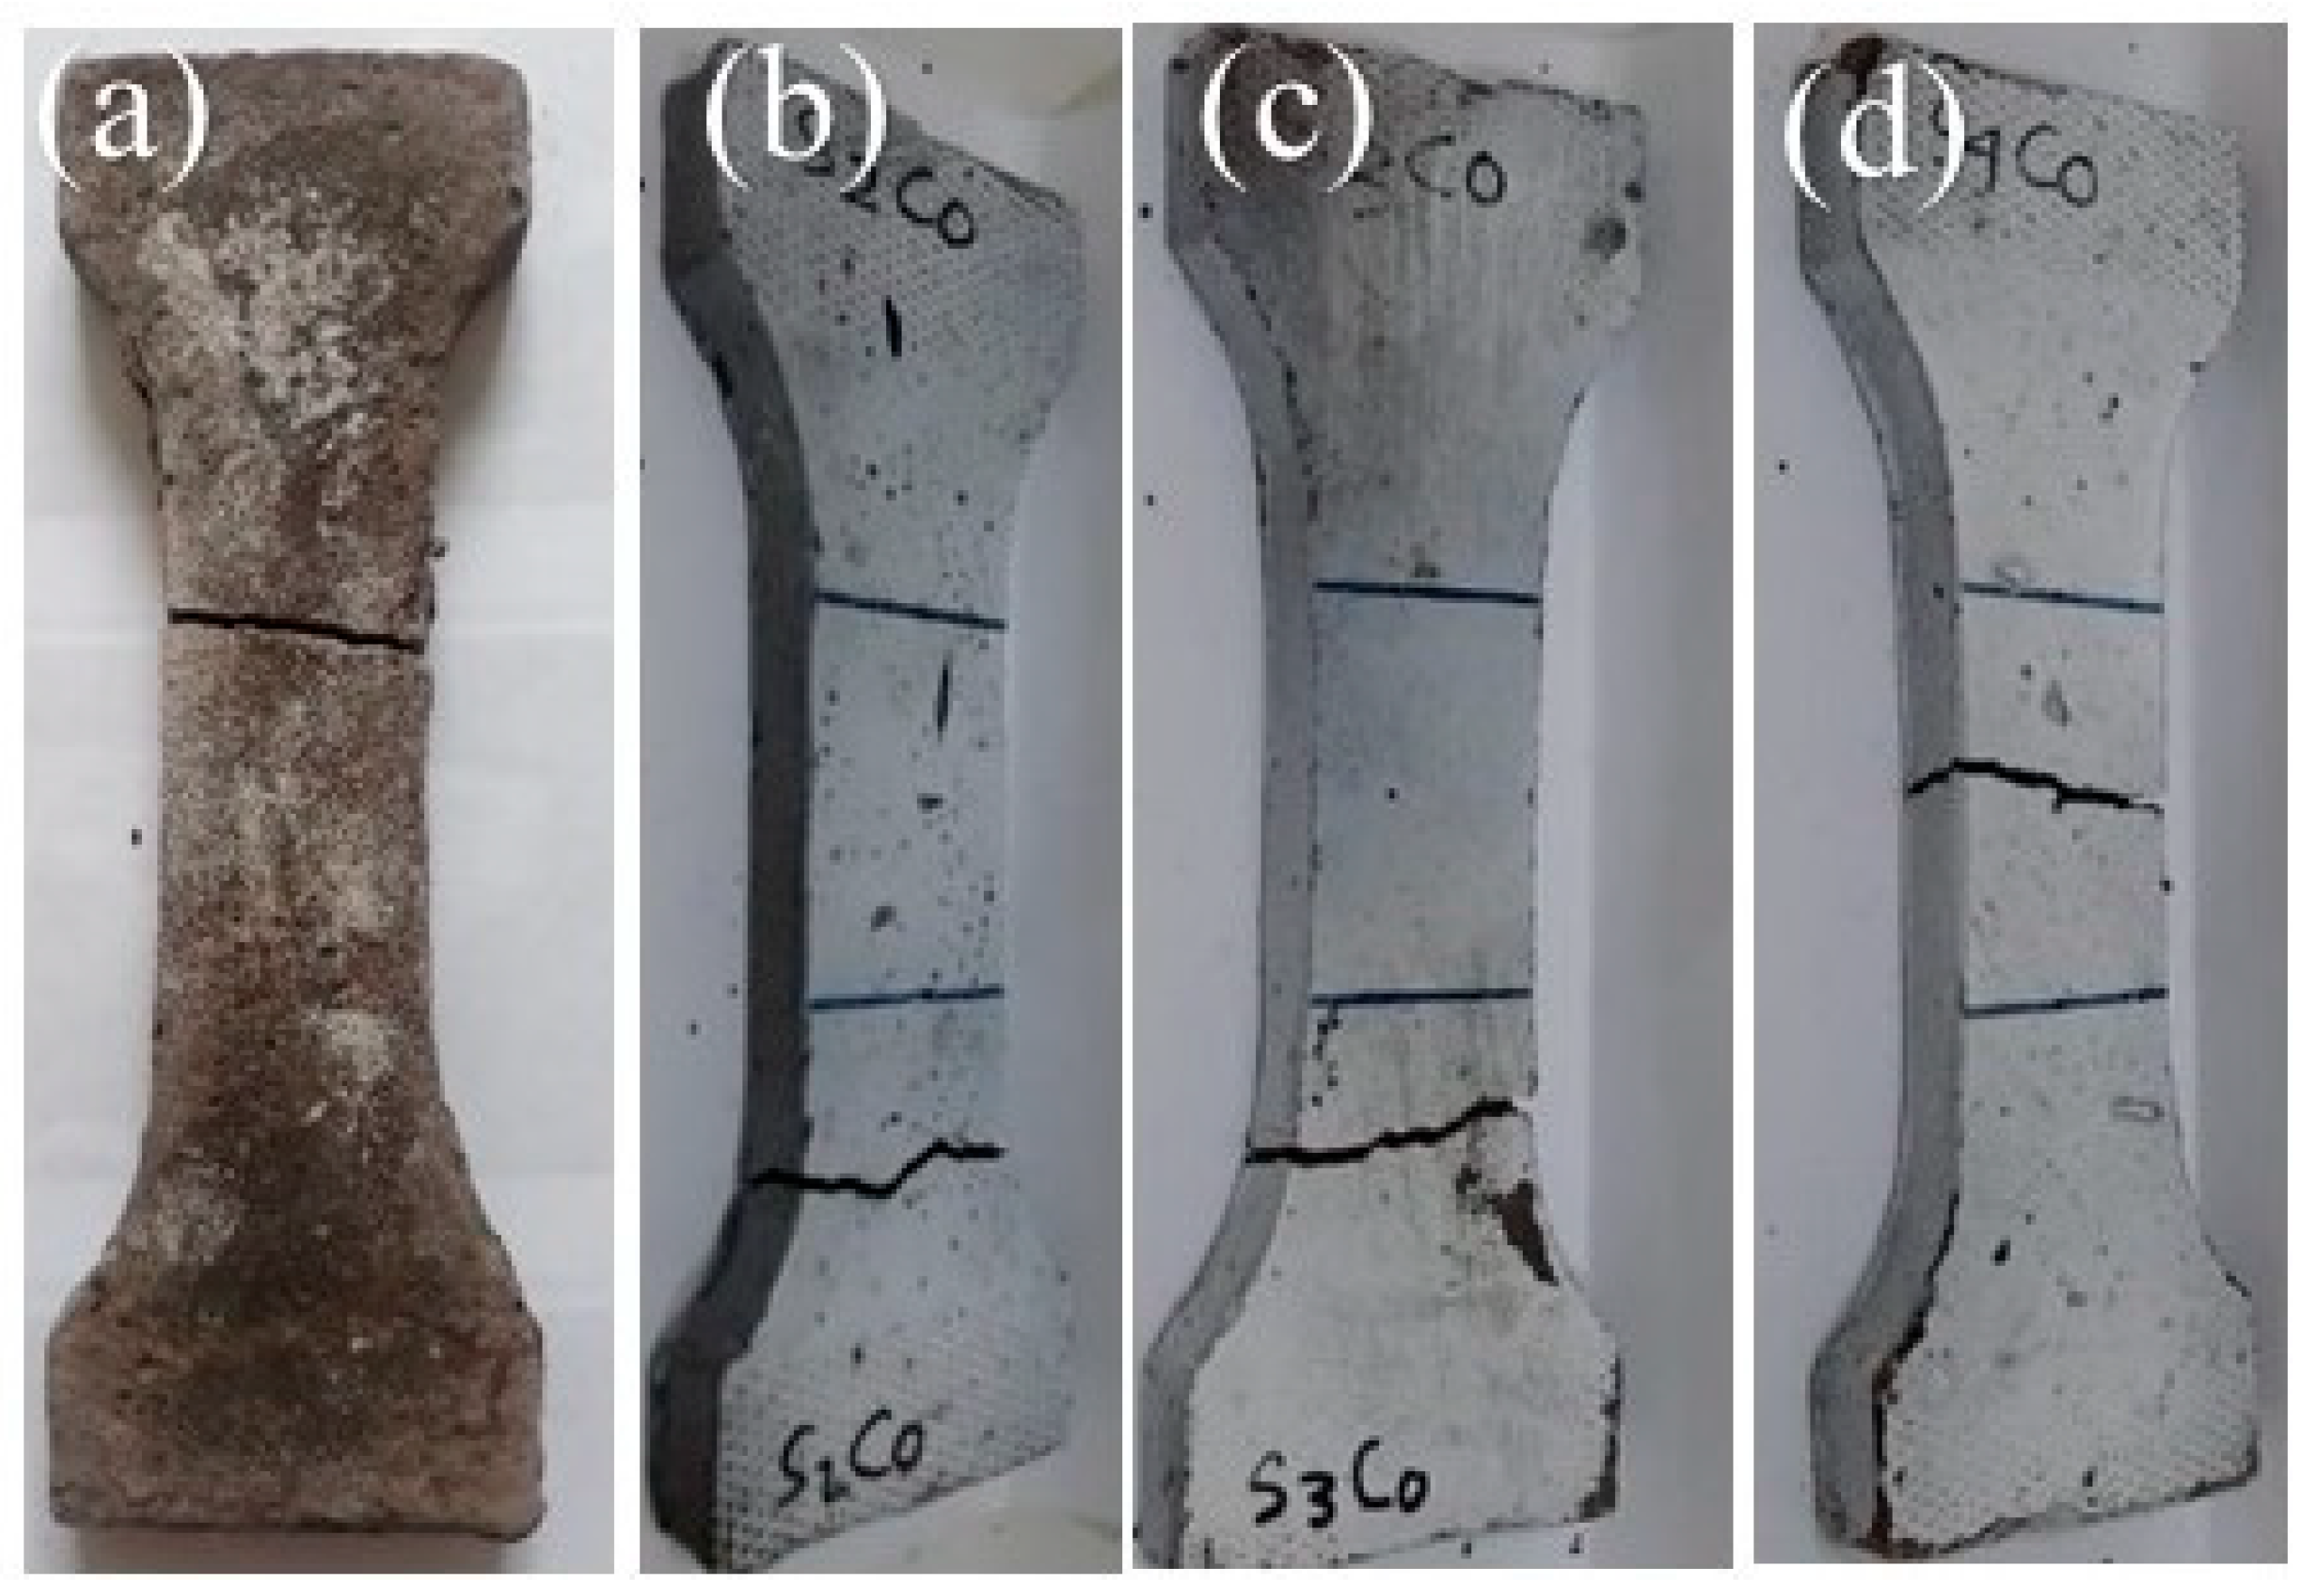
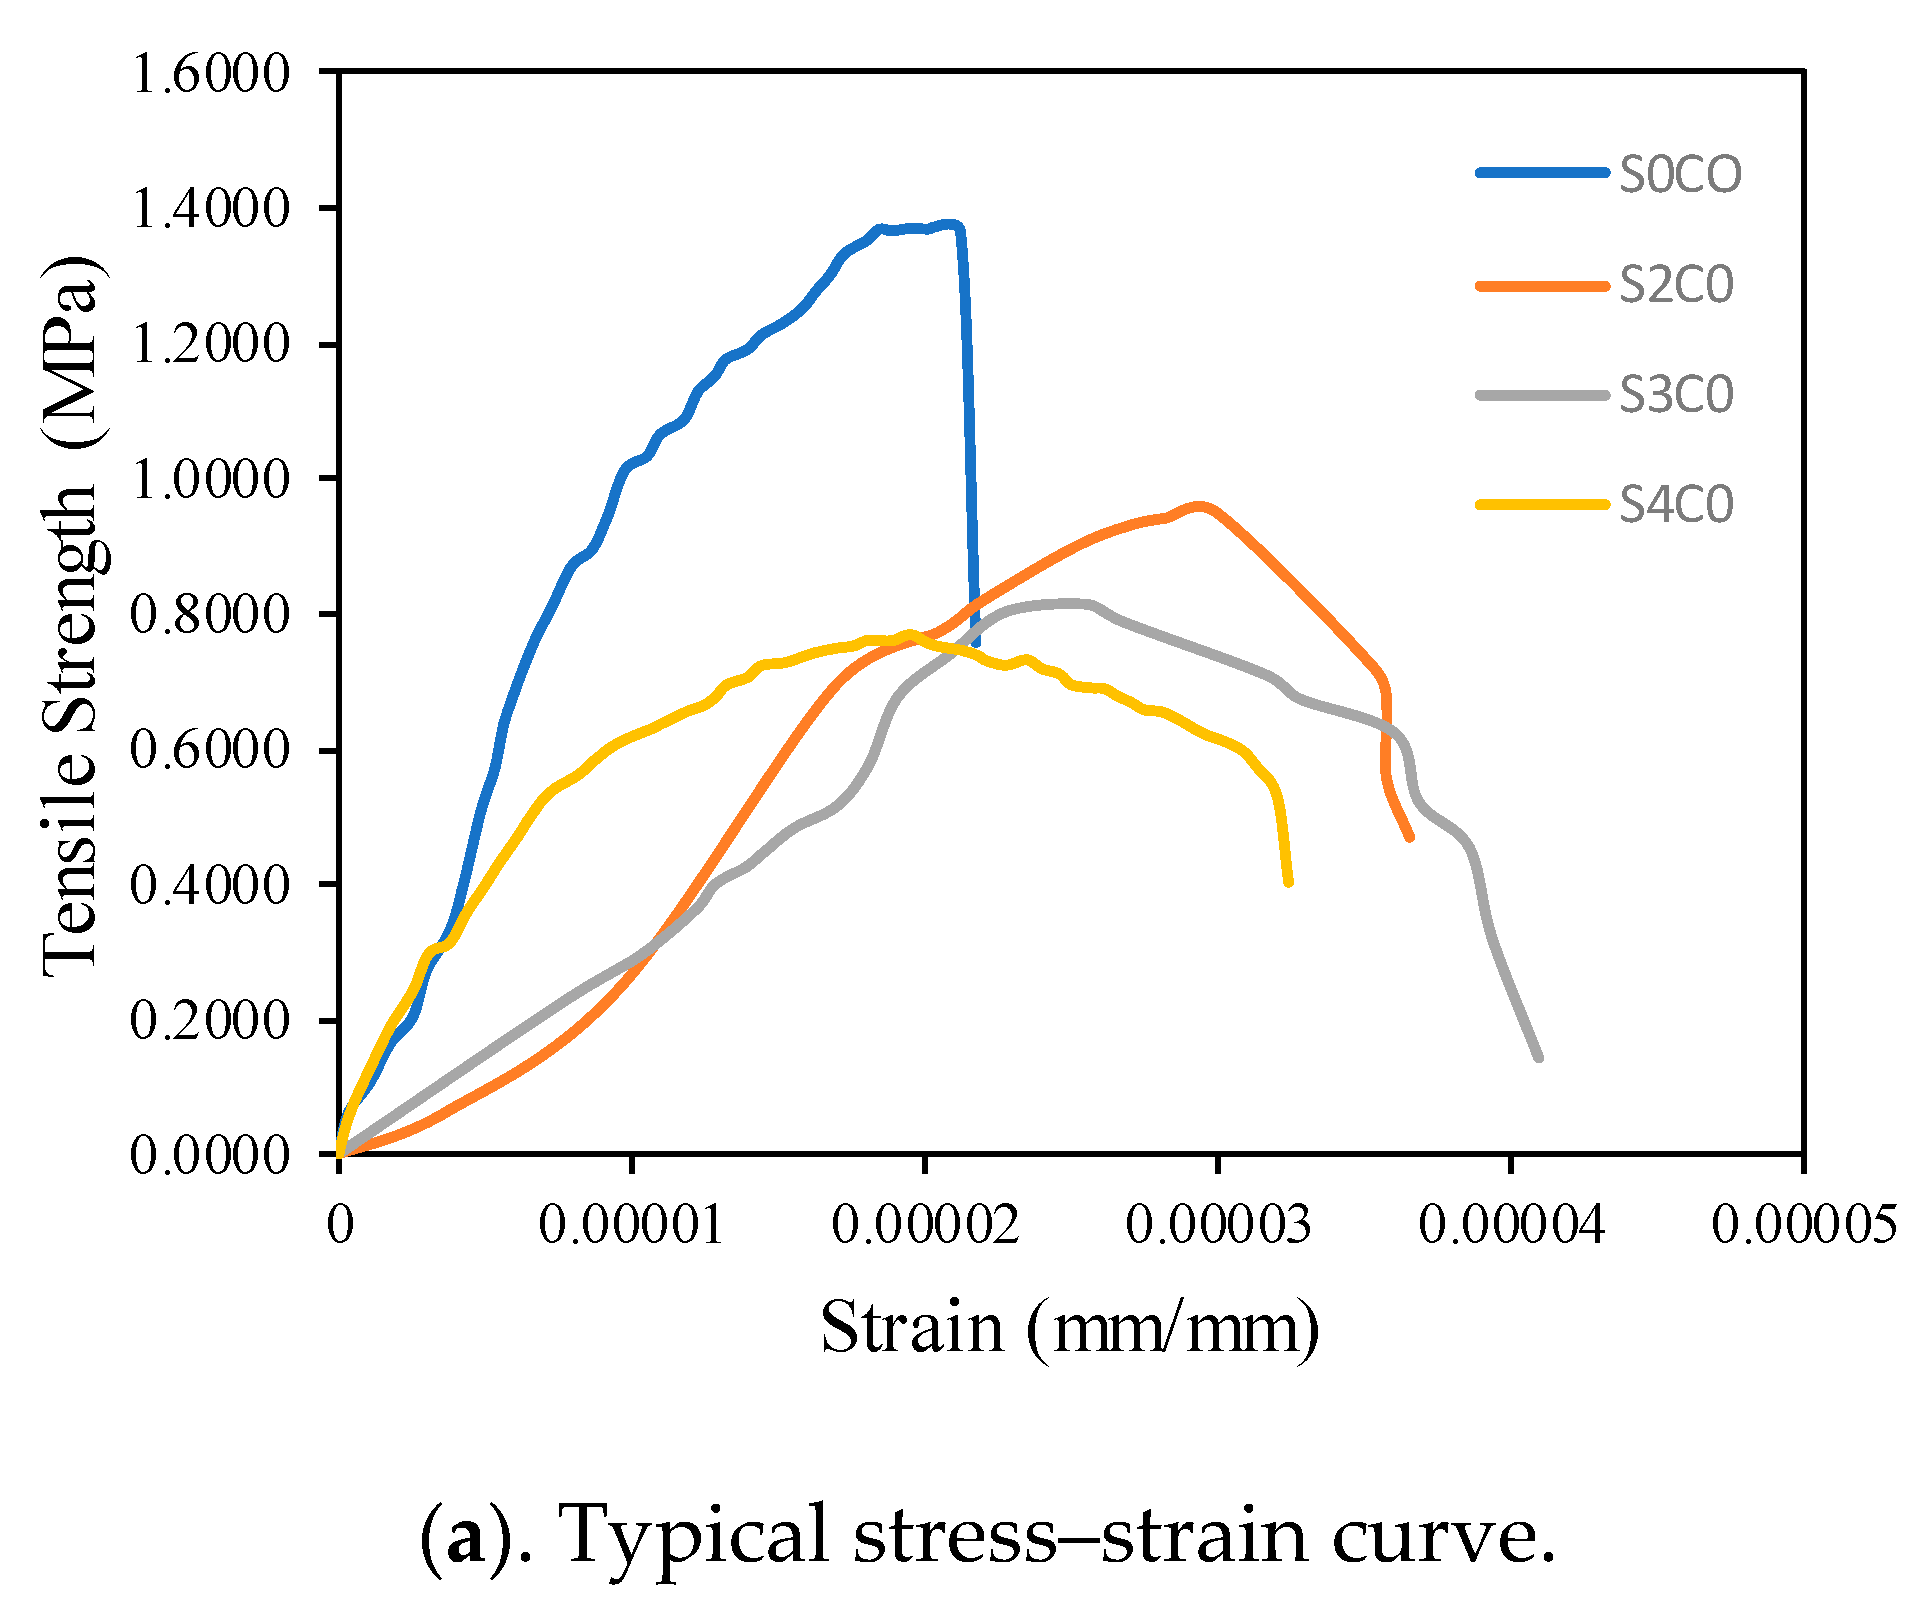
3.1. Direct Tensile Strength
3.2. Ductility
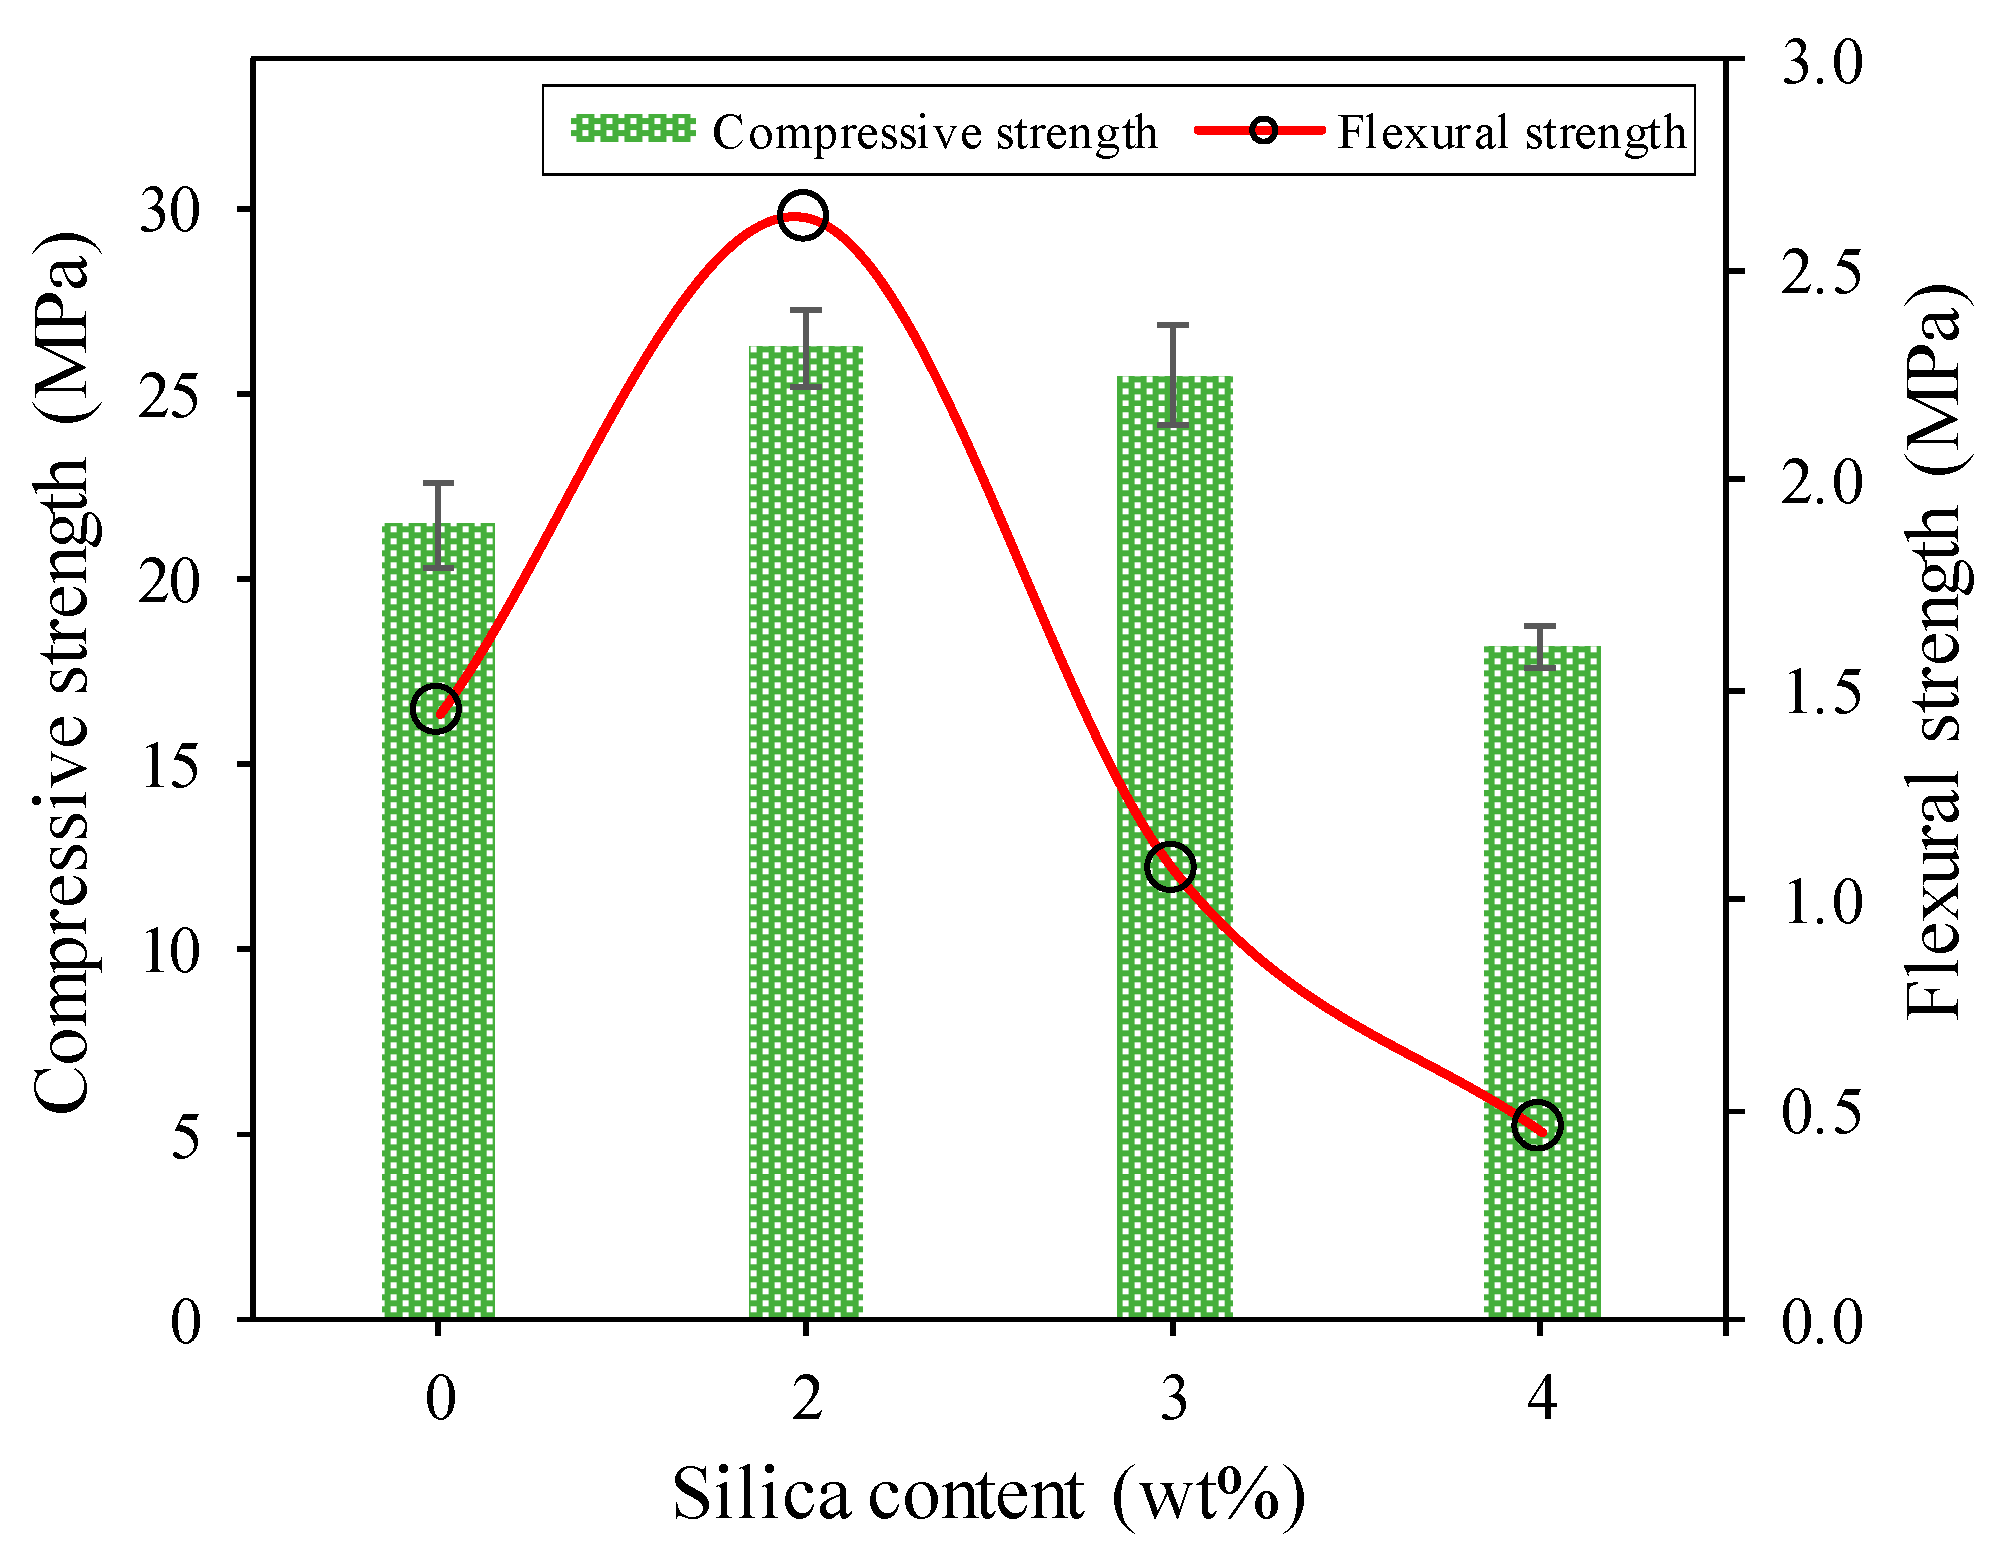
3.3. Compressive Strength and Flexural Strength
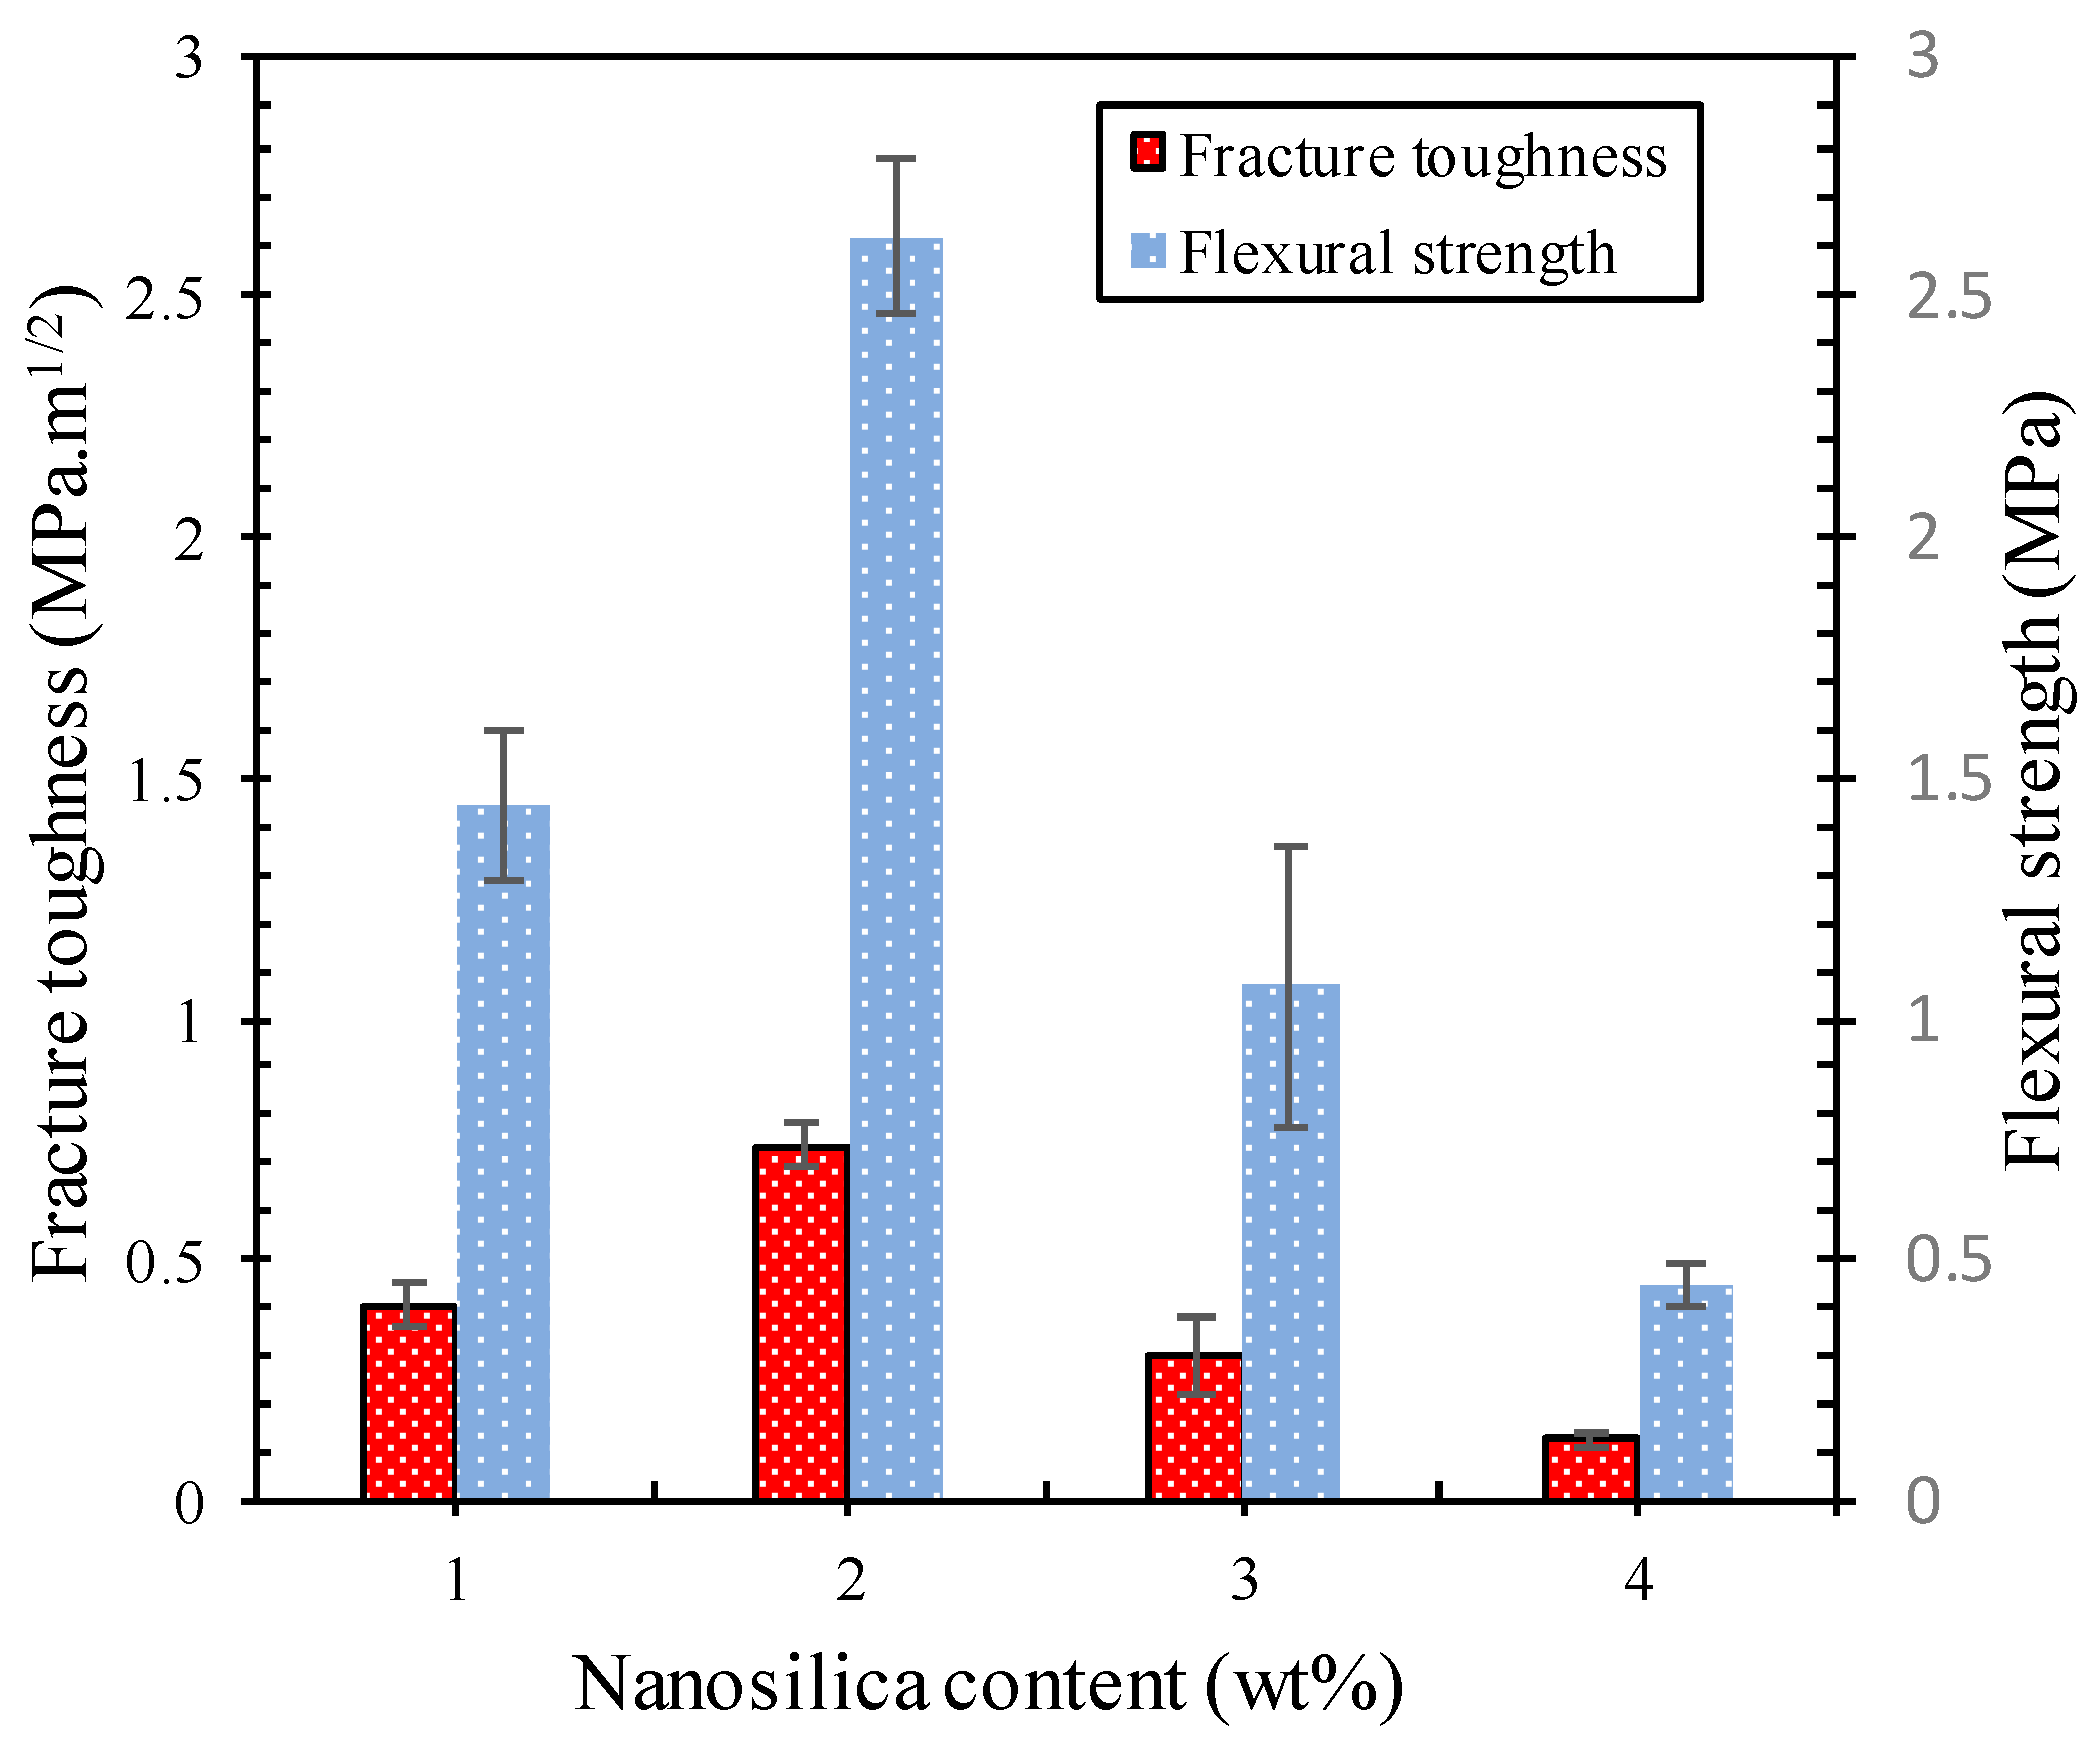
3.4. Fracture Toughness
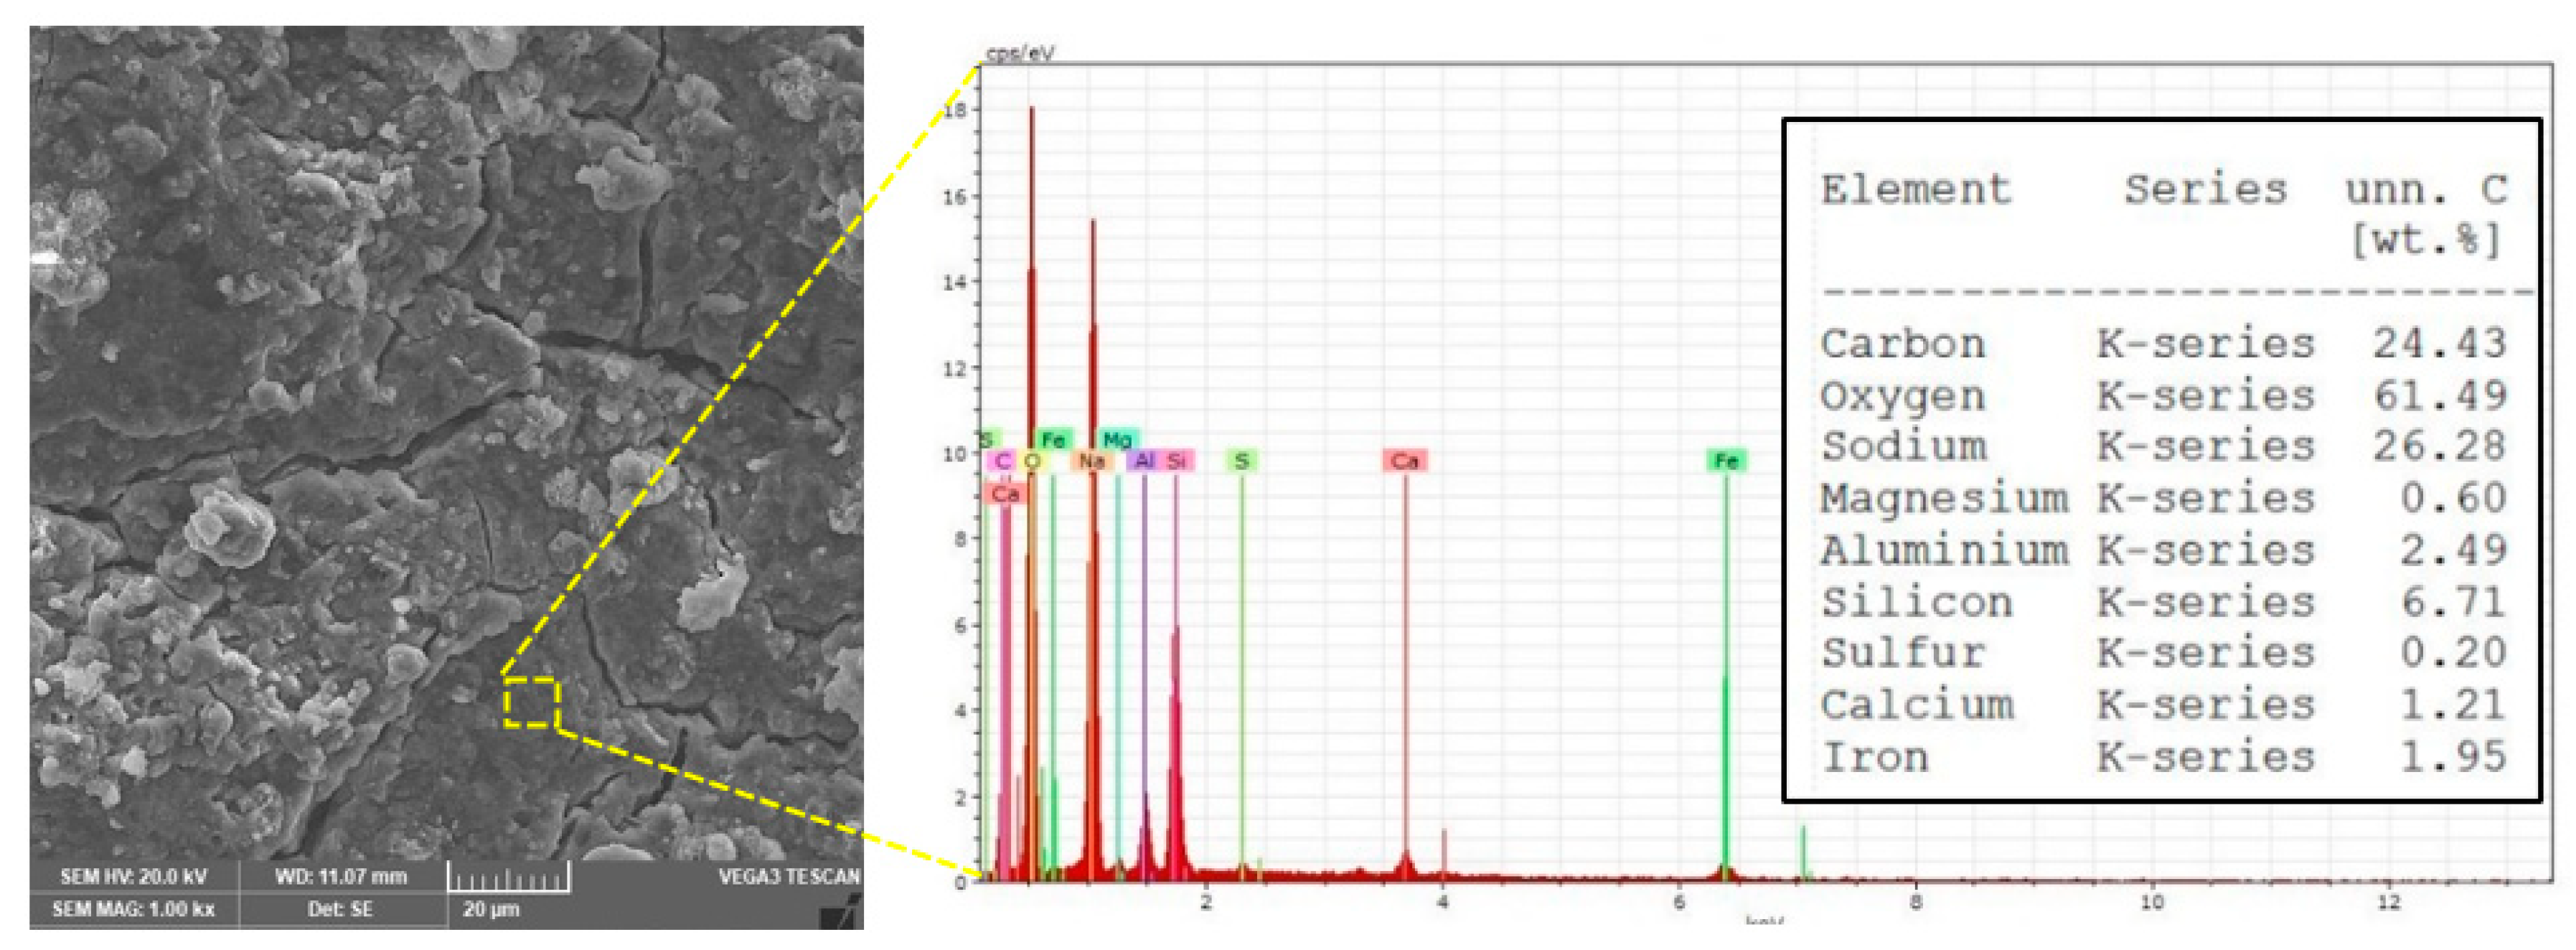
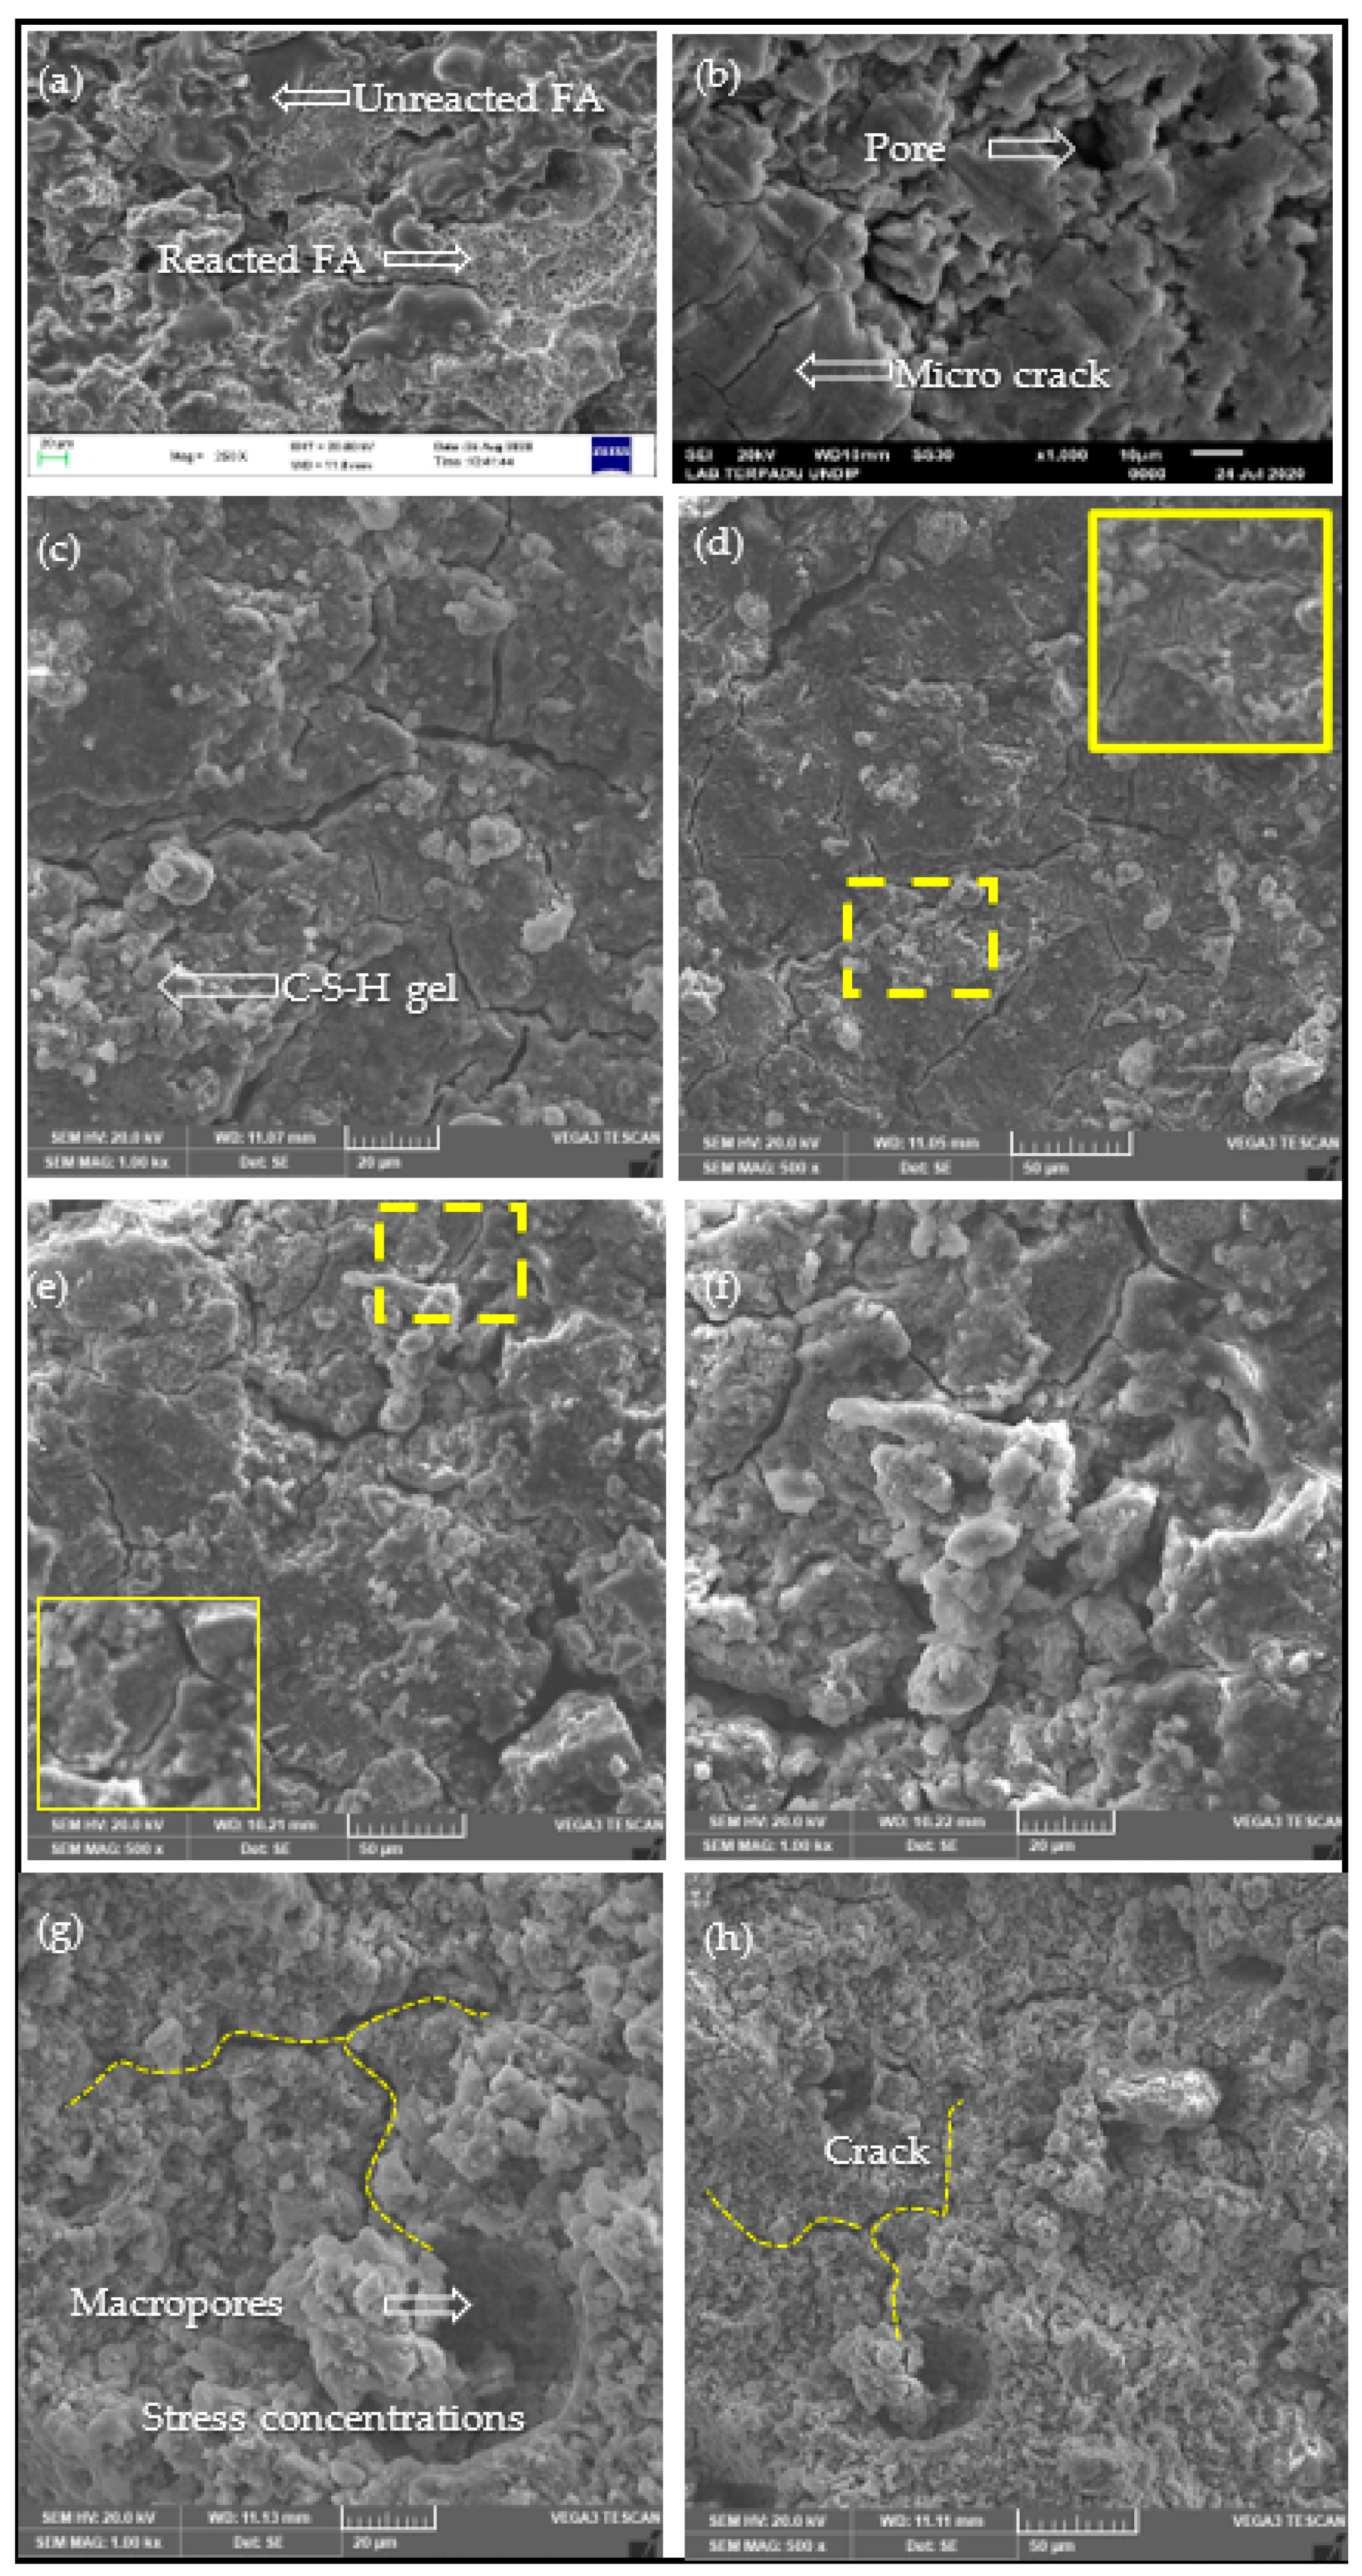
3.5. SEM Analysis
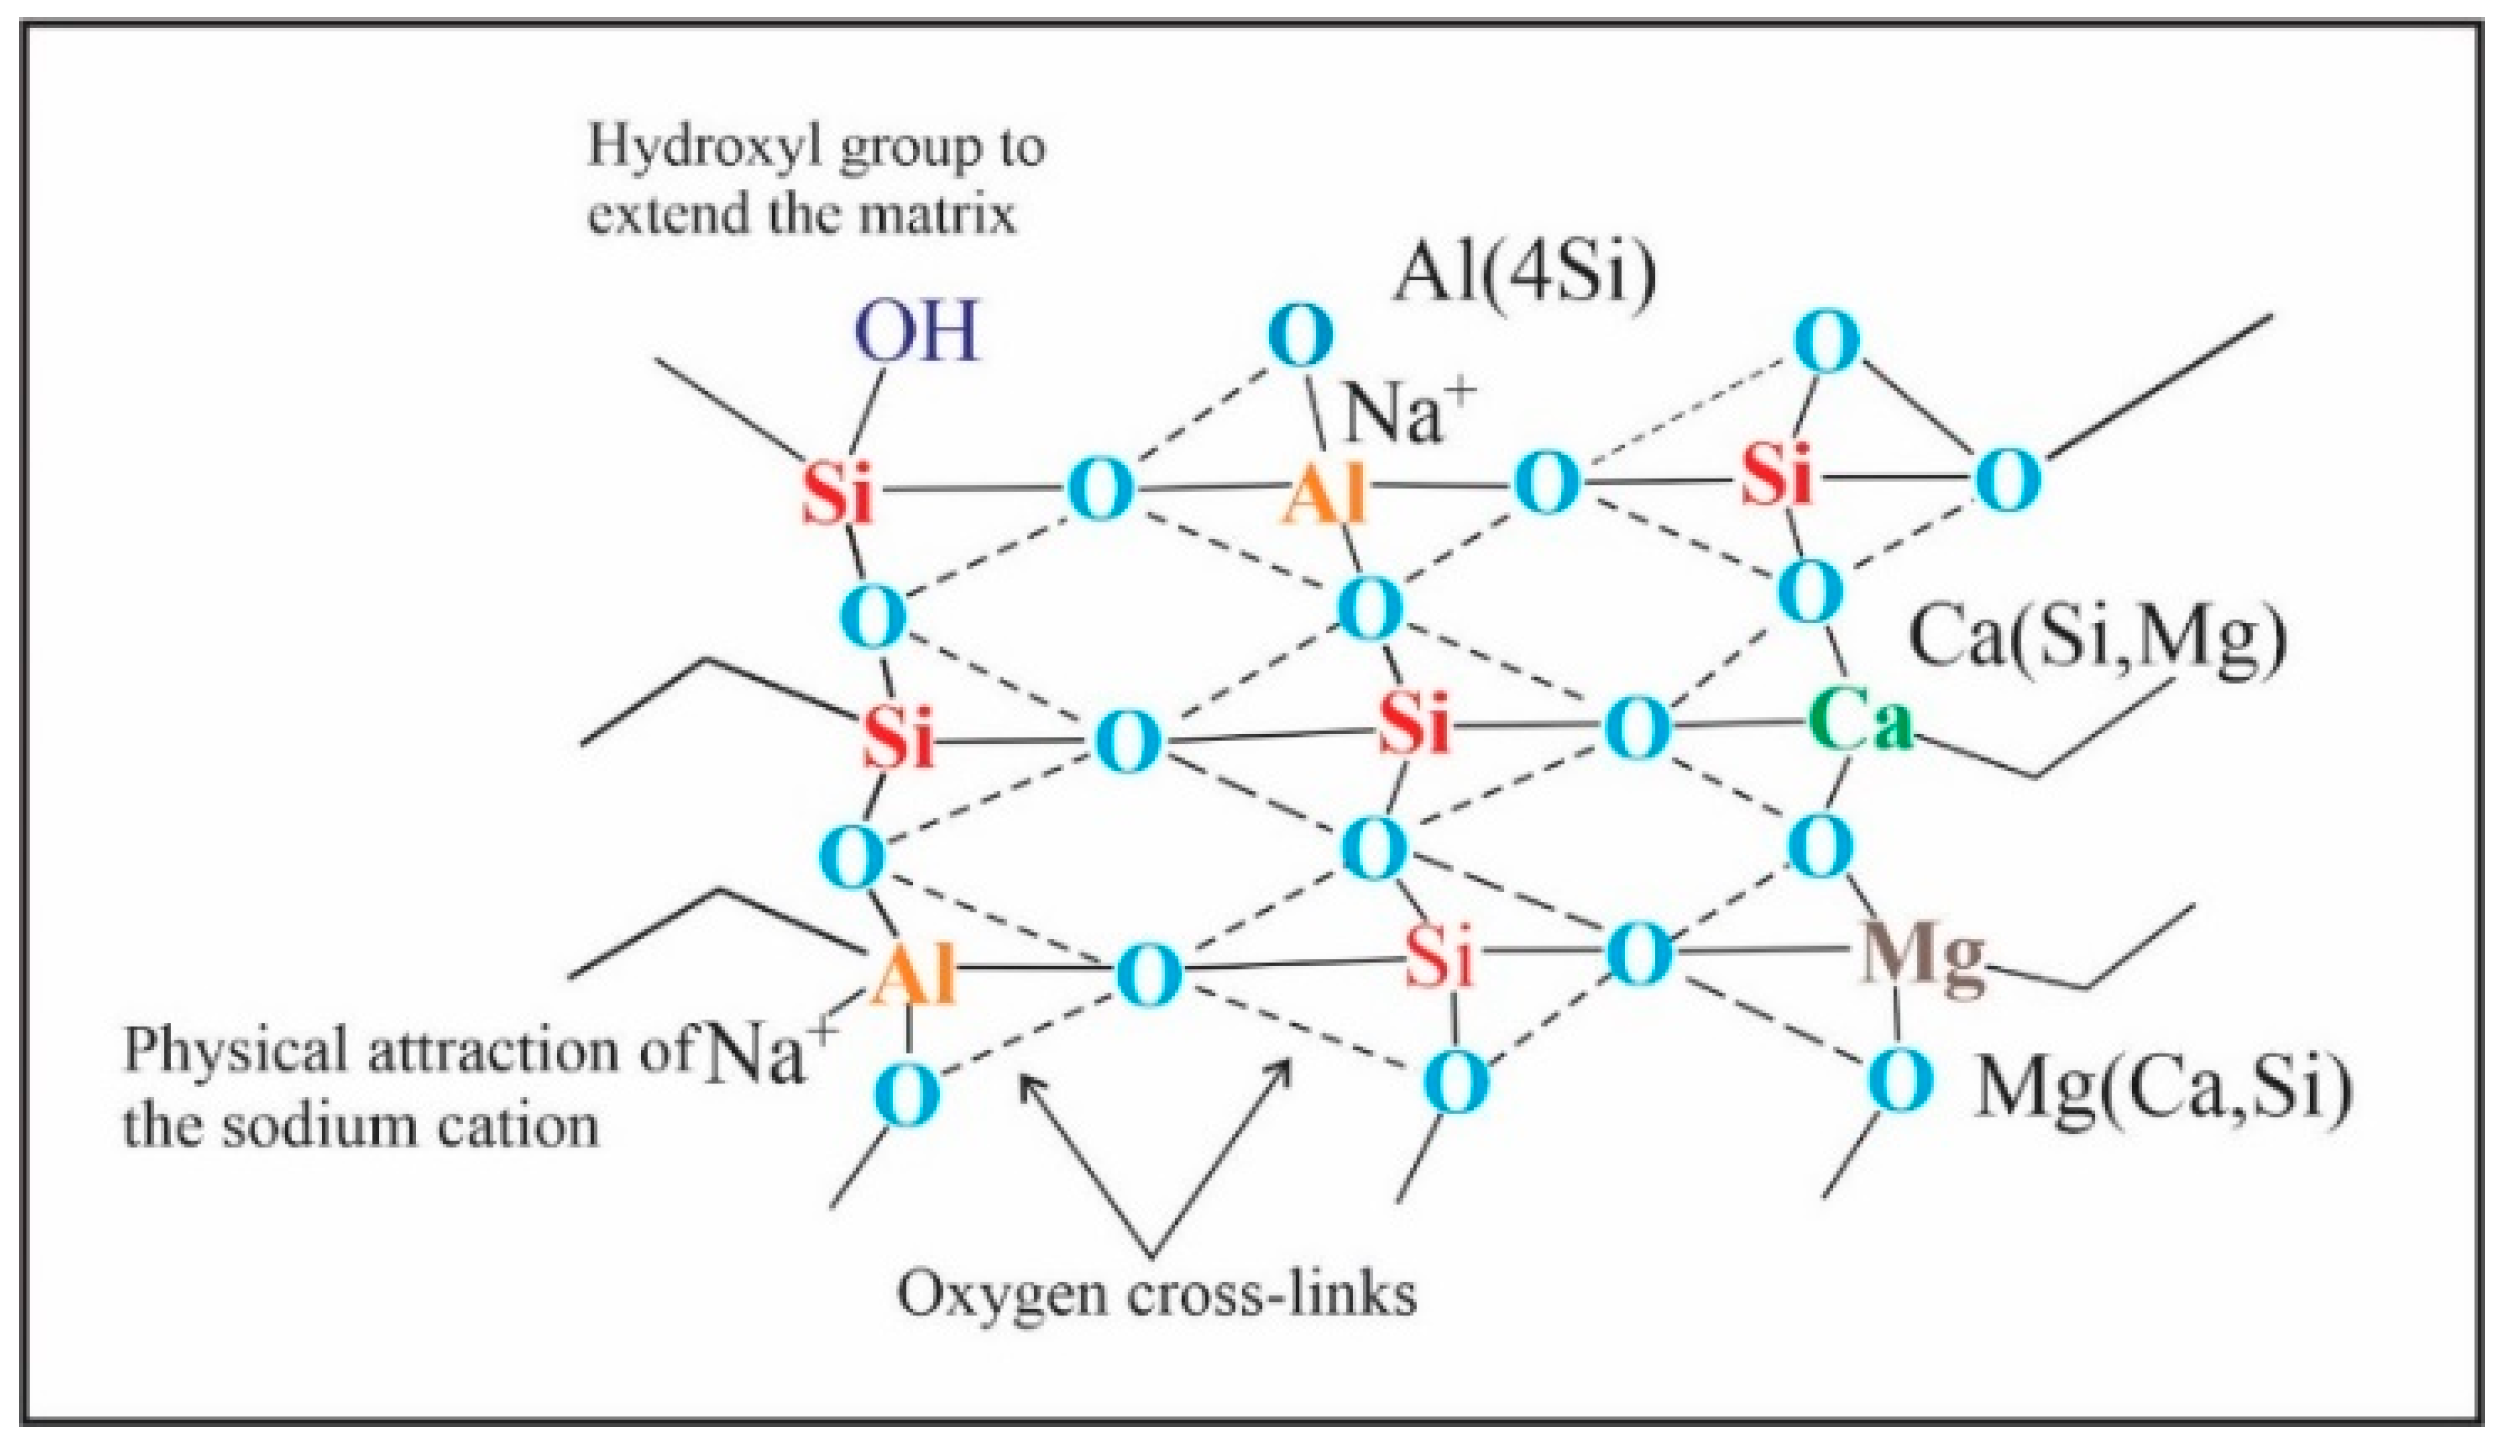
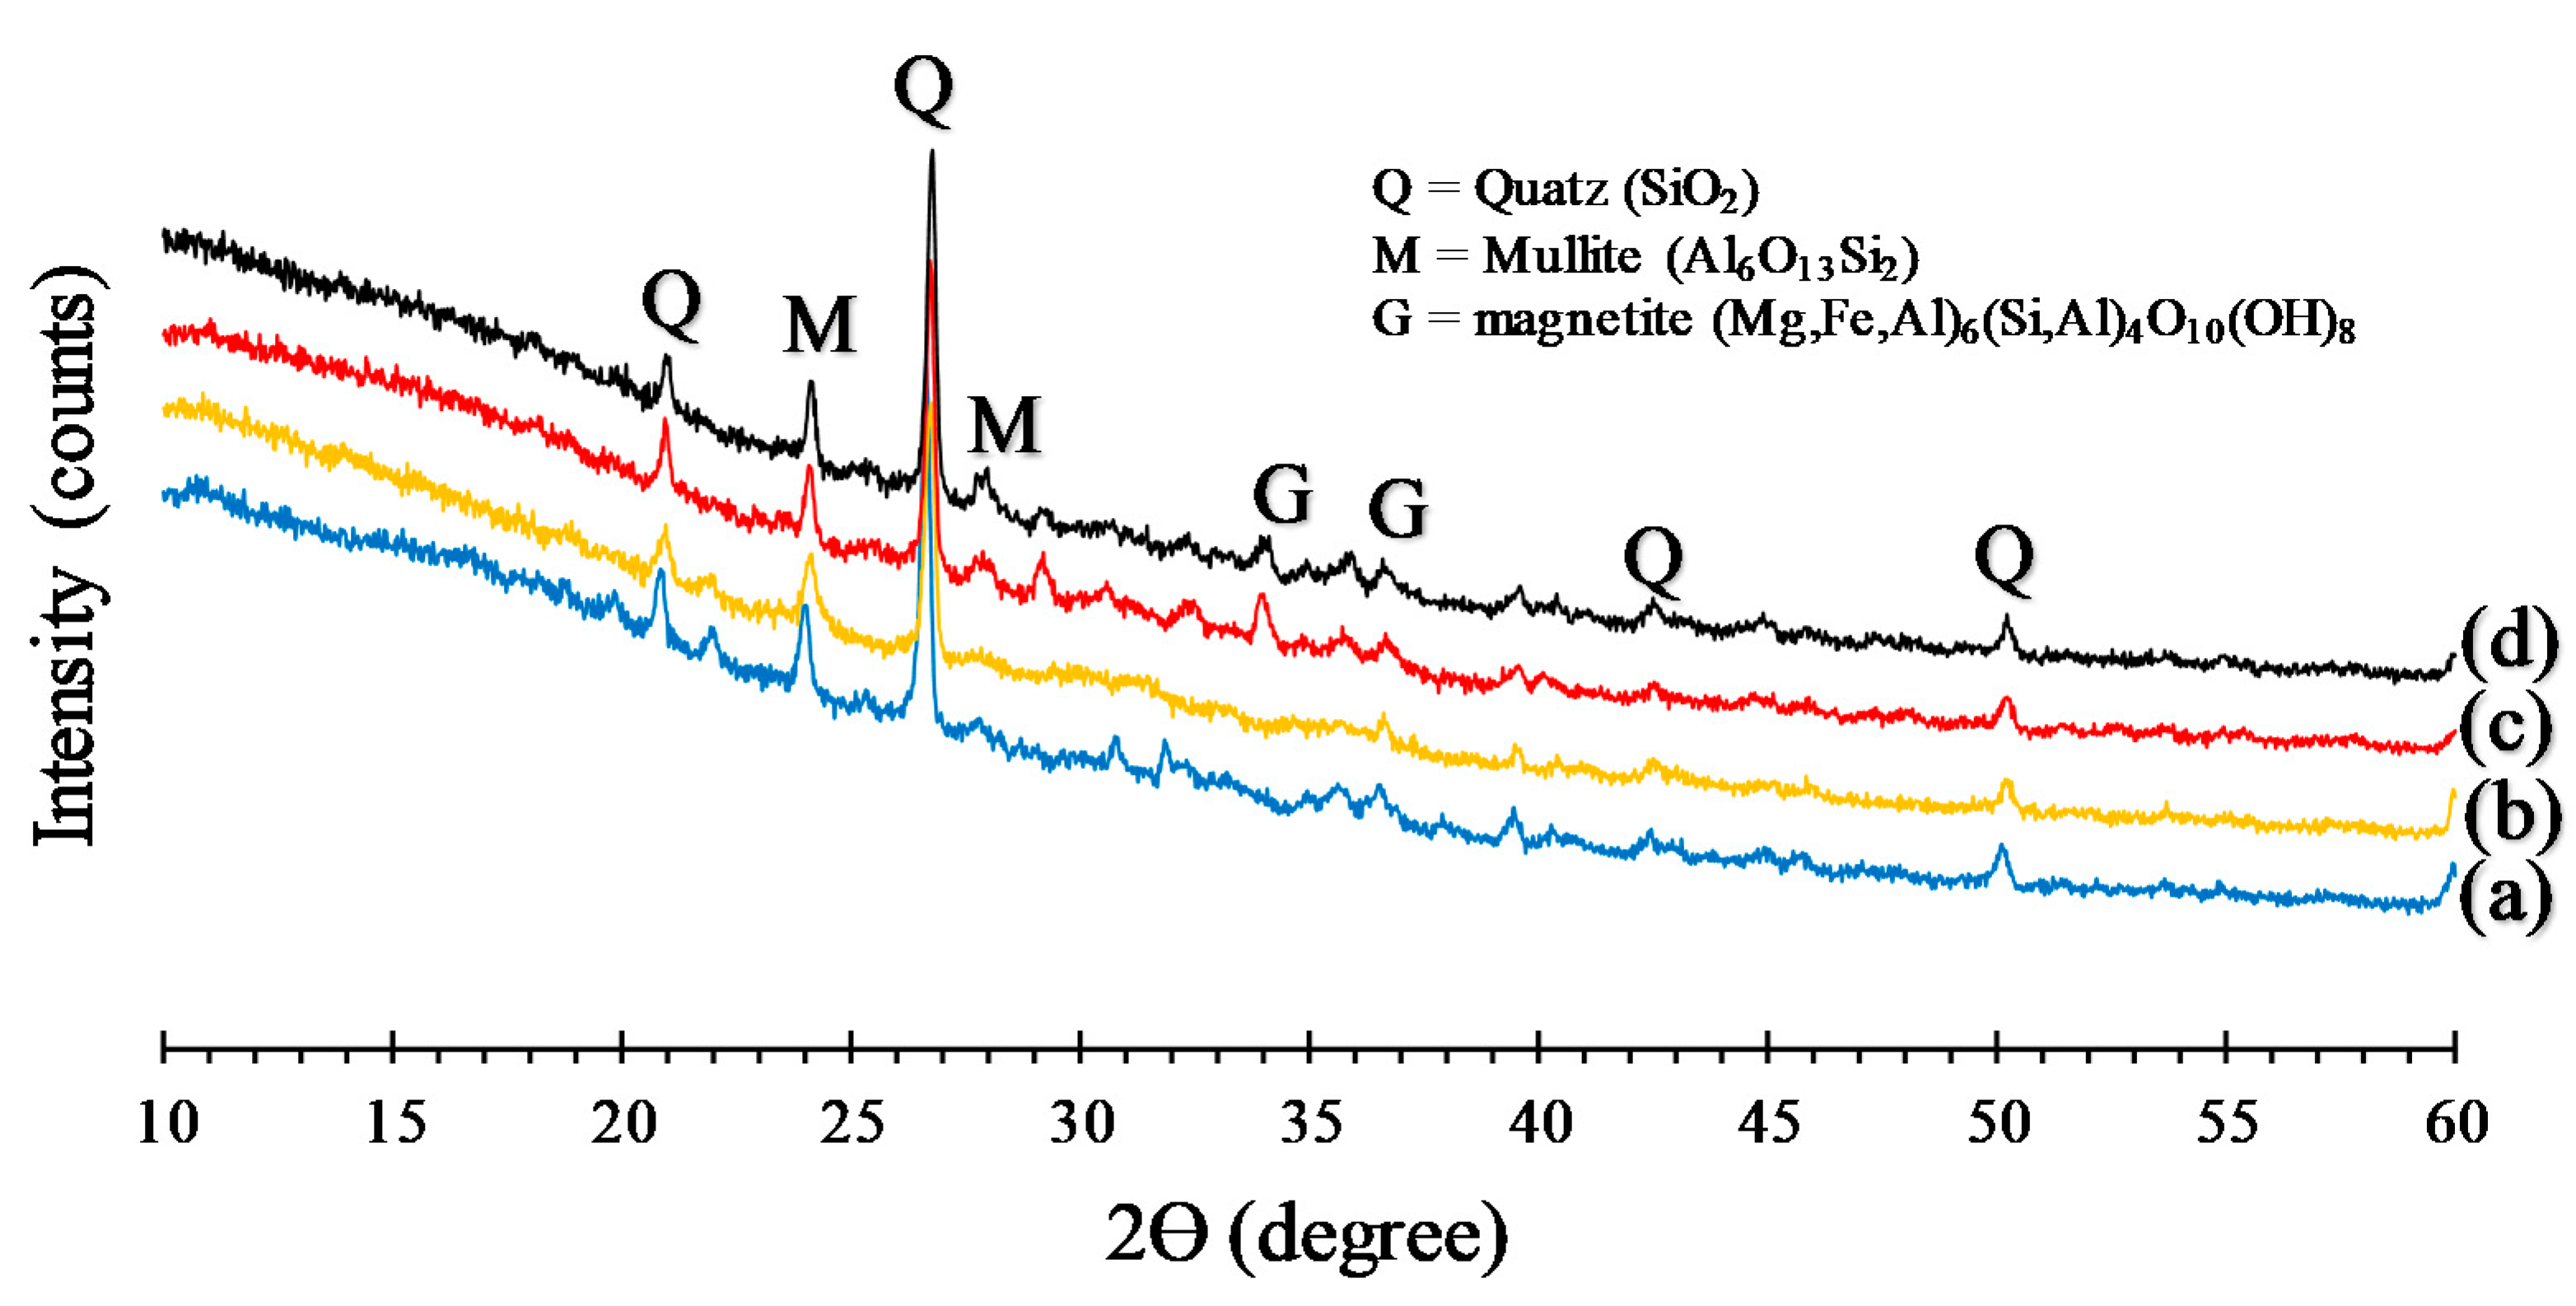
3.6. XRD Analysis
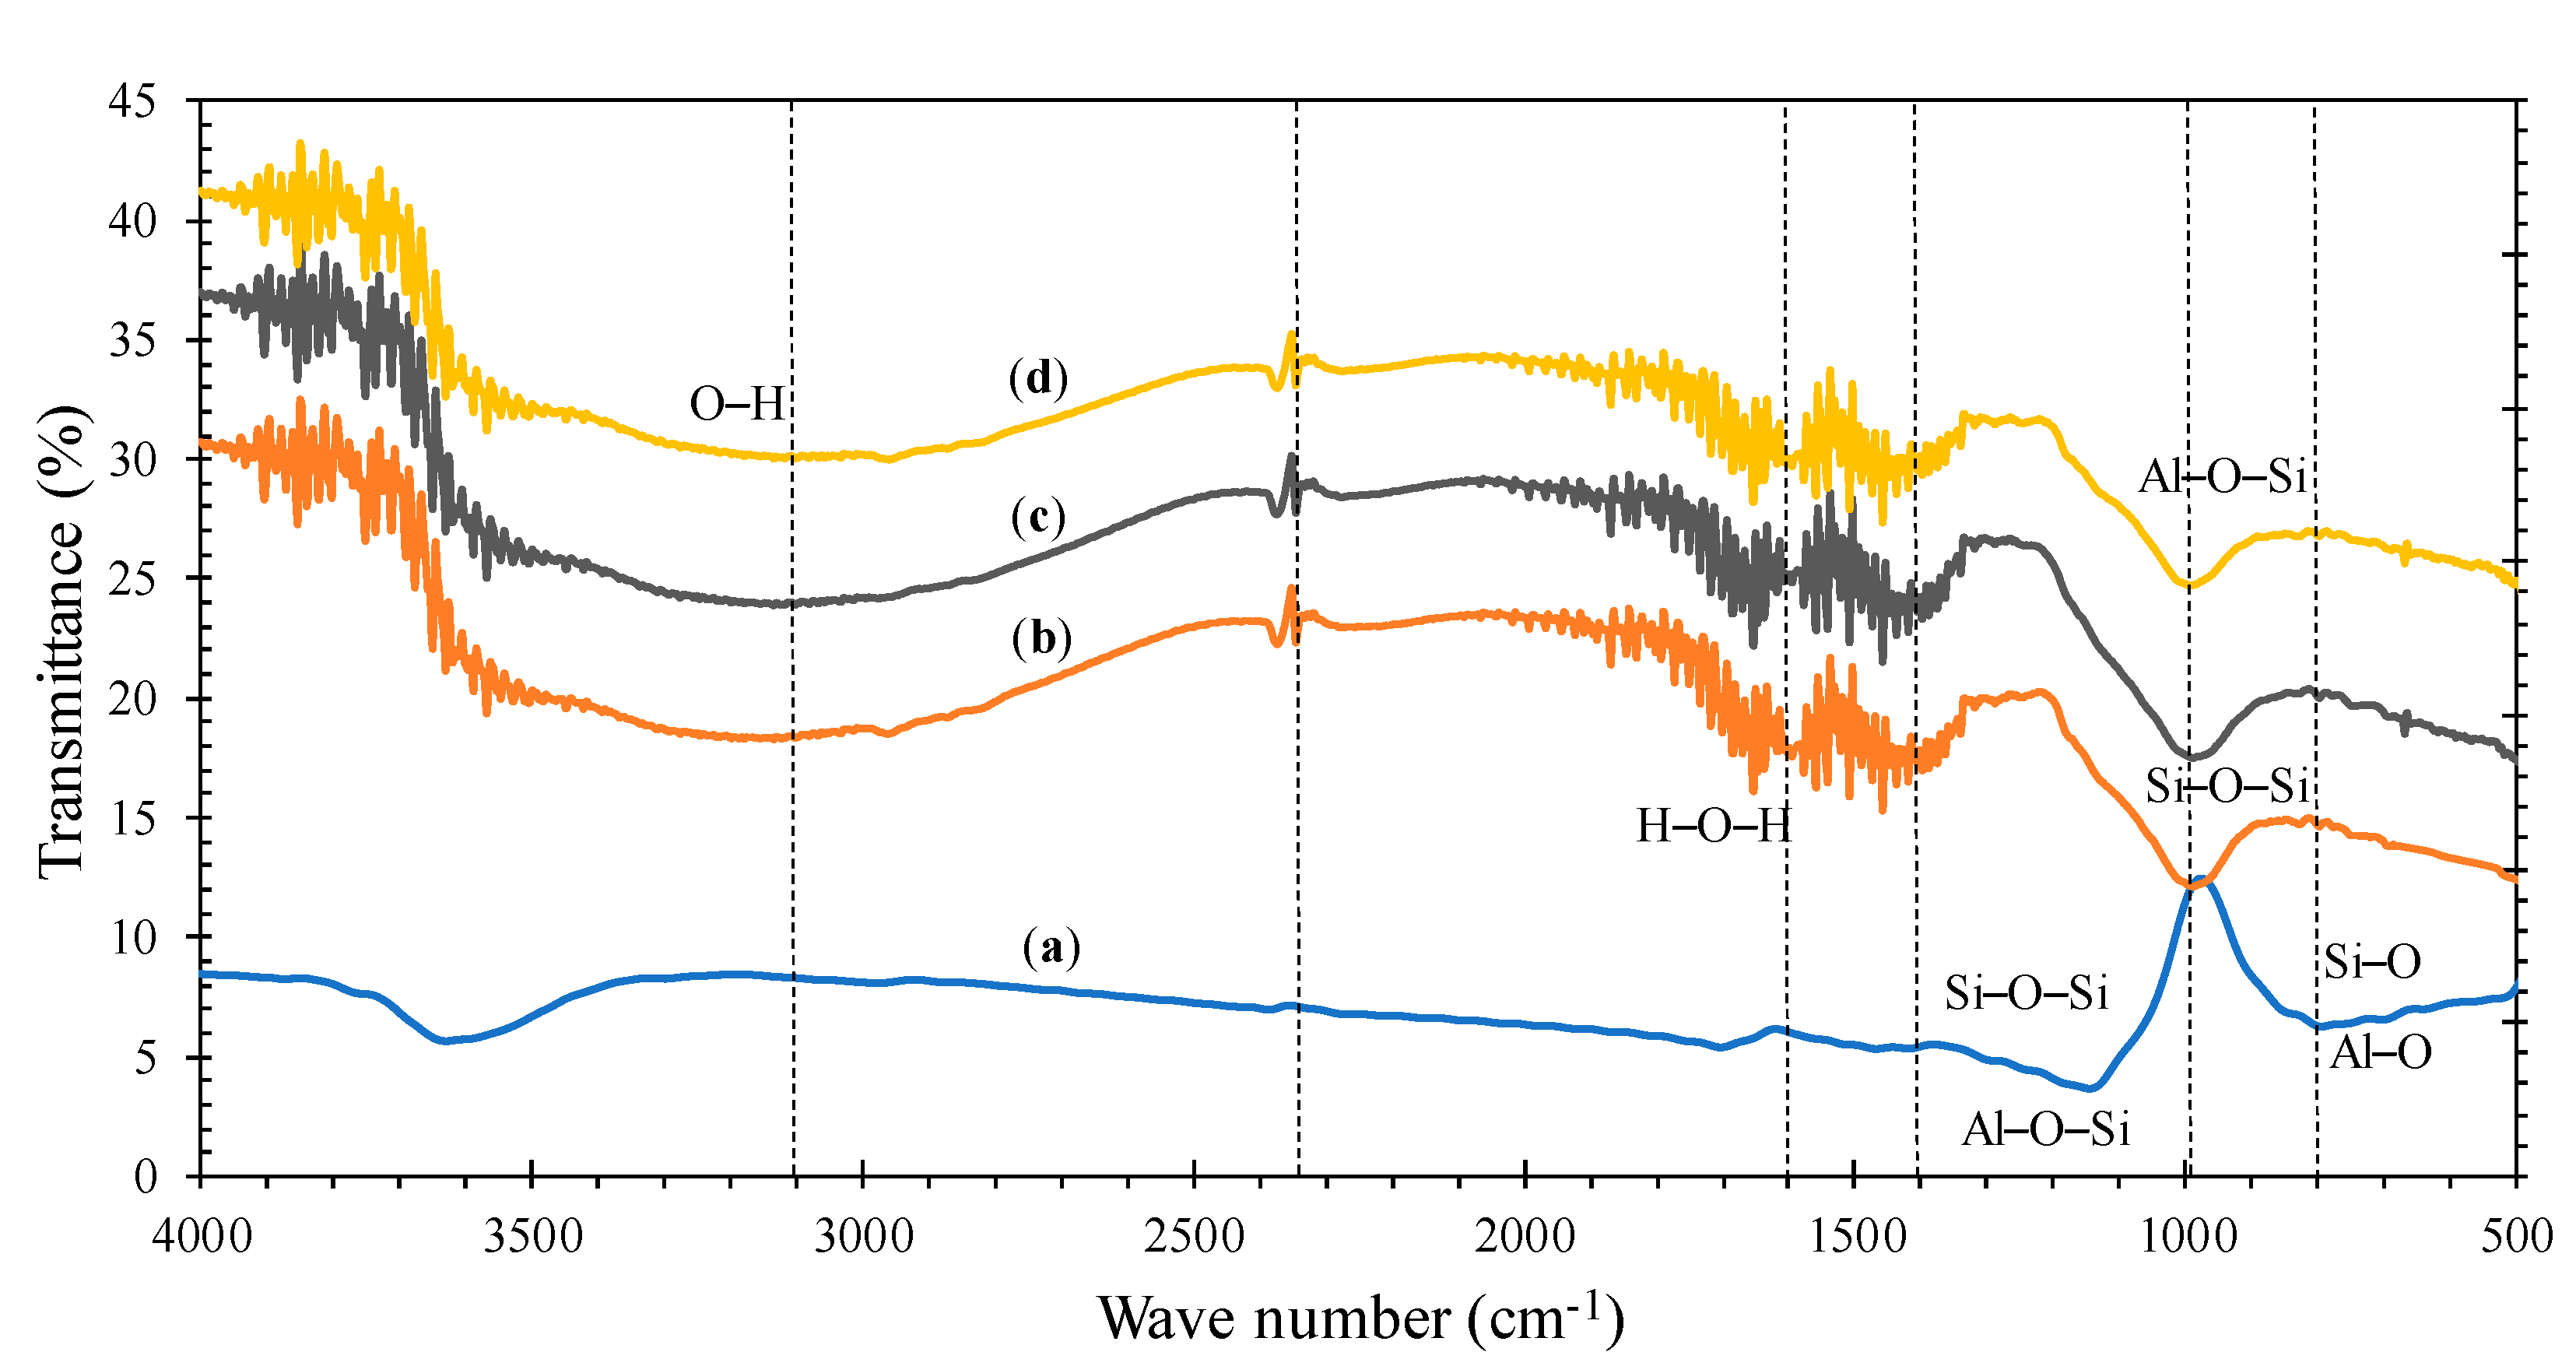
3.7. FTIR Analysis
4. Conclusions
Author Contributions
Funding
Institutional Review Board Statement
Informed Consent Statement
Data Availability Statement
Acknowledgments
Conflicts of Interest
References
- Jindal, B.B.; Sharma, R. The effect of nanomaterials on properties of geopolymers derived from industrial by-products: A state-of-the-art review. Constr. Build. Mater. 2020, 252, 119028. [Google Scholar] [CrossRef]
- Catauro, M.; Tranquillo, E.; Barrino, F.; Poggetto, G.D.; Blanco, I.; Cicala, G.; Ognibene, G.; Recca, G. Mechanical and thermal properties of fly ash-filled geopolymers. J. Therm. Anal. Calorim. 2019, 138, 3267–3276. [Google Scholar] [CrossRef]
- Blanco, I.; Cicala, G.; Tosto, C.; Recca, G.; Poggetto, G.D.; Catauro, M. Kinetic Study of the Thermal Dehydration of Fly Ash Filled Geopolymers. Macromol. Symp. 2021, 395, 2000225. [Google Scholar] [CrossRef]
- Zhang, M.-H.; Islam, J.; Peethamparan, S. Use of nano-silica to increase early strength and reduce setting time of concretes with high volumes of slag. Cem. Concr. Compos. 2012, 34, 650–662. [Google Scholar] [CrossRef]
- Aggarwal, P.; Singh, R.P.; Aggarwal, Y. Use of nano-silica in cement based materials—A review. Cogent Eng. 2015, 2, 1078018. [Google Scholar] [CrossRef]
- Quercia, G.; Spiesz, P.; Hüsken, G.; Brouwers, H.J.H. SCC modification by use of amorphous nano-silica. Cem. Concr. Compos. 2014, 45, 69–81. [Google Scholar] [CrossRef] [Green Version]
- Quercia, G.; Hüsken, G.; Brouwers, H.J.H. Water demand of amorphous nano silica and its impact on the workability of cement paste. Cem. Concr. Res. 2012, 42, 344–357. [Google Scholar] [CrossRef] [Green Version]
- Givi, A.N.; Rashid, S.A.; Aziz, F.N.A.; Salleh, M.A.M. Experimental investigation of the size effects of SiO2 nano-particles on the mechanical properties of binary blended concrete. Compos. Part B Eng. 2010, 41, 673–677. [Google Scholar] [CrossRef]
- Ibrahim, M.; Johari, M.A.M.; Maslehuddin, M.; Rahman, M.K. Influence of nano-SiO2 on the strength and microstructure of natural pozzolan based alkali activated concrete. Constr. Build. Mater. 2018, 173, 573–585. [Google Scholar] [CrossRef]
- Gao, K.; Lin, K.-L.; Wang, D.; Hwang, C.-L.; Shiu, H.-S.; Chang, Y.-M.; Cheng, T.-W. Effects SiO2/Na2O molar ratio on mechanical properties and the microstructure of nano-SiO2 metakaolin-based geopolymers. Constr. Build. Mater. 2014, 53, 503–510. [Google Scholar] [CrossRef]
- Deb, P.S.; Sarker, P.K.; Barbhuiya, S. Effects of nano-silica on the strength development of geopolymer cured at room temperature. Constr. Build. Mater. 2015, 101, 675–683. [Google Scholar] [CrossRef]
- Deb, P.S.; Sarker, P.K.; Barbhuiya, S. Sorptivity and acid resistance of ambient-cured geopolymer mortars containing nano-silica. Cem. Concr. Compos. 2016, 72, 235–245. [Google Scholar] [CrossRef] [Green Version]
- Adak, D.; Sarkar, M.; Mandal, S. Structural performance of nano-silica modified fly-ash based geopolymer concrete. Constr. Build. Mater. 2017, 135, 430–439. [Google Scholar] [CrossRef]
- Rahmawati, C.; Aprilia, S.; Saidi, T.; Aulia, T.B. Current development of geopolymer cement with nanosilica and cellulose nanocrystals. J. Phys. Conf. Ser. 2021, 1783, 012056. [Google Scholar] [CrossRef]
- Handayani, L.; Aprilia, S.; Abdullah, A.; Rahmawati, C. Synthesis of sodium silicate from rice husk ash as an activator to produce epoxy-geopolymer cements. J. Phys. Conf. Ser. 2021, 1845, 012072. [Google Scholar] [CrossRef]
- Rahmawati, C.; Aprilia, S.; Saidi, T.; Aulia, T.B. Mineralogical, Microstructural and Compressive Strength Characterization of Fly Ash as Materials in Geopolymer Cement. Elkawnie 2021, 7, 1–17. [Google Scholar]
- Roviello, G.; Ricciotti, L.; Tarallo, O.; Ferone, C.; Colangelo, F.; Roviello, V.; Cioffi, R. Innovative fly ash geopolymer-epoxy composites: Preparation, microstructure and mechanical properties. Materials 2016, 9, 461. [Google Scholar] [CrossRef] [Green Version]
- ASTM C 109; Standart Test Method for Compressive Strength of Hydrulic 557 Cement Mortar (Using 2-in or 50 mm Cube Specimens; Annual Book of 558 ASTM Standars; ASTM: West Conshohocken, PA, USA, 2001.
- ASTM D5045 − 14. In; Standard Test Methods for Plane-Strain Fracture Toughness and Strain Energy Release Rate of Plastic Materials; ASTM: West Conshohocken, PA, USA, 2014.
- Guo, X.; Yang, J. Intrinsic properties and micro-crack characteristics of ultra-high toughness fly ash/steel slag based geopolymer. Constr. Build. Mater. 2020, 230, 116965. [Google Scholar] [CrossRef]
- Paulay, T.; Priestly, M.J.N. Seismic Design of Reinforced Concrete and Masonry Buildings; John Willey and Son, Inc.: Hoboken, NJ, USA, 1992. [Google Scholar]
- Tran, K.Q.; Satomi, T.; Takahashi, H. Tensile behaviors of natural fiber and cement reinforced soil subjected to direct tensile test. J. Build. Eng. 2019, 24, 100748. [Google Scholar] [CrossRef]
- Billong, N.; Kinuthia, J.; Oti, J.; Melo, U.C. Performance of sodium silicate free geopolymers from metakaolin (MK) and Rice Husk Ash (RHA): Effect on tensile strength and microstructure. Constr. Build. Mater. 2018, 189, 307–313. [Google Scholar] [CrossRef]
- Alrefaei, Y.; Dai, J.G. Tensile behavior and microstructure of hybrid fiber ambient cured one-part engineered geopolymer composites. Constr. Build. Mater. 2018, 184, 419–431. [Google Scholar] [CrossRef]
- Vilela Rocha, V.; Ludvig, P.; Constancio Trindade, A.C.; de Andrade Silva, F. The influence of carbon nanotubes on the fracture energy, flexural and tensile behavior of cement based composites. Constr. Build. Mater. 2019, 209, 1–8. [Google Scholar] [CrossRef]
- Phoo-ngernkham, T.; Chindaprasirt, P.; Sata, V.; Hanjitsuwan, S.; Hatanaka, S. The effect of adding nano-SiO2 and nano-Al2O3 on properties of high calcium fly ash geopolymer cured at ambient temperature. Mater. Des. 2014, 55, 58–65. [Google Scholar] [CrossRef]
- Stefanidou, M.; Papayianni, I. Influence of nano-SiO2 on the Portland cement pastes. Compos. Part B Eng. 2012, 43, 2706–2710. [Google Scholar] [CrossRef]
- Alomayri, T. Experimental study of the microstructural and mechanical properties of geopolymer paste with nano material (Al2O3). J. Build. Eng. 2019, 25, 100788. [Google Scholar] [CrossRef]
- Phoo-ngernkham, T.; Chindaprasirt, P.; Sata, V.; Pangdaeng, S.; Sinsiri, T. Properties of high calcium fly ash geopolymer pastes with Portland cement as an additive. Int. J. Miner. Metall. Mater. 2013, 20, 214–220. [Google Scholar] [CrossRef]
- Chindaprasirt, P.; De Silva, P.; Sagoe-Crentsil, K.; Hanjitsuwan, S. Effect of SiO2 and Al2O3 on the setting and hardening of high calcium fly ash-based geopolymer systems. J. Mater. Sci. 2012, 47, 4876–4883. [Google Scholar] [CrossRef]
- Kanny, K.; Mohan, T.P. Resin infusion analysis of nanoclay filled glass fiber laminates. Compos. Part B Eng. 2014, 58, 328–334. [Google Scholar] [CrossRef]
- Hakamy, A.; Shaikh, F.U.A.; Low, I.M. Characteristics of nanoclay and calcined nanoclay-cement nanocomposites. Compos. Part B Eng. 2015, 78, 174–184. [Google Scholar] [CrossRef] [Green Version]
- Alamri, H.; Low, I.M.; Alothman, Z.A. Mechanical, thermal and microstructural characteristics of cellulose fibre reinforced epoxy/organoclay nanocomposites. Compos. Part B Eng. 2012, 43, 2762–2771. [Google Scholar] [CrossRef]
- Hakamy, A.; Shaikh, F.U.A.; Low, I.M. Thermal and mechanical properties of hemp fabric-reinforced nanoclay–cement nanocomposites. J. Mater. Sci. 2014, 49, 1684–1694. [Google Scholar] [CrossRef] [Green Version]
- Onuaguluchi, O.; Panesar, D.; Sain, M. Properties of nanofibre reinforced cement composites. Constr. Build. Mater. 2014, 63, 119–124. [Google Scholar] [CrossRef]
- Hunger, M.; Entrop, A.G.; Mandilaras, I.; Brouwers, H.J.H.; Founti, M. The behavior of self-compacting concrete containing micro-encapsulated Phase Change Materials. Cem. Concr. Compos. 2009, 31, 731–743. [Google Scholar] [CrossRef]
- Alomayri, T.; Shaikh, F.U.A.; Low, I.M. Characterisation of cotton fibre-reinforced geopolymer composites. Compos. Part B Eng. 2013, 50, 1–6. [Google Scholar] [CrossRef] [Green Version]
- Alomayri, T.; Shaikh, F.U.A.; Low, I.M. Mechanical and thermal properties of ambient cured cotton fabric-reinforced fly ash-based geopolymer composites. Ceram. Int. 2014, 40, 14019–14028. [Google Scholar] [CrossRef]
- Khater, H.; El-Sabbagh, B.; Fanny, M.; Ezzat, M.; Lottfy, M. Effect of Nano-Silica on Alkali Activated Water-Cooled Slag Geopolymer. ARPN J. Sci. Technol. 2012, 2, 170–176. [Google Scholar]
- Kumar, S.; Kumar, R.; Mehrotra, S.P. Influence of granulated blast furnace slag on the reaction, structure and properties of fly ash based geopolymer. J. Mater. Sci. Vol. 2010, 45, 607–615. [Google Scholar] [CrossRef]
- Nath, S.K.; Kumar, S. Influence of iron making slags on strength and microstructure of fly ash geopolymer. Constr. Build. Mater. 2013, 38, 924–930. [Google Scholar] [CrossRef]
- Nath, P.; Sarker, P. Effect of GGBFS on setting, workability and early strength properties of fly ash geopolymer concrete cured in ambient condition. Constr. Build. Mater. 2014, 66, 163–171. [Google Scholar] [CrossRef] [Green Version]
- Fernandez-Jimenez, A.; García-Lodeiro, I.; Palomo, A. Durability of alkali-activated fly ash cementitious materials. J. Mater. Sci. 2007, 42, 3055–3065. [Google Scholar] [CrossRef]
- Davidovits, J. Properties of geopolymer cements. In Proceedings of the International conference on Alkaline Cements and Concretes, Kiev, Ukraine, 11 October 1994; pp. 1–19. [Google Scholar]
- Bouaissi, A.; Li, L.; Abdullah, M.M.A.B.; Bui, Q.-B. Mechanical properties and microstructure analysis of FA-GGBS-HMNS based geopolymer concrete. Constr. Build. Mater. 2019, 210, 198–209. [Google Scholar] [CrossRef]
- Ahmari, S.; Ren, X.; Toufigh, V.; Zhang, L. Production of geopolymeric binder from blended waste concrete powder and fly ash. Constr. Build. Mater. 2012, 35, 718–729. [Google Scholar] [CrossRef]
- Assaedi, H.; Shaikh, F.U.A.; Low, I.M. Characterizations of flax fabric reinforced nanoclay-geopolymer composites. Compos. Part B Eng. 2016, 95, 412–422. [Google Scholar] [CrossRef]
- Cheng-Yong, H.; Yun-Ming, L.; Abdullah, M.M.A.B.; Hussin, K. Thermal Resistance Variations of Fly Ash Geopolymers: Foaming Responses. Sci. Rep. 2017, 7, 45355. [Google Scholar] [CrossRef]
- Yunsheng, Z.; Wei, S.; Qianli, C.; Lin, C. Synthesis and heavy metal immobilization behaviors of slag based geopolymer. J. Hazard. Mater. 2007, 143, 206–213. [Google Scholar] [CrossRef]
- Fernández-Jiménez, A.; Puertas, F. Effect of activator mix on the hydration and strength behaviour of alkali-activated slag cements. Adv. Cem. Res. 2003, 15, 129–136. [Google Scholar] [CrossRef]
- Komnitsas, K.; Zaharaki, D.; Perdikatsis, V. Geopolymerisation of low calcium ferronickel slags. J. Mater. Sci. 2007, 42, 3073–3082. [Google Scholar] [CrossRef]
- Gharzouni, A.; Vidal, L.; Essaidi, N.; Joussein, E.; Rossignol, S. Recycling of geopolymer waste: Influence on geopolymer formation and mechanical properties. Mater. Des. 2016, 94, 221–229. [Google Scholar] [CrossRef]
- Tatzber, M.; Stemmer, M.; Spiegel, H.; Katzlberger, C.; Haberhauer, G.; Mentler, A.; Gerzabek, M.H. FTIR-spectroscopic characterization of humic acids and humin fractions obtained by advanced NaOH, Na4P2O7, and Na2CO3 extraction procedures. J. Plant Nutr. Soil Sci. 2007, 170, 522–529. [Google Scholar] [CrossRef]


| Chemical Analysis | Class C Fly Ash a (wt%) | Nanosilica (wt%) |
|---|---|---|
| SiO2 | 21.07 | 91.78 |
| Al2O3 | 9.65 | - |
| Fe2O3 | 27.23 | 0.15 |
| CaO | 32.58 | 2.09 |
| MnO | 0.44 | 0.18 |
| K2O | 1.17 | 4.11 |
| SO3 | 5.69 | 1.43 |
| TiO2 | 1.68 | - |
| Cl | 0.22 | - |
| Ag2O | 0.23 | - |
| Yb2O3 | 0.09 | - |
| P2O5 | - | 0.13 |
| SiO | - | 0.13 |
| Thermophysical Properties | Materials/Value | |
|---|---|---|
| Fly Ash | Nanosilica | |
| Size average | 30 µm | 339.09 nm |
| Density | 2.45 gr/cm3 | 3.41 g/cc |
| Surface area | - | 28.566 m²/g |
| Pore Radius | - | 1.320 × 10 Å |
| Temperature onsite | 57.04 °C | 736.09 °C |
| Weight loss 600 °C | 6.58% | 1.3% |
| Material properties from XRD | Crystallinity (64.9%), amorf (35.09%) | semi-crystalline |
| Specimens | Fly Ash | NaOH Solution | Na2SiO3 Solution | Epoxy Resin | Water | Nanosilica | Nanosilica Content |
|---|---|---|---|---|---|---|---|
| (g) | (g) | (g) | (g) | (mL) | (g) | (wt%) | |
| 1 | 1000 | 260 | 260 | 434 | 650 | 0 | 0 |
| 2 | 980 | 260 | 260 | 434 | 650 | 20 | 2 |
| 3 | 970 | 260 | 260 | 434 | 650 | 30 | 3 |
| 4 | 960 | 260 | 260 | 434 | 650 | 40 | 4 |
| Nanosilica Content (wt%) | Strength of Geopolymer Paste (MPa) | Ratio (%) | ||||
|---|---|---|---|---|---|---|
| Compressive | Flexural | Tensile | Flexural to Compressive Strength | Tensile Strength to Compressive Strength | Tensile to Flexural Strength | |
| 0 | 21.47 ± 1.12 | 1.44 ± 0.16 | 1.37 ± 0.01 | 7 | 6 | 95 |
| 2 | 26.26 ± 1.03 | 2.62 ± 0.16 | 0.95 ± 0.02 | 10 | 4 | 36 |
| 3 | 25.50 ± 1.33 | 1.07 ± 0.29 | 0.82 ± 0.06 | 4 | 3 | 76 |
| 4 | 18.16 ± 0.56 | 0.45 ± 0.04 | 0.77 ± 0.02 | 2 | 4 | 171 |
Publisher’s Note: MDPI stays neutral with regard to jurisdictional claims in published maps and institutional affiliations. |
© 2021 by the authors. Licensee MDPI, Basel, Switzerland. This article is an open access article distributed under the terms and conditions of the Creative Commons Attribution (CC BY) license (https://creativecommons.org/licenses/by/4.0/).
Share and Cite
Rahmawati, C.; Aprilia, S.; Saidi, T.; Aulia, T.B.; Hadi, A.E. The Effects of Nanosilica on Mechanical Properties and Fracture Toughness of Geopolymer Cement. Polymers 2021, 13, 2178. https://doi.org/10.3390/polym13132178
Rahmawati C, Aprilia S, Saidi T, Aulia TB, Hadi AE. The Effects of Nanosilica on Mechanical Properties and Fracture Toughness of Geopolymer Cement. Polymers. 2021; 13(13):2178. https://doi.org/10.3390/polym13132178
Chicago/Turabian StyleRahmawati, Cut, Sri Aprilia, Taufiq Saidi, Teuku Budi Aulia, and Agung Efriyo Hadi. 2021. "The Effects of Nanosilica on Mechanical Properties and Fracture Toughness of Geopolymer Cement" Polymers 13, no. 13: 2178. https://doi.org/10.3390/polym13132178
APA StyleRahmawati, C., Aprilia, S., Saidi, T., Aulia, T. B., & Hadi, A. E. (2021). The Effects of Nanosilica on Mechanical Properties and Fracture Toughness of Geopolymer Cement. Polymers, 13(13), 2178. https://doi.org/10.3390/polym13132178