
Synthesis and Study of the Optical Properties of PMMA Microspheres and Opals

 ,
,
Abstract
:1. Introduction
2. Materials and Methods
2.1. Materials
2.2. Synthesis of PMMA Microspheres
2.3. Preparation of PMMA Opals
2.4. Materials Characterization
3. Results and Discussion
3.1. PMMA Microspheres
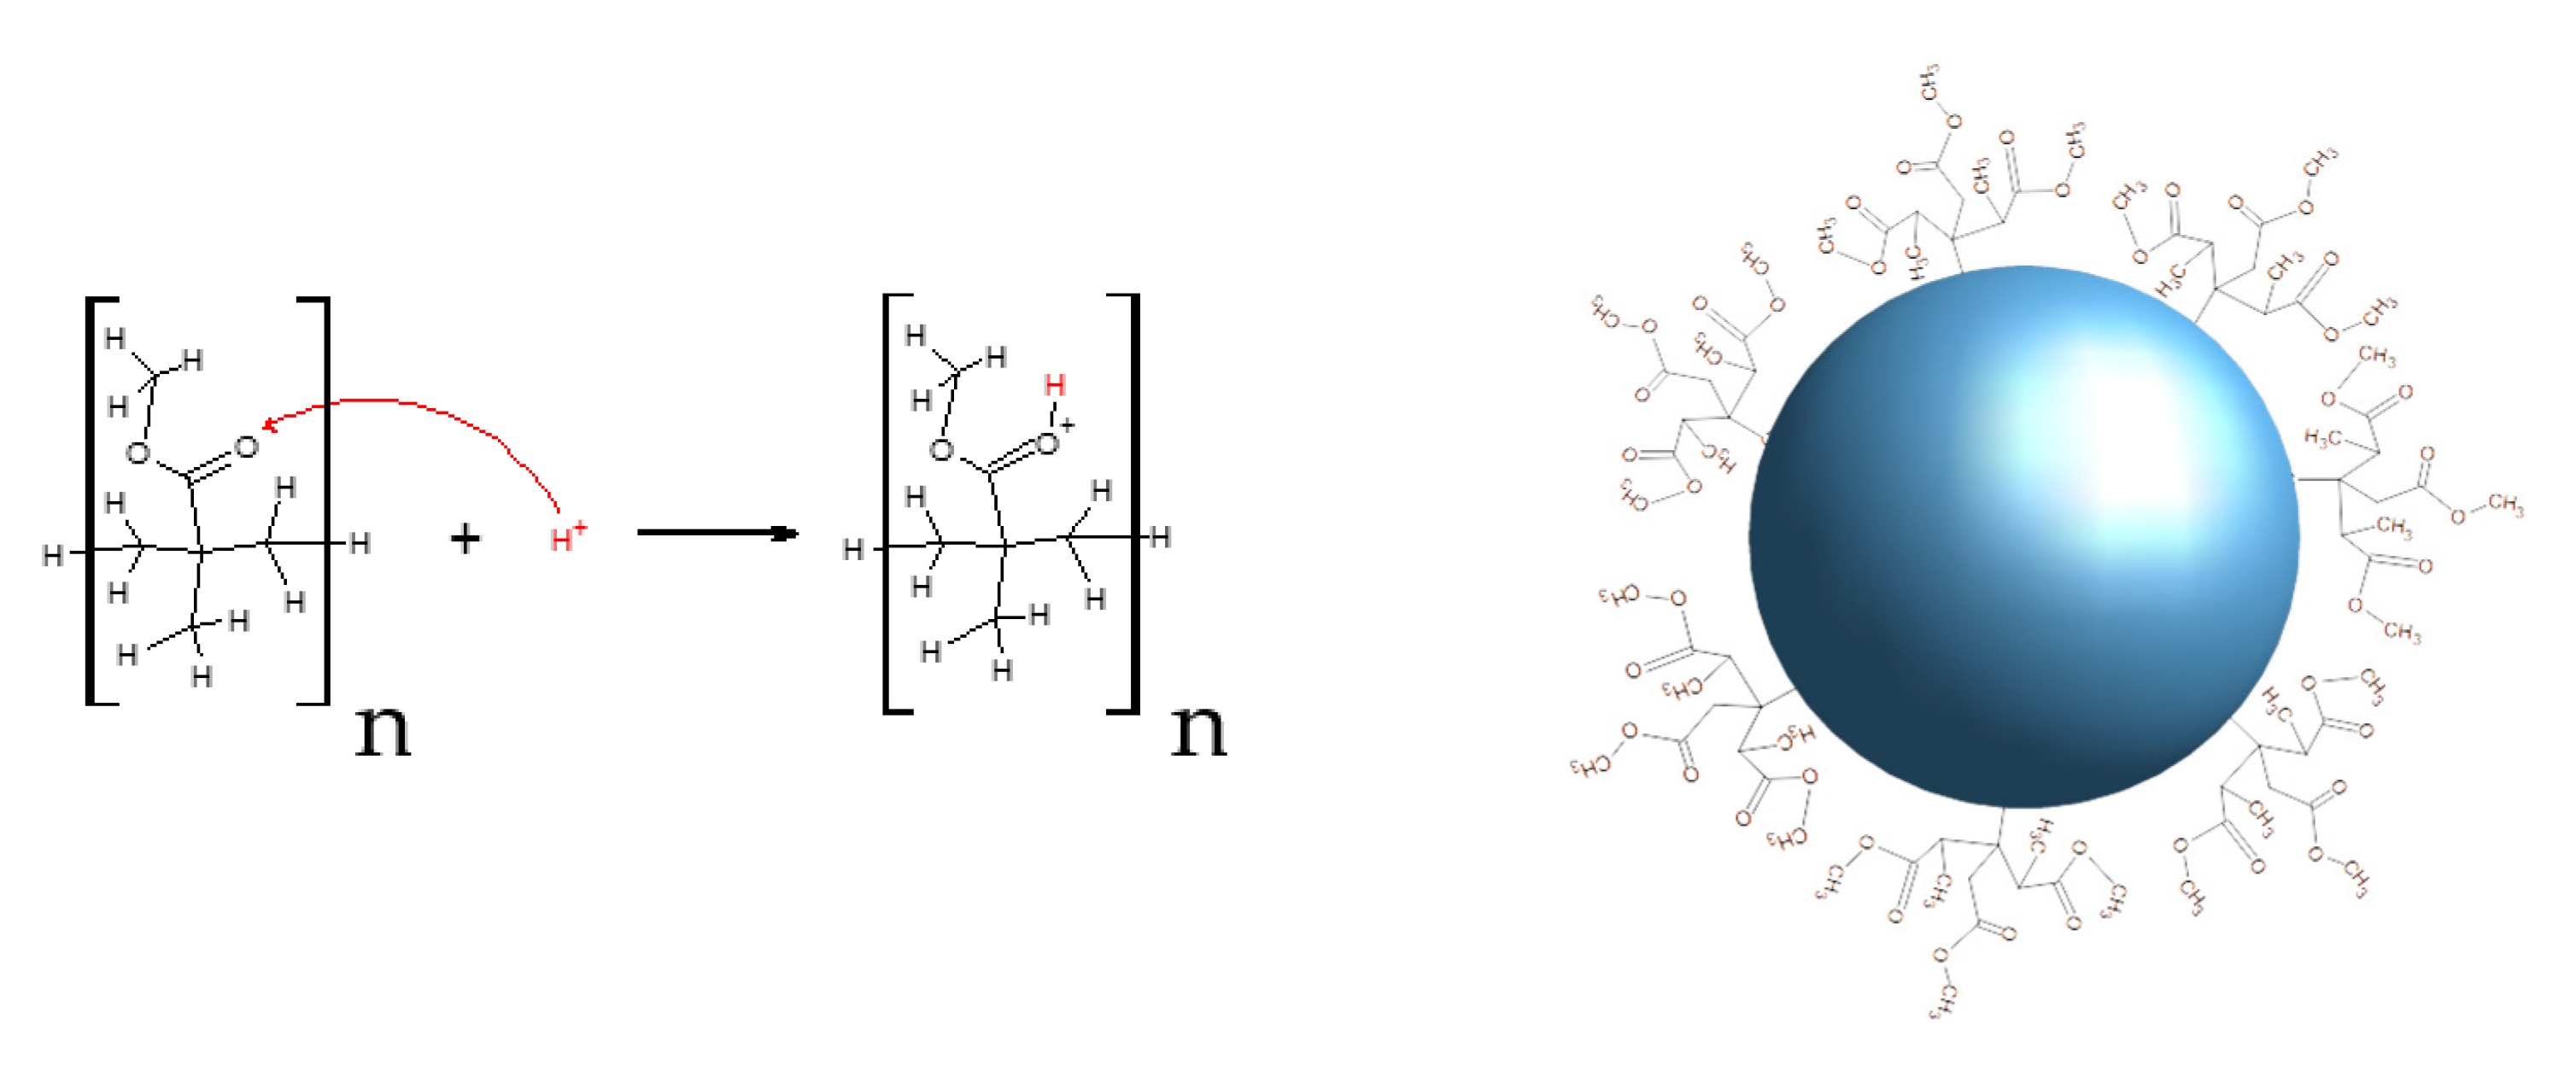
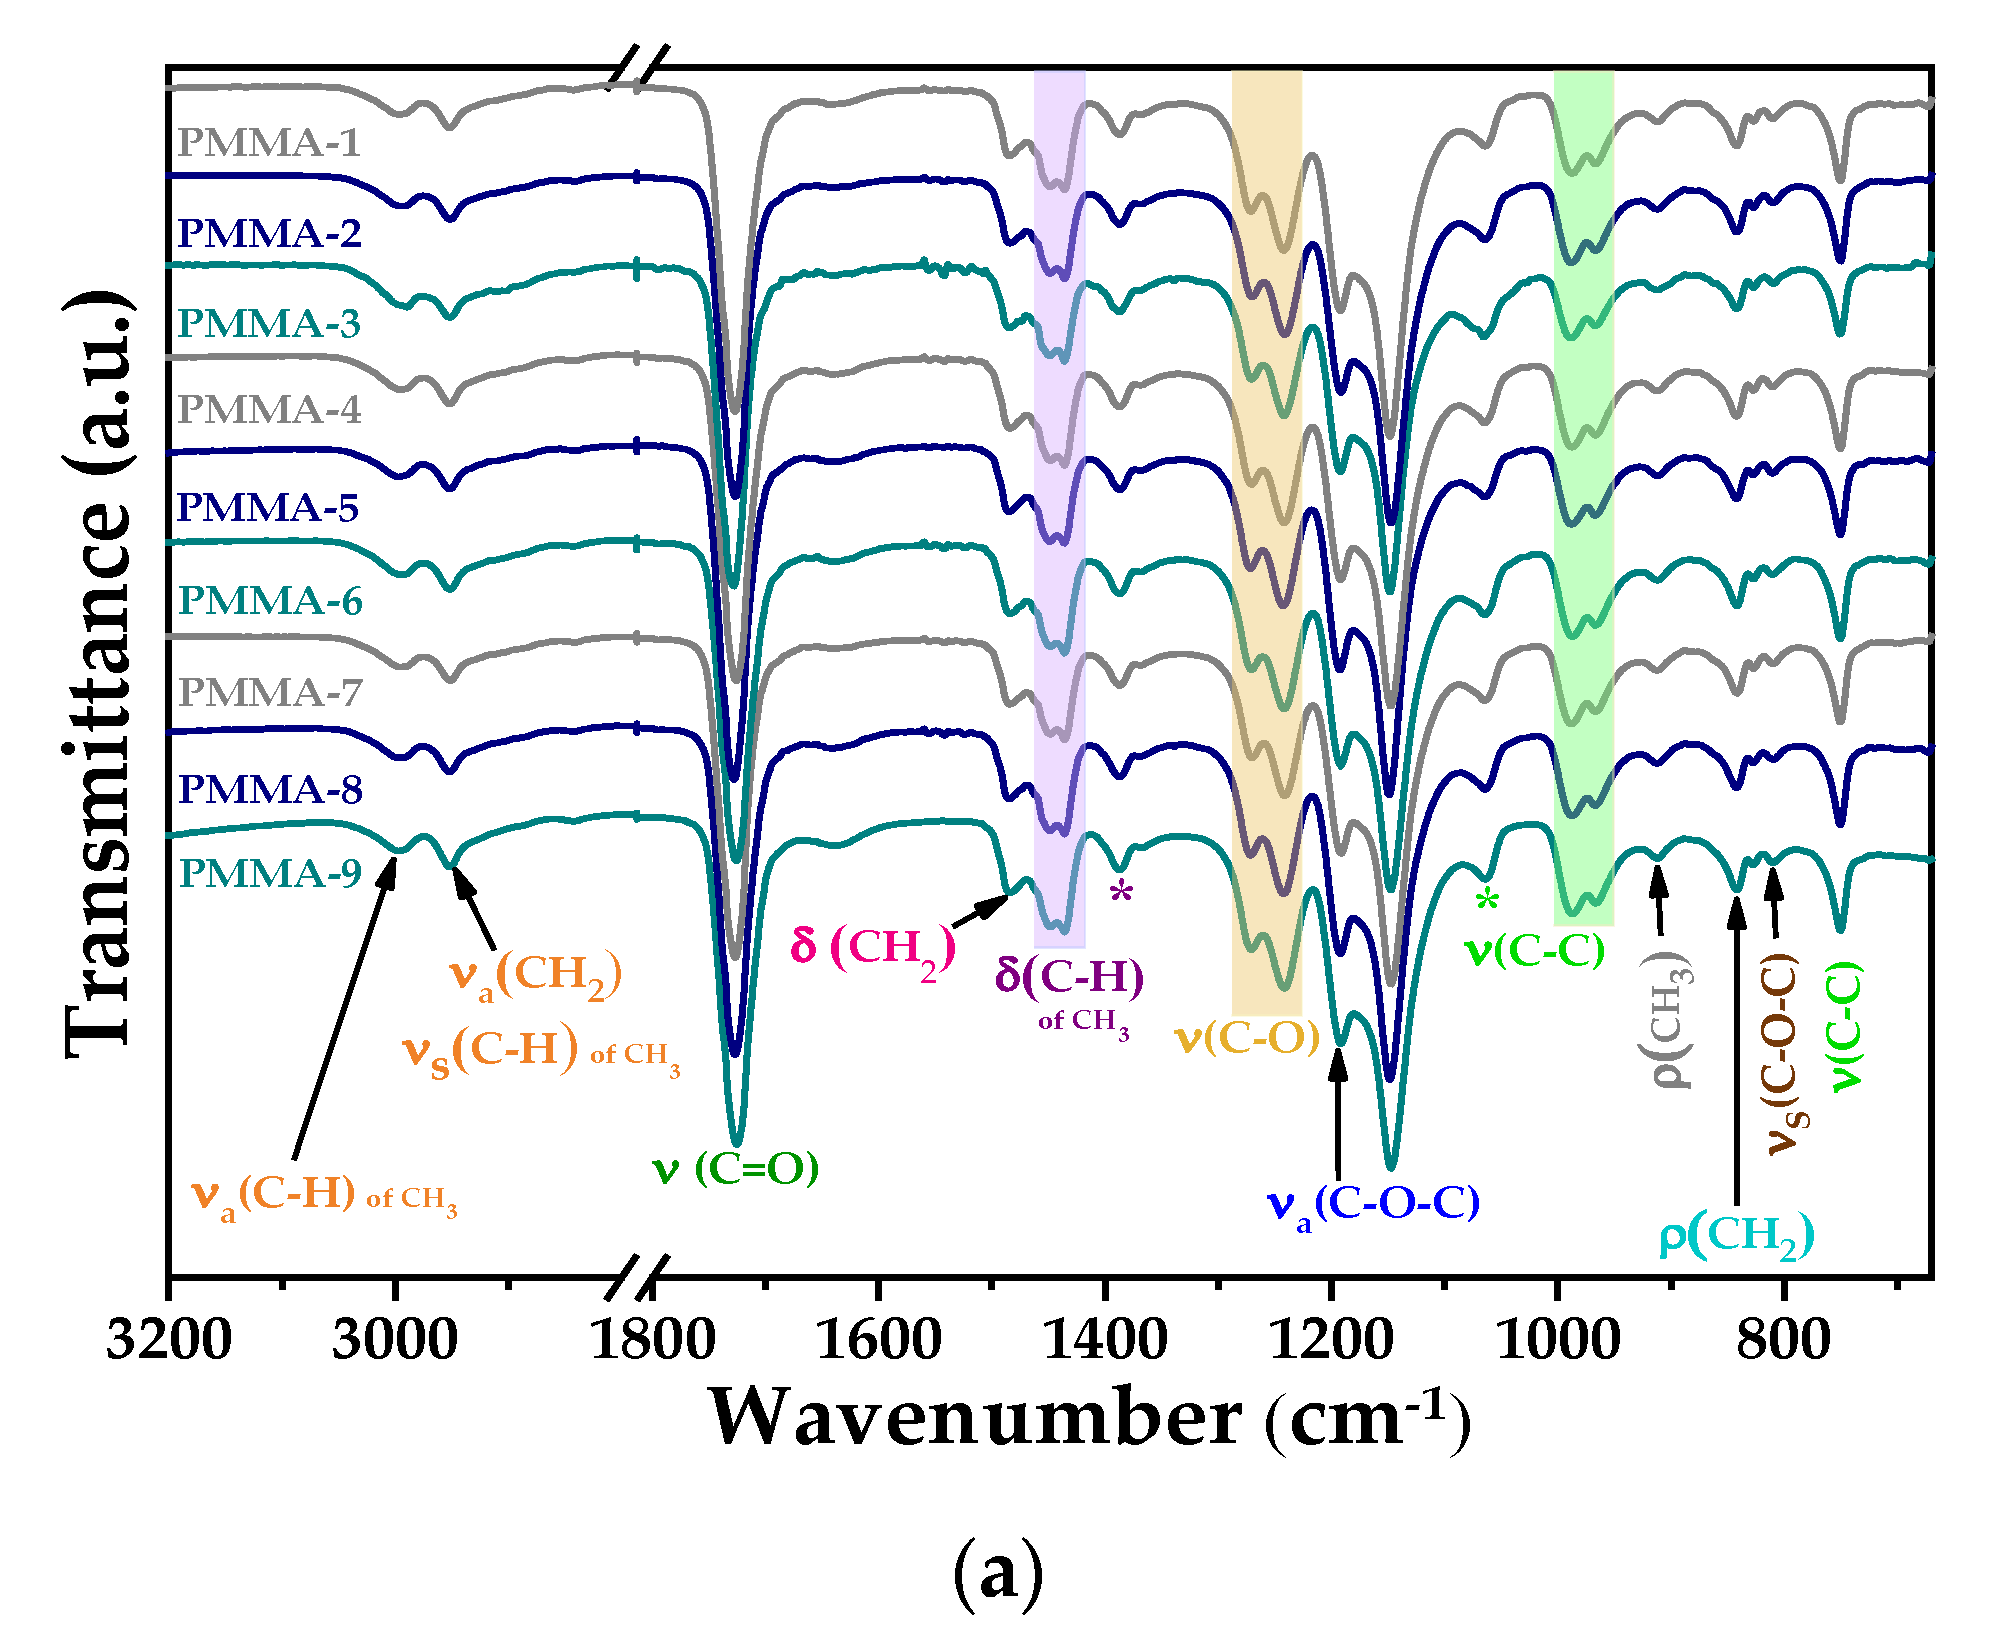
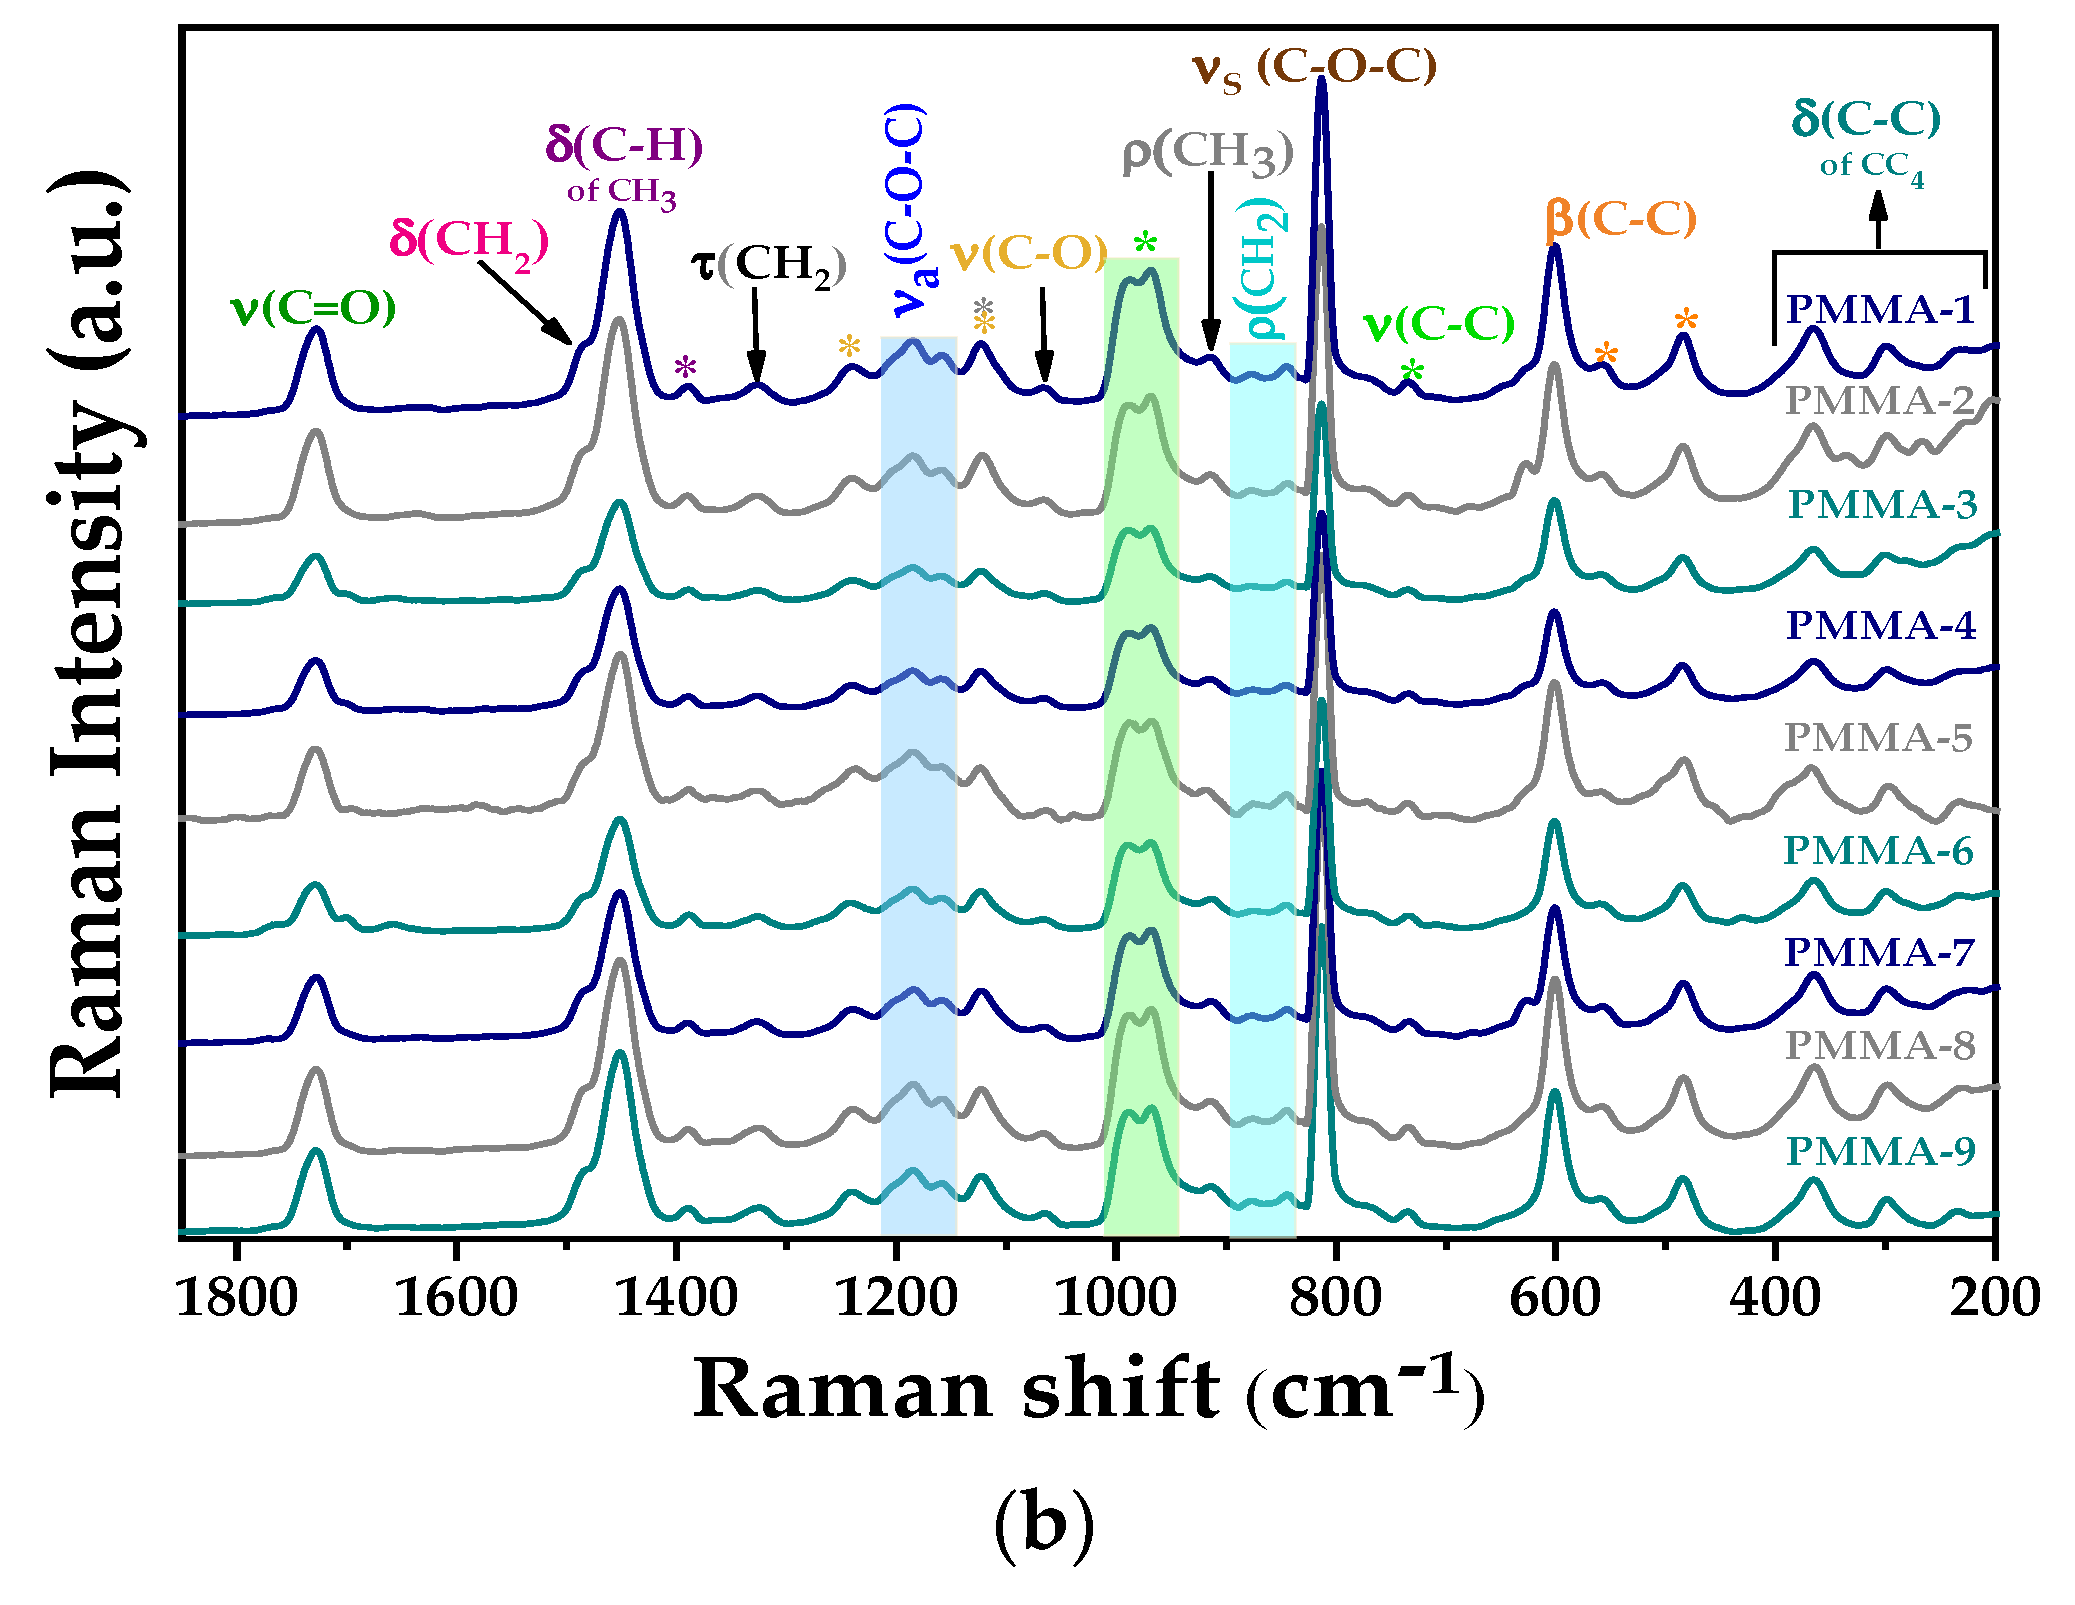
3.1.1. FT-IR and Micro-Raman Analysis
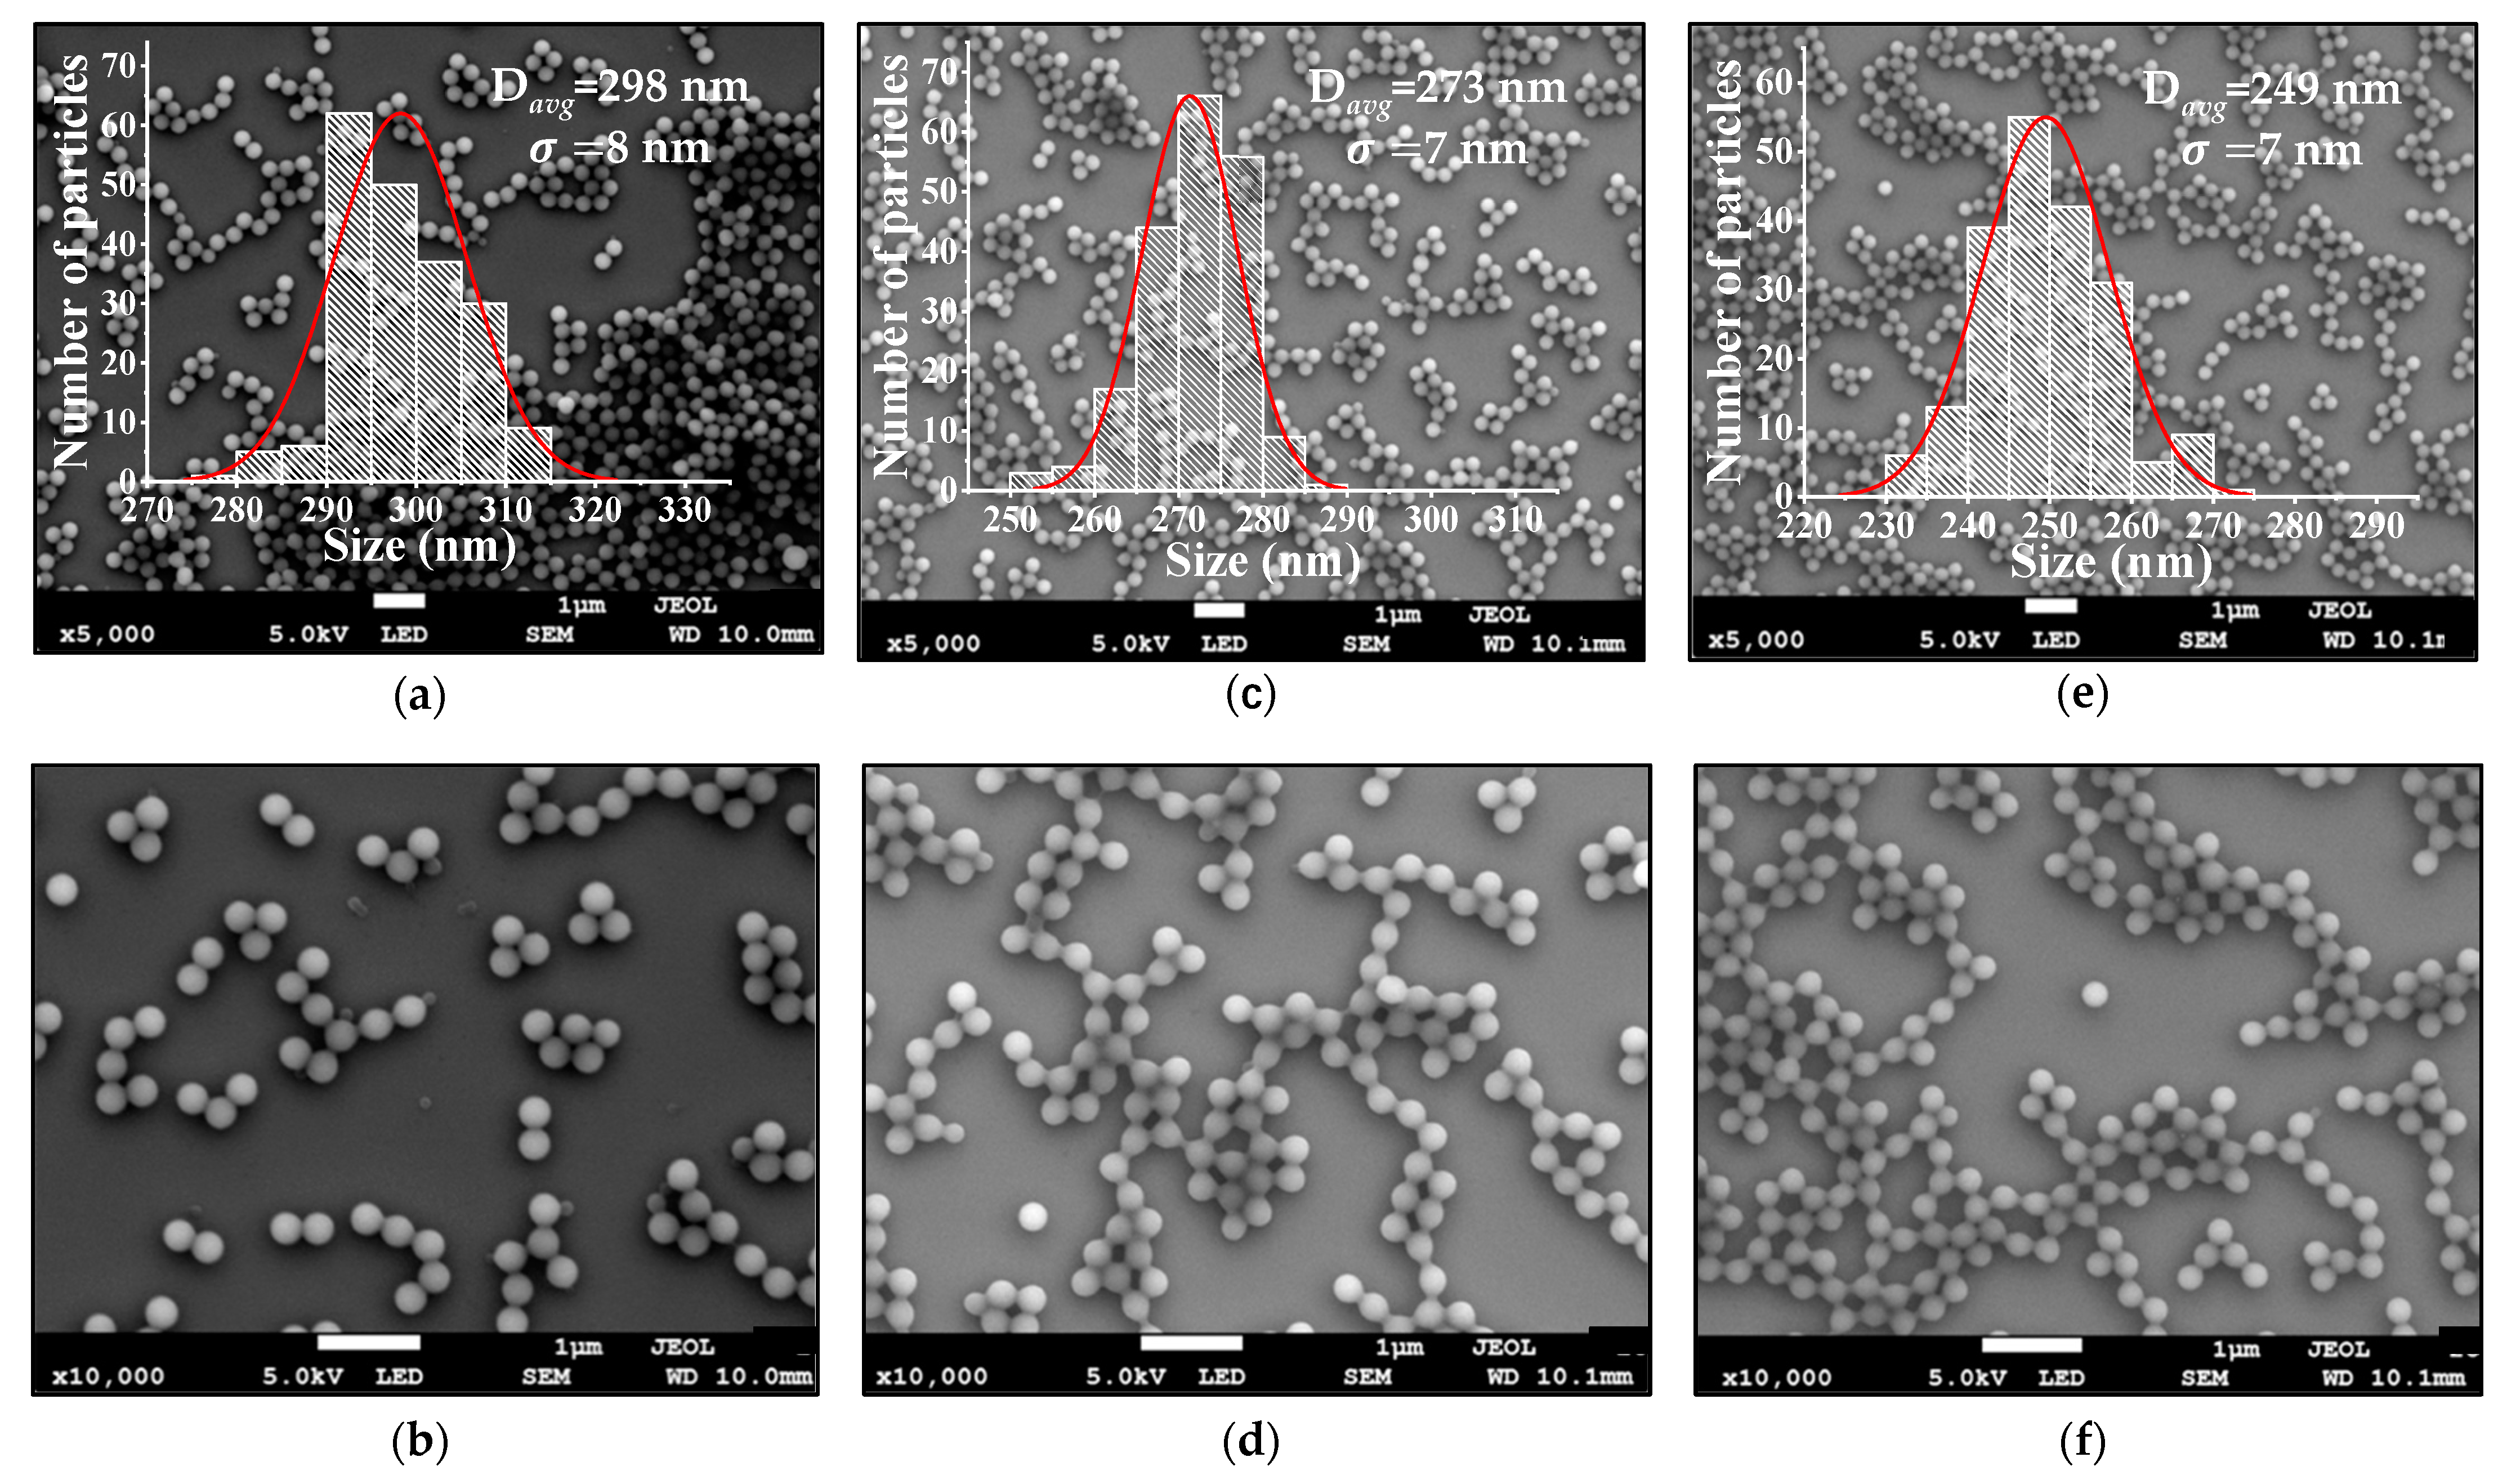
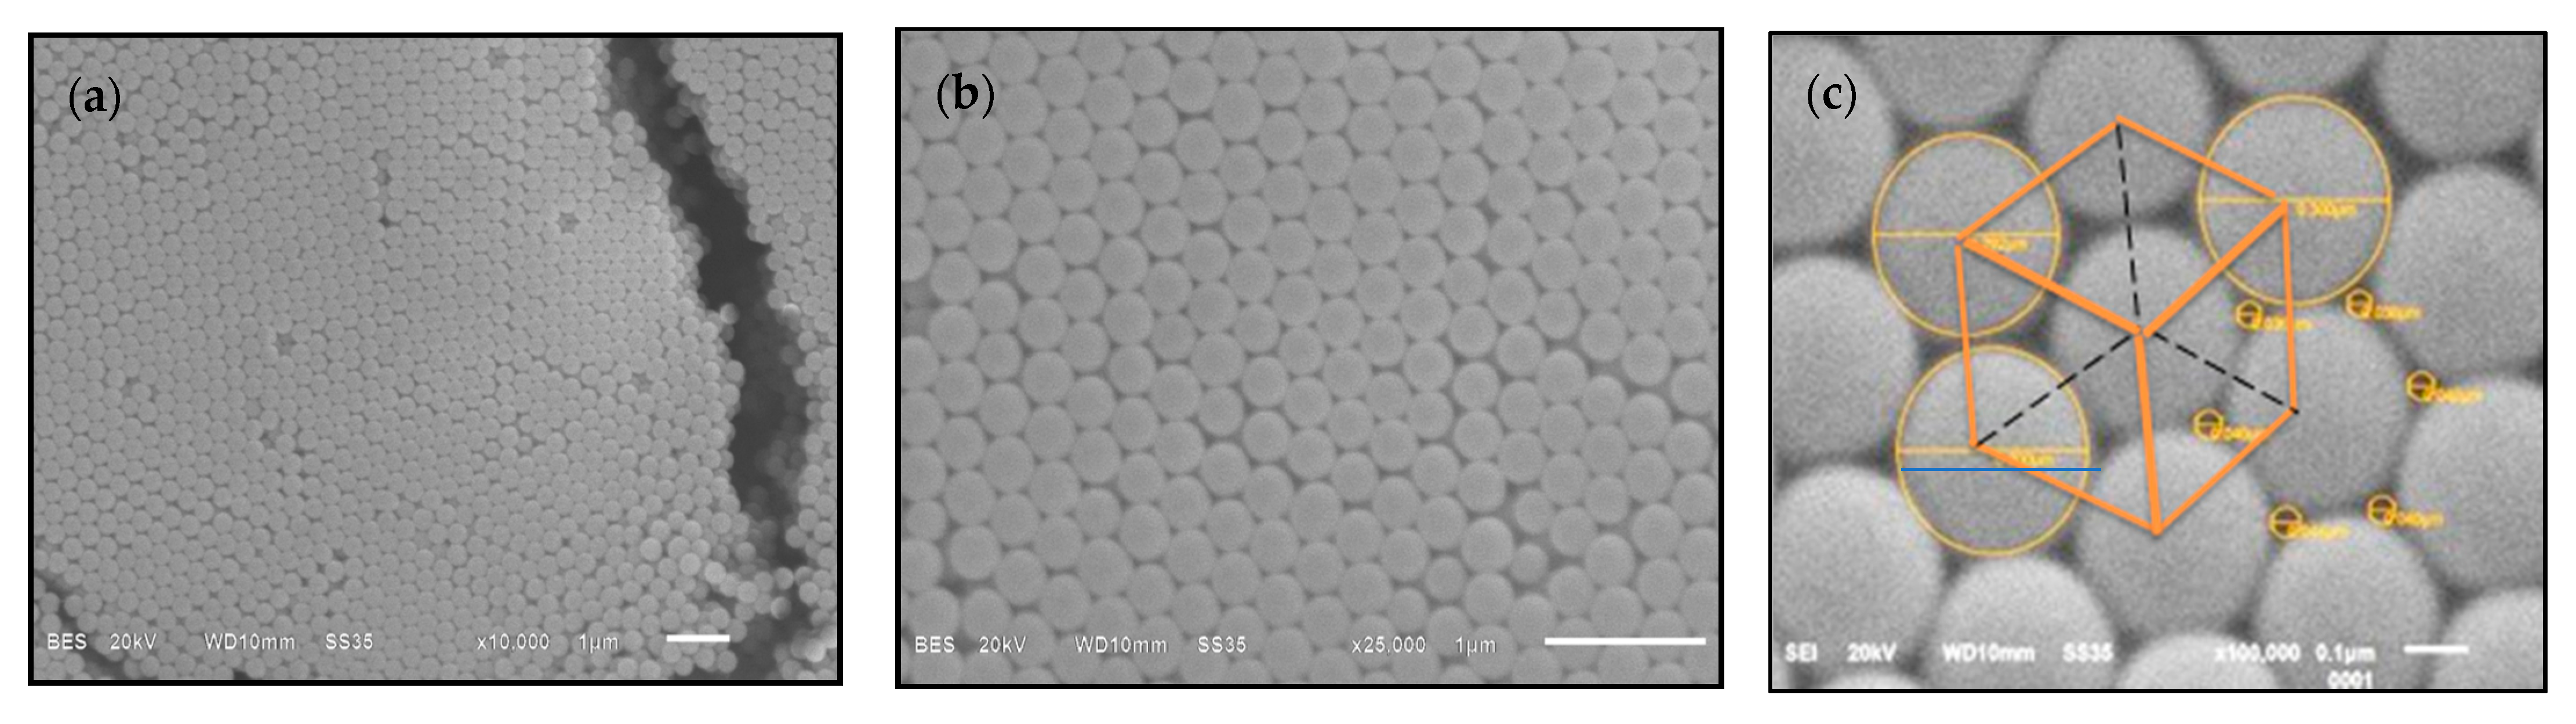
3.1.2. SEM and DLS Analysis
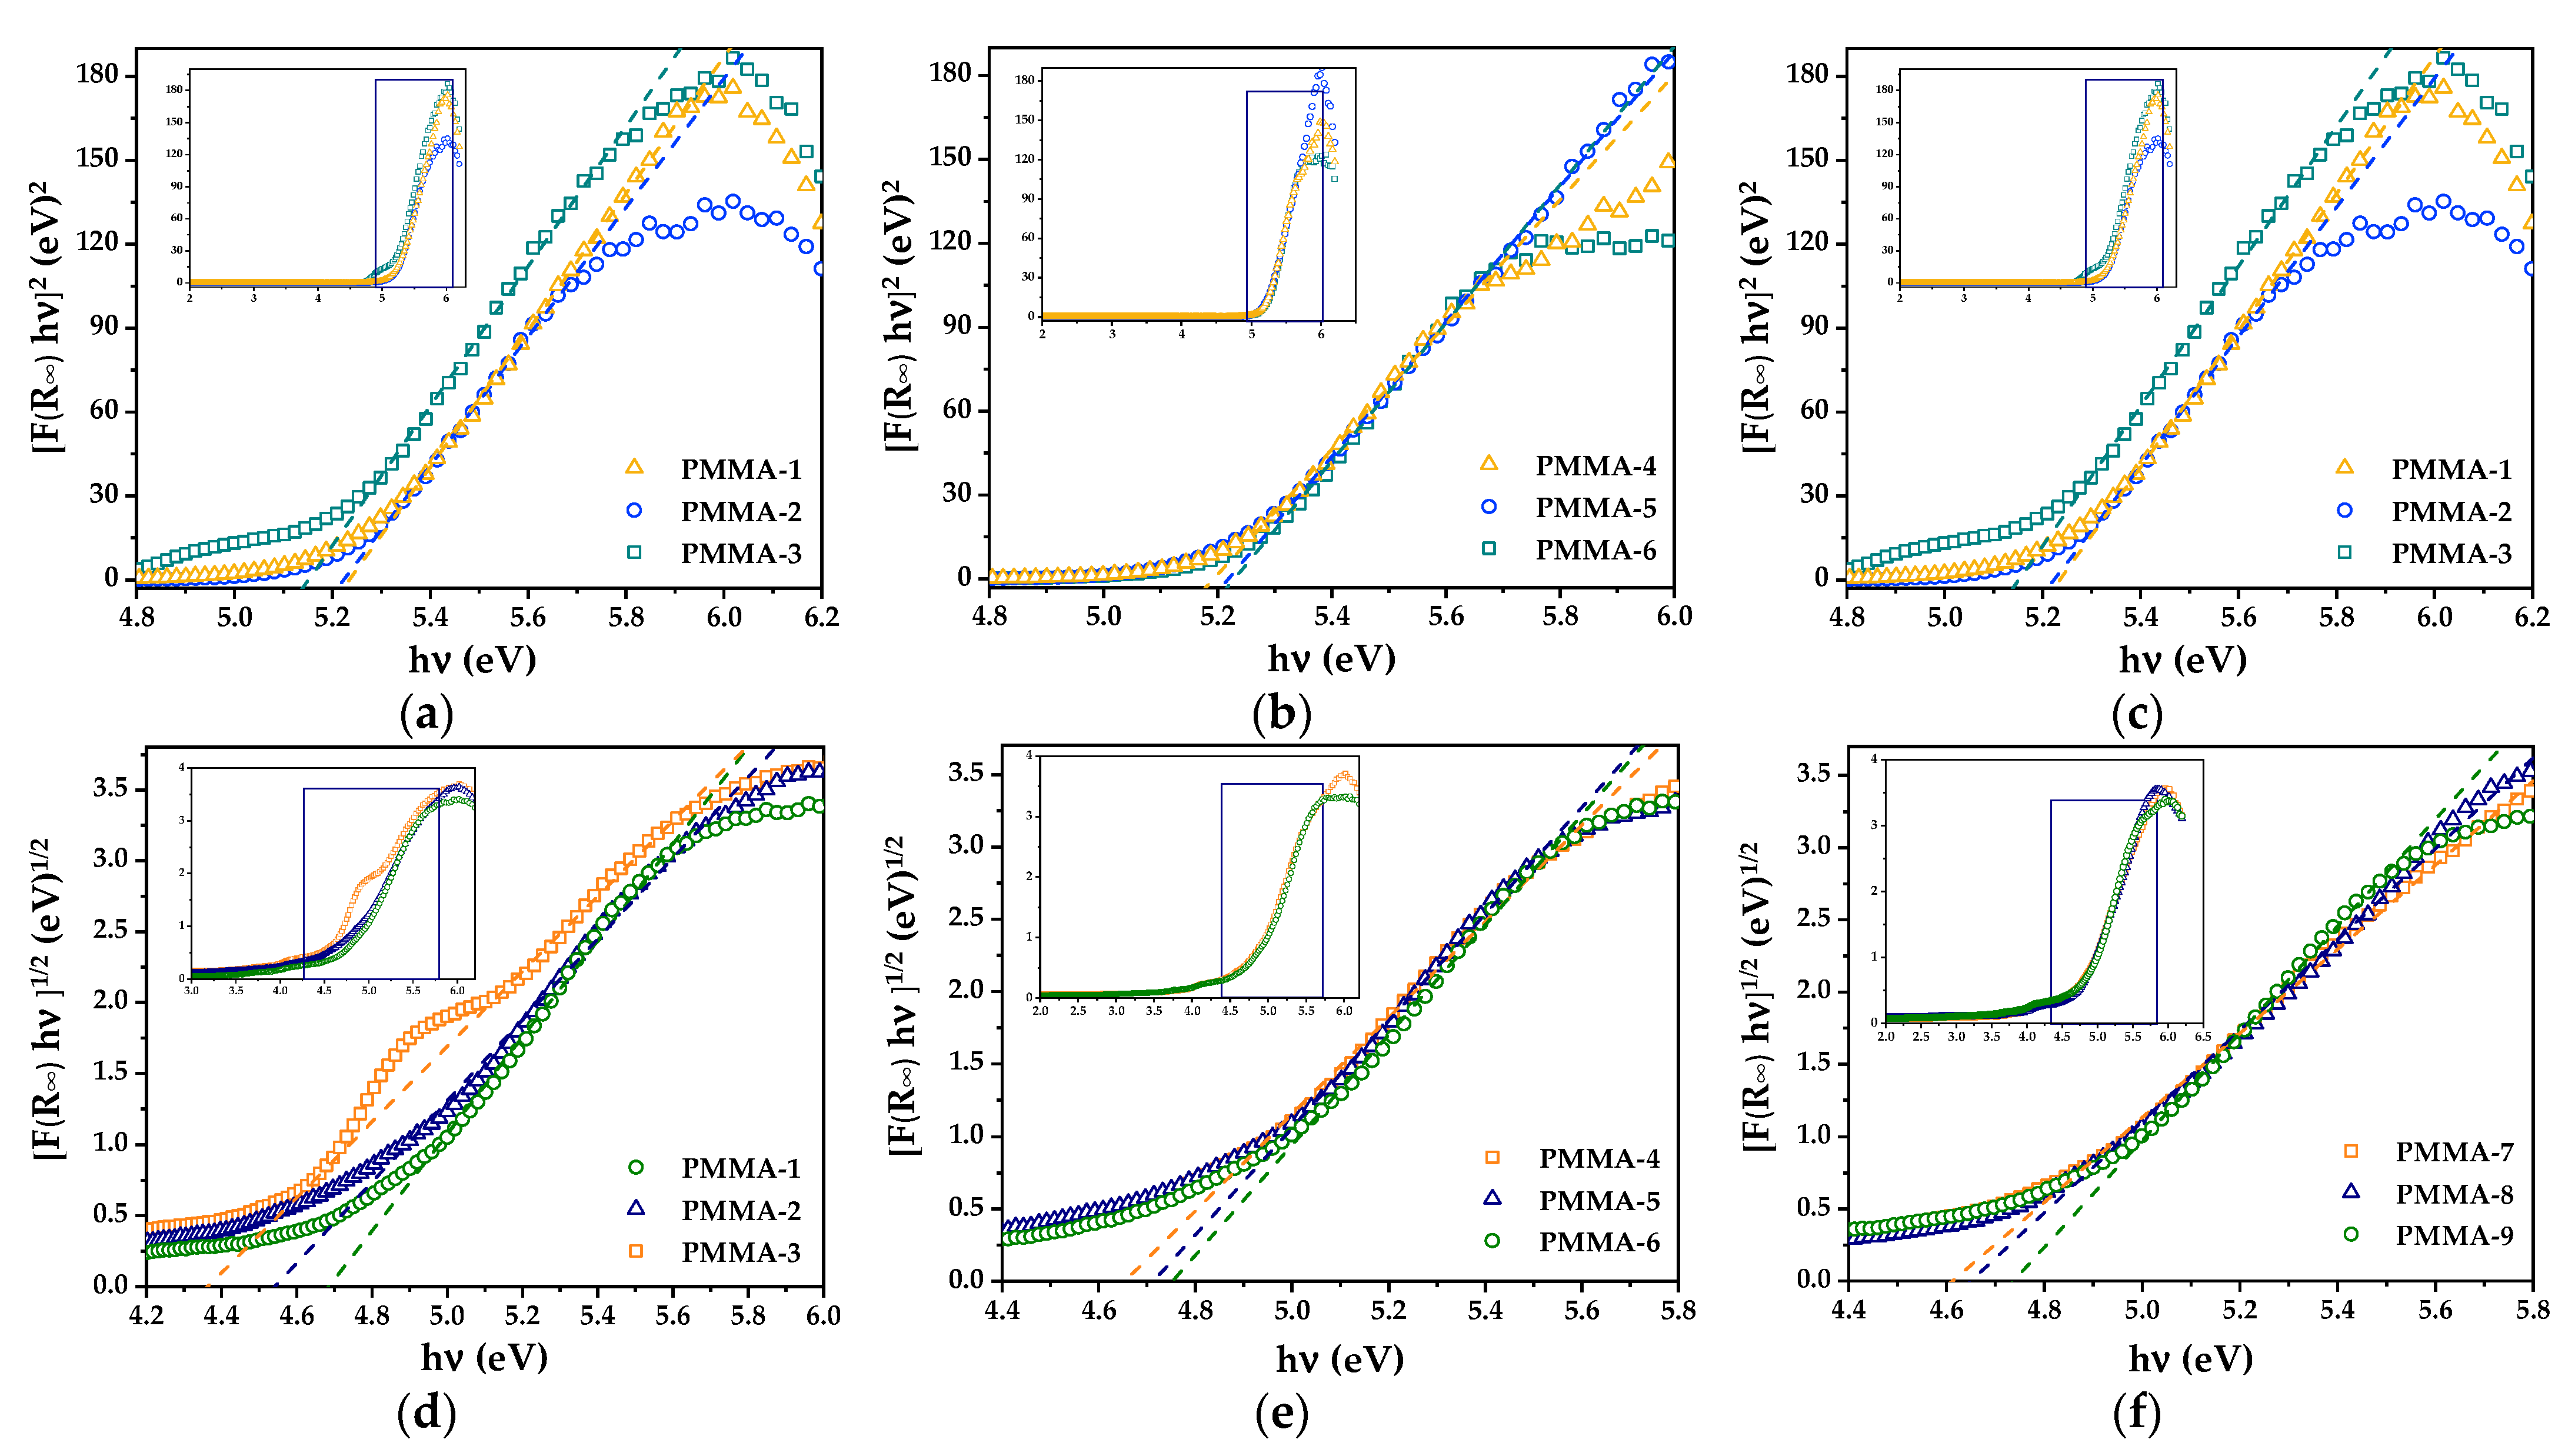
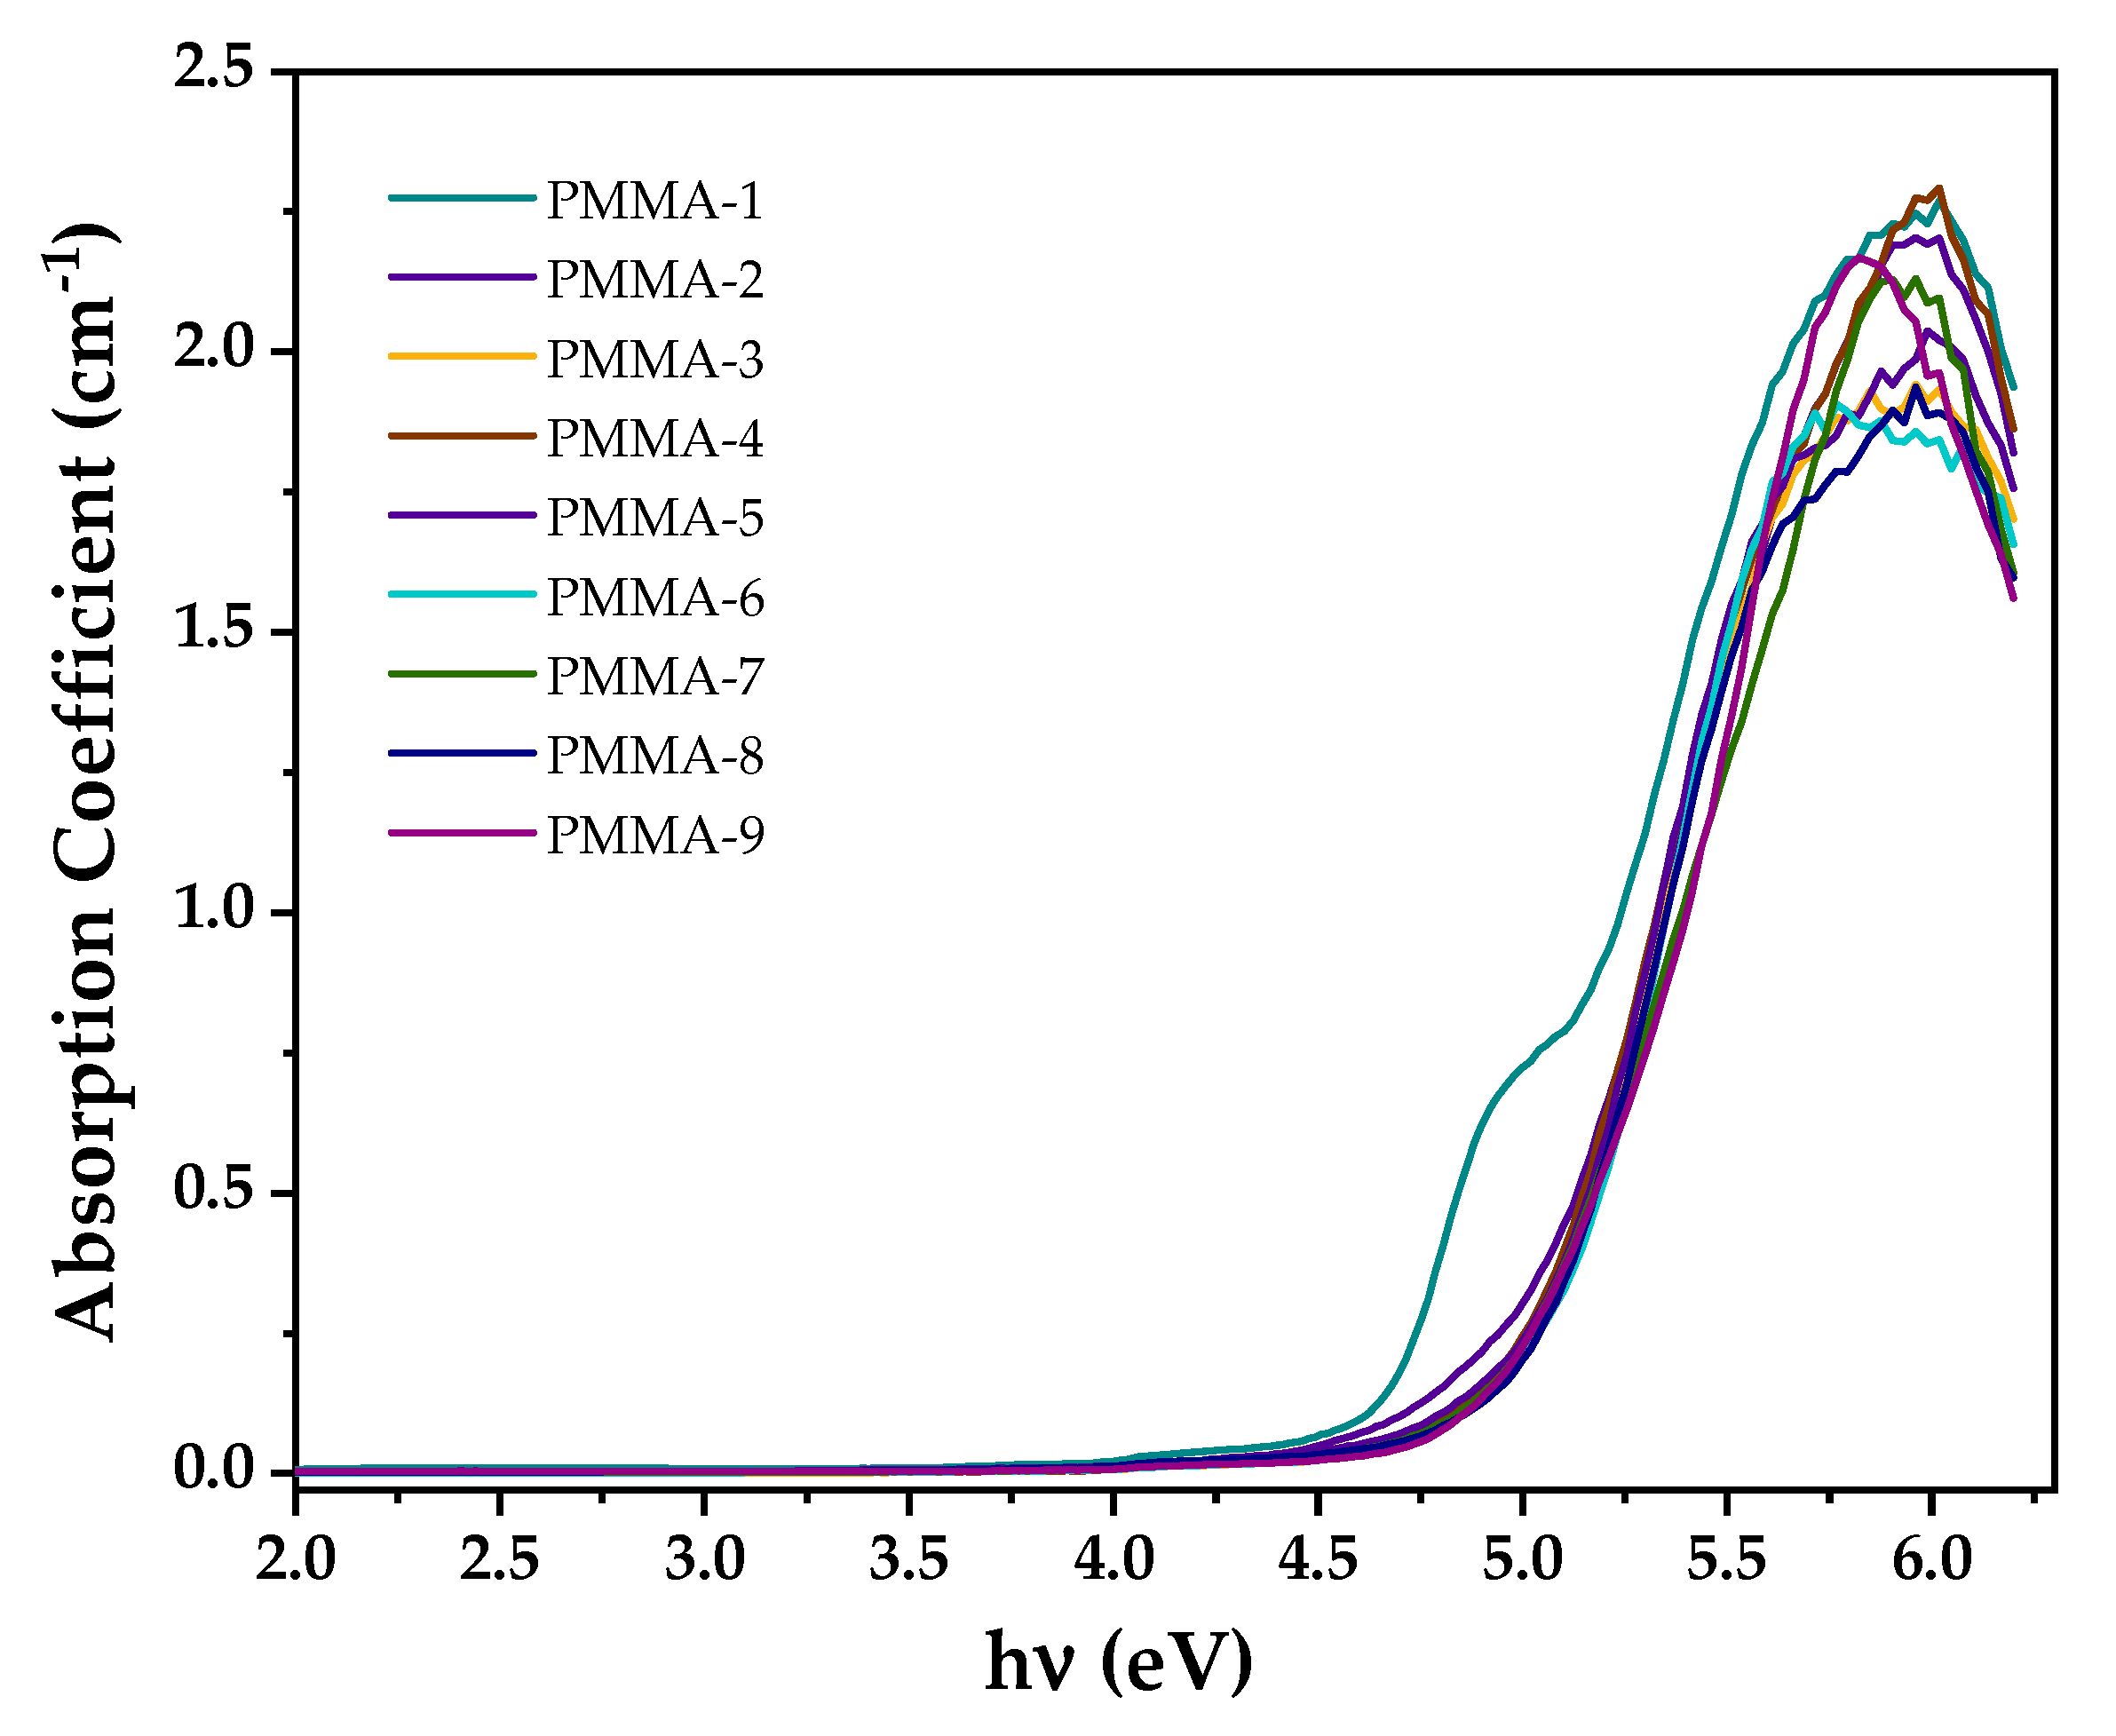
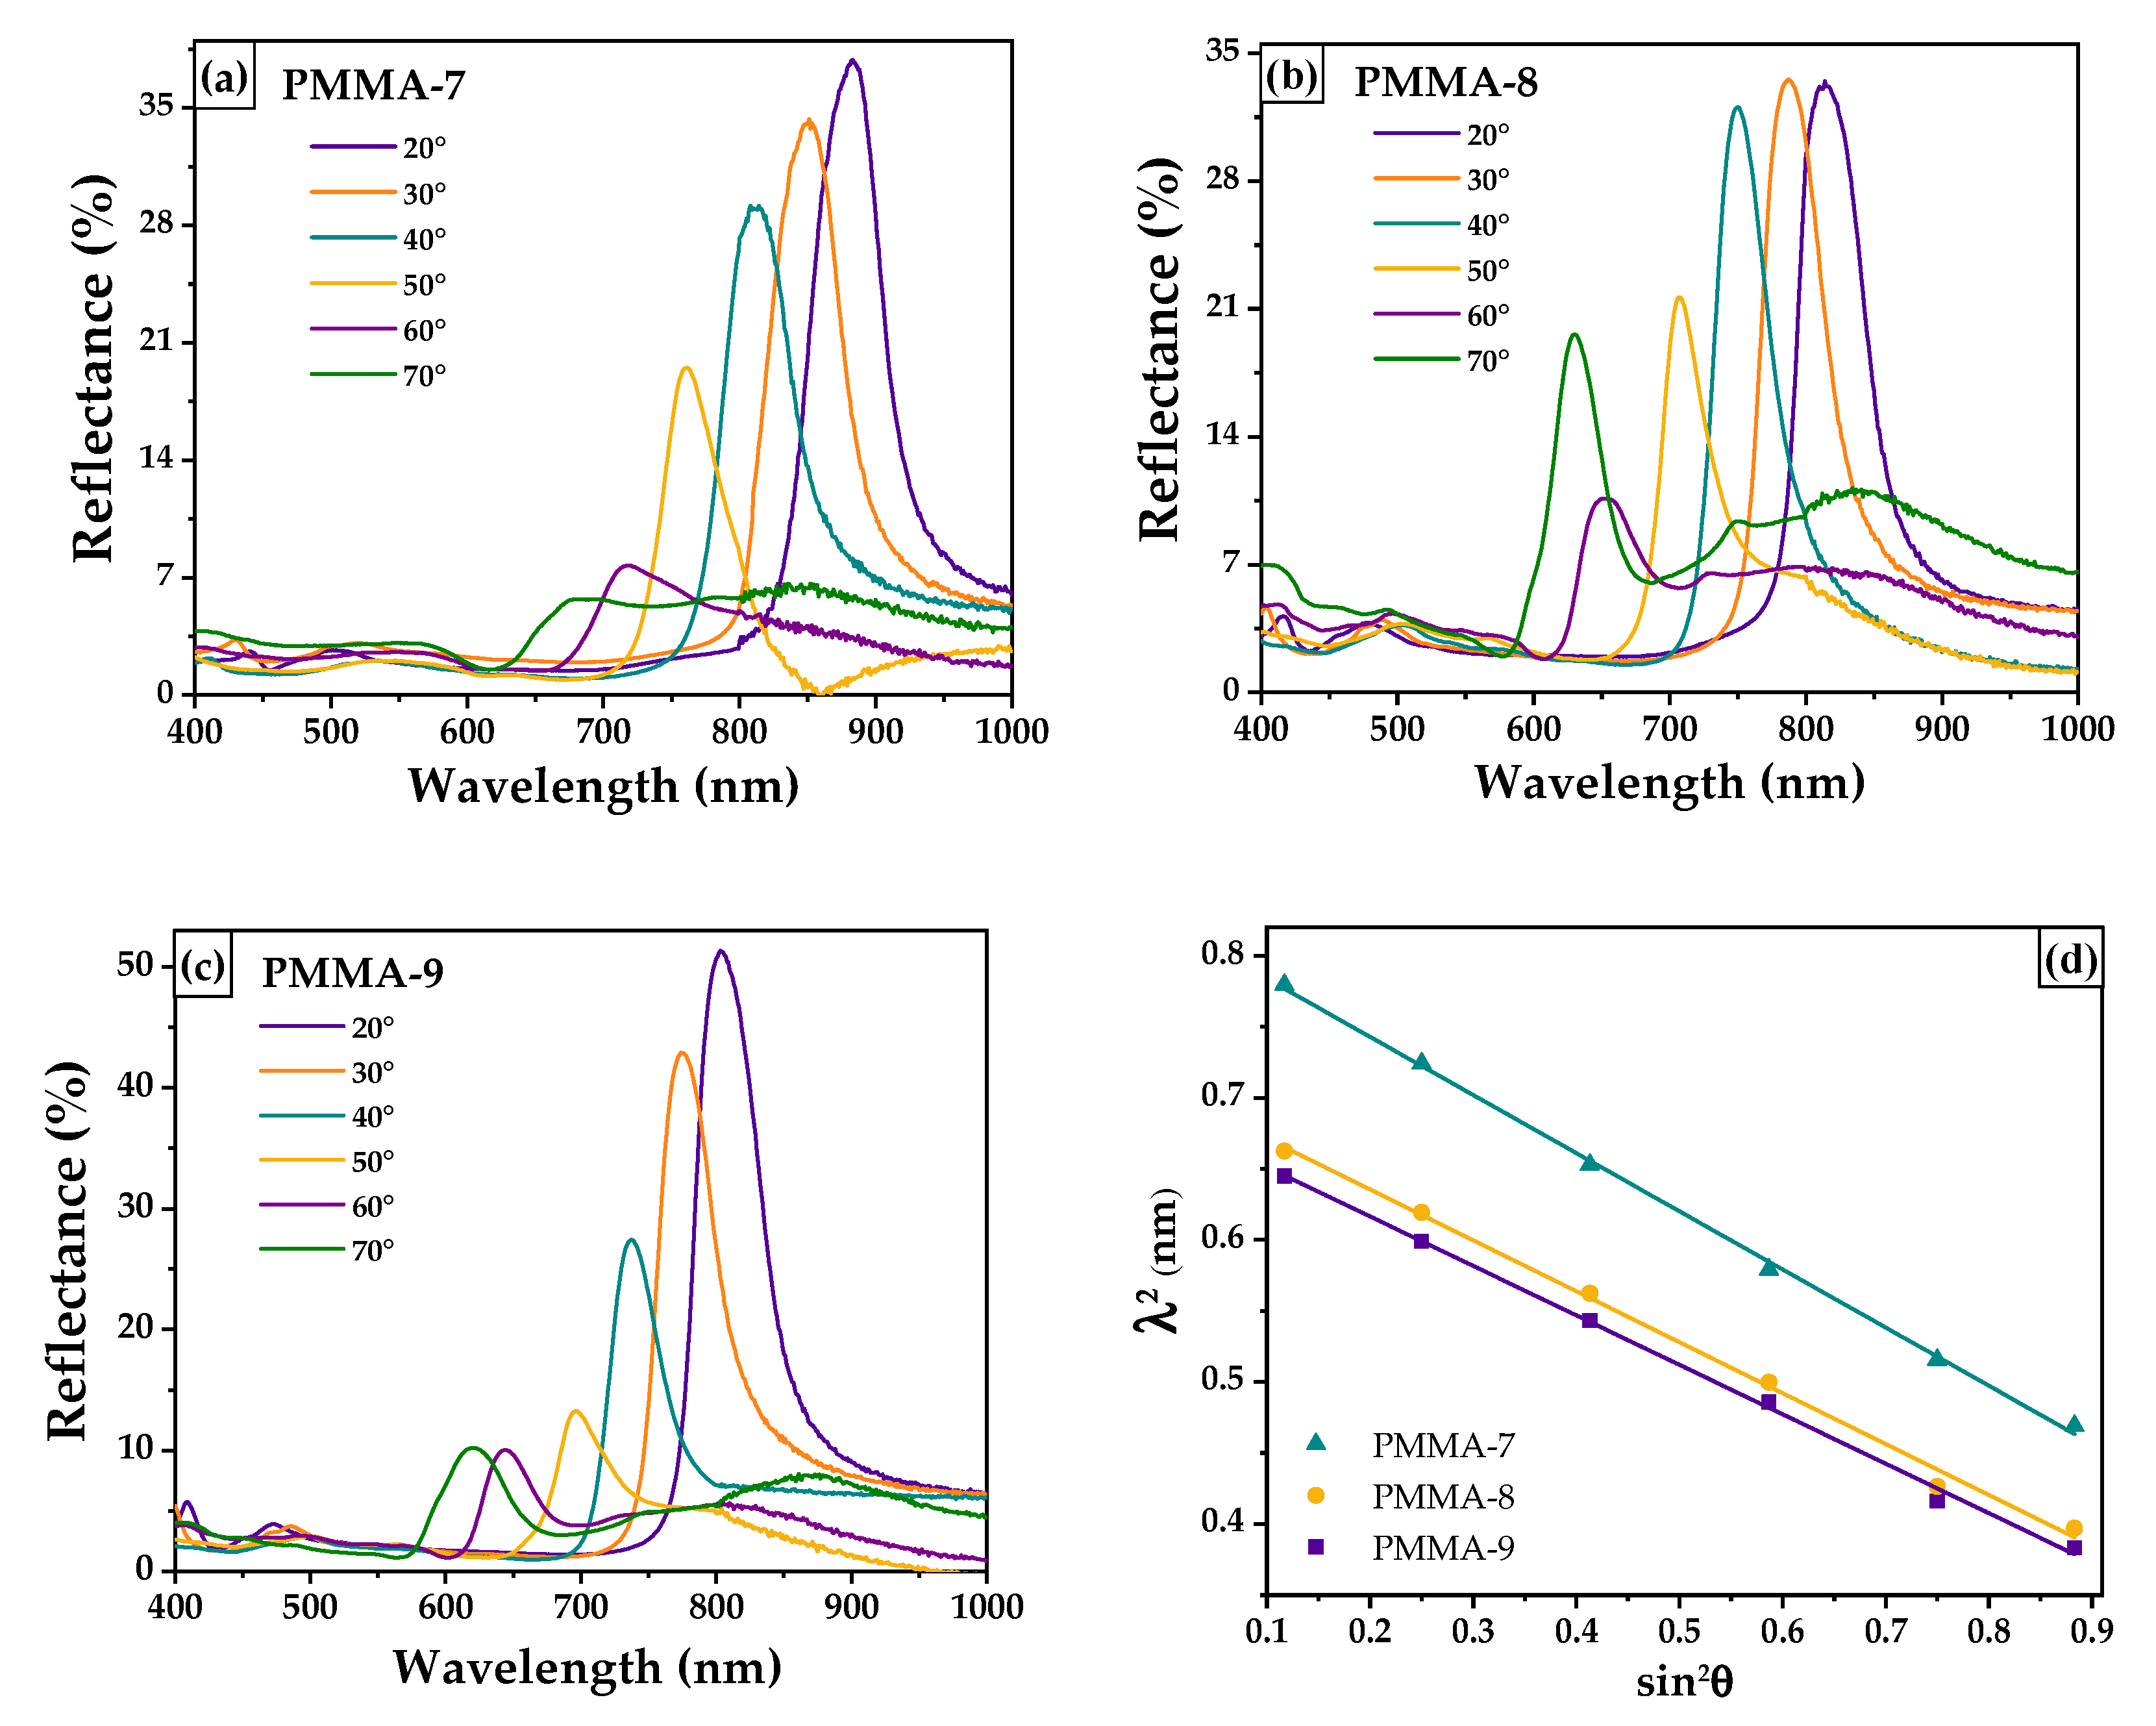
3.1.3. DRS Analysis
3.2. PMMA Opals
4. Conclusions
Author Contributions
Funding
Institutional Review Board Statement
Informed Consent Statement
Data Availability Statement
Acknowledgments
Conflicts of Interest
References
- Waterhouse, G.I.N.; Waterland, M.R. Opal and inverse opal photonic crystals: Fabrication and characterization. Polyhedron 2007, 26, 356–368. [Google Scholar] [CrossRef]
- Aguirre, C.I.; Reguera, E.; Stein, A. Tunable colors in opals and inverse opal photonic crystals. Adv. Funct. Mater. 2010, 20, 2565–2578. [Google Scholar] [CrossRef]
- Fudouzi, H. Optical properties caused by periodical array structure with colloidal particles and their applications. Adv. Powder Technol. 2009, 20, 502–508. [Google Scholar] [CrossRef]
- Liu, Y.; Qin, F.; Wei, Z.Y.; Meng, Q.B.; Zhang, D.Z.; Li, Z.Y. 10 Fs Ultrafast All-Optical Switching in Polystyrene Nonlinear Photonic Crystals. Appl. Phys. Lett. 2009, 95, 1–4. [Google Scholar] [CrossRef]
- Yablonovitch, E. Photonic band-gap structures. J. Opt. Soc. Am. B. 1993, 10, 283–295. [Google Scholar] [CrossRef]
- Nandiyanto, A.B.D.; Suhendi, A.; Ogi, T.; Iwaki, T.; Okuyama, K. Synthesis of additive-free cationic polystyrene particles with controllable size for hollow template applications. Colloids Surf. A Physicochem. Eng. Asp. 2012, 396, 96–105. [Google Scholar] [CrossRef]
- Schroden, R.C.; Al-Daous, M.; Blanford, C.F.; Stein, A. Optical properties of inverse opal photonic crystals. Chem. Mater. 2002, 14, 3305–3315. [Google Scholar] [CrossRef]
- Zhang, J.; Sun, Z.; Yang, B. Self-assembly of photonic crystals from polymer colloids. Curr. Opin. Colloid Interface Sci. 2009, 14, 103–114. [Google Scholar] [CrossRef]
- Li, Z.; Wang, J.; Song, Y. Self-assembly of latex particles for colloidal crystals. Particuology 2011, 9, 559–565. [Google Scholar] [CrossRef]
- Carmona-Carmona, A.J.; Palomino-Ovando, M.A.; Hernández-Cristobal, O.; Sánchez-Mora, E.; Toledo-Solano, M. Synthesis and characterization of magnetic opal/Fe3O4 colloidal crystal. J. Cryst Growth 2017, 462, 6–11. [Google Scholar] [CrossRef]
- Fang, J.; Xuan, Y.; Li, Q. Preparation of polystyrene spheres in different particle sizes and assembly of the PS colloidal crystals. Sci. China Technol. Sci. 2010, 53, 3088–3093. [Google Scholar] [CrossRef]
- Gu, Z.Z.; Chen, H.; Zhan, S.; Sun, L.; Xie, Z.; Ge, Y. Rapid synthesis of monodisperse polymer spheres for self-assembled photonic crystals. Colloids Surf. A Physicochem. Eng. Asp. 2007, 302, 312–319. [Google Scholar] [CrossRef]
- Deng, T.; Chen, C.; Honoker, C.; Thomas, E.L. Two-dimensional block copolymer photonic crystals. Polymer 2003, 44, 6549–6553. [Google Scholar] [CrossRef]
- Kang, Y.; Walish, J.J.; Gorishnyy, T.; Tomas, E.L. Broad-wavelength-range chemically tunable block-copolymer photonic gels. Nat. Mater. 2007, 6, 2007. [Google Scholar] [CrossRef]
- Xiao, M.; Li, Y.; Allen, M.C.; Deheyn, D.D.; Yue, X.; Zhao, J.; Gianneschi, N.C.; Shawkey, M.D.; Dhinojwala, A. Bio-inspired structural colors produced via self-assembly of synthetic melanin nanoparticles. ACS Nano 2015, 9, 5454–5460. [Google Scholar] [CrossRef] [Green Version]
- Ali, U.; Karim, K.J.B.A.; Buang, N.A. A Review of the Properties and Applications of Poly (Methyl Methacrylate) (PMMA). Polym. Rev. 2015, 55, 678–705. [Google Scholar] [CrossRef]
- Camli, S.T.; Buyukserin, F.; Balci, O.; Budak, G.G. Size controlled synthesis of sub-100 nm monodisperse poly(methylmethacrylate) nanoparticles using surfactant-free emulsion polymerization. J. Colloid Interface Sci. 2010, 344, 528–532. [Google Scholar] [CrossRef]
- Gorsd, M.N.; Blanco, M.N.; Pizzio, L.R. Synthesis of Polystyrene Microspheres to be Used as Template in the Preparation of Hollow Spherical Materials: Study of the Operative Variables. Procedia Mater. Sci. 2012, 1, 432–438. [Google Scholar] [CrossRef] [Green Version]
- Tanrisever, T.; Okay, O.; Sönmezoǧlu, I.C. Kinetics of emulsifier-free emulsion polymerization of methyl methacrylate. J. Appl. Polym. Sci. 1996, 61, 485–493. [Google Scholar] [CrossRef]
- Yamamoto, T.; Higashitani, K. Growth processes of poly methylmethacrylate particles investigated by atomic force microscopy. Adv. Powder Technol. 2007, 18, 567–577. [Google Scholar] [CrossRef]
- Yohanala, P.T.F.; Mulaya Dewa, R.; Quarta, K.; Widiyastuti; Winardi, S. Preparation of Polystyrene Spheres Using Surfactant-Free Emulsion Polymerization. Mod. Appl. Sci. 2015, 9, 121–126. [Google Scholar] [CrossRef]
- Zidan, H.M.; Abu-Elnader, M. Structural and optical properties of pure PMMA and metal chloride-doped PMMA films. Phys. B Condens. Matter. 2005, 355, 308–317. [Google Scholar] [CrossRef]
- Mergen, Ö.B.; Arda, E.; Kara, S.; Pekcan, Ö. Effects of GNP addition on optical properties and band gap energies of PMMA films. Polym. Compos. 2019, 40, 1862–1869. [Google Scholar] [CrossRef]
- Trejo-García, P.M.; Palomino-Merino, R.; De la Cruz, J.; Espinosa, J.E.; Aceves, R.; Moreno-Barbosa, E.; Portillo-Moreno, O. Luminescent properties of Eu3+-doped hybrid SiO2-PMMA material for photonic applications. Micromachines 2018, 9, 441. [Google Scholar] [CrossRef] [PubMed] [Green Version]
- Aziz, S.B.; Abdullah, O.G.; Hussein, A.M.; Ahmed, H.M. From insulating PMMA polymer to conjugated double bond behavior: Green chemistry as a novel approach to fabricate small band gap polymers. Polymers 2017, 9, 626. [Google Scholar] [CrossRef] [Green Version]
- Sánchez-Mora, E.; Fernádez-Candelario, M.; Gómez-Barojas, E.; Pérez-Rodríguez, F. Influence of Fe ions on the optical properties of Fe-ZnO inverse opals. J. Supercond. Nov. Magn. 2013, 26, 2447–2449. [Google Scholar] [CrossRef]
- Kaczmarczyk, B.; Morejko-Buz, B.; Stolarzewicz, A. Investigation of infrared calibration methods for application to the study of methyl methacrylate polymerization. Anal. Bioanal. Chem. 2001, 370, 899–903. [Google Scholar] [CrossRef]
- Mas Haris, M.R.; Kathiresan, S.; Mohan, S. FT-IR and FT-Raman Spectra and Normal Coordinate Analysis of Poly methyl methacrylate. Der. Pharma Chem. 2010, 2316–2323. [Google Scholar]
- Bhattacharjee, S. DLS and zeta potential—What they are and what they are not? J. Control. Release 2016, 235, 337–351. [Google Scholar] [CrossRef]
- Yamamoto, T.; Higashitani, K. Size control of polymeric particle in soap-free emulsion polymerization. KONA Powder Part J. 2018, 2018, 66–79. [Google Scholar] [CrossRef] [Green Version]
- Li, X.; King, T.A. Microstructure and optical properties of PMMA/gel silica glass composites. J. Sol. Gel. Sci. Technol. 1995, 4, 75–82. [Google Scholar] [CrossRef]
- Wheeler, O.H. Near Infrared Spectra Of Organic Compounds. Chem. Rev. 1959, 59, 629–666. [Google Scholar] [CrossRef]
- Siesler, H.W.; Ozaki, Y.; Kawata, S.; Heise, H.M. Near-Infrared Spectroscopy: Principles, Instruments, Applications, 1st ed.; Wiley-VCH: Weinheim, Germany, 2002; pp. 11–39. [Google Scholar]
- Escobedo Morales, A.; Sánchez-Mora, E.; Pal, U. Use of diffuse reflectance spectroscopy for optical characterization of un-supported nanostructures. Rev. Mex. Física 2007, 53, 8–22. [Google Scholar]
- Hazim, A.; Abduljalil, H.M.; Hashim, A. First Principles Calculations of Electronic, Structural and Optical Properties of (PMMA–ZrO2–Au) and (PMMA–Al2O3–Au) Nanocomposites for Optoelectronics Applications. Trans. Electr. Electron. Mater. 2021, 22, 185–203. [Google Scholar] [CrossRef]
- Gupta, A.K.; Bafna, M.; Vijay, Y.K. Study of optical properties of potassium permanganate (KMnO4) doped poly(methylmethacrylate) (PMMA) composite films. Bull. Mater. Sci. 2018, 41, 1–7. [Google Scholar] [CrossRef] [Green Version]
- Gesesse, G.D.; Gomis-Berenguer, A.; Barthe, M.F.; Ania, C.O. On the analysis of diffuse reflectance measurements to estimate the optical properties of amorphous porous carbons and semiconductor/carbon catalysts. J. Photochem. Photobiol. A Chem. 2020, 398, 112622. [Google Scholar] [CrossRef]
- Bhat, V.S.; Kapatkar, S.B.; Ayachit, N.H.; Naik, I.; Murari, M.S. Doping-induced modulation of optical properties of PFO/PMMA composite films. Polym. Bull. 2020, 0123456789. [Google Scholar] [CrossRef]
- Wang, Z.L.; Chan, C.T.; Zhang, W.Y.; Chen, Z.; Ming, N.B. Optical properties of inverted opal photonic band gap crystals with stacking disorder. Phys. Rev. E 2003, 67, 1–10. [Google Scholar] [CrossRef] [Green Version]
- Versmold, H. Neutron diffraction from shear ordered colloidal dispersions. Phys. Rev. Lett. 1995, 75, 763–766. [Google Scholar] [CrossRef]
- Verhaegh, N.A.M.; Van Duijneveldt, J.S.; Van Blaaderen, A.; Lekkerkerker, H.N.W. Direct observation of stacking disorder in a colloidal crystal. J. Chem. Phys. 1995, 102, 1416–1421. [Google Scholar] [CrossRef] [Green Version]
- Zhang:, R.; Qiang, Z.; Wang, M. Integration of Polymer Synthesis and Self-Assembly for Controlled Periodicity and Photonic Properties, Adv. Funct. Mater. 2021, 31, 1–8. [Google Scholar] [CrossRef]


| Sample | Monomer (mmol) | Initiator (mmol) | PDI | (mV) | ||
|---|---|---|---|---|---|---|
| PMMA-1 | 190 | 1.65 | 235 ± 9.0 | 292 ± 17.1 | 0.034 | 47.3 ± 5.3 |
| PMMA-2 | 190 | 1.10 | 244 ± 11.2 | 301 ± 17.3 | 0.023 | 43.9 ± 5.2 |
| PMMA-3 | 190 | 0.55 | 247 ± 15.1 | 303 ± 17.4 | 0.069 | 47.2 ± 5.5 |
| PMMA-4 | 285 | 1.65 | 298 ± 8.0 | 390 ± 19.7 | 0.045 | 51.1 ± 5.4 |
| PMMA-5 | 285 | 1.10 | 273 ± 7.0 | 380 ± 19.5 | 0.034 | 48.5 ± 5.7 |
| PMMA-6 | 285 | 0.55 | 249 ± 7.0 | 360 ± 19.0 | 0.042 | 49.7 ± 5.4 |
| PMMA-7 | 380 | 1.65 | 323 ± 9.0 | 413 ± 20.3 | 0.083 | 46.1 ± 4.9 |
| PMMA-8 | 380 | 1.10 | 311 ± 8.1 | 398 ± 20.0 | 0.082 | 41.4 ± 4.4 |
| PMMA-9 | 380 | 0.55 | 306 ± 11.0 | 379 ± 19.5 | 0.088 | 46.1 ± 4.8 |
| Polymer | Initiator | Monomer | Davg Trend Monomer | Davg Trend Initiator | Reference | |
|---|---|---|---|---|---|---|
| PMS | V-50 4.23 mM 22.3 mM | Methylstyrene 424 mM | 70 | It decreases with increasing initiator concentration. | [19] | |
| PMMA | V-50 0.75 to 3.0 g | Methyl methacrylate 300 to 400 mL | 70 to 80 | Davg increases from 364 to 415 nm when monomer amount increases from 300 to 400 mL at fixed 1.5 g of initiator and T = 70 . | The effect of initiator amount is not conclusive because amount of monomer and temperature is varied simultaneously. | [1] |
| PMMA | V-50 0.034, 0.061, 0.186 g | Methyl methacrylate 28.3, 14.2, 2.83 g | 70 | For fixed monomer amounts: 28.3, 14.2 g, with increasing initiator, Davg increases. For fixed monomer amount: 2.83 g, with increasing initiator, Davg decreases. | [20] | |
| PS | AIBA 0.0008, 0.004, 0.008, 0.04 wt% | Styrene 0.40, 0.80, 2.0 wt% | 55 to 90 | For each amount of initiator, the monomer was varied to three quantities. A similar trend was observed: the Davg was increased as the monomer amount was increased. | For each amount of monomer, the initiator was varied to four quantities. A similar trend was observed: the Davg was increased as the initiator amount was increased. | [6] |
| PS | KPS 0.05, 0.2 g | Styrene 5%, 10%, 14% (v/v) | 80 | The monomer was varied to three quantities. The Davg of polystyrene spheres increased 223 to 316 nm when styrene monomer concentration was increased. | When the styrene monomer concentration was set constant at 10% (v/v), the Davg of the PS particles decreased from 249 nm using 0.05 g of initiator, to 181 nm using 0.2 g of initiator. | [21] |
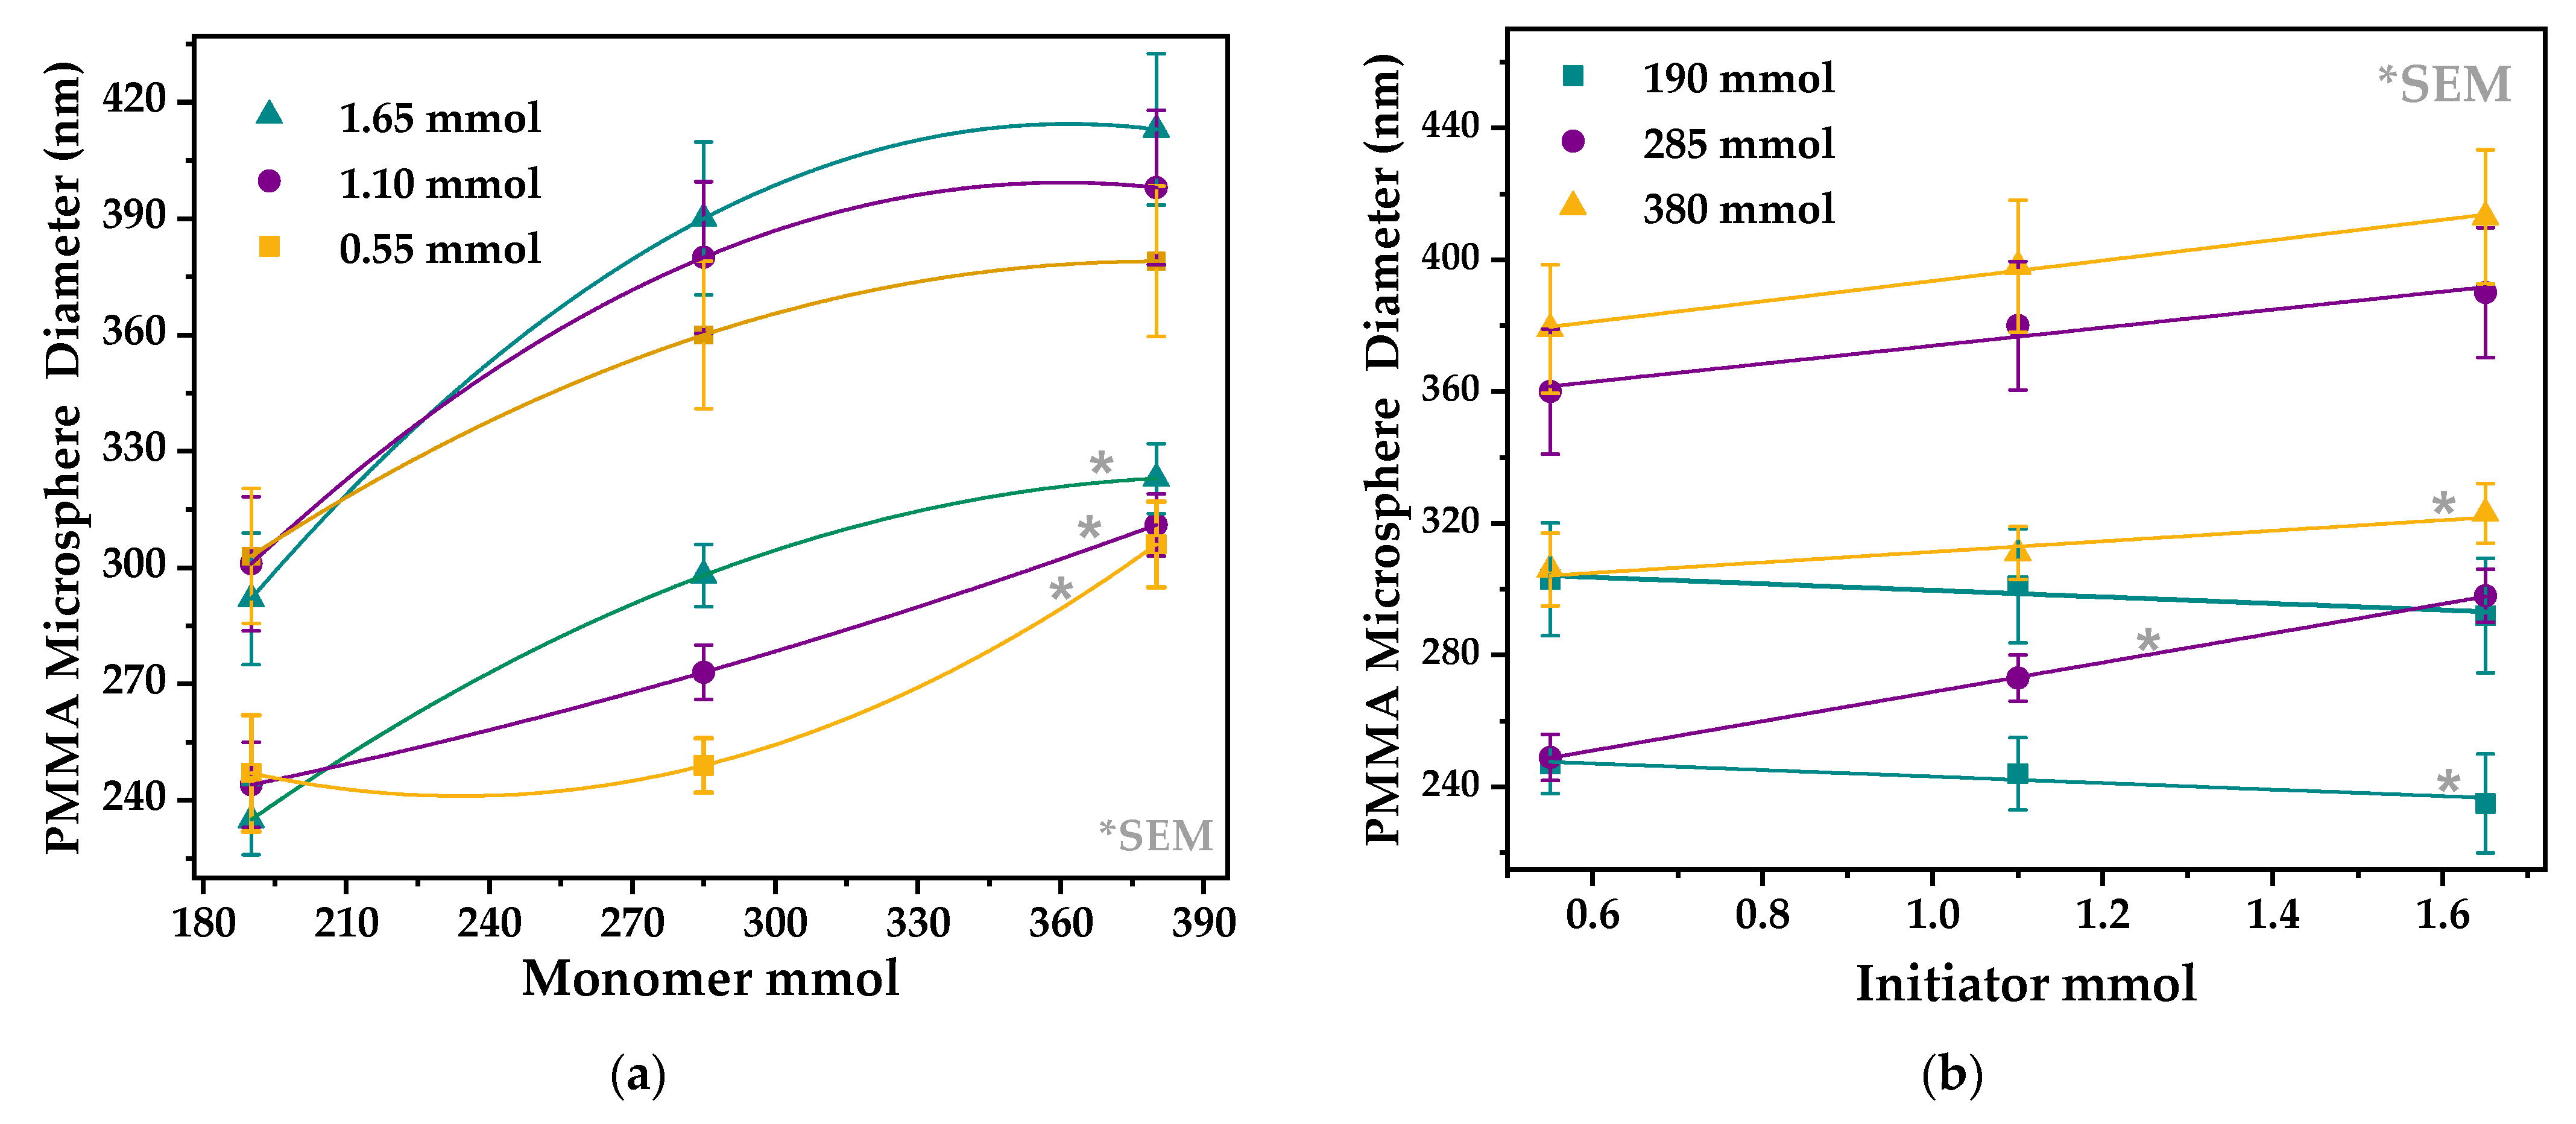
| PMMA | V-50 0.55, 1.10, 1.65 mmol | Methyl methacrylate 190, 285, 380 mmol | 75 | For each amount of initiator, the monomer was varied to three quantities. In all cases a similar non-linear trend was observed: the Davg is increased as the monomer amount is increased. | For fixed monomer amounts: 380, 285 mmol, with increasing initiator, Davg increased. For fixed monomer amount: 190 g, with increasing initiator, Davg decreased. | This work |
| Sample | Eg/D (eV) | Eg/I (eV) | ||
|---|---|---|---|---|
| PMMA-1 | 5.23 ± 0.06 | 4.68 ± 0.01 | 0.484 | 2.030 |
| PMMA-2 | 5.22 ± 0.05 | 4.54 ± 0.03 | 0.509 | 2.870 |
| PMMA-3 | 5.15 ± 0.06 | 4.36 ± 0.02 | 0.558 | 3.500 |
| PMMA-4 | 5.19 ±0.07 | 4.65 ± 0.05 | 0.522 | 3.920 |
| PMMA-5 | 5.22 ± 0.09 | 4.71 ± 0.04 | 0.403 | 2.670 |
| PMMA-6 | 5.23 ± 0.06 | 4.75 ± 0.03 | 0.479 | 1.500 |
| PMMA-7 | 5.21 ± 0.04 | 4.61 ± 0.02 | 0.544 | 5.089 |
| PMMA-8 | 5.34 ± 0.05 | 4.65 ± 0.03 | 0.537 | 4.992 |
| PMMA-9 | 5.35 ± 0.06 | 4.73 ± 0.03 | 0.403 | 0.155 |
| Sample | a (nm) | Intercept | Slope | d111b (nm) | D b (nm) | b (nm) | ||
|---|---|---|---|---|---|---|---|---|
| PMMA-7 | 883 | 0.8248 | −0.4094 | 320 ± 22 | 392 ± 9 | 1.420 ± 0.02 | 0.852 | 880 ± 14 |
| PMMA-8 | 814 | 0.7072 | −0.3586 | 300 ± 18 | 367 ± 11 | 1.404 ± 0.01 | 0.820 | 816 ± 18 |
| PMMA-9 | 803 | 0.6861 | −0.3482 | 295 ± 15 | 361 ± 7 | 1.403 ± 0.03 | 0.820 | 803 ± 22 |
Publisher’s Note: MDPI stays neutral with regard to jurisdictional claims in published maps and institutional affiliations. |
© 2021 by the authors. Licensee MDPI, Basel, Switzerland. This article is an open access article distributed under the terms and conditions of the Creative Commons Attribution (CC BY) license (https://creativecommons.org/licenses/by/4.0/).
Share and Cite
Matamoros-Ambrocio, M.; Sánchez-Mora, E.; Gómez-Barojas, E.; Luna-López, J.A. Synthesis and Study of the Optical Properties of PMMA Microspheres and Opals. Polymers 2021, 13, 2171. https://doi.org/10.3390/polym13132171
Matamoros-Ambrocio M, Sánchez-Mora E, Gómez-Barojas E, Luna-López JA. Synthesis and Study of the Optical Properties of PMMA Microspheres and Opals. Polymers. 2021; 13(13):2171. https://doi.org/10.3390/polym13132171
Chicago/Turabian StyleMatamoros-Ambrocio, Mayra, Enrique Sánchez-Mora, Estela Gómez-Barojas, and José Alberto Luna-López. 2021. "Synthesis and Study of the Optical Properties of PMMA Microspheres and Opals" Polymers 13, no. 13: 2171. https://doi.org/10.3390/polym13132171
APA StyleMatamoros-Ambrocio, M., Sánchez-Mora, E., Gómez-Barojas, E., & Luna-López, J. A. (2021). Synthesis and Study of the Optical Properties of PMMA Microspheres and Opals. Polymers, 13(13), 2171. https://doi.org/10.3390/polym13132171