
Non-Newtonian Droplet Generation in a Cross-Junction Microfluidic Channel


Abstract
1. Introduction
2. Methods
2.1. Governing Equations
2.2. Numerical Setup
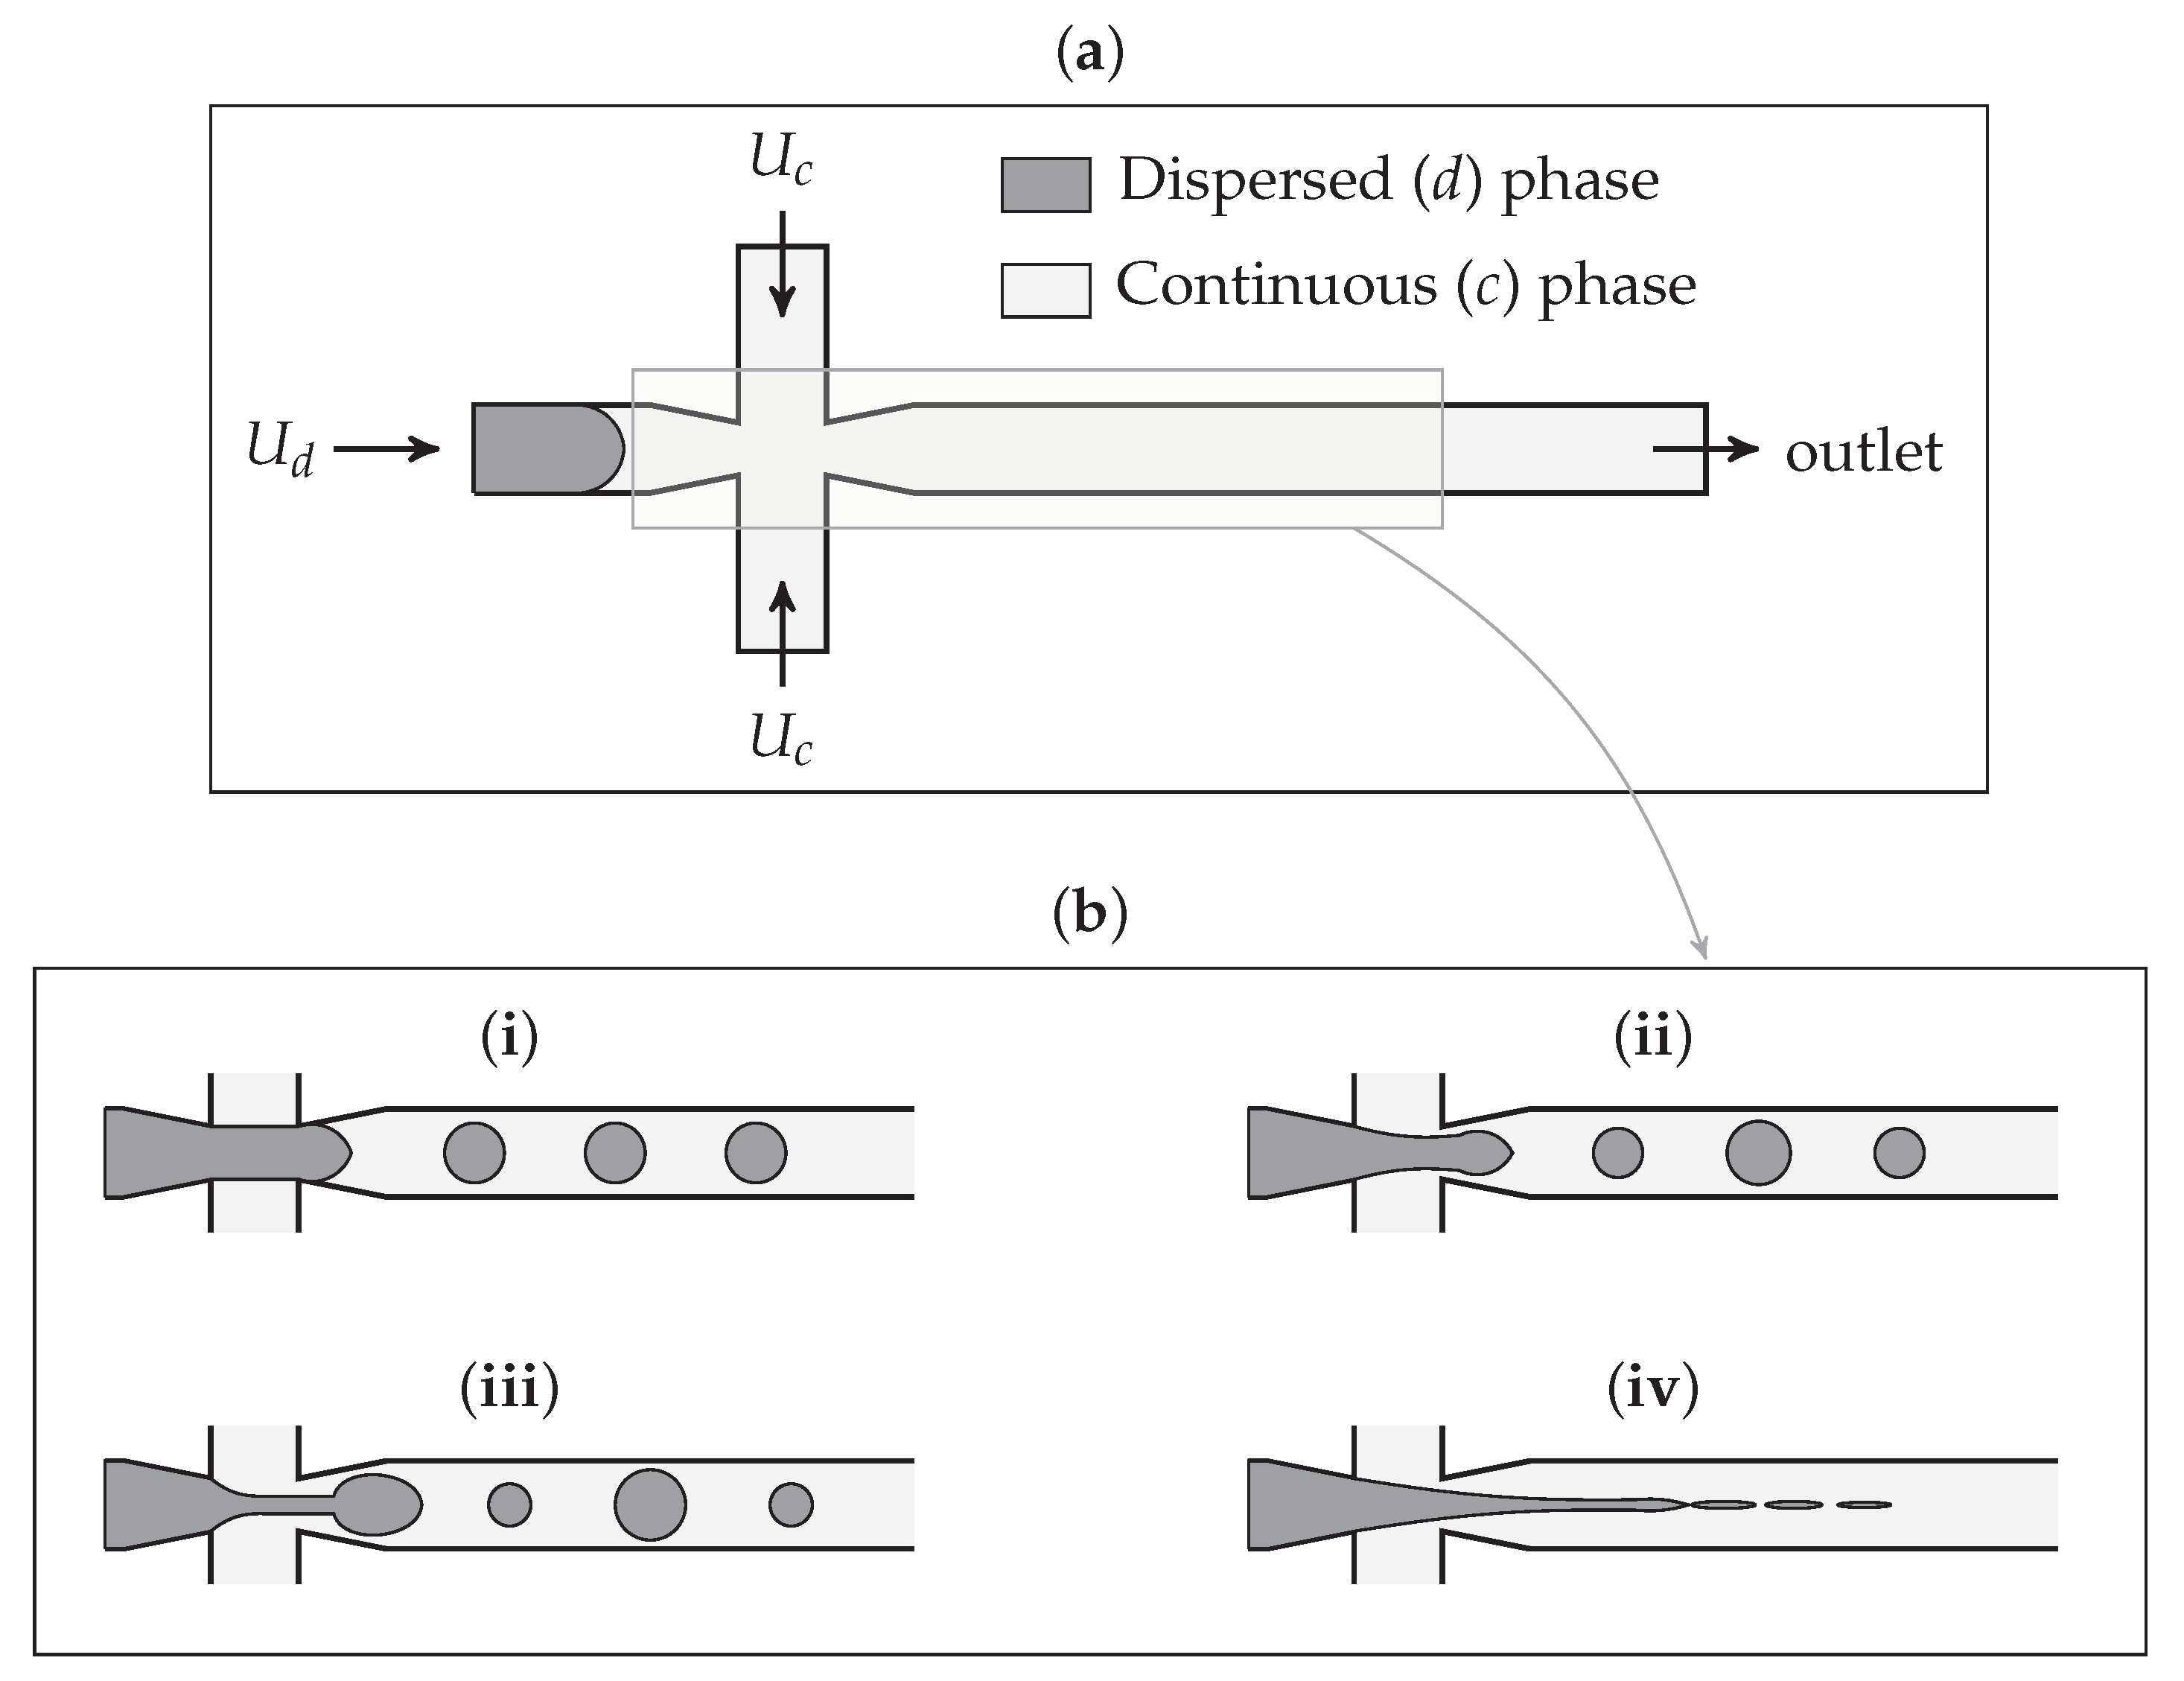
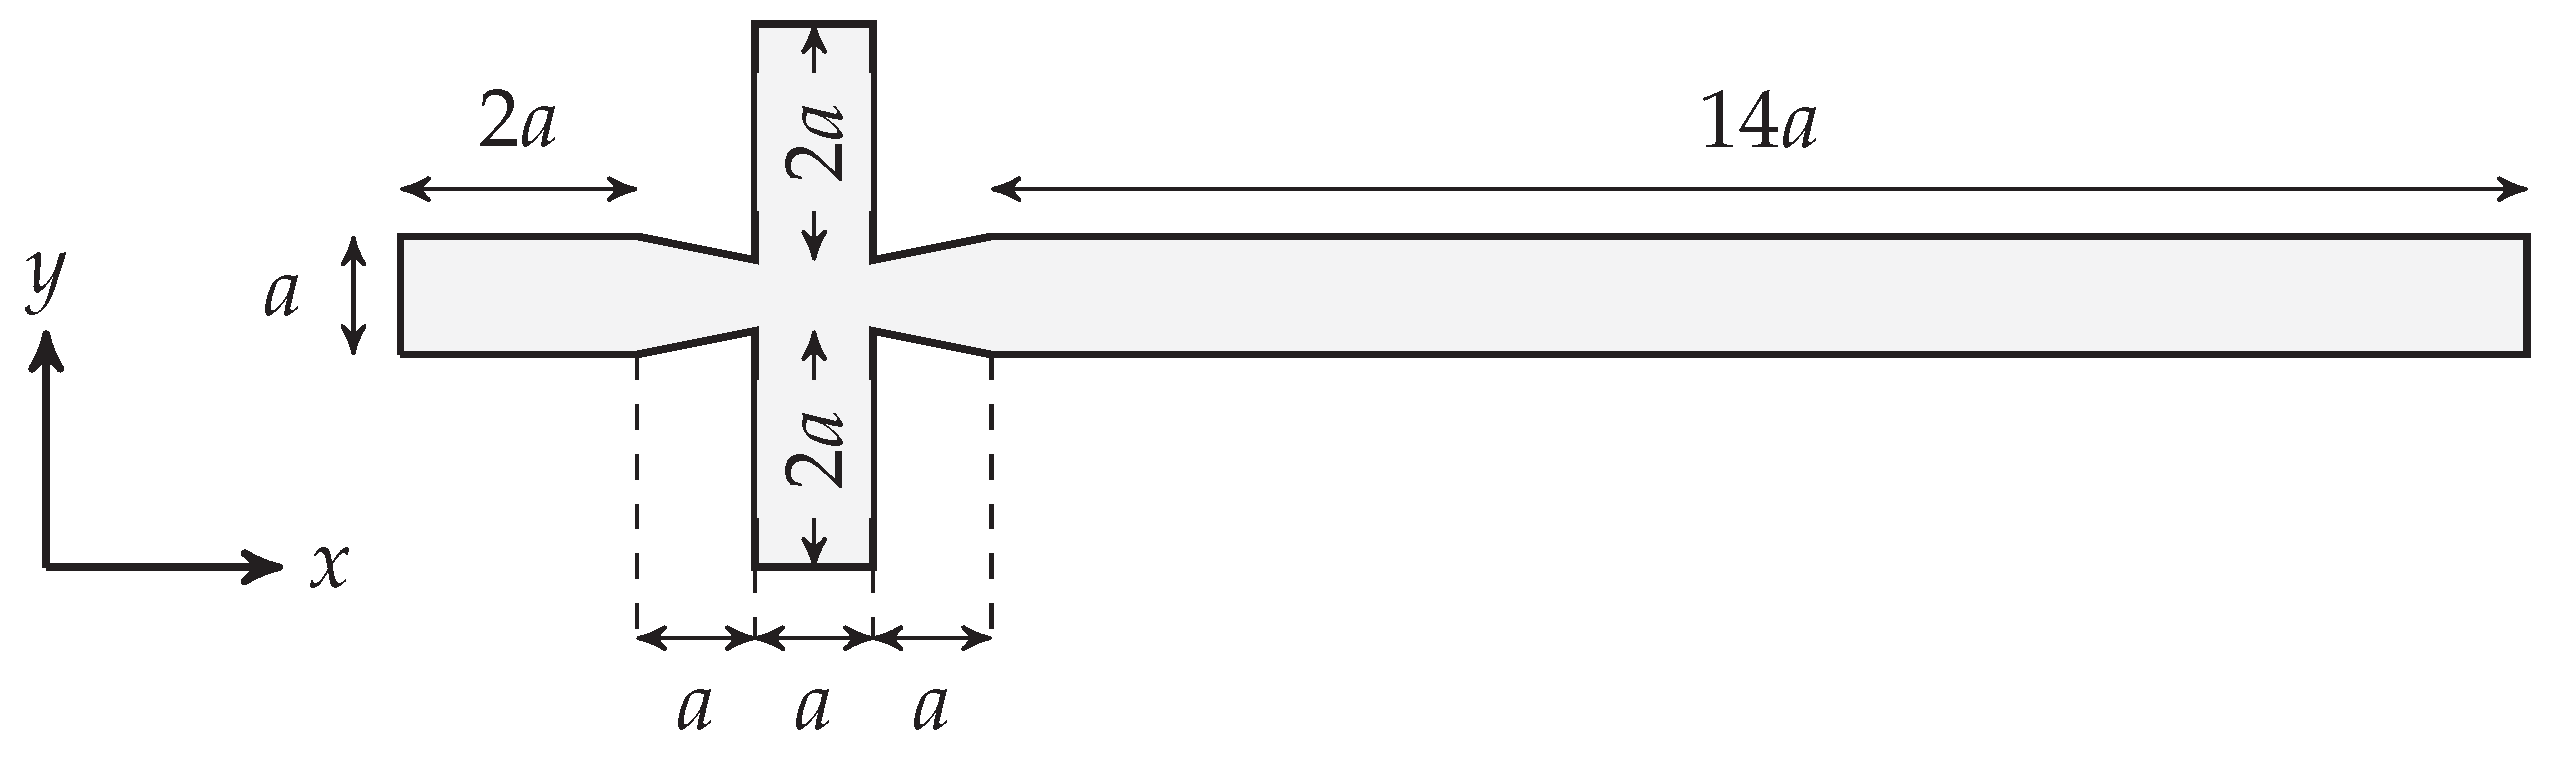
2.3. Channel Geometry
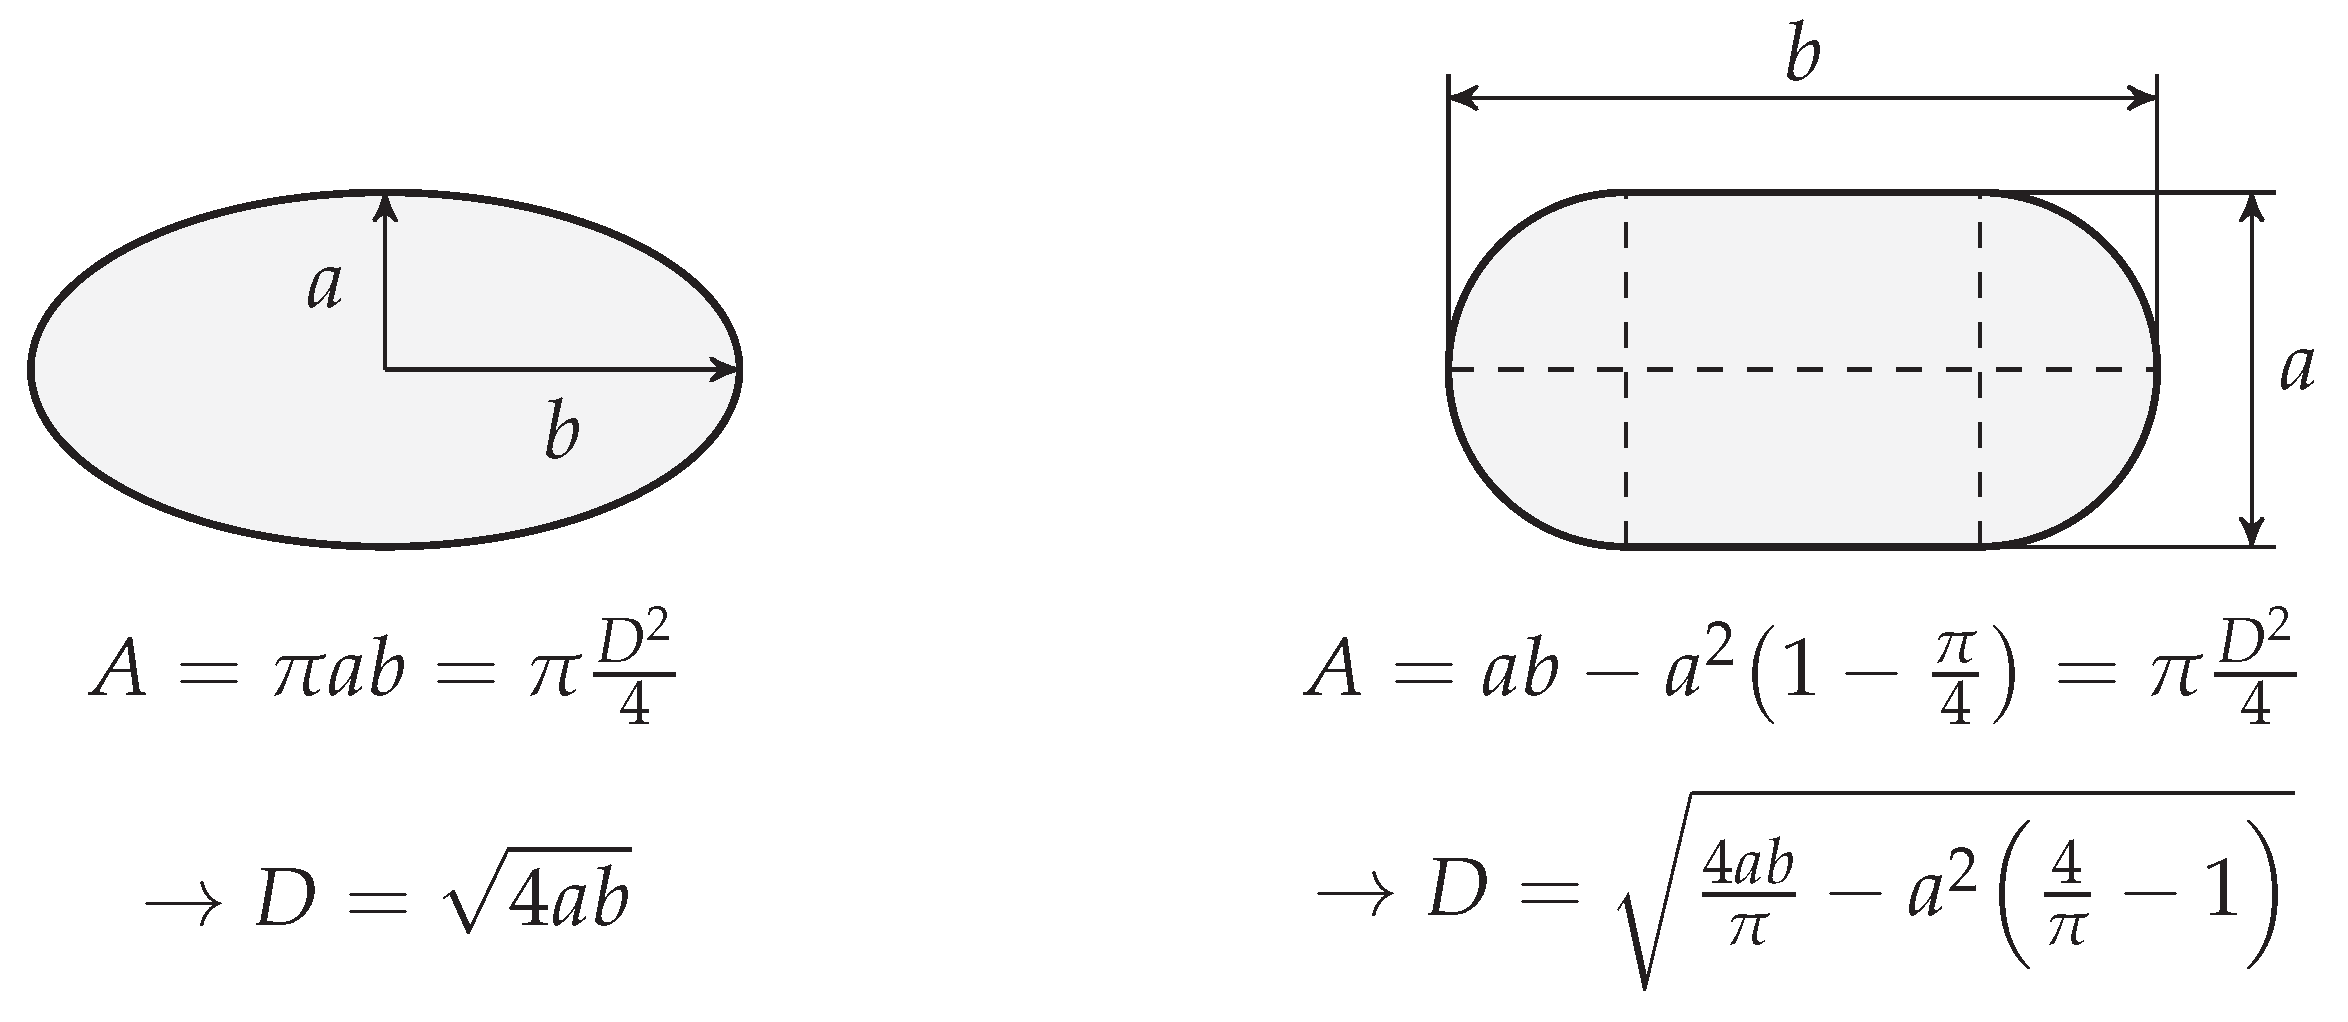
2.4. Droplet Size Calculation
2.5. Fluid Properties
3. Results and Discussion
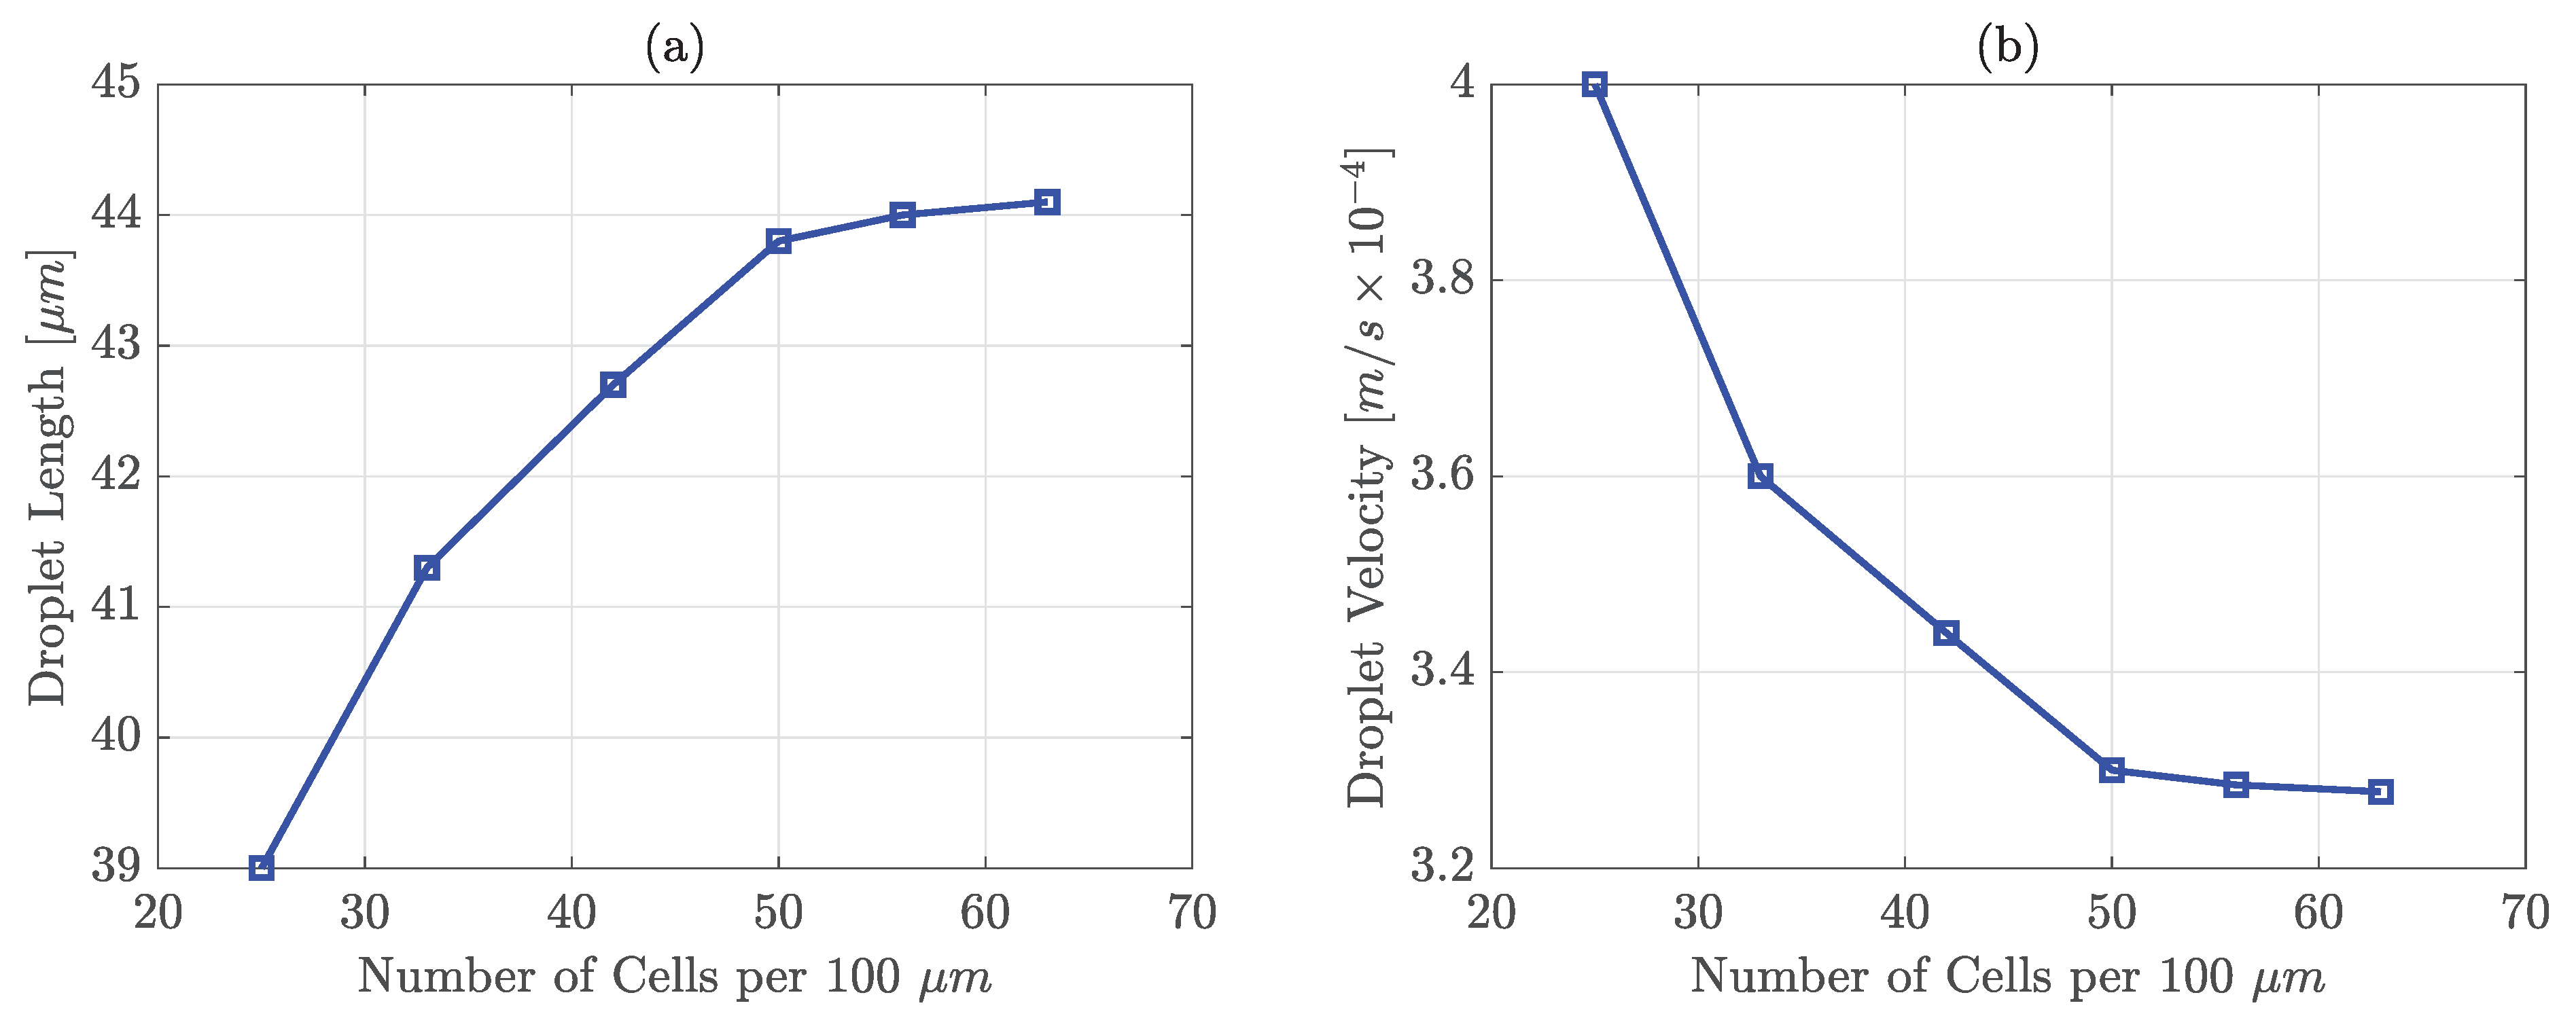
3.1. Mesh Convergence
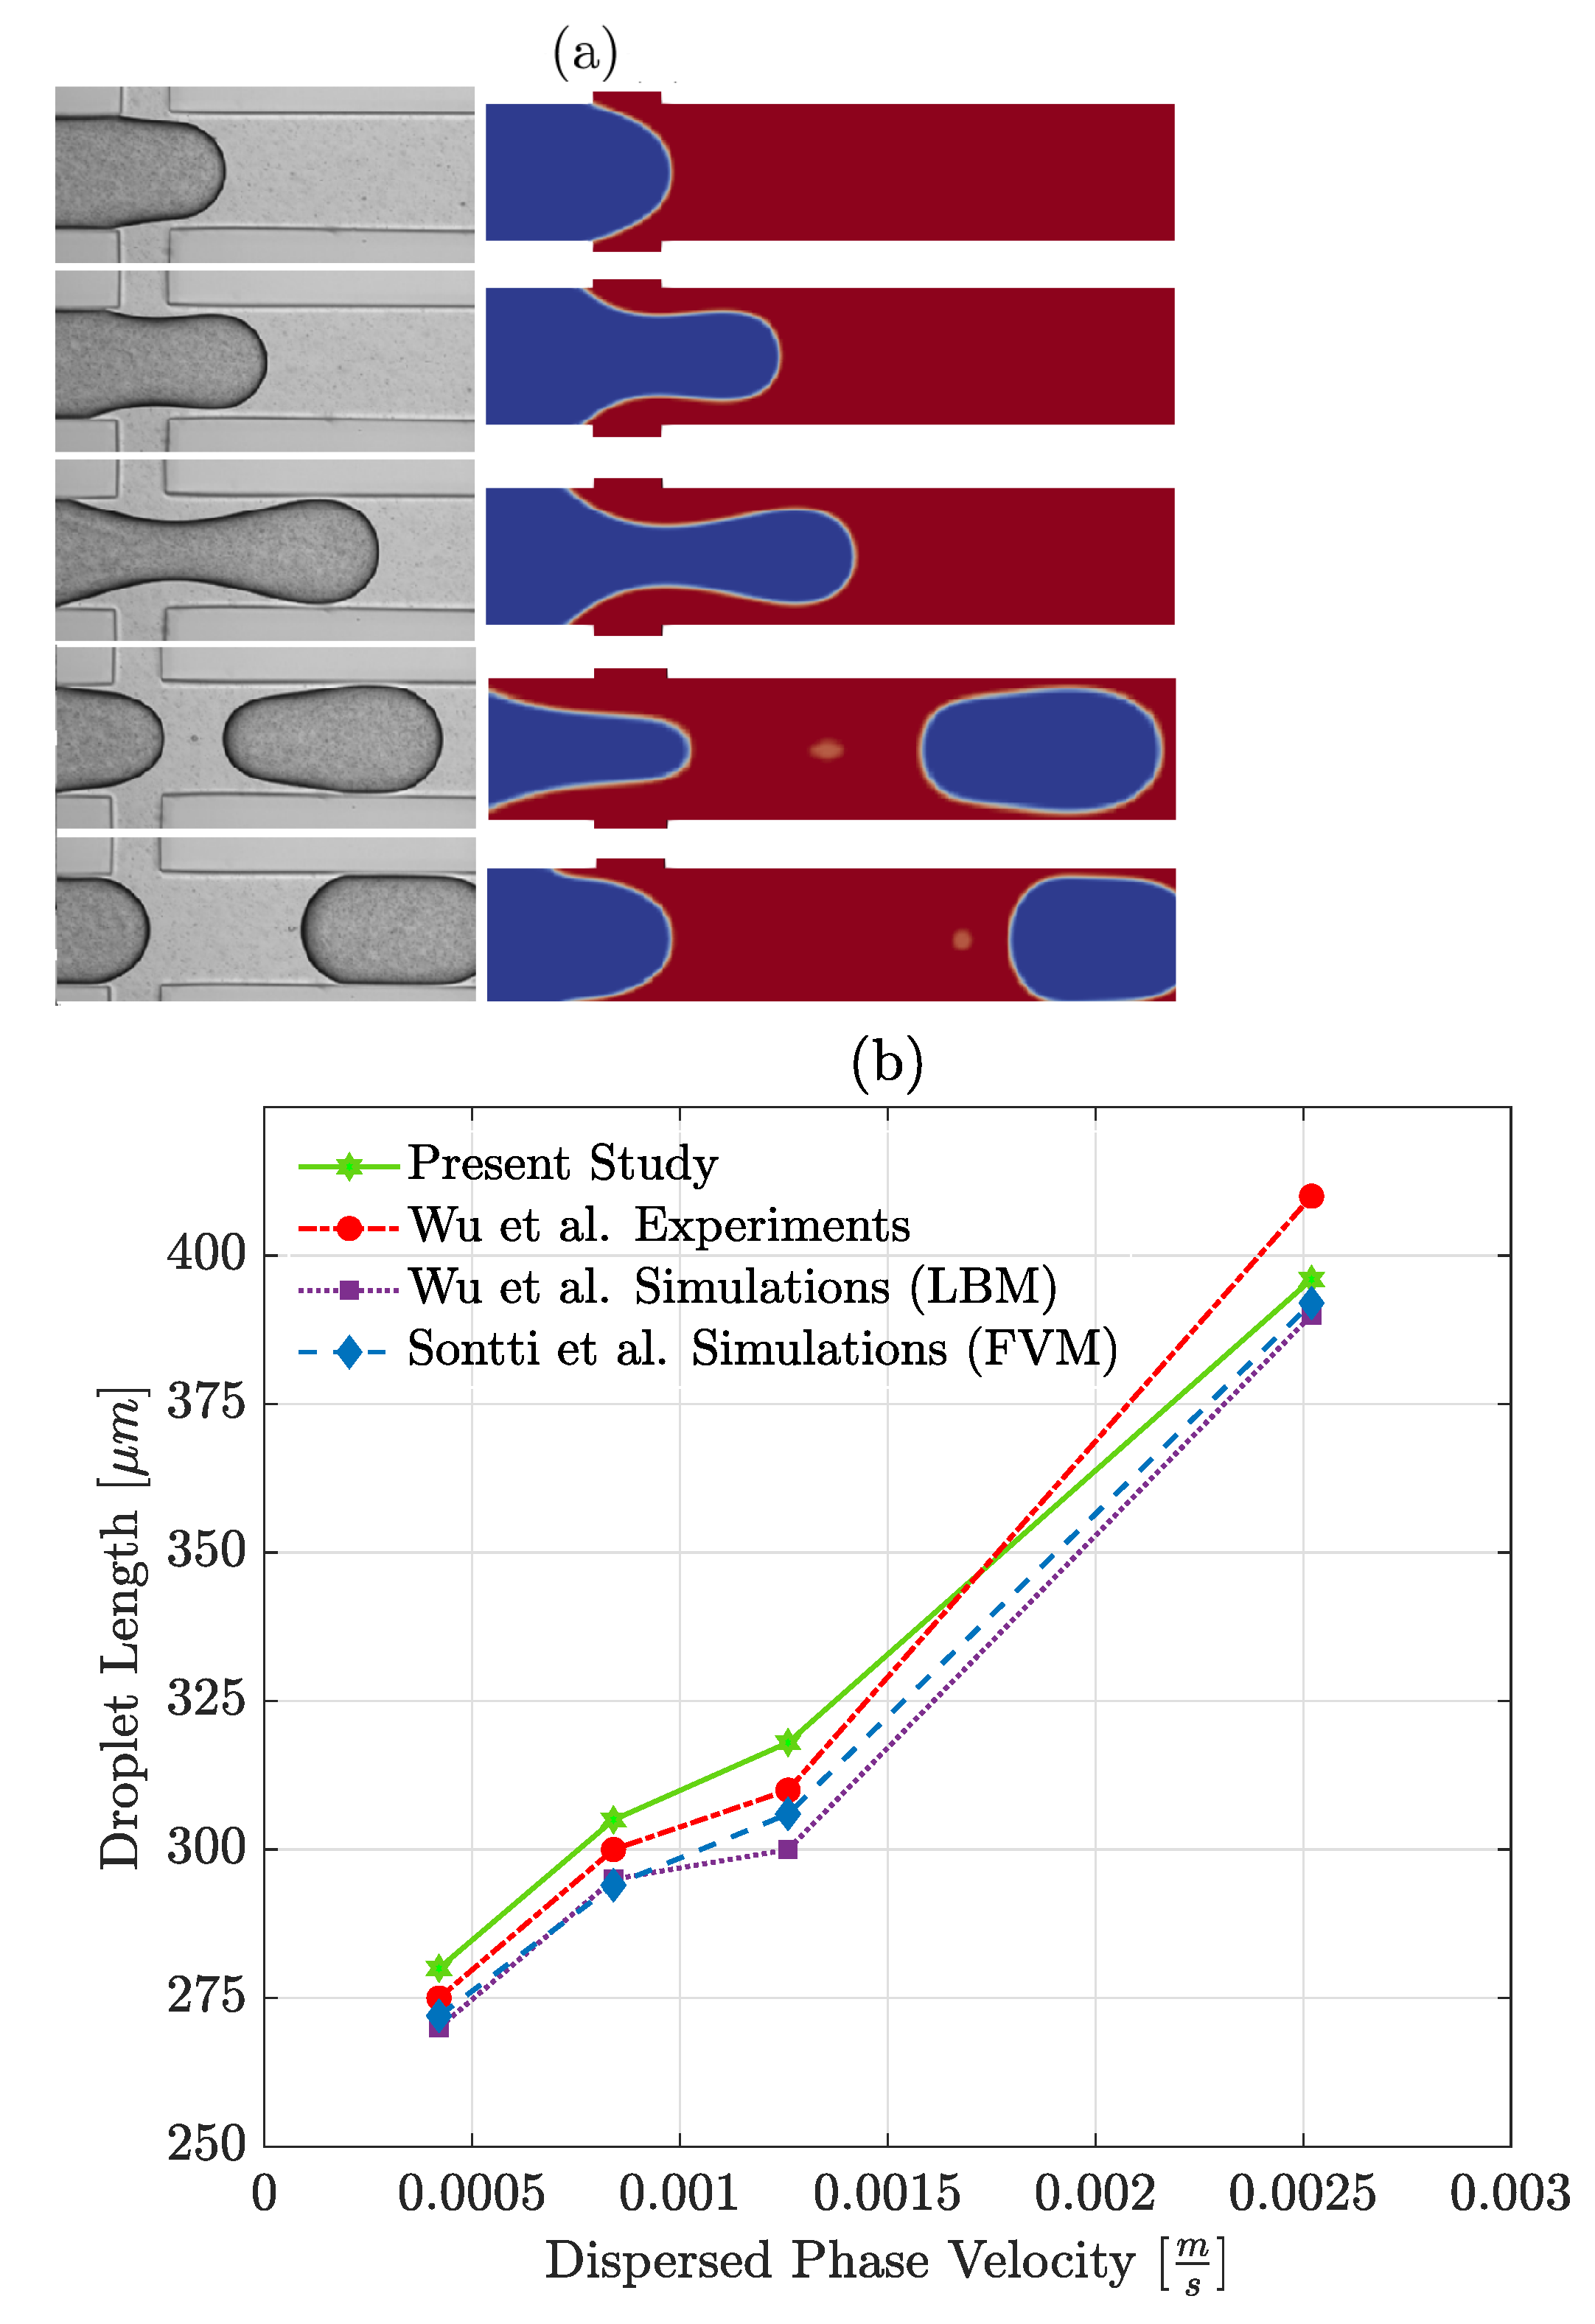
3.2. Validation
3.3. Droplet Size
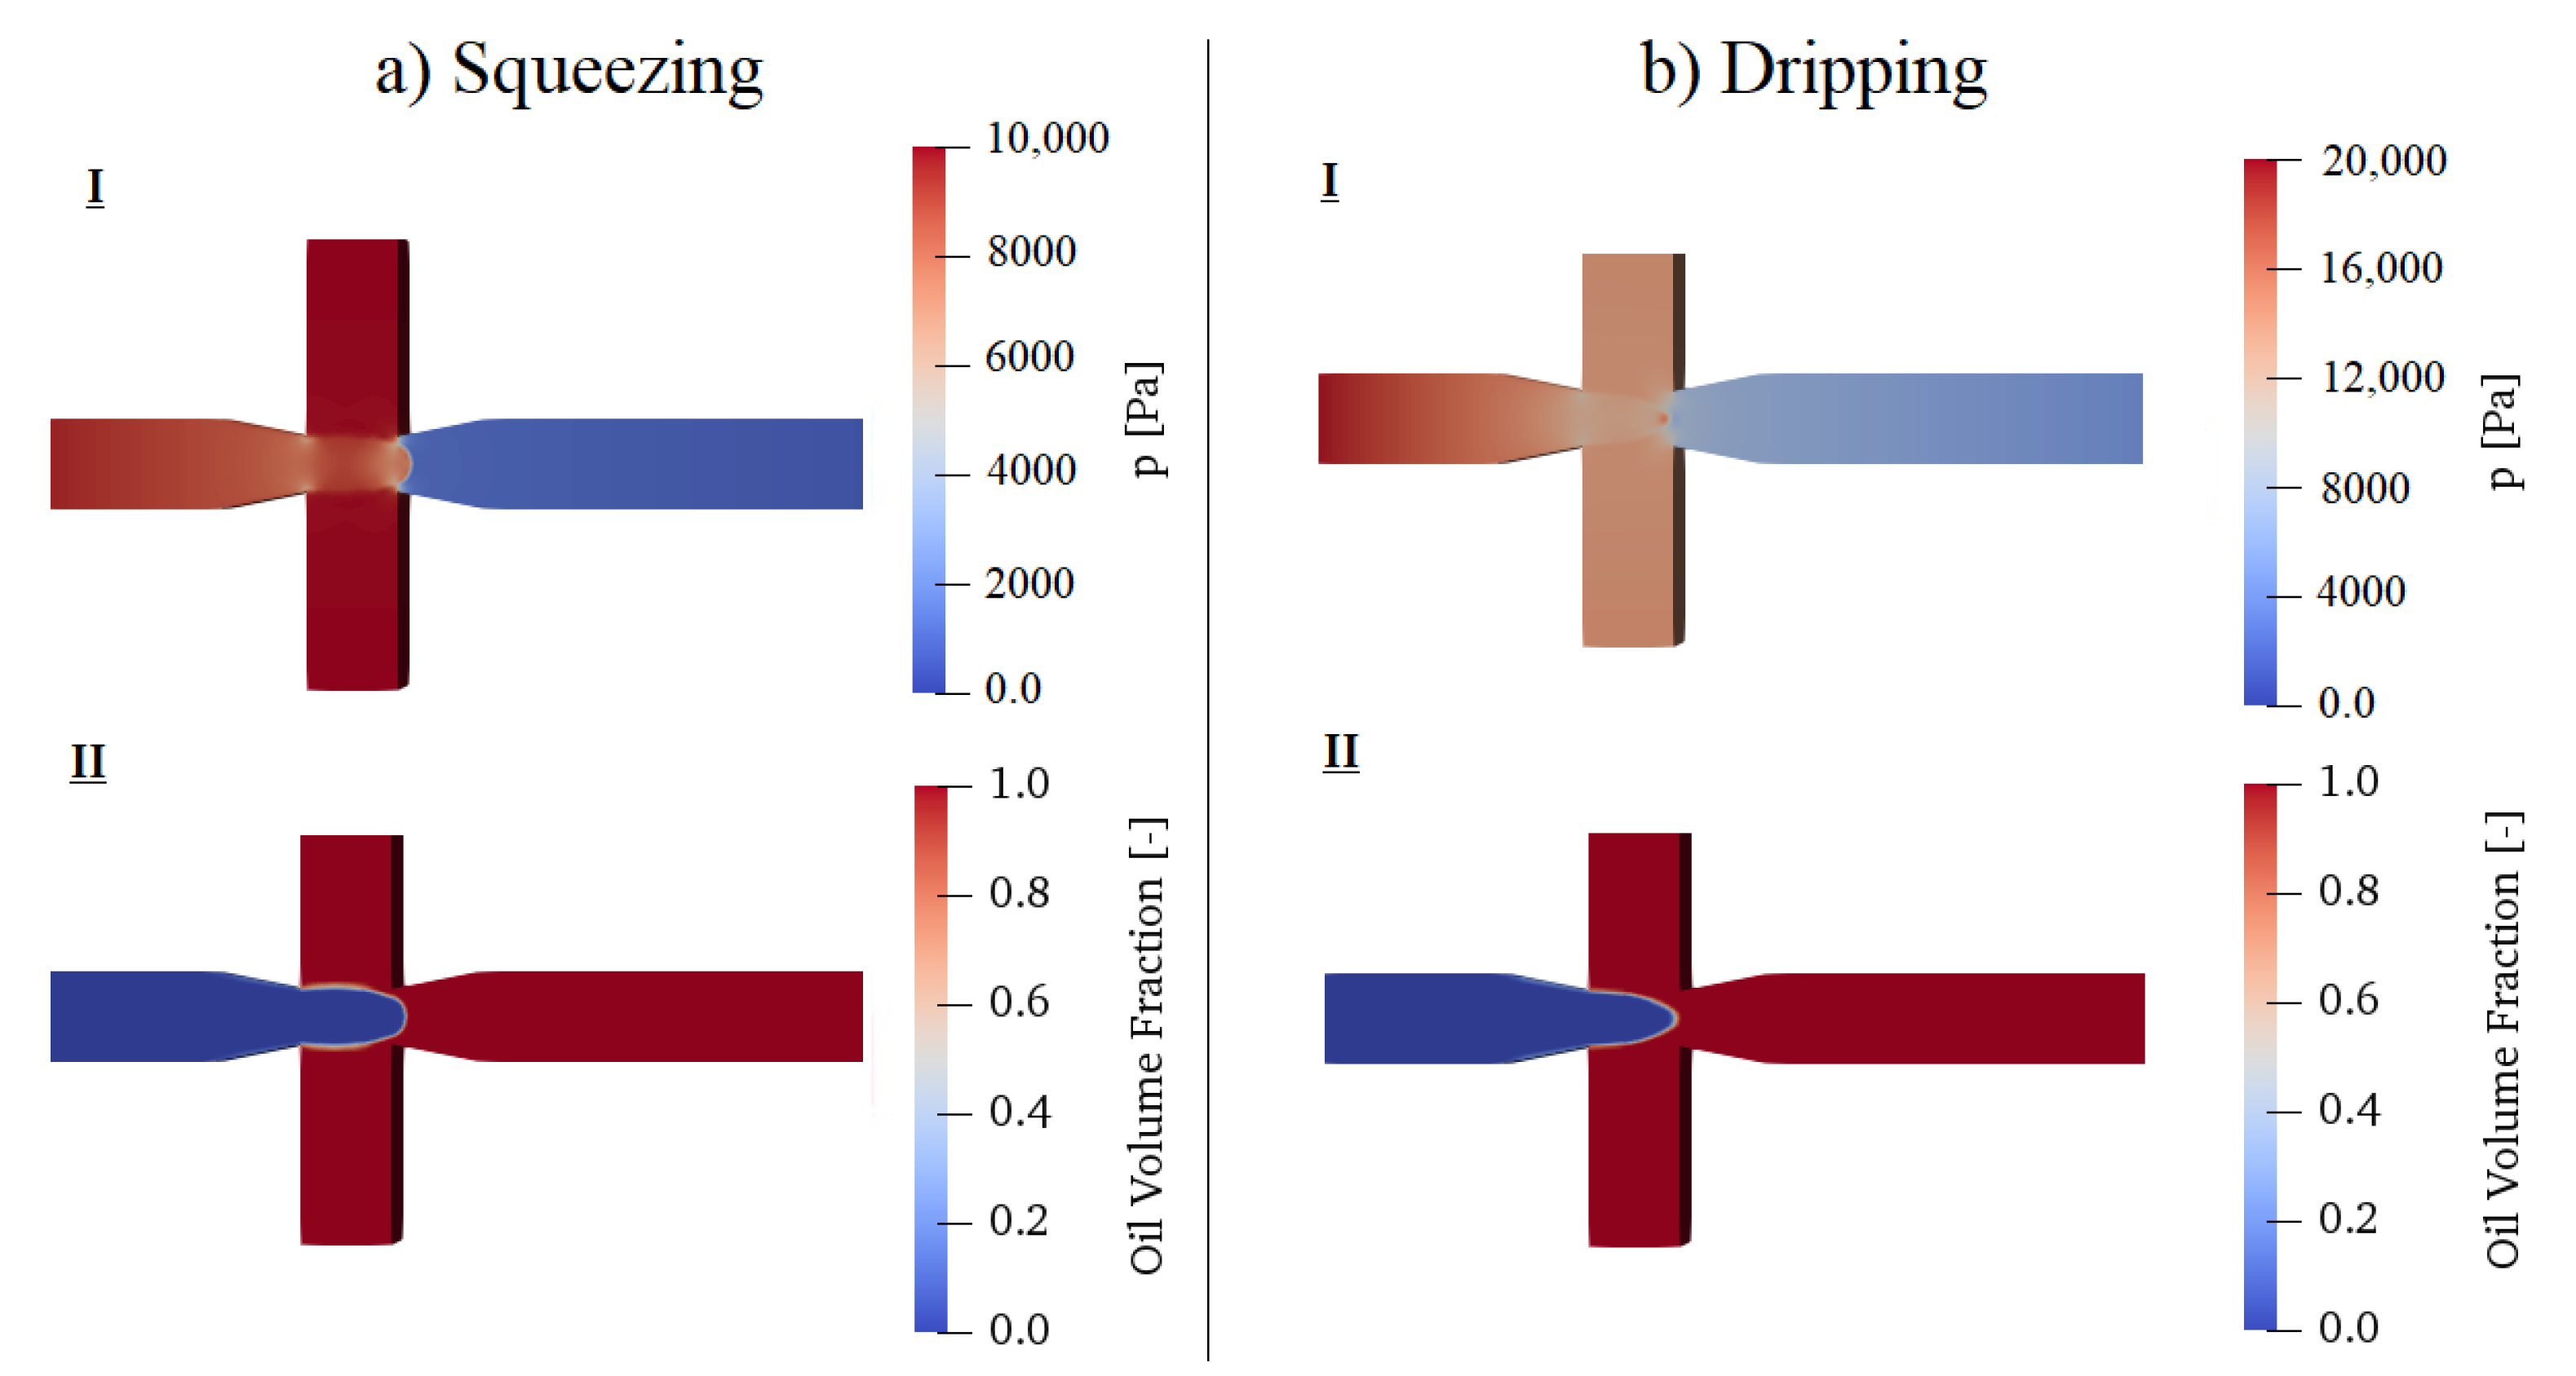
3.3.1. Squeezing
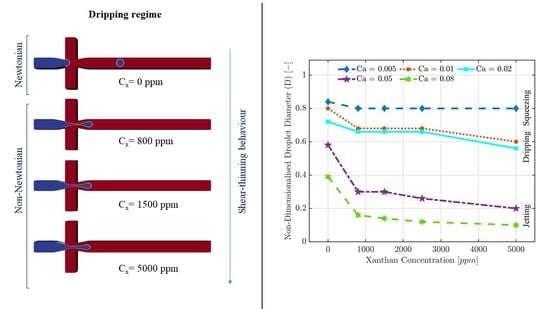
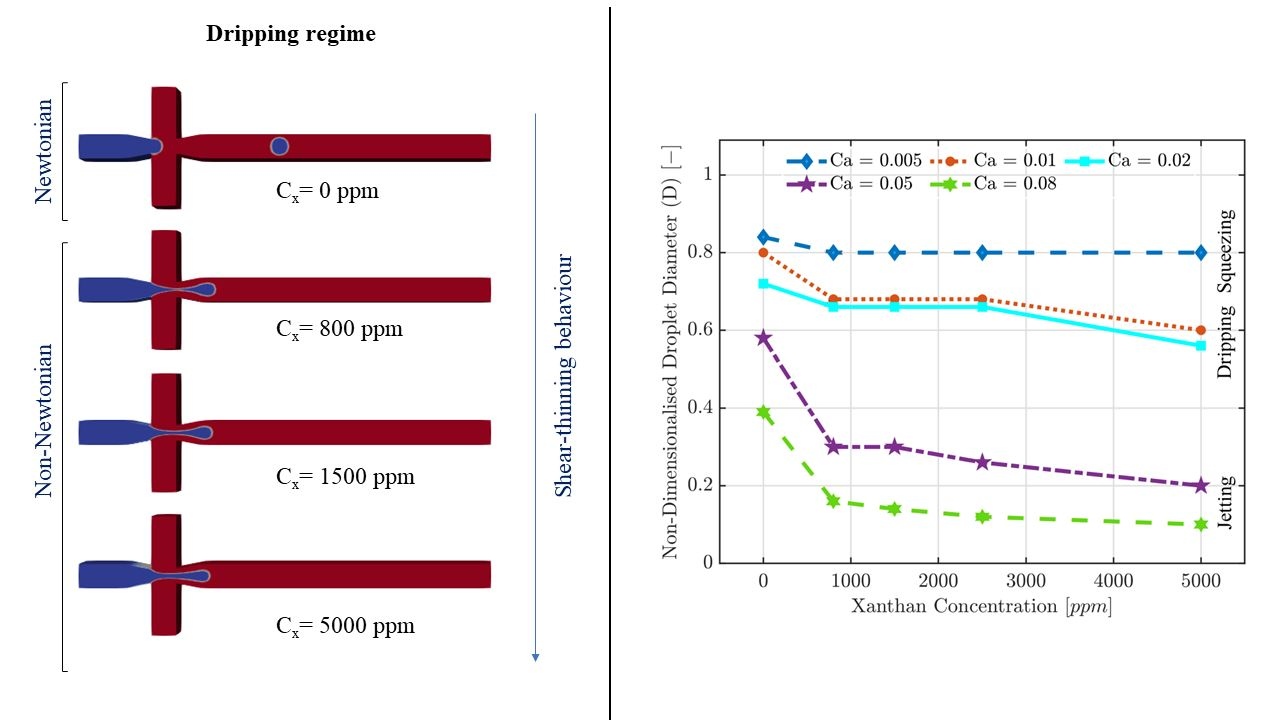
3.3.2. Dripping
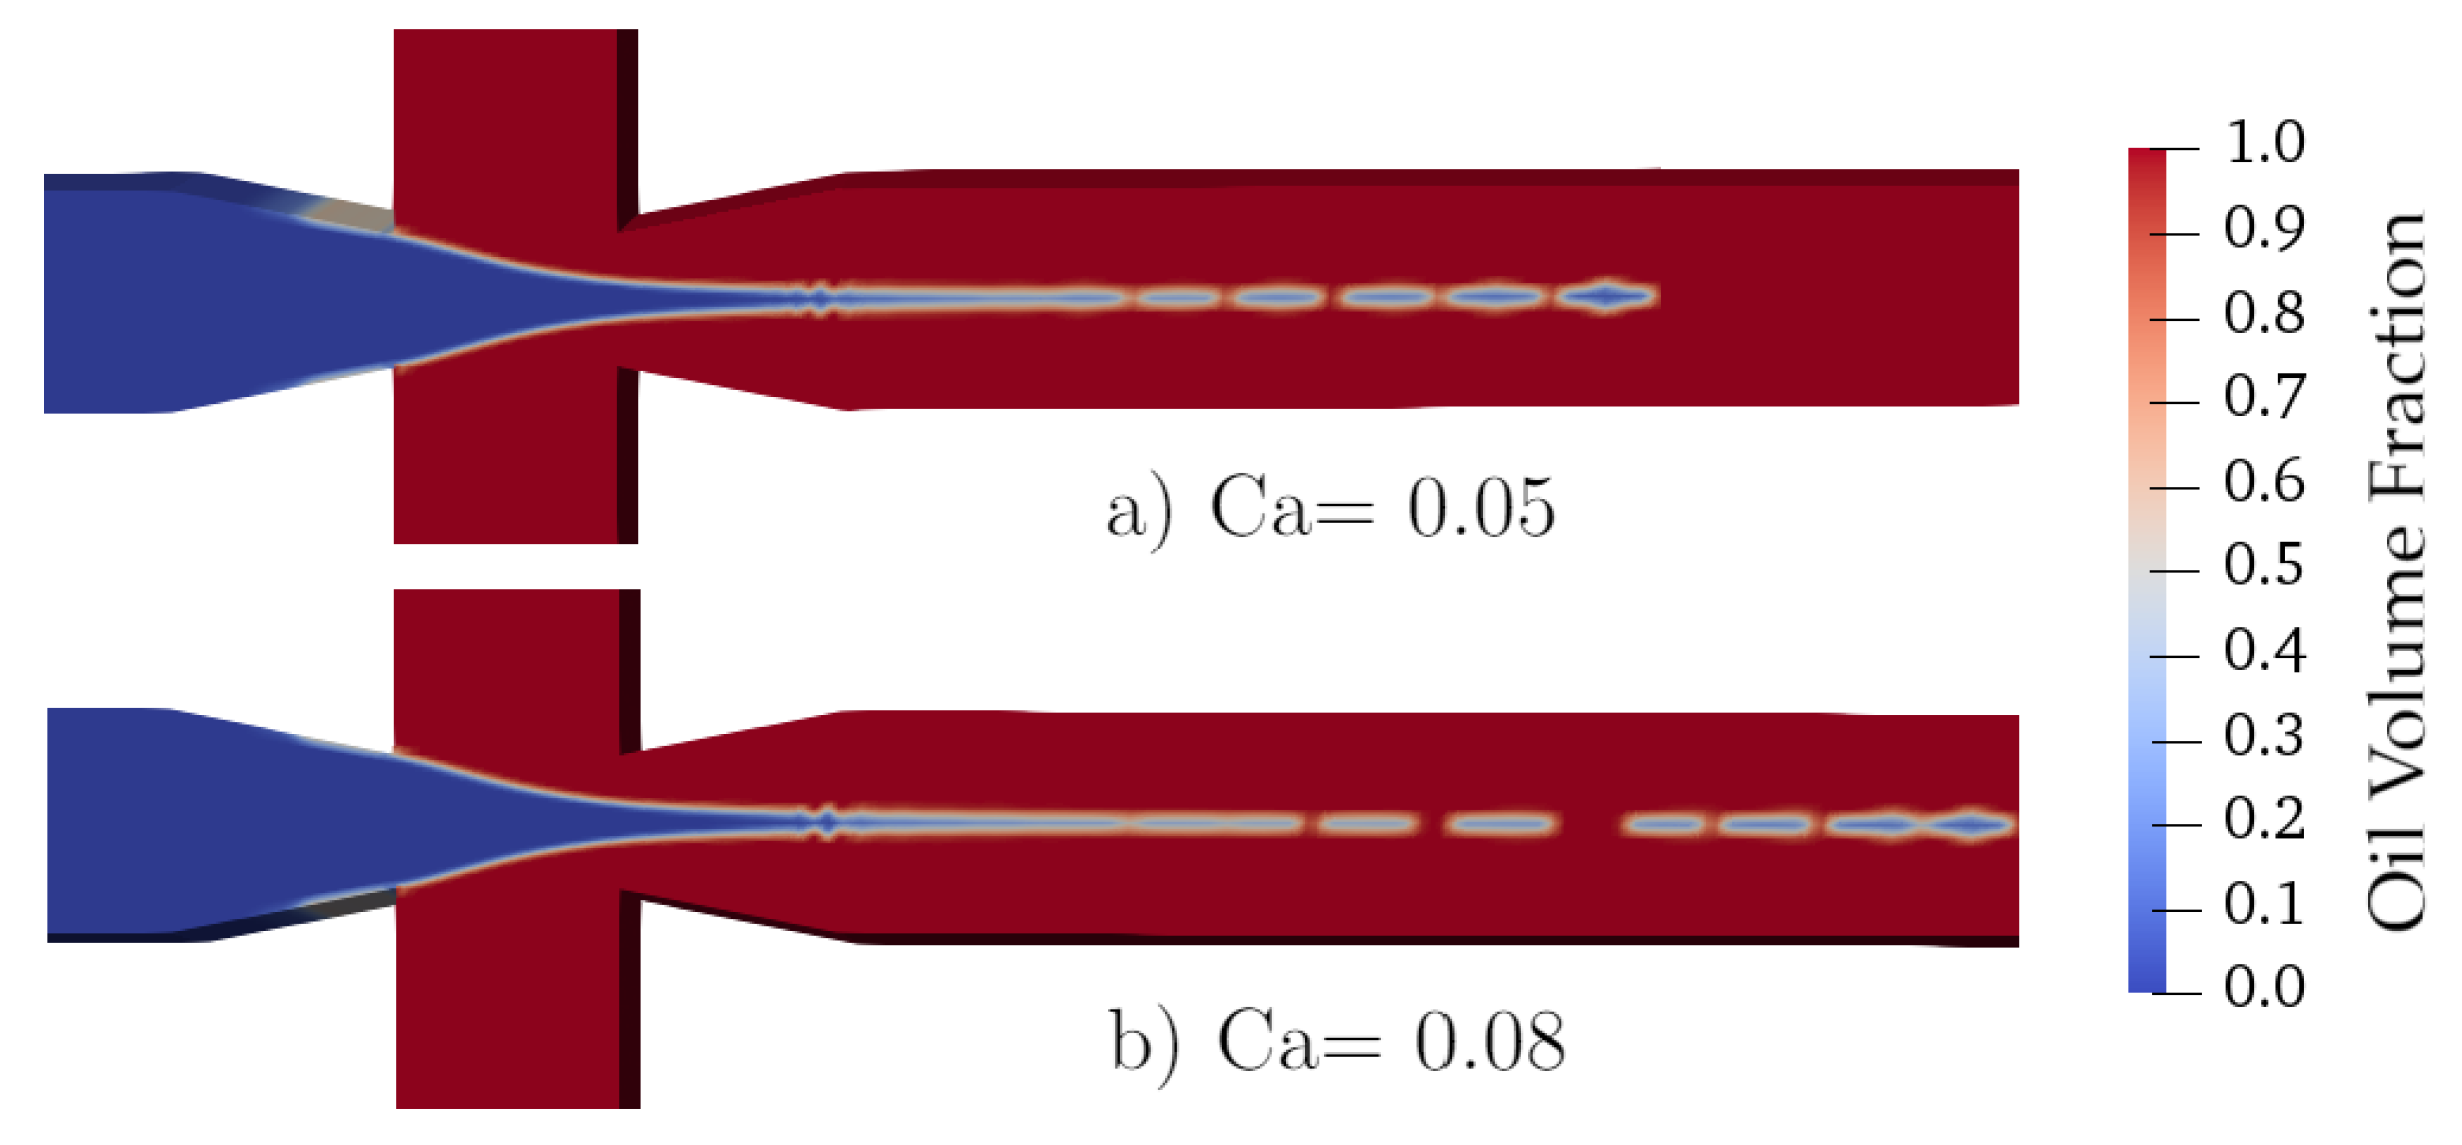
3.3.3. Jetting
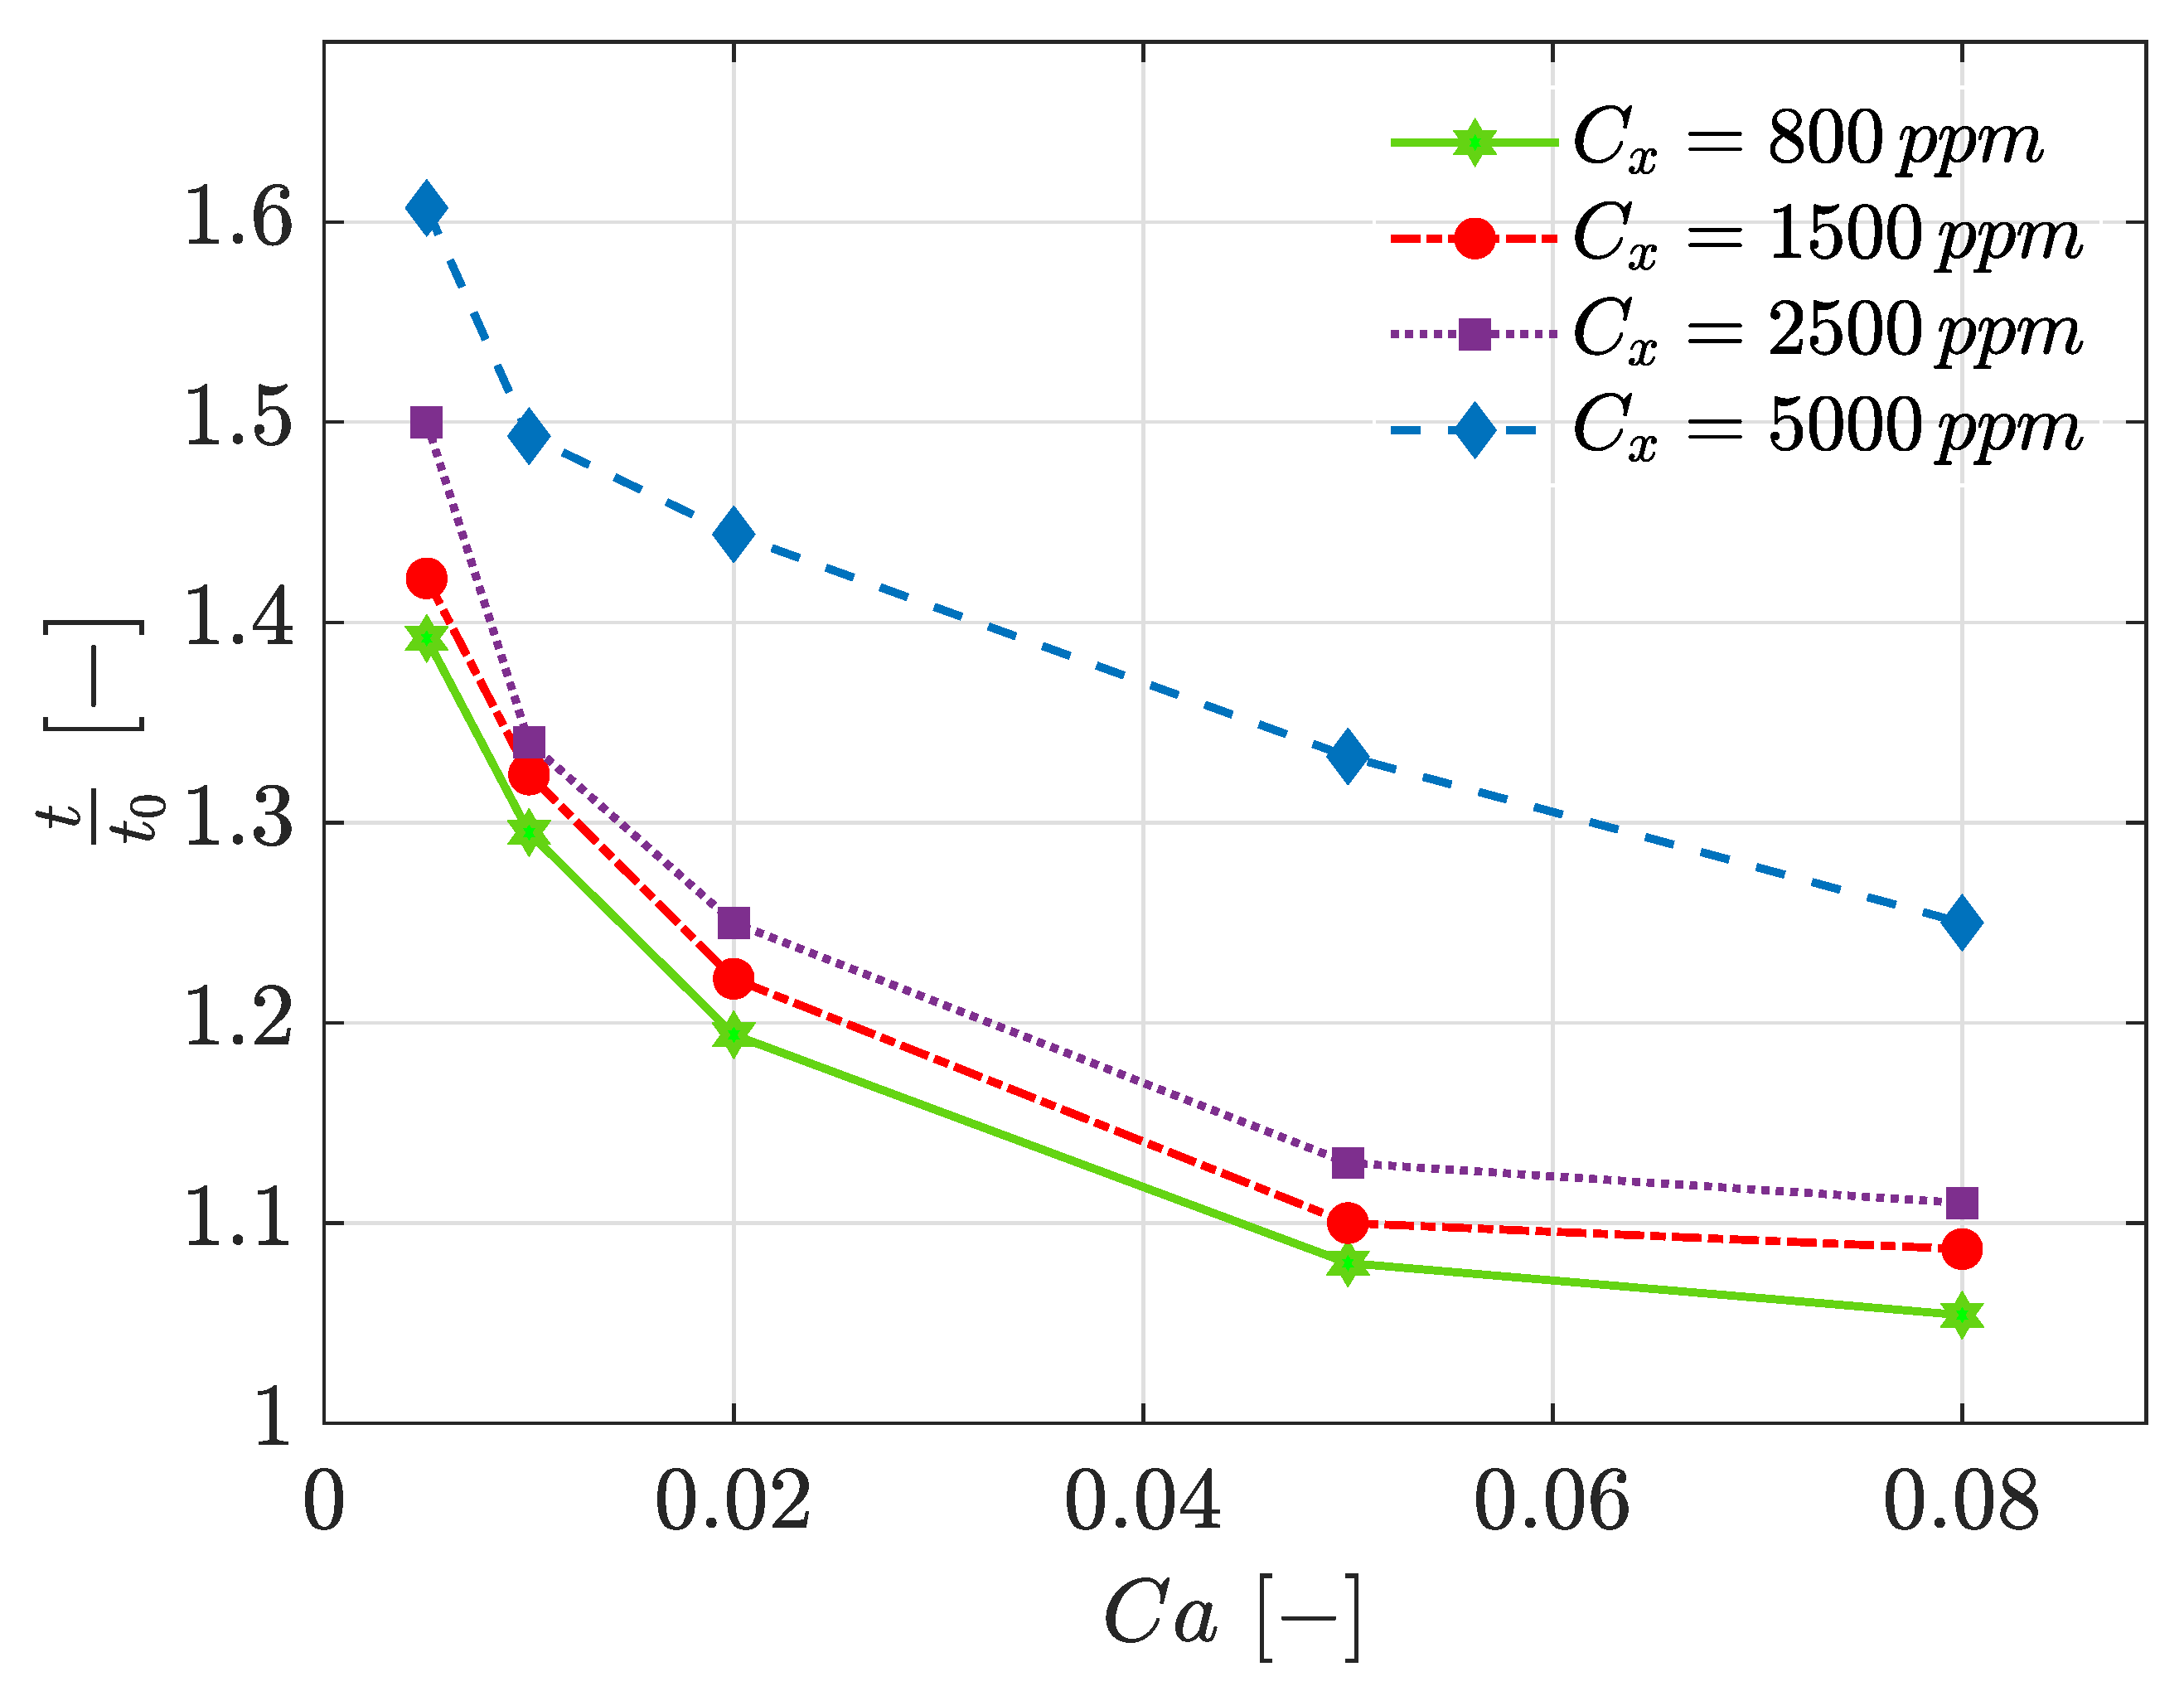
3.4. Detachment Time
4. Conclusions
- Non-Newtonian behaviour affected the droplet size and the influence became more apparent as the flow deviated more from being Newtonian.
- The droplet size reduced in all cases for all regimes compared to Newtonian fluid due to higher apparent viscosity.
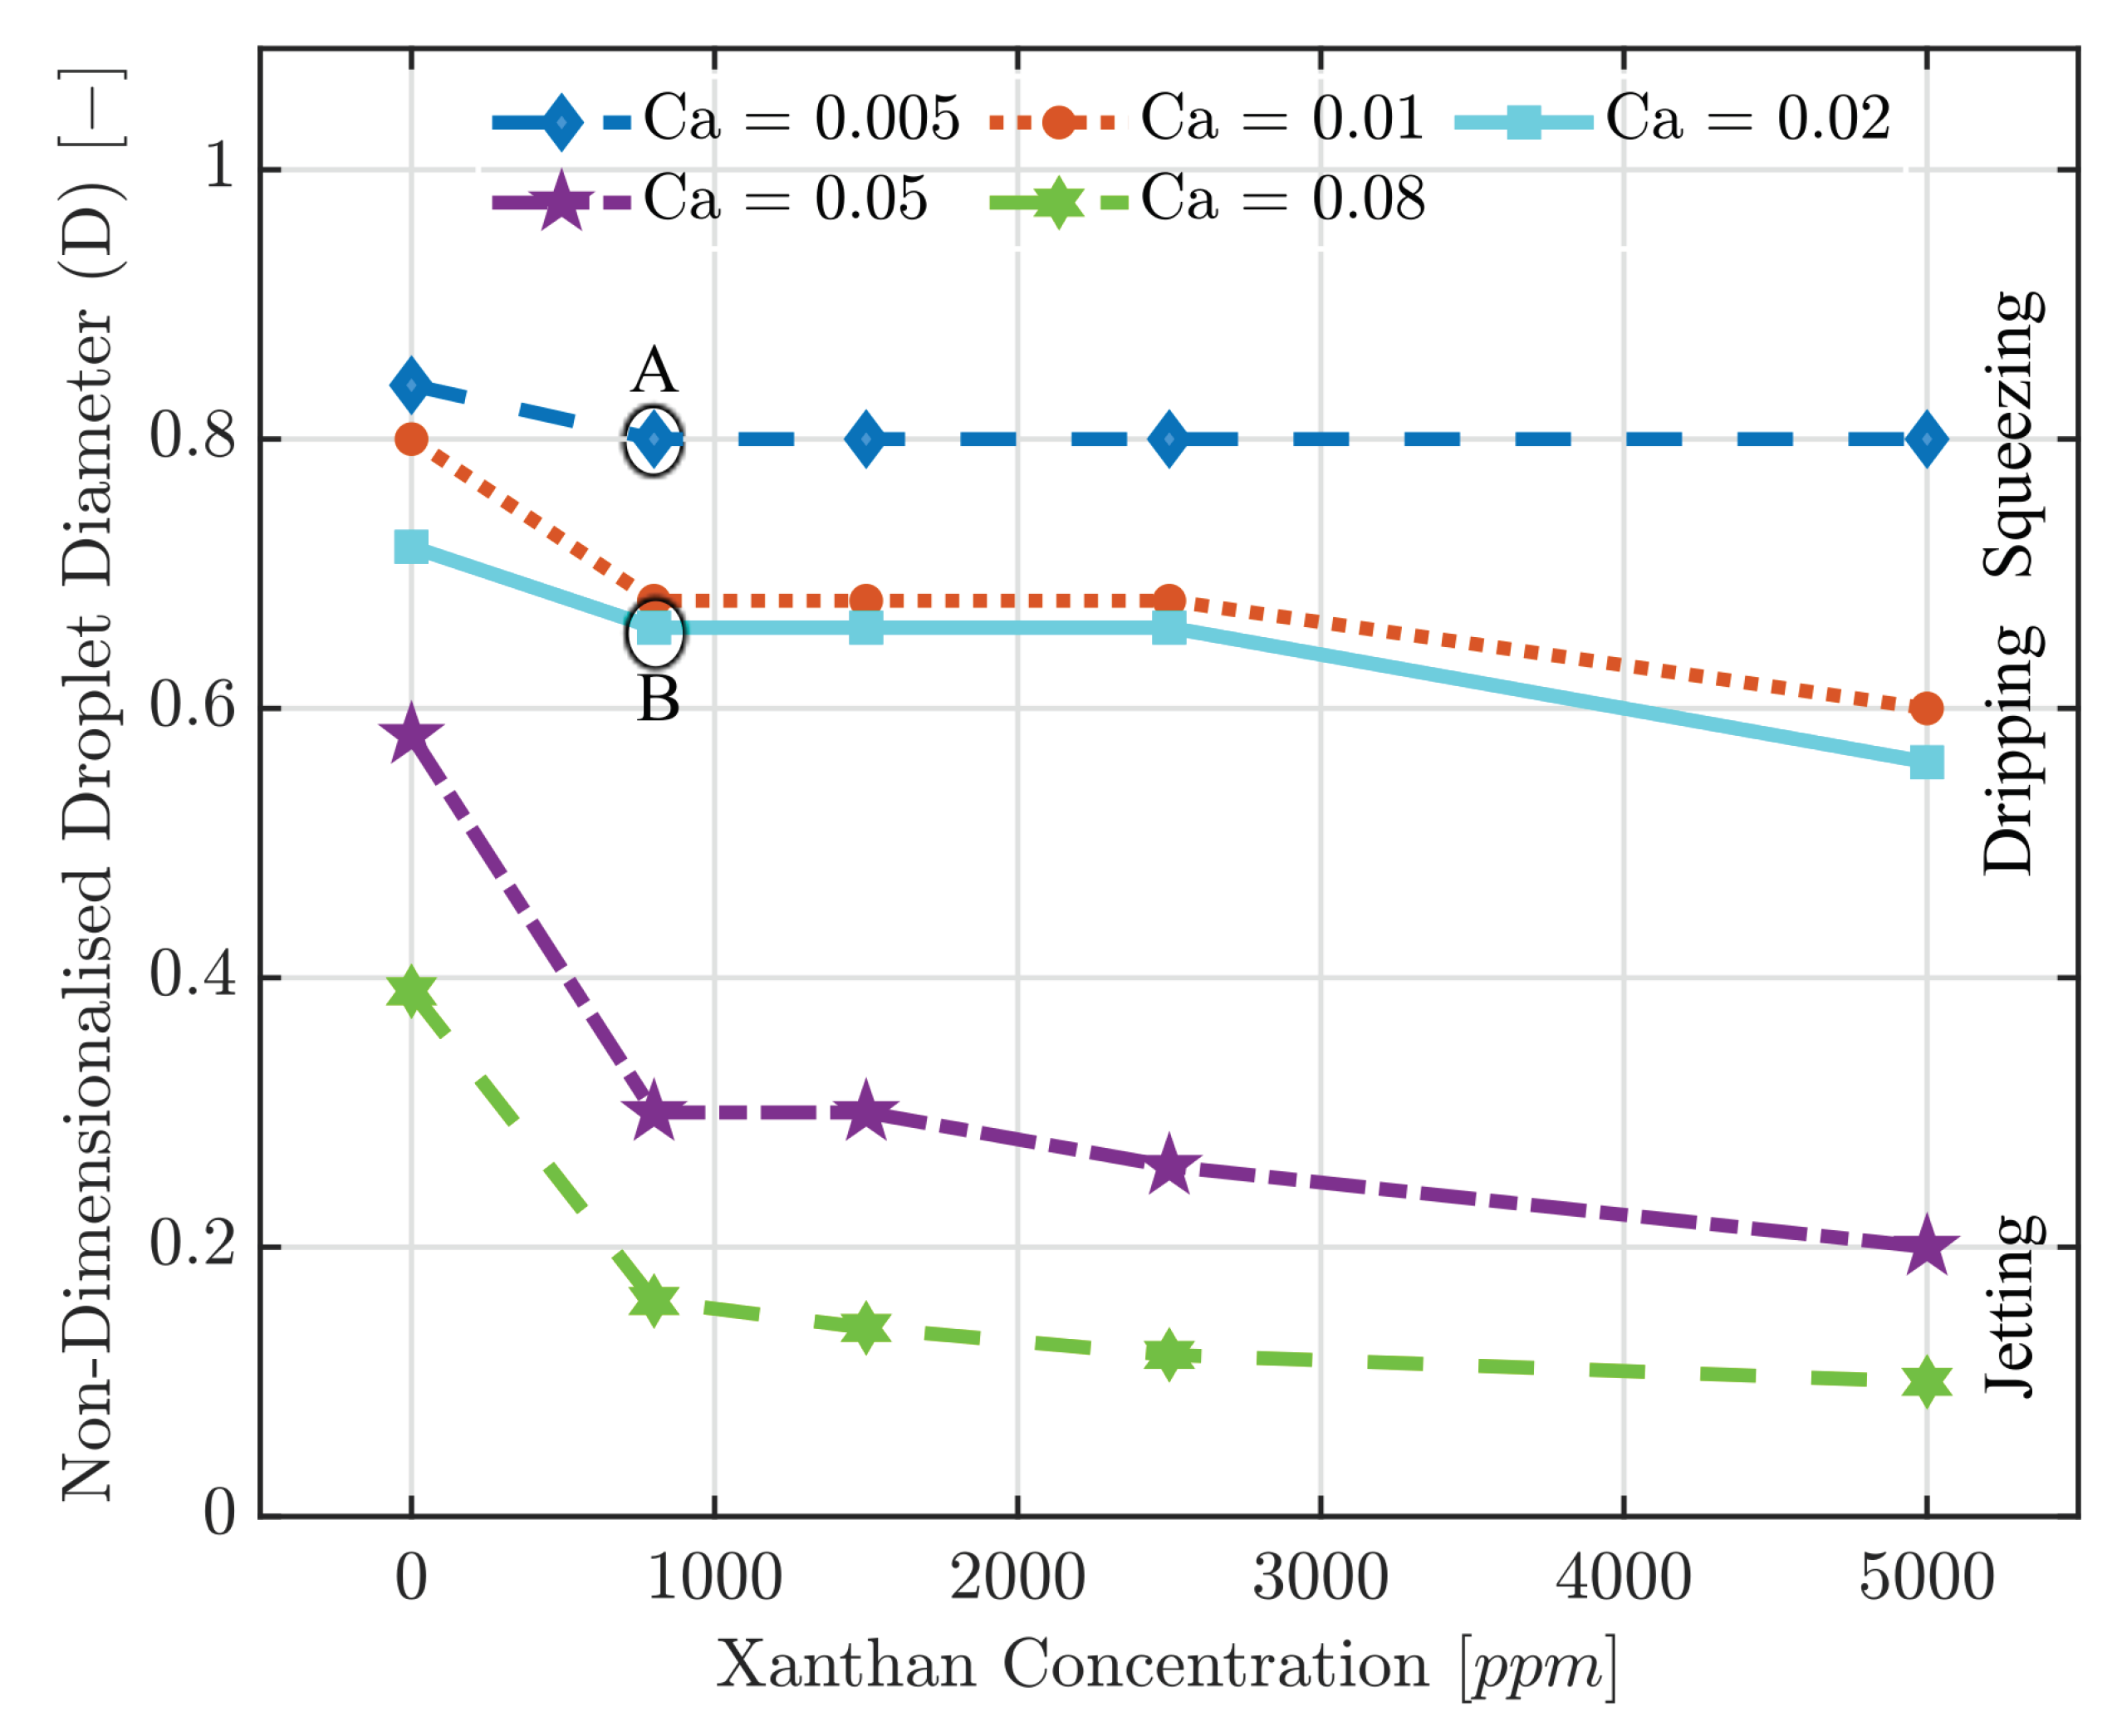
- In the squeezing regime, altering xanthan concentration did not change the droplet diameter because viscous stress is not the dominant force in this regime. Droplets form as a result of capillary pressure and channel blockage by the dispersed phase.
- In higher , high concentrations of polymer () caused a further reduction in droplet size, and this is due to the dominant influence of viscous forces (large apparent viscosity).
- At where jetting occurs for a Newtonian fluid, changing fluid rheology to highly shear-thinning behaviour will alter the droplet regime to tip-streaming.
- As concentration increases, an elongated dispersed thread is formed and penetrates further inside the continuous phase as a result of high viscous pressure. Consequently, the droplet breakup point moves toward downstream and the droplet pinch-off is delayed.
Author Contributions
Funding
Data Availability Statement
Conflicts of Interest
References
- Whitesides, G.M. The origins and the future of microfluidics. Nature 2006, 442, 368–373. [Google Scholar] [CrossRef]
- Leman, M.; Abouakil, F.; Griffiths, A.D.; Tabeling, P. Droplet-based microfluidics at the femtolitre scale. Lab Chip 2015, 15, 753–765. [Google Scholar] [CrossRef] [PubMed]
- Samiei, E.; Tabrizian, M.; Hoorfar, M. A review of digital microfluidics as portable platforms for lab-on a-chip applications. Lab Chip 2016, 16, 2376–2396. [Google Scholar] [CrossRef] [PubMed]
- Anna, S.L. Droplets and bubbles in microfluidic devices. Annu. Rev. Fluid Mech. 2016, 48, 285–309. [Google Scholar] [CrossRef]
- Sesen, M.; Alan, T.; Neild, A. Droplet control technologies for microfluidic high throughput screening (μHTS). Lab Chip 2017, 17, 2372–2394. [Google Scholar] [CrossRef]
- Zeng, Y.; Shin, M.; Wang, T. Programmable active droplet generation enabled by integrated pneumatic micropumps. Lab Chip 2013, 13, 267–273. [Google Scholar] [CrossRef]
- Brenker, J.C.; Collins, D.J.; Van Phan, H.; Alan, T.; Neild, A. On-chip droplet production regimes using surface acoustic waves. Lab Chip 2016, 16, 1675–1683. [Google Scholar] [CrossRef]
- Sánchez Barea, J.; Lee, J.; Kang, D.K. Recent advances in droplet-based microfluidic technologies for biochemistry and molecular biology. Micromachines 2019, 10, 412. [Google Scholar] [CrossRef]
- Garstecki, P.; Fuerstman, M.J.; Stone, H.A.; Whitesides, G.M. Formation of droplets and bubbles in a microfluidic T-junction—scaling and mechanism of break-up. Lab Chip 2006, 6, 437–446. [Google Scholar] [CrossRef] [PubMed]
- Van der Graaf, S.; Nisisako, T.; Schroën, C.; Van Der Sman, R.; Boom, R. Lattice Boltzmann simulations of droplet formation in a T-shaped microchannel. Langmuir 2006, 22, 4144–4152. [Google Scholar] [CrossRef] [PubMed]
- Chen, Q.; Li, J.; Song, Y.; Christopher, D.M.; Li, X. Modeling of Newtonian droplet formation in power-law non-Newtonian fluids in a flow-focusing device. Heat Mass Transf. 2020, 56, 2711–2723. [Google Scholar] [CrossRef]
- Besanjideh, M.; Shamloo, A.; Kazemzadeh Hannani, S. Enhanced oil-in-water droplet generation in a T-junction microchannel using water-based nanofluids with shear-thinning behavior: A numerical study. Phys. Fluids 2021, 33, 012007. [Google Scholar] [CrossRef]
- Zhu, P.; Wang, L. Passive and active droplet generation with microfluidics: A review. Lab Chip 2017, 17, 34–75. [Google Scholar] [CrossRef] [PubMed]
- Thorsen, T.; Roberts, R.W.; Arnold, F.H.; Quake, S.R. Dynamic pattern formation in a vesicle-generating microfluidic device. Phys. Rev. Lett. 2001, 86, 4163. [Google Scholar] [CrossRef] [PubMed]
- Anna, S.L.; Bontoux, N.; Stone, H.A. Formation of dispersions using “flow focusing” in microchannels. Appl. Phys. Lett. 2003, 82, 364–366. [Google Scholar] [CrossRef]
- Fu, T.; Wu, Y.; Ma, Y.; Li, H.Z. Droplet formation and breakup dynamics in microfluidic flow-focusing devices: From dripping to jetting. Chem. Eng. Sci. 2012, 84, 207–217. [Google Scholar] [CrossRef]
- Sartipzadeh, O.; Naghib, S.M.; Seyfoori, A.; Rahmanian, M.; Fateminia, F.S. Controllable size and form of droplets in microfluidic-assisted devices: Effects of channel geometry and fluid velocity on droplet size. Mater. Sci. Eng. C 2020, 109, 110606. [Google Scholar] [CrossRef] [PubMed]
- Soh, G.Y.; Yeoh, G.H.; Timchenko, V. Improved volume-of-fluid (VOF) model for predictions of velocity fields and droplet lengths in microchannels. Flow Meas. Instrum. 2016, 51, 105–115. [Google Scholar] [CrossRef]
- Sang, L.; Hong, Y.; Wang, F. Investigation of viscosity effect on droplet formation in T-shaped microchannels by numerical and analytical methods. Microfluid. Nanofluid. 2009, 6, 621–635. [Google Scholar] [CrossRef]
- Sontti, S.G.; Atta, A. CFD analysis of microfluidic droplet formation in non–Newtonian liquid. Chem. Eng. J. 2017, 330, 245–261. [Google Scholar] [CrossRef]
- Sontti, S.G.; Atta, A. Numerical insights on controlled droplet formation in a microfluidic flow-focusing device. Ind. Eng. Chem. Res. 2019, 59, 3702–3716. [Google Scholar] [CrossRef]
- Rostami, B.; Morini, G.L. Generation of Newtonian droplets in Newtonian and non-Newtonian carrier flows in micro T-junctions under opposed-flow configuration. J. Non-Newton. Fluid Mech. 2020, 281, 104297. [Google Scholar] [CrossRef]
- Hussein, M.H. Extraction of Agar from Gelidium P (Rhodophyta) and Green Synthesis of Agar/Silver Nanoparticles. J. Agric. Chem. Biotechnol. 2015, 6, 419–434. [Google Scholar] [CrossRef]
- Arratia, P.E.; Cramer, L.; Gollub, J.P.; Durian, D.J. The effects of polymer molecular weight on filament thinning and drop breakup in microchannels. New J. Phys. 2009, 11, 115006. [Google Scholar] [CrossRef]
- Rostami, B.; Morini, G. Micro droplets of non-Newtonian solutions in silicone oil flow through a hydrophobic micro cross-junction. J. Phys. Conf. Ser. 2017, 923, 012021. [Google Scholar] [CrossRef]
- Wong, V.L.; Loizou, K.; Lau, P.L.; Graham, R.S.; Hewakandamby, B.N. Numerical studies of shear-thinning droplet formation in a microfluidic T-junction using two-phase level-SET method. Chem. Eng. Sci. 2017, 174, 157–173. [Google Scholar] [CrossRef]
- Wong, V.L.; Loizou, K.; Lau, P.L.; Graham, R.S.; Hewakandamby, B.N. Characterizing droplet breakup rates of shear-thinning dispersed phase in microreactors. Chem. Eng. Res. Des. 2019, 144, 370–385. [Google Scholar] [CrossRef]
- Wang, M.; Kong, C.; Liang, Q.; Zhao, J.; Wen, M.; Xu, Z.; Ruan, X. Numerical simulations of wall contact angle effects on droplet size during step emulsification. RSC Adv. 2018, 8, 33042–33047. [Google Scholar] [CrossRef]
- Wu, L.; Liu, X.; Zhao, Y.; Chen, Y. Role of local geometry on droplet formation in axisymmetric microfluidics. Chem. Eng. Sci. 2017, 163, 56–67. [Google Scholar] [CrossRef]
- Kobayashi, I.; Mukataka, S.; Nakajima, M. CFD simulation and analysis of emulsion droplet formation from straight-through microchannels. Langmuir 2004, 20, 9868–9877. [Google Scholar] [CrossRef]
- Hoang, D.A.; van Steijn, V.; Portela, L.M.; Kreutzer, M.T.; Kleijn, C.R. Benchmark numerical simulations of segmented two-phase flows in microchannels using the Volume of Fluid method. Comput. Fluids 2013, 86, 28–36. [Google Scholar] [CrossRef]
- Biroun, M.; Rahmati, M.; Jangi, M.; Tao, R.; Chen, B.; Fu, Y. Computational and experimental analysis of droplet transportation/jetting behaviours driven by thin film surface acoustic waves. Sens. Actuators A Phys. 2019, 299, 111624. [Google Scholar] [CrossRef]
- Mora, A.E.M.; de Lima e Silva, A.L.F.; de Lima e Silva, S.M.M. Numerical study of the dynamics of a droplet in a T-junction microchannel using OpenFOAM. Chem. Eng. Sci. 2019, 196, 514–526. [Google Scholar] [CrossRef]
- Hoang, D.; Portela, L.; Kleijn, C.; Kreutzer, M.; Van Steijn, V. Dynamics of droplet breakup in a T-junction. J. Fluid Mech. 2013, 717. [Google Scholar] [CrossRef]
- Liu, H.; Zhang, Y. Droplet formation in a T-shaped microfluidic junction. J. Appl. Phys. 2009, 106, 034906. [Google Scholar] [CrossRef]
- Song, K.W.; Kim, Y.S.; Chang, G.S. Rheology of concentrated xanthan gum solutions: Steady shear flow behavior. Fibers Polym. 2006, 7, 129–138. [Google Scholar] [CrossRef]
- Wyatt, N.B.; Liberatore, M.W. Rheology and viscosity scaling of the polyelectrolyte xanthan gum. J. Appl. Polym. Sci. 2009, 114, 4076–4084. [Google Scholar] [CrossRef]
- Picchi, D.; Ullmann, A.; Brauner, N. Modeling of core-annular and plug flows of Newtonian/non-Newtonian shear-thinning fluids in pipes and capillary tubes. Int. J. Multiph. Flow 2018, 103, 43–60. [Google Scholar] [CrossRef]
- Picchi, D.; Ullmann, A.; Brauner, N.; Poesio, P. Motion of a confined bubble in a shear-thinning liquid. J. Fluid Mech. 2021, 918, A7. [Google Scholar] [CrossRef]
- Taassob, A.; Manshadi, M.K.D.; Bordbar, A.; Kamali, R. Monodisperse non-Newtonian micro-droplet generation in a co-flow device. J. Braz. Soc. Mech. Sci. Eng. 2017, 39, 2013–2021. [Google Scholar] [CrossRef]
- Wu, L.; Tsutahara, M.; Kim, L.S.; Ha, M. Three-dimensional lattice Boltzmann simulations of droplet formation in a cross-junction microchannel. Int. J. Multiph. Flow 2008, 34, 852–864. [Google Scholar] [CrossRef]
- Li, X.; He, L.; He, Y.; Gu, H.; Liu, M. Numerical study of droplet formation in the ordinary and modified T-junctions. Phys. Fluids 2019, 31, 082101. [Google Scholar] [CrossRef]


| Fluid | [Pa·s] | [kg/m3] | n | K [Pa·sn] | ref. |
|---|---|---|---|---|---|
| Water | 0.00089 | 997 | — | — | — |
| Oil | 0.0223 | 930 | — | — | — |
| 800 ppm xanthan/water | — | 997 | 0.491 | 0.0755 | [40] |
| 1500 ppm xanthan/water | — | 997 | 0.389 | 0.3125 | [40] |
| 2500 ppm xanthan/water | — | 997 | 0.302 | 0.985 | [40] |
| 5000 ppm xanthan/water | — | 997 | 0.16 | 10.538 | [25] |
Publisher’s Note: MDPI stays neutral with regard to jurisdictional claims in published maps and institutional affiliations. |
© 2021 by the authors. Licensee MDPI, Basel, Switzerland. This article is an open access article distributed under the terms and conditions of the Creative Commons Attribution (CC BY) license (https://creativecommons.org/licenses/by/4.0/).
Share and Cite
Fatehifar, M.; Revell, A.; Jabbari, M. Non-Newtonian Droplet Generation in a Cross-Junction Microfluidic Channel. Polymers 2021, 13, 1915. https://doi.org/10.3390/polym13121915
Fatehifar M, Revell A, Jabbari M. Non-Newtonian Droplet Generation in a Cross-Junction Microfluidic Channel. Polymers. 2021; 13(12):1915. https://doi.org/10.3390/polym13121915
Chicago/Turabian StyleFatehifar, Maryam, Alistair Revell, and Masoud Jabbari. 2021. "Non-Newtonian Droplet Generation in a Cross-Junction Microfluidic Channel" Polymers 13, no. 12: 1915. https://doi.org/10.3390/polym13121915
APA StyleFatehifar, M., Revell, A., & Jabbari, M. (2021). Non-Newtonian Droplet Generation in a Cross-Junction Microfluidic Channel. Polymers, 13(12), 1915. https://doi.org/10.3390/polym13121915