
Probabilistic Assessment of Fracture Toughness of Epoxy Resin EPOLAM 2025 Including the Notch Radii Effect

 ,
,  ,
,  ,
,
Abstract

1. Introduction
2. Materials and Methods
2.1. Material
2.2. Experimental Method to Measure Fracture Toughness
3. The Methodology to Perform the Fracture Assessment of EPOLAM 2025
3.1. Determination of the Apparent Fracture Toughness
3.2. Conversion to the Equivalent Apparent Fracture Toughness
3.3. Derivation of the Cumulative Distribution of Failure
3.4. Derivation of the Probabilistic vs. Field
4. Results
4.1. Fracture Results
4.2. Fracture Assessment
- −
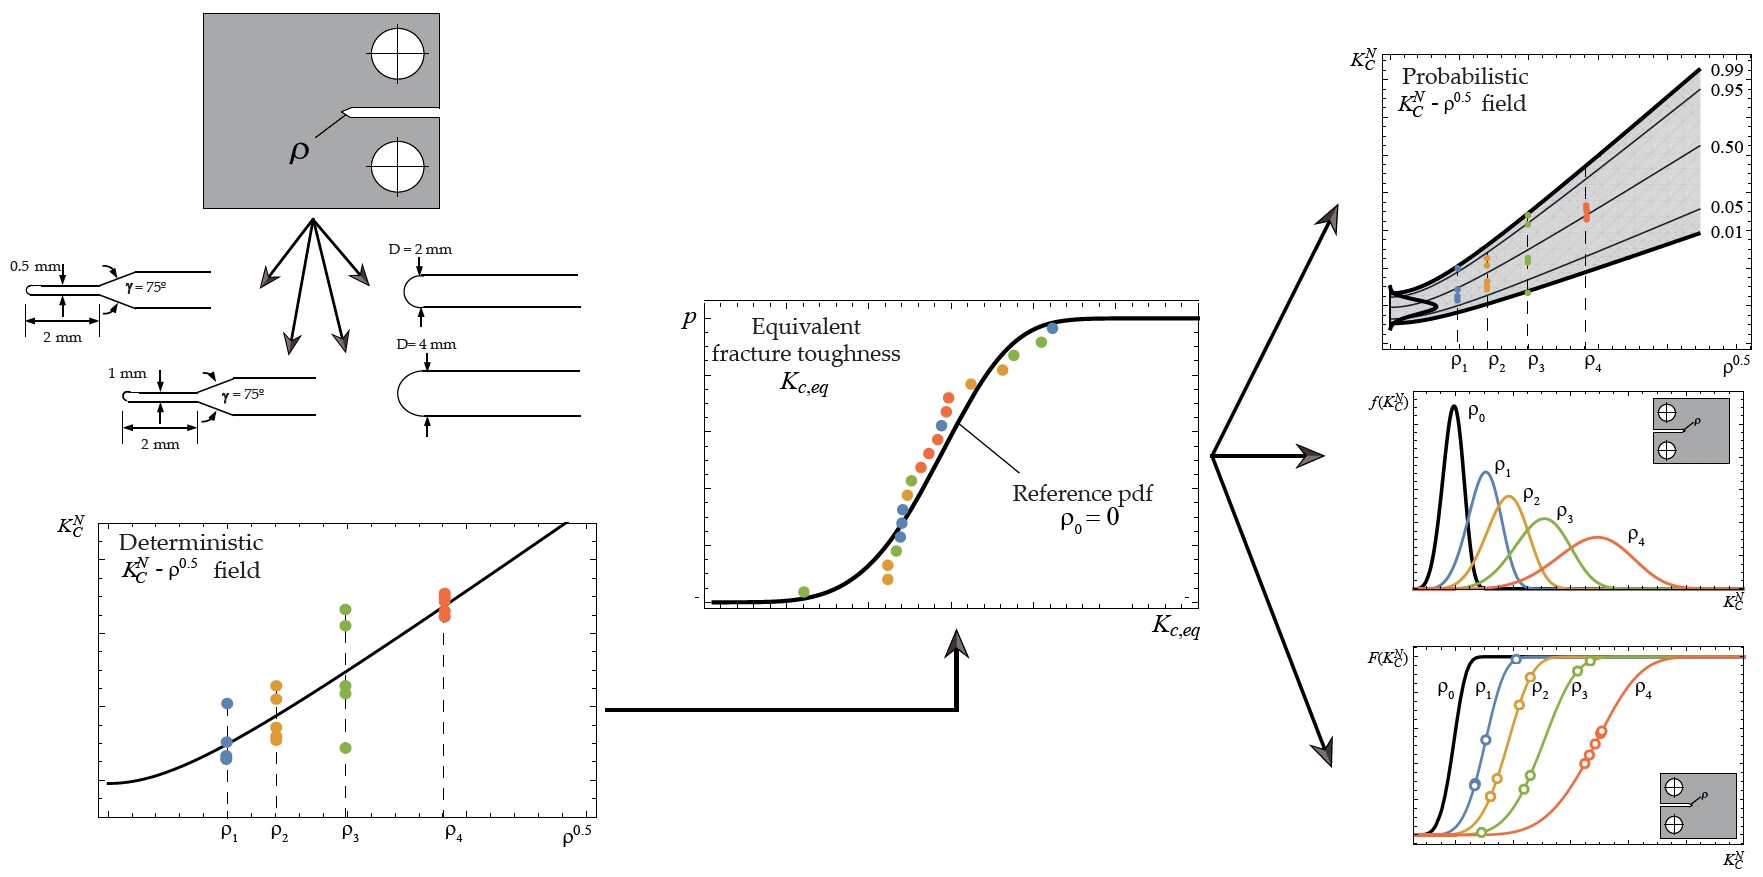
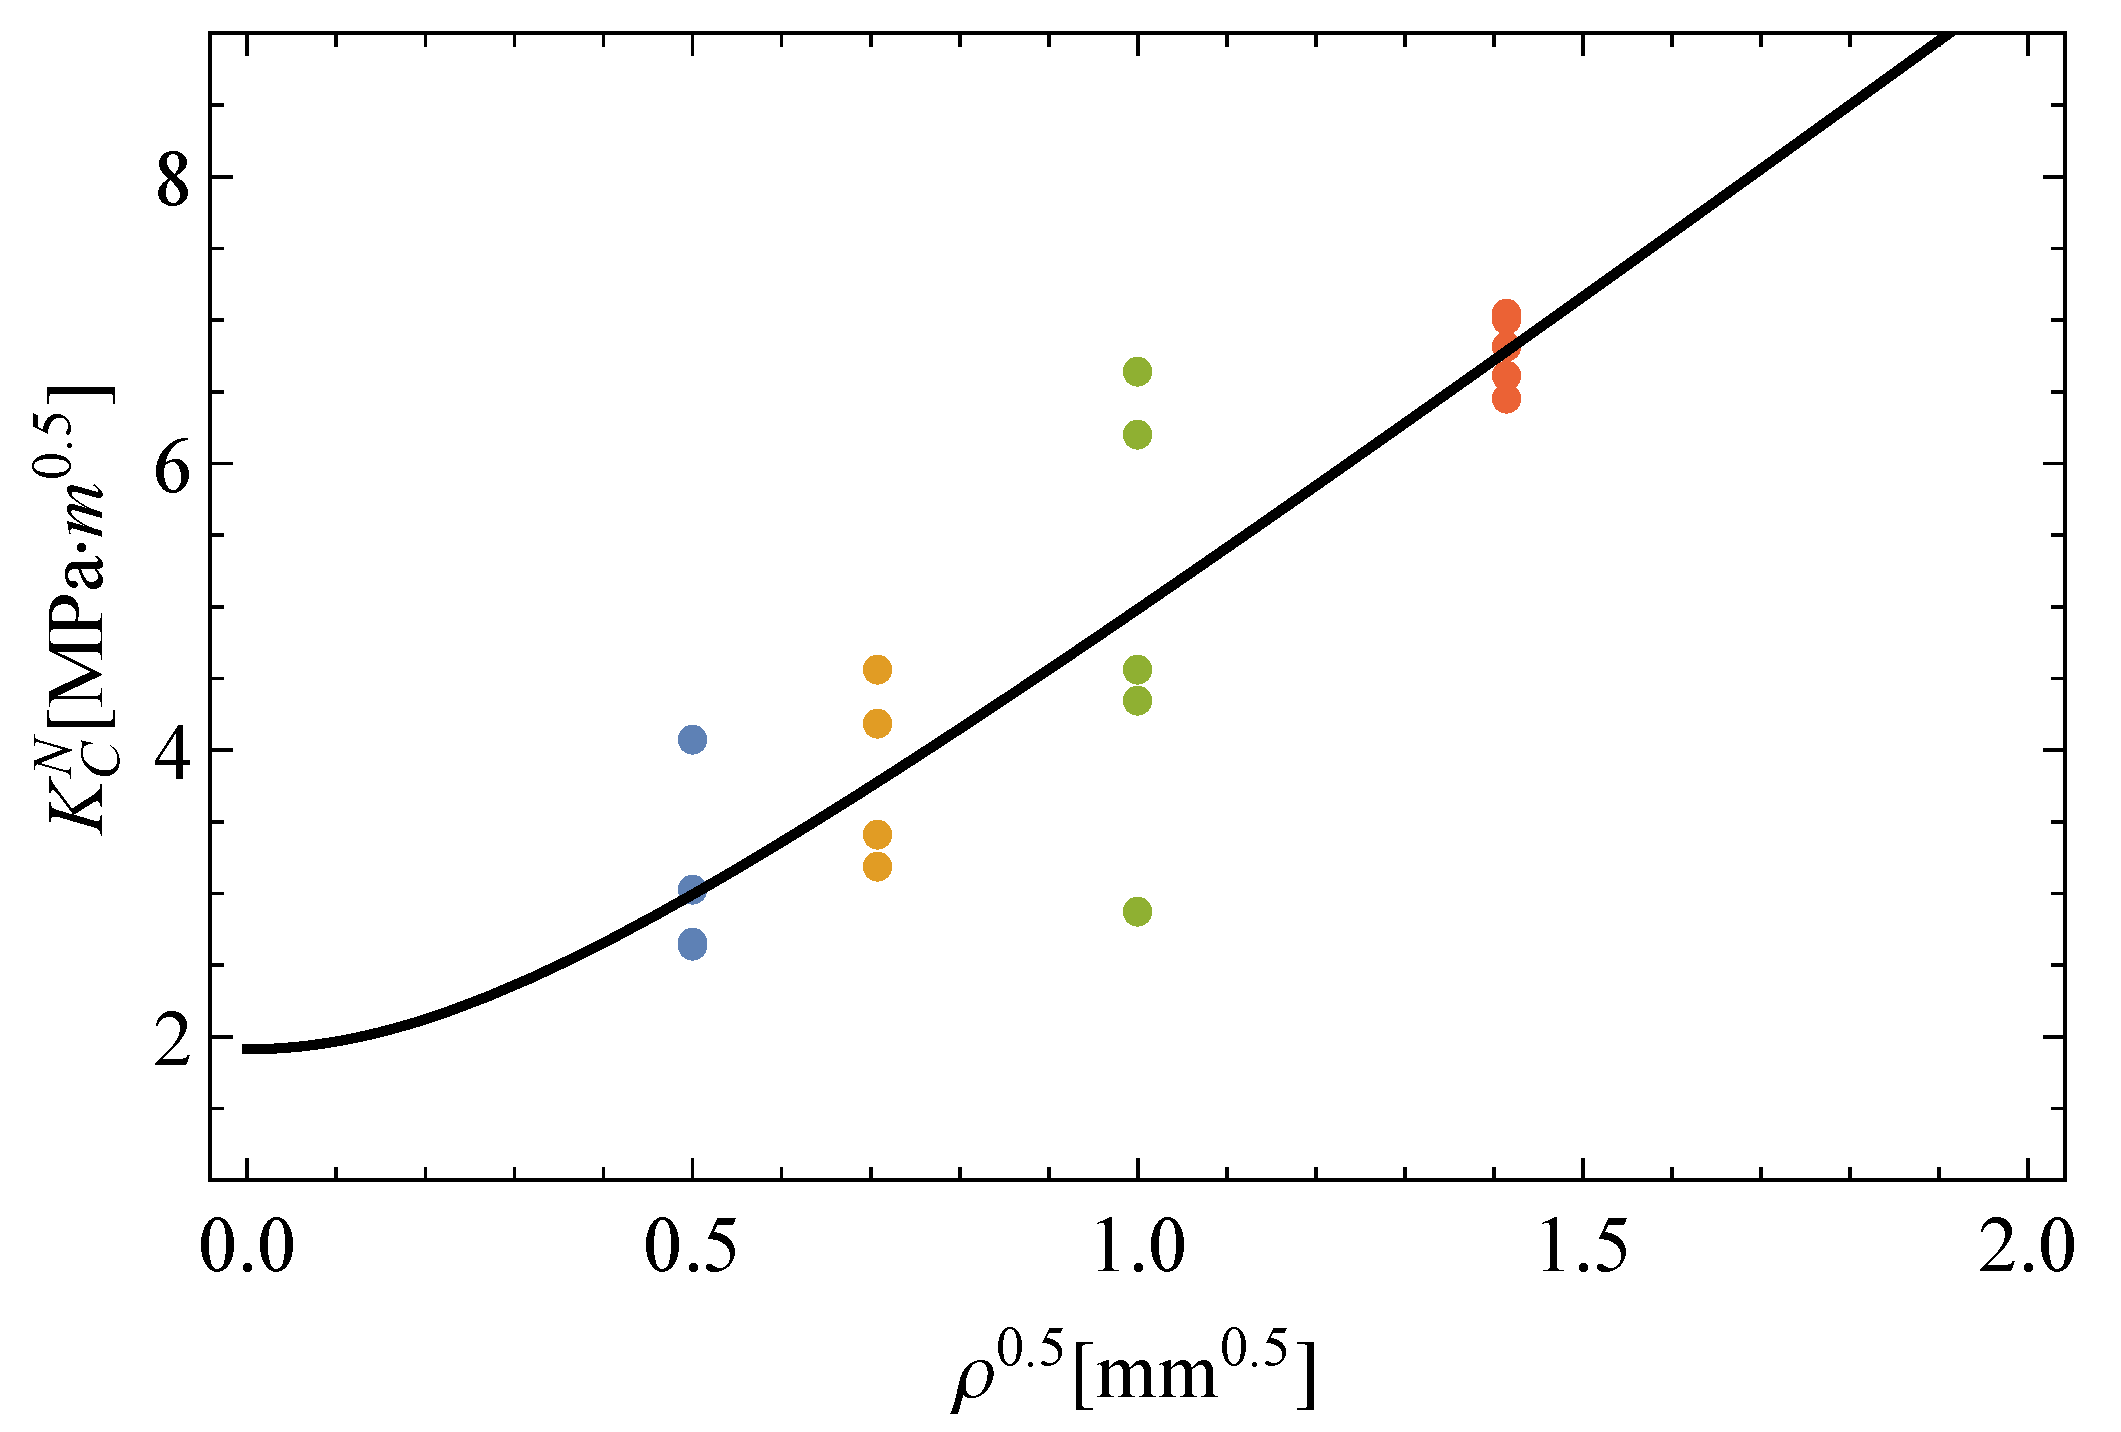
- Step 1: Estimation of the TCD method. Herewith, the critical distance L is calculated according to the TCD method and the fracture toughness of the material by fitting Equation (7) to the experimental apparent fracture toughness based on the Least Squares (LS) method. The following estimates are given:Figure 6 illustrates the predicted curve resulting from the TCD method to describe the notch effect in EPOLAM 2025 along with the experimental values. In this way, a reasonable estimation of the apparent fracture toughness is confirmed with the use of the TCD method [30,31]. Two zones are characterized: that for lower values in which the notch radius effect is nearly negligible, and another one in which this effect becomes significant from a certain point. Though the inherent variability of the fracture is noticeable, its prediction is not possible using this deterministic approach.
- −
- Step 2: Conversion to the equivalent fracture toughness. Based on the TCD method, the original i-th value of the apparent fracture toughness for the j-th notch radius can be transformed to the equivalent fracture toughness for , according to Equation (8), as follows:
- −
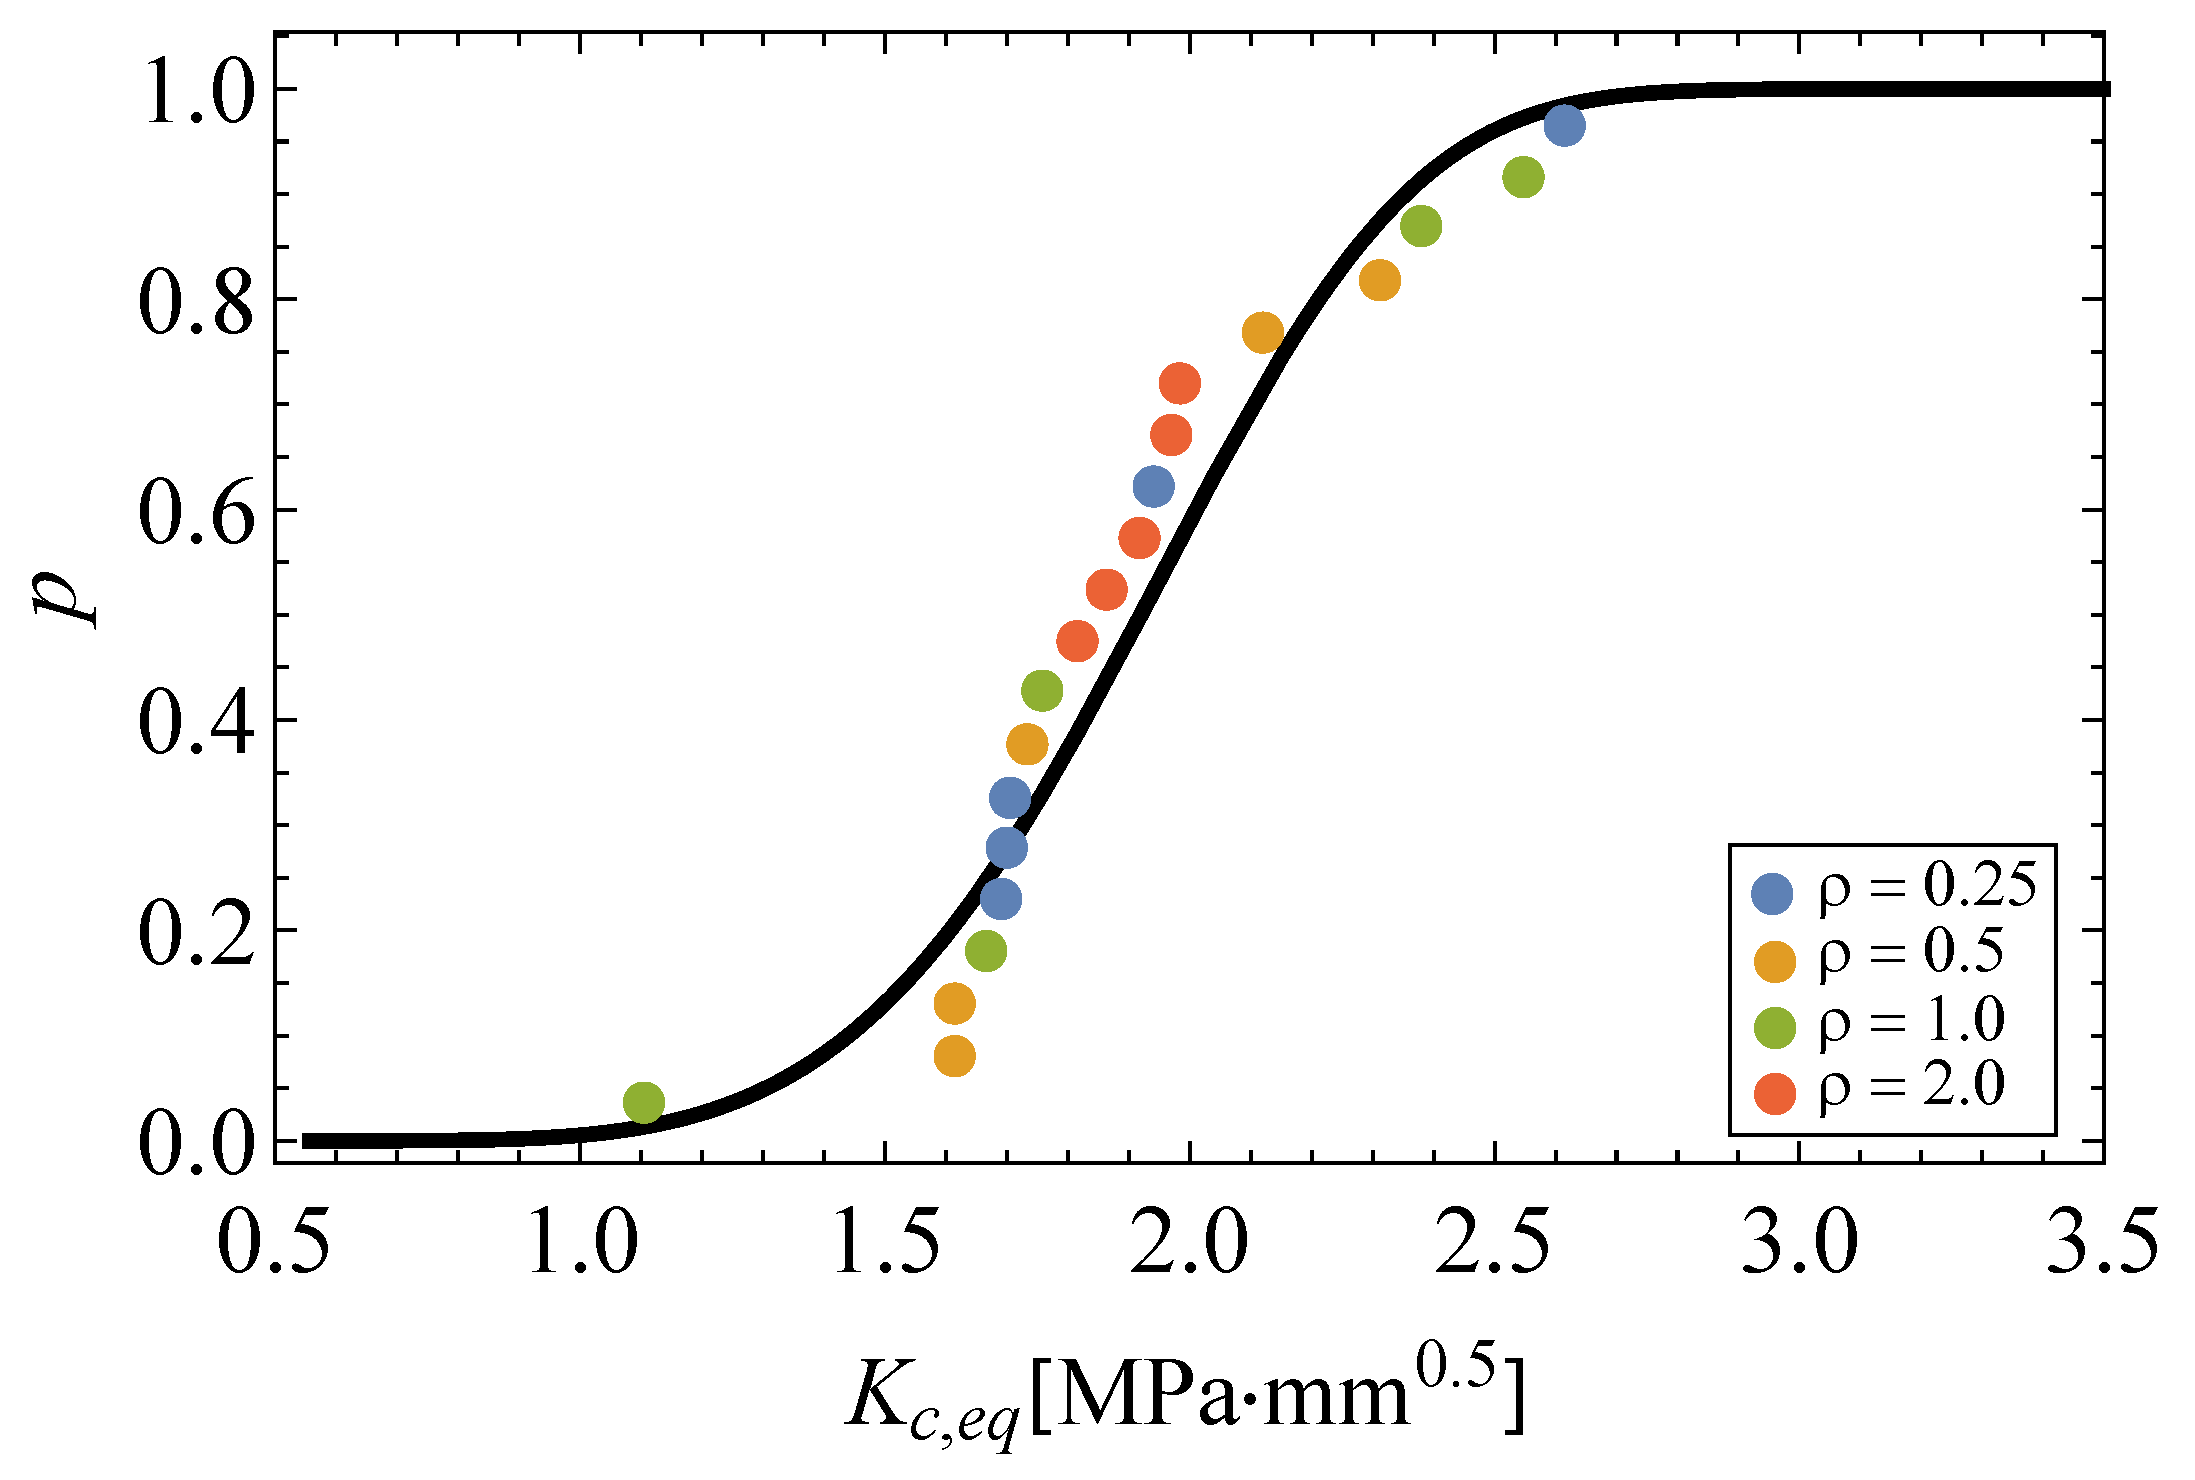
- Step 3: Derivation of the cumulative distribution of failure. Once the equivalent fracture toughness values have been obtained from experimental results, they can be considered as random samples following a Weibull distribution according to Equation (10). Thus, by ordering this set and applying a plotting position scheme, the experimental cumulative distribution function of the equivalent fracture toughness is obtained and consequently fitted, providing the following estimates for the Weibull parameters:Figure 7 depicts the resulting equivalent fracture toughness values and the estimated Weibull cdf. It is worth mentioning that all fracture results from the experimental campaign, coming from different notch radii conditions, can now be pooled into a single cdf and jointly evaluated as such.
- −
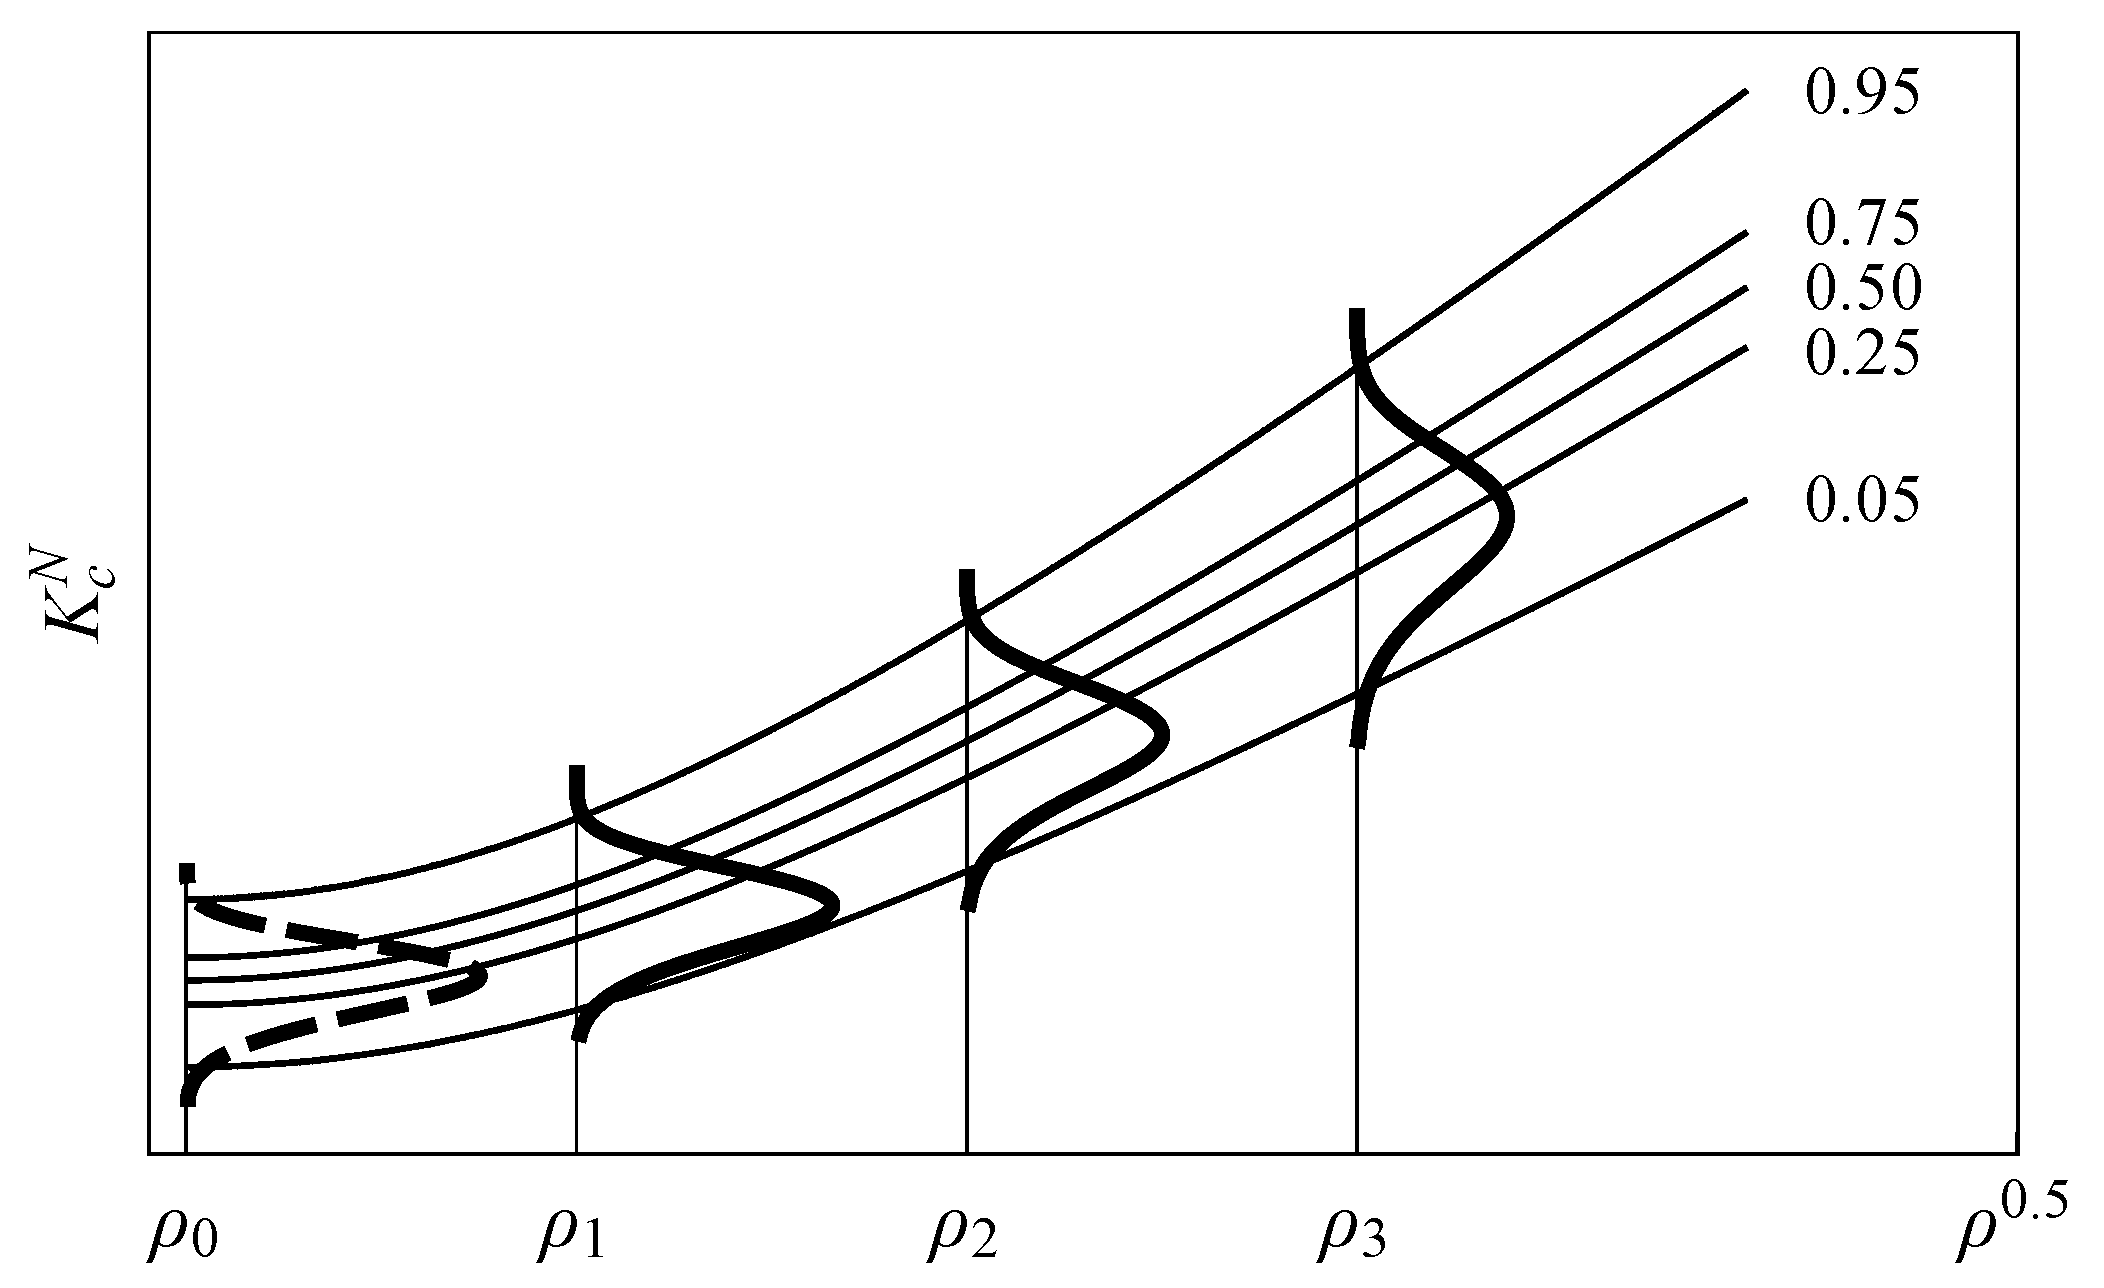
- Step 4: Derivation of the probabilisticfield. Finally, the probabilistic definition of the equivalent fracture toughness can now be extended to any other notch radii condition based on the TCD method by substituting the equivalent fracture toughness from Equation (14) in Equation (13), resulting in the percentile curves in the field:as a function of the notch radius for a given of interest.Figure 8 shows the predictions of the proposed methodology with the experimental campaign of EPOLAM 2025 for different notch radii, besides the corresponding pdf of the equivalent fracture toughness from Figure 7, where all experimental values can be pooled together. As can be seen, the experimental fracture results can be satisfactorily predicted including the non-negligible scatter, being randomly distributed around the percentiles for each given notch radius. Note also that the median percentile () is coincident with the corresponding curve from the TCD method, but the proposed methodology allows any other percentile curve of interest to be derived, thus enhancing the deterministic approaches by predicting the inherent variability in fracture epoxi resin results for any notch radii condition.
4.3. Numerical Simulations
5. Discussion
6. Conclusions
Author Contributions
Funding
Institutional Review Board Statement
Informed Consent Statement
Acknowledgments
Conflicts of Interest
References
- May, C.A. Epoxy Resins: Chemistry and Technology; Marcel Dekker: New York, NY, USA, 1988. [Google Scholar]
- Bagheri, R.; Marouf, B.T.; Pearson, R.A. Rubber-toughened epoxies: A critical review. J. Macromol. Sci. C 2009, 49, 201–225. [Google Scholar] [CrossRef]
- Pascault, J.P.; Williams, R.J.J. General concepts about epoxy polymers. In Epoxy Polymers; John Wiley & Sons: Hoboken, NJ, USA, 2010; pp. 1–12. [Google Scholar]
- Kwei, T.K. Epoxy Resin Chemistry; ACS Symposium Series 114; American Chemical Society: Washington, DC, USA, 1979; Volume 18, p. 395. [Google Scholar]
- Lemay, J.D.; Kelly, F.N. Structure and ultimate properties of epoxy resins. In Epoxy Resins and Composites III. Advances in Polymer Science; Dušek, K., Ed.; Springer: Berlin/Heidelberg, Germany, 1986; Volume 78. [Google Scholar]
- Kinloch, A. Toughening epoxy adhesives to meet today’s challenges. MRS Bull. 2003, 28, 445–448. [Google Scholar] [CrossRef]
- Quan, D.; Ivankovic, A. Effect of core-shell rubber (CSR) nano-particle on mechanical properties and farcture toughness of an epoxy polymer. Polymer 2015, 66, 16–28. [Google Scholar] [CrossRef]
- Zotti, A.; Borriello, A.; Zuppolini, S.; Pomogalio, A.D.; Lesnichara, V.A.; Zarelli, M. Fabrication and characterization of metal-core carbon-shell nanoparticles filling an aeronautical composite matrix. Eur. Polym. J. 2015, 71, 140–151. [Google Scholar] [CrossRef]
- Wang, F.; Drzal, L.T.; Qin, Y.; Huang, Z. Enhancement of fracture toughness, mechanical and thermal properties of rubber/epoxy composites by incorporation of graphene nanoplatelets. Compos. Part A 2016, 87, 10–12. [Google Scholar] [CrossRef]
- Irez, A.B.; Bayraktar, E.; Miskioglu, I. Fracture toughness analysis of epoxy-recycled rubber-based composite reinforced with graphene nanoplatelets for strucutral applications in automotive and aeronautics. Polymers 2020, 12, 448. [Google Scholar] [CrossRef] [PubMed]
- Muñiz-Calvente, M.; Blasón, S.; Correia, J.; Cicero, S.; de Jesus, A.M.P.; Fernández-Canteli, A. A Probabilistic Approach to Derive the Apparent Fracture Toughness of Notched Components Based on the TCD; International Symposium on Notch Fracture; Santander: Cantabria, Spain, 2017; pp. 252–257. [Google Scholar]
- Álvarez-Vázquez, A.; Muñiz-Calvente, M.; Cicero, S.; Blasón, S.; Correia, J.; de Jesus, A.M.P.; Fernández-Canteli, A. Derivation of cdf of failure from specimens with different notch radii and temperatures. In Proceedings of the XVIII International Conference on New Trends in Fatigue and Fracture, Lisbon, Portugal, 17–20 July 2018; pp. 267–270. [Google Scholar]
- Muñiz-Calvente, M.; Álvarez-Vázquez, A.; Cicero, S.; Correia, J.; de Jesus, A.M.P.; Blasón, S.; Fernández-Canteli, A.; Berto, F. Study of the influence of notch radii and temperature on the probability of failure: A methodology to perform a combined assessment. Fract. Eng. Mater. Struct. 2019, 42, 2663–2673. [Google Scholar] [CrossRef]
- Madrazo, V.; Cicero, S.; García, T. Assessment of notched structural steel components using failure assessment diagrams and the theory of critical distances. Eng. Fail Anal. 2014, 36, 104–120. [Google Scholar] [CrossRef]
- Pluvinage, G. Fatigue and fracture emanating from notch: The use of the notch stress intensity factor. Nucl. Eng. Des. 1998, 185, 173–184. [Google Scholar] [CrossRef]
- Bao, Y.; Jin, Z. Size effects and a mean-strength criterion for ceramics. Fatigue Fract. Eng. Mater. Struct. 1993, 16, 829–835. [Google Scholar] [CrossRef]
- Cicero, S.; Gutiérrez-Solana, F.; Álvarez, J. Structural integrity assessment of components subjected to low constraint conditions. Eng. Fract. Mech. 2008, 75, 3038–3059. [Google Scholar] [CrossRef]
- Cicero, S.; Madrazo, V.; Carrascal, I.; Cicero, R. Assessment of notched structural components using failure assessment diagrams and the theory of critical distances. Eng. Fract. Mech. 2011, 78, 2809–2825. [Google Scholar] [CrossRef]
- Radaj, D. State-of-the-art review on extended stress intensity factor concepts. Fatigue Fract. Eng. Mater. Struct. 2014, 37, 1–28. [Google Scholar] [CrossRef]
- Axson North America I. Materials Safety Data Sheet for Epolam 2025 Resin. 2016. Available online: https://mbfgfiles.co.uk/datasheets/epo2017_resin_sds.pdf (accessed on 1 June 2021).
- ASTM D5045-99. Standard Test Methods for Plane-Strain Fracture Toughness and Strain Energy Release Rate of Plastic Materials; ASTM International: West Conshohocken, PA, USA, 2014. [Google Scholar]
- Muñiz-Calvente, M.; Venta-Viñuela, L.; Álvarez-Vázquez, A.; Fernández-Fernández, P.; Lamela-Rey, M.J.; Fernández-Canteli, A. A probabilistic approach to assessing and predicting the failure of notched components. Materials 2019, 12, 4053. [Google Scholar] [CrossRef] [PubMed]
- Muñiz-Calvente, M. The Generalized Local Approach. A Methodology for Probabilistic Assessment of Fracture under Different Failure Criteria. Ph.D. Thesis, University of Oviedo, Oviedo, Spain, 2017. [Google Scholar]
- Álvarez-Vázquez, A. Phenomenological Approach to Fitting and Interconversion of Viscoelastic and Lifetime Processes Using Statistical Functions. Ph.D. Thesis, University of Oviedo, Oviedo, Spain, 2020. [Google Scholar]
- Taylor, D. The Theory of Critical Distances. A New Perspective in Fracture Mechanics; Elsevier: London, UK, 2007. [Google Scholar]
- Creager, M.; Paris, P.C. Elastic field equations for blunt cracks with reference to stress corrosion cracking. Int. J. Fract. 1967, 44, 247–252. [Google Scholar] [CrossRef]
- Bernard, A.; Bos-Levenbach, E.C. The Plotting Observations on Probability-Paper; Statistische Afdeling; Stichting Mathematisch Centrum.: Amsterdam, The Netherlands, 1955. [Google Scholar]
- Castillo, E. Extreme Value Theory in Engineering; Academic Press: San Diego, CA, USA, 1988. [Google Scholar]
- Castillo, E.; Hadi, A.S.; Balakrishnan, N.; Sarabia, J.M. Extreme Value and Related Models with Applications in Engineering and Science; John Wiley & Sons: Hoboken, NJ, USA, 2005. [Google Scholar]
- Cicero, S.; Madrazo, V.; Carrascal, I.A. Analysis of notch effect in PMMA using the Theory of Critical Distances. Eng. Fract. Mech. 2012, 86, 56–72. [Google Scholar] [CrossRef]
- Taylor, D.; Cornetti, P.; Pugno, N. The fracture mechanics of finite crack extension. Eng. Fract. Mech. 2005, 72, 1021–1038. [Google Scholar] [CrossRef]
- Muñiz-Calvente, M.; Shlyannikov, V.N.; Meshii, T.; Giner, E.; Fernández-Canteli, A. Joint evaluation of fracture results from distinct test conditions, implying loading, specimen size and geometry. Procedia Struct. Integr. 2016, 2, 720–727. [Google Scholar] [CrossRef]


| E [GPa] | |
|---|---|
| 3.2 | 0.36 |
| Set | Specimen | W | B | Max. Load | |||
|---|---|---|---|---|---|---|---|
| [mm] | [mm] | [mm] | [N] | [MPa mm] | [MPa mm] | ||
| 0.25 | 0.25-1 | 40 | 10 | 0.25 | 956.33 | 2.68 | 3.03 (0.62) |
| 0.25-2 | 950.22 | 2.67 | |||||
| 0.25-3 | 1462.07 | 4.10 | |||||
| 0.25-4 | 1088.78 | 3.05 | |||||
| 0.25-5 | 947.38 | 2.66 | |||||
| 0.5 | 0.5-1 | 40 | 10 | 0.5 | 1500.02 | 4.21 | 3.73 (0.64) |
| 0.5-2 | 1226.58 | 3.44 | |||||
| 0.5-3 | 1634.67 | 4.59 | |||||
| 0.5-4 | 1144.39 | 3.21 | |||||
| 0.5-5 | 1145.23 | 3.21 | |||||
| 1.0 | 1.0-1 | 40 | 10 | 1.0 | 1554.92 | 4.37 | 4.95 (1.55) |
| 1.0-2 | 2376.10 | 6.67 | |||||
| 1.0-3 | 1635.97 | 4.59 | |||||
| 1.0-4 | 1033.53 | 2.90 | |||||
| 1.0-5 | 2220.01 | 6.23 | |||||
| 2.0 | 2.0-1 | 40 | 10 | 2.0 | 2504.68 | 7.03 | 6.81 (0.25) |
| 2.0-2 | 2364.46 | 6.64 | |||||
| 2.0-3 | 2434.76 | 6.84 | |||||
| 2.0-4 | 2307.10 | 6.48 | |||||
| 2.0-5 | 2517.61 | 7.07 |
Publisher’s Note: MDPI stays neutral with regard to jurisdictional claims in published maps and institutional affiliations. |
© 2021 by the authors. Licensee MDPI, Basel, Switzerland. This article is an open access article distributed under the terms and conditions of the Creative Commons Attribution (CC BY) license (https://creativecommons.org/licenses/by/4.0/).
Share and Cite
Álvarez-Vázquez, A.; Muñiz-Calvente, M.; Fernández, P.F.; Fernández-Canteli, A.; Lamela-Rey, M.J.; Pintado, J.M. Probabilistic Assessment of Fracture Toughness of Epoxy Resin EPOLAM 2025 Including the Notch Radii Effect. Polymers 2021, 13, 1857. https://doi.org/10.3390/polym13111857
Álvarez-Vázquez A, Muñiz-Calvente M, Fernández PF, Fernández-Canteli A, Lamela-Rey MJ, Pintado JM. Probabilistic Assessment of Fracture Toughness of Epoxy Resin EPOLAM 2025 Including the Notch Radii Effect. Polymers. 2021; 13(11):1857. https://doi.org/10.3390/polym13111857
Chicago/Turabian StyleÁlvarez-Vázquez, Adrián, Miguel Muñiz-Calvente, Pelayo Fernández Fernández, Alfonso Fernández-Canteli, María Jesús Lamela-Rey, and José María Pintado. 2021. "Probabilistic Assessment of Fracture Toughness of Epoxy Resin EPOLAM 2025 Including the Notch Radii Effect" Polymers 13, no. 11: 1857. https://doi.org/10.3390/polym13111857
APA StyleÁlvarez-Vázquez, A., Muñiz-Calvente, M., Fernández, P. F., Fernández-Canteli, A., Lamela-Rey, M. J., & Pintado, J. M. (2021). Probabilistic Assessment of Fracture Toughness of Epoxy Resin EPOLAM 2025 Including the Notch Radii Effect. Polymers, 13(11), 1857. https://doi.org/10.3390/polym13111857