The Influence of Filler Particles on the Mechanical Properties of Maxillofacial Prosthetic Silicone Elastomers: A Systematic Review and Meta-Analysis

 ,
,  ,
,  ,
,  ,
,  ,
, 

Abstract
1. Introduction
2. Materials and Methods
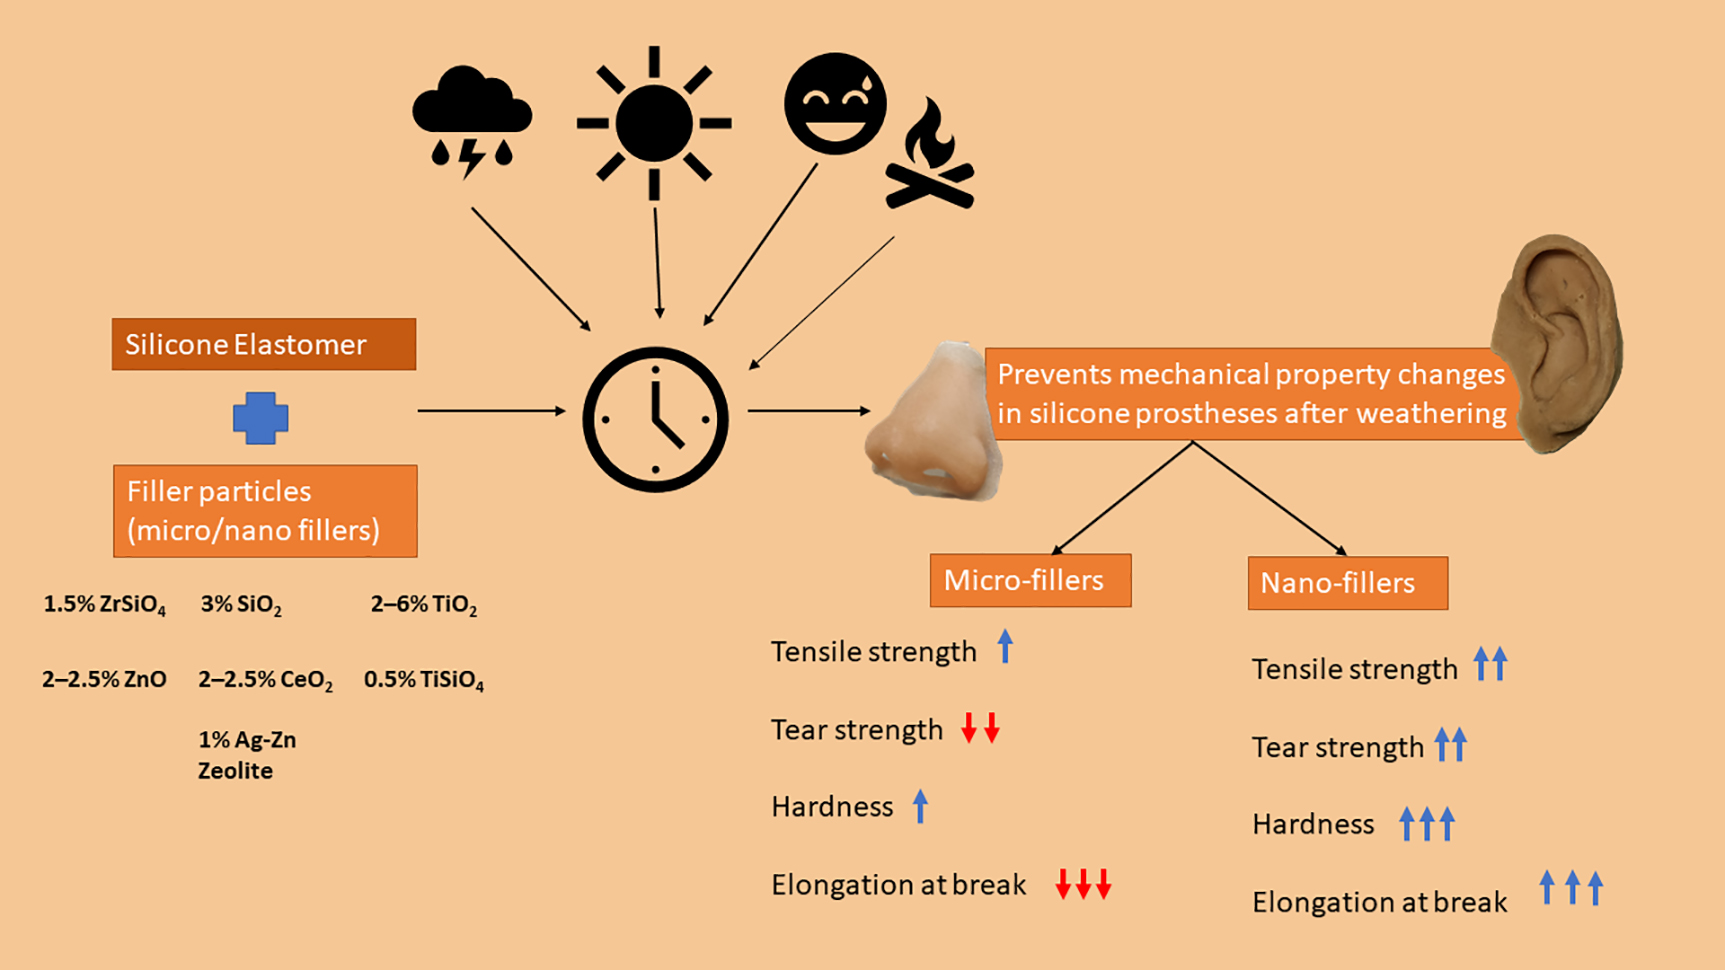
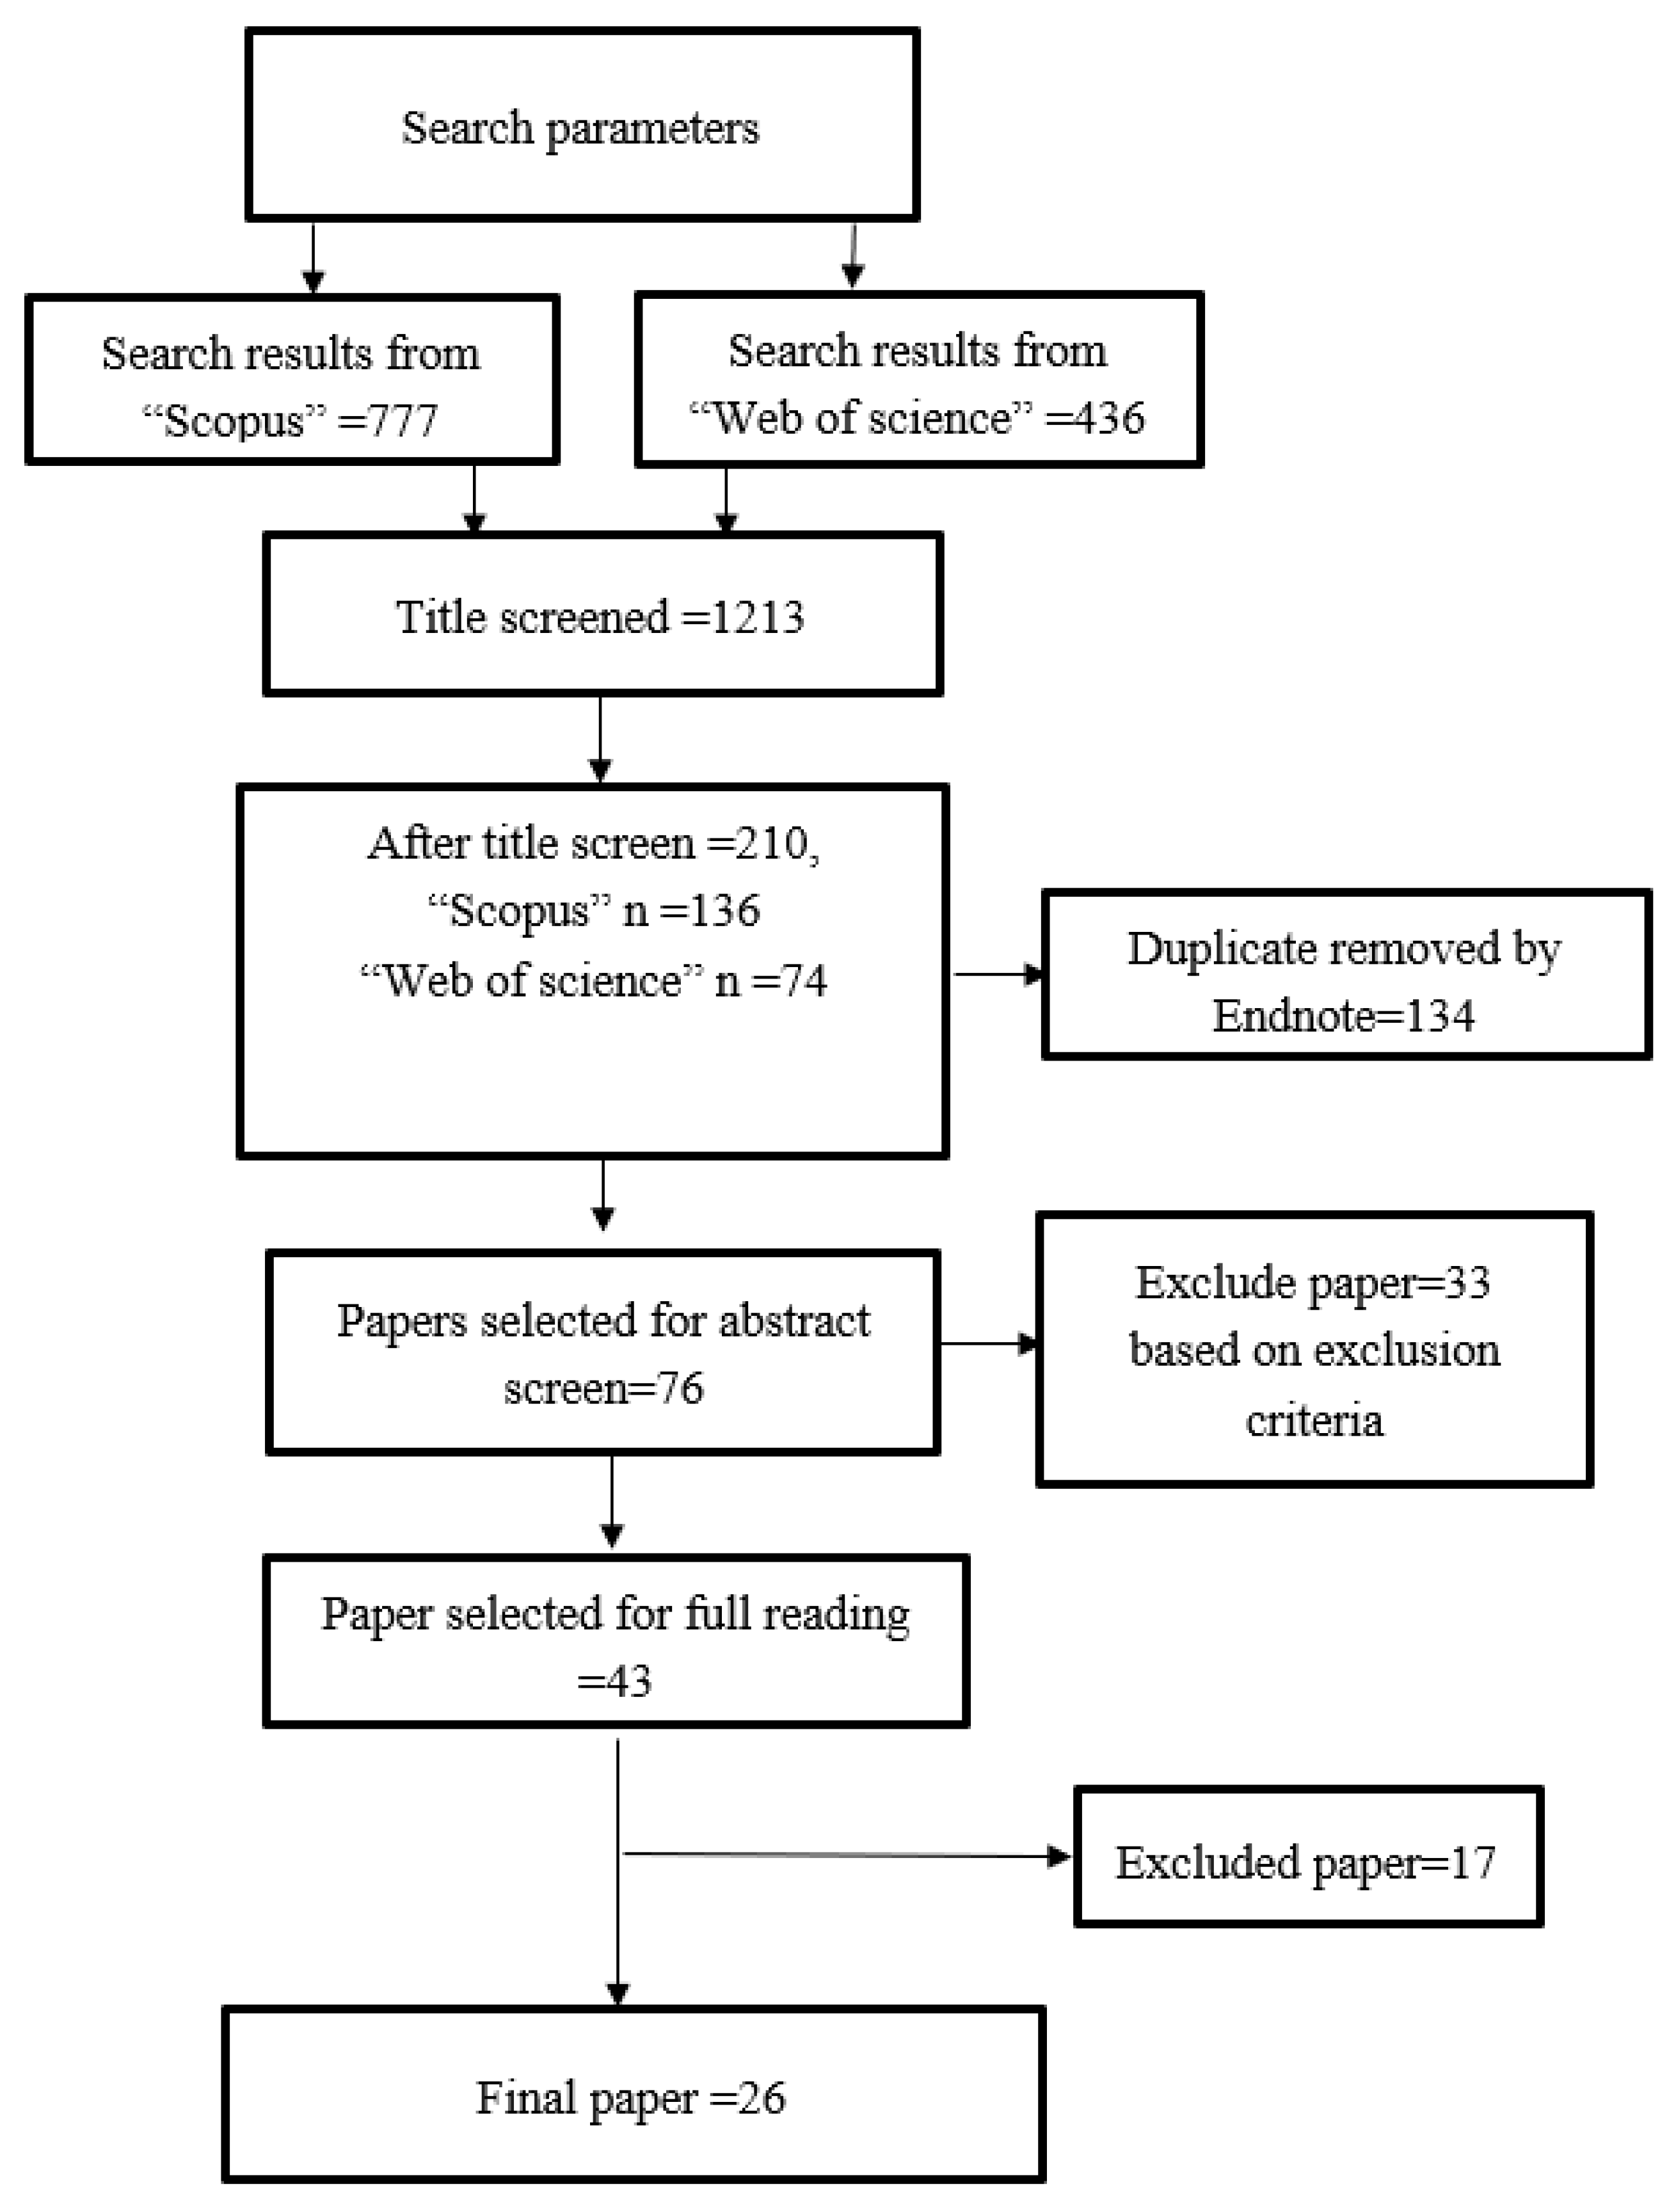
2.1. Literature Search Strategy
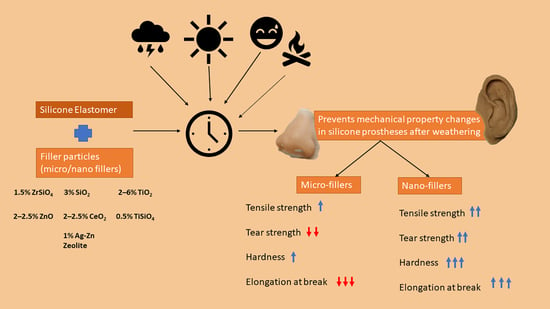
- A systematic review of all studies that reported on the mechanical properties of filler particles and MFPSEs. (tensile strength, tear strength, hardness, elongation at break).
- A meta-analysis of studies that compared the mechanical properties between MFPSE incorporating filler particles and MFPSE without filler particles. These studies were extracted from the systematic review according to scoring criteria.
2.1.1. Search of Study Design
2.1.2. Inclusion and Exclusion
- Comparative studies on MFPSE that included filler particles;
- Studies where MFPSE was not subjected to chemical stimulus influence (for example, detergent and alkaline solution) prior to mechanical property testing;
- Articles describing changes in tensile strength, tear strength and/or hardness and elongation at break of MFPSE.
- Articles that compared MFPSE without any filler involvement;
- Studies where MFPSE specimens were incorporated with pigments prior to testing filler properties;
- Articles in other languages without accompanying English translations;
- Review articles and case reports on silicone elastomer not involving maxillofacial region;
- Unpublished literature.
2.2. Data Collection
2.2.1. Search Items (Data to Be Extracted from Articles)
2.2.2. Summary Measures
2.3. Meta-Analysis Scoring Criteria
2.4. Synthesis of Results
3. Results
3.1. Synthesis of Meta-Analysis Results
3.1.1. Tensile Strength
3.1.2. Tear Strength
3.1.3. Hardness
3.1.4. Elongation at Break
4. Discussion
4.1. Nano Particles and Their Effect on Mechanical Properties
4.2. Micro Particles and Their Effect on Mechanical Properties
4.3. Natural Fillers and Their Effect on Mechanical Properties
4.4. Synergistic Effects, Laboratory Conditions and Influence of Weather on Filler Properties
4.5. Limitations
5. Conclusions
Supplementary Materials
Author Contributions
Funding
Conflicts of Interest
Abbreviations and Acronyms
| Ag-Zn | Silver-zinc |
| BaSO4 | Barium sulphate |
| CeO2 | Cerium oxide |
| CI | Confidence interval |
| MFPSE | Maxillofacial prosthetic silicone elastomer |
| MPa | Megapascal |
| N/mm | Newton/millimeter |
| PDMS | Polydimethylsiloxane |
| PICO | Population, Intervention, Control and Outcome |
| PMMA | Polymethyl methacrylate |
| PPP | Pomegranate peels powder |
| PRISMA | Preferred Reporting Items for Systematic Reviews and Meta-Analyses |
| RTV | Room Temperature Vulcanizing |
| SiO2 | Silica/silicone dioxide |
| SPDA | Seeds powder of dates Ajwa |
| TiO2 | Titanium dioxide |
| TiSiO4 | Titanium silicate |
| UHMWPE | Ultra-high molecular weight polyethylene |
| Y2O3 | Yttrium oxide |
| ZnO | Zinc oxide |
| ZrSiO4 | Zirconium silicate |
References
- Kheur, M.G.; Sethi, T.; Coward, T.; Jambhekar, S.S. A comparative evaluation of the change in hardness, of two commonly used maxillofacial prosthetic silicone elastomers, as subjected to simulated weathering in tropical climatic conditions. Eur. J. Prosthodont. Restor. Dent. 2012, 20, 146–150. [Google Scholar] [PubMed]
- Lewis, D.; Castleberry, D. An assessment of recent advances in external maxillofacial materials. J. Prosthet. Dent. 1980, 43, 426–432. [Google Scholar] [CrossRef]
- Rahman, A.M.; Bin Jamayet, N.; Nizami, M.U.I.; Johari, Y.; Husein, A.; Alam, M.K. Effect of Aging and Weathering on the Physical Properties of Maxillofacial Silicone Elastomers: A Systematic Review and Meta-Analysis. J. Prosthodont. 2018, 28, 36–48. [Google Scholar] [CrossRef] [PubMed]
- Aziz, T.; Waters, M.; Jagger, R. Development of a new poly(dimethylsiloxane) maxillofacial prosthetic material. J. Biomed. Mater. Res. 2003, 65, 252–261. [Google Scholar] [CrossRef] [PubMed]
- Guiotti, A.M.; Goiato, M.C.; Dos Santos, D.M. Evaluation of the Shore A Hardness of Silicone for Facial Prosthesis as to the Effect of Storage Period and Chemical Disinfection. J. Craniofacial Surg. 2010, 21, 323–327. [Google Scholar] [CrossRef] [PubMed]
- Kareem, S.; Fatalla, A.; Moudhaffer, M.; Ali, M. Effects of Zirconium Silicate Nano fillers on Some Properties of Room-Vulcanized Maxillofacial Silicone Elastomers. Res. J. Pharm. Biol. Chem. Sci. 2018, 9, 1023–1031. [Google Scholar]
- Han, Y.; Kiat-Amnuay, S.; Powers, J.M.; Zhao, Y. Effect of nano-oxide concentration on the mechanical properties of a maxillofacial silicone elastomer. J. Prosthet. Dent. 2008, 100, 465–473. [Google Scholar] [CrossRef]
- Shakir, D.A.; Abdul-Ameer, D. Effect of nano-titanium oxide addition on some mechanical properties of silicone elastomers for maxillofacial prostheses. J. Taibah Univ. Med. Sci. 2018, 13, 281–290. [Google Scholar] [CrossRef]
- Alsmael, M.A.; Ali, M.M.M. The Effect of Nano Titanium Silicate Addition on Some Properties of Maxillofacial Silicone Material. J. Res. Med. Dent. Sci. 2018, 6, 127–132. [Google Scholar]
- Moher, D.; Liberati, A.; Tetzlaff, J.; Altman, U.G. Preferred Reporting Items for Systematic Reviews and Meta-Analyses: The PRISMA Statement. PLoS Med. 2009, 6, e1000097. [Google Scholar] [CrossRef]
- Stang, A. Critical evaluation of the Newcastle-Ottawa scale for the assessment of the quality of nonrandomized studies in meta-analyses. Eur. J. Epidemiol. 2010, 25, 603–605. [Google Scholar] [CrossRef] [PubMed]
- Scurria, M.S.; Bader, J.D.; A Shugars, D. Meta-analysis of fixed partial denture survival: Prostheses and abutments. J. Prosthet. Dent. 1998, 79, 459–464. [Google Scholar] [CrossRef]
- Kiat-Amnuay, S.; Waters, P.J.; Roberts, D.; Gettleman, L. Adhesive retention of silicone and chlorinated polyethylene for maxillofacial prostheses. J. Prosthet. Dent. 2008, 99, 483–488. [Google Scholar] [CrossRef]
- Gettleman, L.; Vargo, J.M.; Gebert, P.H.; Rawls, H.R. Themoplastic Chlorinated Polyethylene for Maxillofacial Prostheses. In Advances in Biomedical Polymers; Springer Science and Business Media LLC: Berlin/Heidelberg, Germany, 1987; pp. 31–40. [Google Scholar]
- Koyama, S.; Sasaki, K.; Hanawa, S.; Sato, N. The Potential of Cohesive Silicone for Facial Prosthetic Use: A Material Property Study and a Clinical Report. J. Prosthodont. 2011, 20, 299–304. [Google Scholar] [CrossRef]
- Nobrega, A.S.; Andreotti, A.M.; Moreno, A.; Sinhoreti, M.A.C.; Dos Santos, D.M.; Goiato, M.C. Influence of adding nanoparticles on the hardness, tear strength, and permanent deformation of facial silicone subjected to accelerated aging. J. Prosthet. Dent. 2016, 116, 623–629. [Google Scholar] [CrossRef]
- Cevik, P.; Eraslan, O. Effects of the Addition of Titanium Dioxide and Silaned Silica Nanoparticles on the Mechanical Properties of Maxillofacial Silicones. J. Prosthodont. 2016, 26, 611–615. [Google Scholar] [CrossRef]
- Wang, L.; Liu, Q.; Jing, D.; Zhou, S.; Shao, L. Biomechanical properties of nano-TiO2 addition to a medical silicone elastomer: The effect of artificial ageing. J. Dent. 2014, 42, 475–483. [Google Scholar] [CrossRef]
- Kalamarz, I.; Chladek, G.; Pokój, M.; Łukowiec, D.; Krawczyk, C.; Stencel, R.; Jabłońska-Stencel, E. The properties of experimental silicones reinforced with silica fillers for dentistry. Arch. Mater. Sci. Eng. 2016, 81, 22–29. [Google Scholar] [CrossRef][Green Version]
- Zayed, S.M.; Alshimy, A.M.; Fahmy, A.E. Effect of Surface Treated Silicon Dioxide Nanoparticles on Some Mechanical Properties of Maxillofacial Silicone Elastomer. Int. J. Biomater. 2014, 2014, 1–7. [Google Scholar] [CrossRef]
- Tukmachi, M.; Ali, M.M.M. Effect of Nano Silicon Dioxide Addition on Some Properties of Heat Vulcanized Maxillofacial Silicone Elastomer. IOSR J. Pharm. Boil. Sci. 2017, 12, 37–43. [Google Scholar] [CrossRef]
- Al-Mohammad, Y.N.; Abdul-Ameer, F.M. Effects of Artificial Aging on Some Properties of Room-Temperature-Vulcanized Maxillofacial Silicone Elastomer Modified by Yttrium Oxide Nanoparticles. Indian J. Public Heal Res. Dev. 2019, 10, 1200. [Google Scholar] [CrossRef]
- Schubert, D.; Dargusch, R.; Raitano, J.; Chan, S.-W. Cerium and yttrium oxide nanoparticles are neuroprotective. Biochem. Biophys. Res. Commun. 2006, 342, 86–91. [Google Scholar] [CrossRef]
- Liu, Q.; Shao, L.; Xiang, H.; Zhen, D.; Zhao, N.; Yang, S.; Zhang, X.; Xu, J. Biomechanical characterization of a low density silicone elastomer filled with hollow microspheres for maxillofacial prostheses. J. Biomater. Sci. Polym. Ed. 2013, 24, 1378–1390. [Google Scholar] [CrossRef] [PubMed]
- Liu, Q.; Shao, L.; Fan, H.; Long, Y.; Zhao, N.; Yang, S.; Zhang, X.; Xu, J. Characterization of maxillofacial silicone elastomer reinforced with different hollow microspheres. J. Mater. Sci. 2015, 50, 3976–3983. [Google Scholar] [CrossRef]
- Fatalla, A.; Al-Samaray, M.E.; Jassim, R.K. Effect of the Addition of Polyamide (Nylon 6) Micro-Particles on Some Mechanical Properties of RTV Maxillofacial Silicone Elastomer Before and After Artificial Aging. Biomed. Pharmacol. J. 2017, 10, 1933–1942. [Google Scholar] [CrossRef]
- Gunay, Y.; Kurtoglu, C.; Atay, A.; Karayazgan, B.; Gurbuz, C.C. Effect of tulle on the mechanical properties of a maxillofacial silicone elastomer. Dent. Mater. J. 2008, 27, 775–779. [Google Scholar] [CrossRef]
- Haider, Y.M.; Abdullah, Z.S.; Jani, G.H.; Mokhtar, N. Evaluation of Some Mechanical Properties of a Maxillofacial Silicon Elastomer Reinforced with Polyester Powder. Int. J. Dent. 2019, 2019, 1–6. [Google Scholar] [CrossRef]
- Jebur, A.; Fatalla, A.; Aljudy, H. The Effect of Polyester Fibers Addition on Some Mechanical Properties of Room Temperature Vulcanized Maxillofacial Silicon Elastomers. J. Pure Appl. Microbiol. 2018, 12, 165–176. [Google Scholar] [CrossRef]
- Chander, G.N.; Kumarai, K.H.; VasanthaKumar, M. Effect of polyester fiber reinforcement on the mechanical properties of interim fixed partial dentures. Saudi Dent. J. 2015, 27, 194–200. [Google Scholar] [CrossRef]
- Okadaa, K.; Yamaguchi, K.; Takeda, H. Acrylic/polyester hybrid powder coating system having excellent weather durability. Prog. Org. Coat. 1998, 34, 169–174. [Google Scholar] [CrossRef]
- I Salih, S.; Oleiwi, J.K.; Ali, H.M. Study the Mechanical Properties of Polymeric Blends (SR/PMMA) Using for Maxillofacial Prosthesis Application. In Proceedings of the International Conference on Materials Engineering and Science, Istanbul, Turkey, 8 August 2018; IOP Publishing: Bristol, UK; Volume 454, p. 012086. [Google Scholar]
- Avetta, P.; Nisticò, R.; Faga, M.G.; D’Angelo, D.; Boot, E.A.; Lamberti, R.; Martorana, S.; Calza, P.; Fabbri, D.; Magnacca, G. Hernia-repair prosthetic devices functionalised with chitosan and ciprofloxacin coating: Controlled release and antibacterial activity. J. Mater. Chem. B 2014, 2, 5287–5294. [Google Scholar] [CrossRef] [PubMed]
- Al-Judy, H. Mechanical Properties of Chitosan Incorporated in Maxillofacial Silicone and its Anti Candidal Activity In Vitro. J. Res. Med. Dent. Sci. 2019, 6, 101–107. [Google Scholar]
- Azeez, Z.A.; Tukmachi, M.S.; Mohammed, D.H. Effect of Silver-Zinc Zeolite Addition on Mechanical Properties of Maxillofacial Silicone. Int. J. Med. Res. Heal Sci. 2018, 7, 19–29. [Google Scholar]
- Salih, S.I.; Oleiwi, J.K.; Ali, H.M. Investigation the properties of silicone rubber blend reinforced by natural nanoparticles and UHMWpe fiber. Int. J. Mech. Eng. Technol. 2019, 1, 164–178. [Google Scholar]
- Salih, S.I.; Oleiwi, J.K.; Ali, H.M. Modification of silicone rubber by added PMMA and natural nanoparticle used for maxillofacial prosthesis applications. ARPN J. Eng. Appl. Sci. 2019, 14, 781–791. [Google Scholar]


| Score | Criteria |
|---|---|
| 0 | Articles do not meet the Population, Intervention, Control and Outcome (PICO) criteria for case definition. |
| 1 | Inadequate definition of control: articles do not mention the total sample size and does not give a complete description of control group or sample count. |
| 2 | Inadequate comparison of case and control groups on the basis of mechanical property analysis: Inadequate description of mean and standard deviation. Articles with undefined concentration of filler particles. Articles in which tensile strength, tear strength and hardness property were not seen together (i.e., in the same experimental condition). |
| 3 | Articles that satisfy case and control definition with adequate comparison of tensile strength, tear strength and hardness property analysis. Articles may or may not include elongation analyses |
| Year | Author | Score | Reason of Rejection |
|---|---|---|---|
| 2019 | Salih et al. | 1 | Incomplete sample description |
| 2019 | Salih et al. | 1 | Incomplete sample description |
| 2018 | Pınar Çevik | 2 | Does not include tensile strength property |
| 2018 | Al-Hakam J Ibrahim, Hikmat Jameel Al-Judy | 2 | Does not include hardness property |
| 2018 | Salih et al. | 1 | Incomplete sample description |
| 2017 | Cevik and Eraslan, | 2 | Undefined concentration of filler particles |
| 2017 | Tukmachi et al. | 2 | Inadequate description of mean and standard deviation. |
| 2016 | I. Kalamarz | 1 | Incomplete sample description |
| 2016 | Nobegra et al. | 2 | Did not analyze tensile strength property |
| 2015 | Liu et al. | 1 | Inadequate definition of control |
| 2014 | Wang et al. | 1 | Incomplete sample description |
| 2013 | Liu et al. | 1 | Incomplete sample description |
| 2008 | Han et al. | 1 | Did not give a complete description of control group or sample count |
| 2008 | Gunay et al. | 2 | Undefined concentration of filler particle |
| 2002 | Tariq Aziz et al. | 0 | Does not meet the criteria for meta-analysis, does not have proper control group for comparison and all the groups have filler. |
| 1998 | Andreopoulos et al. | 1 | Incomplete sample description |
| 1994 | Andreopoulos et al. | 1 | Incomplete sample description |
| Study or Subgroup | With Filler Particle | Without Filler Particle | Weight | Std. Mean Difference | ||||
|---|---|---|---|---|---|---|---|---|
| Mean | SD | Total | Mean | SD | Total | IV, Random, 95% CI | ||
| Haider (2019) 5%PP | 4.41 | 0.21 | 10 | 4.89 | 0.45 | 10 | 5.9% | −1.31 [−2.30, −0.32] |
| Jebur (2018) 0.5%PF | 6.11 | 0.68 | 10 | 6.66 | 0.45 | 10 | 6.0% | −0.91 [−1.85, 0.02] |
| Haider (2019) 3%PP | 4.59 | 0.39 | 10 | 4.89 | 0.45 | 10 | 6.0% | −0.68 [−1.59, 0.23] |
| Alsamaraay (2017) 1%Nylon | 5.5 | 0.81 | 10 | 5.74 | 0.67 | 10 | 6.1% | −0.31 [−1.19, 0.57] |
| Jebur (2018) 0.25%PF | 6.81 | 0.61 | 10 | 6.66 | 0.45 | 10 | 6.1% | 0.27 [−0.61, 1.15] |
| Haider (2019) 1%PP | 5.01 | 0.11 | 10 | 4.89 | 0.45 | 10 | 6.0% | 0.35 [−0.53, 1.24] |
| Azeez (2018) 0.5% Ag Zn | 3.79 | 0.14 | 10 | 3.63 | 0.25 | 10 | 6.0% | 0.76 [−0.16, 1.67] |
| Azeez (2018) 1.5% Ag Zn | 3.8 | 0.13 | 10 | 3.63 | 0.25 | 10 | 6.0% | 0.82 [−0.10, 1.74] |
| Alsmael (2018) 1% TiS | 7.63 | 0.71 | 10 | 7.01 | 0.54 | 10 | 6.0% | 0.94 [0.01, 1.88] |
| Mohammad (2019) 1% Y2O2 | 5.59 | 0.67 | 10 | 4.89 | 0.74 | 10 | 6.0% | 0.95 [0.01, 1.89] |
| Mohammad (2019) 1.5% Y2O2 | 5.65 | 0.66 | 10 | 4.89 | 0.74 | 10 | 5.9% | 1.04 [0.09, 1.99] |
| Zayed (2014) 3% SiO2 | 3.62 | 0.69 | 21 | 2.78 | 0.36 | 21 | 6.3% | 1.50 [0.81, 2.19] |
| Alsmael (2018) 0.5% TiS | 8.01 | 0.72 | 10 | 7.01 | 0.54 | 10 | 5.8% | 1.50 [0.49, 2.52] |
| Shakir (2018) 0.25%–2%TiO2 | 6.45 | 0.29 | 10 | 5.89 | 0.28 | 10 | 5.7% | 1.88 [0.79, 2.97] |
| Azeez (2018) 1% Ag Zn | 4.08 | 0.13 | 10 | 3.63 | 0.25 | 10 | 5.6% | 2.16 [1.01, 3.32] |
| Kareem (2018) 1%ZrS | 4.94 | 0.5 | 10 | 3.89 | 0.11 | 10 | 5.3% | 2.78 [1.48, 4.08] |
| Kareem (2018) 0.5%ZrS | 4.92 | 0.35 | 10 | 3.89 | 0.11 | 10 | 4.8% | 3.80 [2.22, 5.38] |
| Kareem (2018) 1.5%ZrS | 6.72 | 0.13 | 10 | 3.89 | 0.11 | 10 | 0.6% | 22.51 [14.68, 30.34] |
| Subtotal (95% CI) | 191 | 191 | 100.0% | 0.99 [0.36, 1.61] | ||||
| Heterogeneity: Tau² = 1.48; Chi² = 116.50, df = 17 (P < 0.00001); I² = 85% | ||||||||
| Test for overall effect: Z = 3.09 (P = 0.002) | ||||||||
| Study or Subgroup | With Filler Particle | Without Filler Particle | Weight | Std. Mean Difference | ||||
|---|---|---|---|---|---|---|---|---|
| Mean | SD | Total | Mean | SD | Total | IV, Random, 95% CI | ||
| 2.3.1 NANO | ||||||||
| Alsmael (2018) 1% TiS | 7.63 | 0.71 | 10 | 7.01 | 0.54 | 10 | 6.0% | 0.94 [0.01, 1.88] |
| Mohammad (2019) 1% Y2O2 | 5.59 | 0.67 | 10 | 4.89 | 0.74 | 10 | 6.0% | 0.95 [0.01, 1.89] |
| Mohammad (2019) 1.5% Y2O2 | 5.65 | 0.66 | 10 | 4.89 | 0.74 | 10 | 5.9% | 1.04 [0.09, 1.99] |
| Zayed (2014) 3% SiO2 | 3.62 | 0.69 | 21 | 2.78 | 0.36 | 21 | 6.3% | 1.50 [0.81, 2.19] |
| Alsmael (2018) 0.5% TiS | 8.01 | 0.72 | 10 | 7.01 | 0.54 | 10 | 5.8% | 1.50 [0.49, 2.52] |
| Shakir (2018) 0.25%–2%TiO2 | 6.45 | 0.29 | 10 | 5.89 | 0.28 | 10 | 5.7% | 1.88 [0.79, 2.97] |
| Kareem (2018) 1%ZrS | 4.94 | 0.5 | 10 | 3.89 | 0.11 | 10 | 5.3% | 2.78 [1.48, 4.08] |
| Kareem (2018) 0.5%ZrS | 4.92 | 0.35 | 10 | 3.89 | 0.11 | 10 | 4.8% | 3.80 [2.22, 5.38] |
| Kareem (2018) 1.5%ZrS | 6.72 | 0.13 | 10 | 3.89 | 0.11 | 10 | 0.6% | 22.51 [14.68, 30.34] |
| Subtotal (95% CI) | 101 | 101 | 46.4% | 1.96 [1.09, 2.84] | ||||
| Heterogeneity: Tau² = 1.31; Chi² = 43.43, df = 8 (P < 0.00001); I² = 82% | ||||||||
| Test for overall effect: Z = 4.41 (P < 0.0001) | ||||||||
| 2.3.2 MICRO | ||||||||
| Haider (2019) 5%PP | 4.41 | 0.21 | 10 | 4.89 | 0.45 | 10 | 5.9% | −1.31 [−2.30, −0.32] |
| Jebur (2018) 0.5%PF | 6.11 | 0.68 | 10 | 6.66 | 0.45 | 10 | 6.0% | −0.91 [−1.85, 0.02] |
| Haider (2019) 3%PP | 4.59 | 0.39 | 10 | 4.89 | 0.45 | 10 | 6.0% | −0.68 [−1.59, 0.23] |
| Alsamaraay (2017) 1%Nylon | 5.5 | 0.81 | 10 | 5.74 | 0.67 | 10 | 6.1% | −0.31 [−1.19, 0.57] |
| Jebur (2018) 0.25%PF | 6.81 | 0.61 | 10 | 6.66 | 0.45 | 10 | 6.1% | 0.27 [−0.61, 1.15] |
| Haider (2019) 1%PP | 5.01 | 0.11 | 10 | 4.89 | 0.45 | 10 | 6.0% | 0.35 [−0.53, 1.24] |
| Azeez (2018) 0.5% Ag Zn | 3.79 | 0.14 | 10 | 3.63 | 0.25 | 10 | 6.0% | 0.76 [−0.16, 1.67] |
| Azeez (2018) 1.5% Ag Zn | 3.8 | 0.13 | 10 | 3.63 | 0.25 | 10 | 6.0% | 0.82 [−0.10, 1.74] |
| Azeez (2018) 1% Ag Zn | 4.08 | 0.13 | 10 | 3.63 | 0.25 | 10 | 5.6% | 2.16 [1.01, 3.32] |
| Subtotal (95% CI) | 90 | 90 | 53.6% | 0.11 [−0.53, 0.74] | ||||
| Heterogeneity: Tau² = 0.71; Chi² = 33.08, df = 8 (P < 0.0001); I² = 76% | ||||||||
| Test for overall effect: Z = 0.33 (P = 0.74) | ||||||||
| Total (95% CI) | 191 | 191 | 100.0% | 0.99 [0.36, 1.61] | ||||
| Heterogeneity: Tau² = 1.48; Chi² = 116.50, df = 17 (P < 0.00001); I² = 85% | ||||||||
| Test for overall effect: Z = 3.09 (P = 0.002) | ||||||||
| Test for subgroup differences: Chi² = 11.40, df = 1 (P = 0.0007), I² = 91.2% | ||||||||
| Study or Subgroup | With Filler Particle | Without Filler Particle | Weight | Std. Mean Difference | ||||
|---|---|---|---|---|---|---|---|---|
| Mean | SD | Total | Mean | SD | Total | IV, Random, 95% CI | ||
| Alsamaraay (2017) 1%Nylon | 20.12 | 1.89 | 10 | 20.99 | 1.21 | 10 | 6.2% | −0.53 [−1.42, 0.37] |
| Haider (2019) 5%PP | 20 | 0.74 | 10 | 20.77 | 2.4 | 10 | 6.2% | −0.42 [−1.30, 0.47] |
| Jebur (2018) 0.5%PF | 25.34 | 1.45 | 10 | 25.97 | 2.49 | 10 | 6.2% | −0.30 [−1.18, 0.59] |
| Jebur (2018) 0.25%PF | 26.81 | 2.34 | 10 | 25.97 | 2.49 | 10 | 6.2% | 0.33 [−0.55, 1.22] |
| Kareem (2018) 1%ZrS | 21.66 | 2.99 | 10 | 20.75 | 0.98 | 10 | 6.2% | 0.39 [−0.50, 1.28] |
| Haider (2019) 3%PP | 21.95 | 2.98 | 10 | 20.77 | 2.4 | 10 | 6.2% | 0.42 [−0.47, 1.31] |
| Alsmael (2018) 1% TiS | 26.48 | 3.46 | 10 | 23.39 | 2.29 | 10 | 6.1% | 1.01 [0.07, 1.95] |
| Kareem (2018) 0.5%ZrS | 21.65 | 0.47 | 10 | 20.75 | 0.98 | 10 | 6.1% | 1.12 [0.16, 2.08] |
| Haider (2019) 1%PP | 23.48 | 0.76 | 10 | 20.77 | 2.4 | 10 | 6.1% | 1.46 [0.45, 2.47] |
| Alsmael (2018) 0.5% TiS | 27.92 | 2.95 | 10 | 23.39 | 2.29 | 10 | 6.1% | 1.64 [0.60, 2.69] |
| Mohammad (2019) 1% Y2O2 | 26.89 | 1.15 | 10 | 23.93 | 1.08 | 10 | 5.9% | 2.54 [1.30, 3.78] |
| Kareem (2018) 1.5%ZrS | 23.4 | 0.66 | 10 | 20.75 | 0.98 | 10 | 5.8% | 3.04 [1.67, 4.41] |
| Mohammad (2019) 1.5% Y2O2 | 27.98 | 0.67 | 10 | 23.93 | 1.08 | 10 | 5.4% | 4.32 [2.59, 6.05] |
| Azeez (2018) 1.5% Ag Zn | 19.18 | 1.09 | 10 | 14.81 | 0.67 | 10 | 5.3% | 4.63 [2.80, 6.45] |
| Azeez (2018) 0.5% Ag Zn | 19.03 | 0.85 | 10 | 14.81 | 0.67 | 10 | 5.1% | 5.28 [3.26, 7.31] |
| Shakir (2018) 0.25%–2%TiO2 | 27.67 | 0.47 | 10 | 23.61 | 0.34 | 10 | 3.7% | 9.48 [6.09, 12.87] |
| Azeez (2018) 1% Ag Zn | 22.57 | 0.81 | 10 | 14.81 | 0.67 | 10 | 3.5% | 10.00 [6.43, 13.57] |
| Zayed (2014) 3% SiO2 | 45.9 | 1.94 | 21 | 19.32 | 1.9 | 21 | 3.9% | 13.58 [10.47, 16.69] |
| Subtotal (95% CI) | 191 | 191 | 100.0% | 2.62 [1.64, 3.59] | ||||
| Heterogeneity: Tau² = 3.84; Chi² = 208.67, df = 17 (P < 0.00001); I² = 92% | ||||||||
| Test for overall effect: Z = 5.23 (P < 0.00001) | ||||||||
| Study or Subgroup | With Filler Particle | Without Filler Particle | Weight | Std. Mean Difference | ||||
|---|---|---|---|---|---|---|---|---|
| Mean | SD | Total | Mean | SD | Total | IV, Random, 95% CI | ||
| 4.2.1 Nano Filler | ||||||||
| Kareem (2018) 1%ZrS | 21.66 | 2.99 | 10 | 20.75 | 0.98 | 10 | 6.2% | 0.39 [−0.50, 1.28] |
| Alsmael (2018) 1% TiS | 26.48 | 3.46 | 10 | 23.39 | 2.29 | 10 | 6.1% | 1.01 [0.07, 1.95] |
| Kareem (2018) 0.5%ZrS | 21.65 | 0.47 | 10 | 20.75 | 0.98 | 10 | 6.1% | 1.12 [0.16, 2.08] |
| Alsmael (2018) 0.5% TiS | 27.92 | 2.95 | 10 | 23.39 | 2.29 | 10 | 6.1% | 1.64 [0.60, 2.69] |
| Mohammad (2019) 1% Y2O2 | 26.89 | 1.15 | 10 | 23.93 | 1.08 | 10 | 5.9% | 2.54 [1.30, 3.78] |
| Kareem (2018) 1.5%ZrS | 23.4 | 0.66 | 10 | 20.75 | 0.98 | 10 | 5.8% | 3.04 [1.67, 4.41] |
| Mohammad (2019) 1.5% Y2O2 | 27.98 | 0.67 | 10 | 23.93 | 1.08 | 10 | 5.4% | 4.32 [2.59, 6.05] |
| Shakir (2018) 0.25%–2%TiO2 | 27.67 | 0.47 | 10 | 23.61 | 0.34 | 10 | 3.7% | 9.48 [6.09, 12.87] |
| Zayed (2014) 3% SiO2 | 45.9 | 1.94 | 21 | 19.32 | 1.9 | 21 | 3.9% | 13.58 [10.47, 16.69] |
| Subtotal (95% CI) | 101 | 101 | 49.1% | 3.53 [2.00, 5.06] | ||||
| Heterogeneity: Tau² = 4.72; Chi² = 101.76, df = 8 (P < 0.00001); I² = 92% | ||||||||
| Test for overall effect: Z = 4.53 (P < 0.00001) | ||||||||
| 4.2.2 Micro Filler | ||||||||
| Alsamaraay (2017) 1%Nylon | 20.12 | 1.89 | 10 | 20.99 | 1.21 | 10 | 6.2% | −0.53 [−1.42, 0.37] |
| Haider (2019) 5%PP | 20.0 | 0.74 | 10 | 20.77 | 2.4 | 10 | 6.2% | −0.42 [−1.30, 0.47] |
| Jebur (2018) 0.5%PF | 25.34 | 1.45 | 10 | 25.97 | 2.49 | 10 | 6.2% | −0.30 [−1.18, 0.59] |
| Jebur (2018) 0.25%PF | 26.81 | 2.34 | 10 | 25.97 | 2.49 | 10 | 6.2% | 0.33 [−0.55, 1.22] |
| Haider (2019) 3%PP | 21.95 | 2.98 | 10 | 20.77 | 2.4 | 10 | 6.2% | 0.42 [−0.47, 1.31] |
| Haider (2019) 1%PP | 23.48 | 0.76 | 10 | 20.77 | 2.4 | 10 | 6.1% | 1.46 [0.45, 2.47] |
| Azeez (2018) 1.5% Ag Zn | 19.18 | 1.09 | 10 | 14.81 | 0.67 | 10 | 5.3% | 4.63 [2.80, 6.45] |
| Azeez (2018) 0.5% Ag Zn | 19.03 | 0.85 | 10 | 14.81 | 0.67 | 10 | 5.1% | 5.28 [3.26, 7.31] |
| Azeez (2018) 1% Ag Zn | 22.57 | 0.81 | 10 | 14.81 | 0.67 | 10 | 3.5% | 10.00 [6.43, 13.57] |
| Subtotal (95% CI) | 90 | 90 | 50.9% | 1.72 [0.50, 2.94] | ||||
| Heterogeneity: Tau² = 2.92; Chi² = 84.10, df = 8 (P < 0.00001); I² = 90% | ||||||||
| Test for overall effect: Z = 2.77 (P = 0.006) | ||||||||
| Total (95% CI) | 191 | 191 | 100.0% | 2.62 [1.64, 3.59] | ||||
| Heterogeneity: Tau² = 3.84; Chi² = 208.67, df = 17 (P < 0.00001); I² = 92% | ||||||||
| Test for overall effect: Z = 5.23 (P < 0.00001) | ||||||||
| Test for subgroup differences: Chi² = 3.31, df = 1 (P = 0.07), I² = 69.8% | ||||||||
| Study or Subgroup | With Filler Particle | Without Filler Particle | Weight | Std. Mean Difference | ||||
|---|---|---|---|---|---|---|---|---|
| Mean | SD | Total | Mean | SD | Total | IV, Random, 95% CI | ||
| Haider (2019) 1%PP | 31.04 | 1.72 | 10 | 30.73 | 1.72 | 10 | 6.2% | 0.17 [−0.71, 1.05] |
| Kareem (2018) 0.5%ZrS | 31.25 | 1.71 | 10 | 30.93 | 1.73 | 10 | 6.2% | 0.18 [−0.70, 1.06] |
| Azeez (2018) 0.5% Ag Zn | 33.69 | 0.56 | 10 | 33.4 | 0.61 | 10 | 6.2% | 0.47 [−0.42, 1.37] |
| Alsmael (2018) 0.5% TiS | 37.11 | 1.75 | 10 | 34.89 | 2.15 | 10 | 6.2% | 1.08 [0.13, 2.04] |
| Azeez (2018) 1% Ag Zn | 34.01 | 0.4 | 10 | 33.4 | 0.61 | 10 | 6.2% | 1.13 [0.17, 2.09] |
| Alsmael (2018) 1% TiS | 38.89 | 2.45 | 10 | 34.89 | 2.15 | 10 | 6.0% | 1.66 [0.61, 2.71] |
| Jebur (2018) 0.25%PF | 43.03 | 0.43 | 10 | 41.33 | 1.04 | 10 | 5.9% | 2.05 [0.92, 3.17] |
| Kareem (2018) 1%ZrS | 34.51 | 1.53 | 10 | 30.93 | 1.73 | 10 | 5.9% | 2.10 [0.96, 3.24] |
| Haider (2019) 3%PP | 34.31 | 1.51 | 10 | 30.73 | 1.72 | 10 | 5.9% | 2.12 [0.98, 3.26] |
| Kareem (2018) 1.5%ZrS | 34.86 | 1.32 | 10 | 30.93 | 1.73 | 10 | 5.8% | 2.45 [1.23, 3.66] |
| Haider (2019) 5%PP | 34.67 | 1.29 | 10 | 30.73 | 1.72 | 10 | 5.8% | 2.48 [1.26, 3.71] |
| Azeez (2018) 1.5% Ag Zn | 34.89 | 0.44 | 10 | 33.4 | 0.61 | 10 | 5.7% | 2.68 [1.41, 3.96] |
| Alsamaraay (2017) 1%Nylon | 44.52 | 0.79 | 10 | 42.15 | 0.89 | 10 | 5.7% | 2.70 [1.42, 3.98] |
| Shakir (2018) 0.25%–2%TiO2 | 29.27 | 0.53 | 10 | 27.21 | 0.29 | 10 | 5.0% | 4.62 [2.80, 6.44] |
| Jebur (2018) 0.5%PF | 45.5 | 0.36 | 10 | 41.33 | 1.04 | 10 | 4.7% | 5.13 [3.15, 7.11] |
| Zayed (2014) 3% SiO2 | 29.97 | 0.38 | 21 | 28.09 | 0.32 | 21 | 5.7% | 5.25 [3.93, 6.58] |
| Mohammad (2019) 1% Y2O2 | 31.09 | 0.6 | 10 | 27.26 | 0.4 | 10 | 3.8% | 7.19 [4.56, 9.83] |
| Mohammad (2019) 1.5% Y2O2 | 32.31 | 0.54 | 10 | 27.26 | 0.4 | 10 | 2.8% | 10.18 [6.55, 13.81] |
| Subtotal (95% CI) | 191 | 191 | 100.0% | 2.58 [1.80, 3.37] | ||||
| Heterogeneity: Tau² = 2.36; Chi² = 128.24, df = 17 (P < 0.00001); I² = 87% | ||||||||
| Test for overall effect: Z = 6.46 (P < 0.00001) | ||||||||
| Study or Subgroup | With Filler Particle | Without Filler Particle | Weight | Std. Mean Difference | ||||
|---|---|---|---|---|---|---|---|---|
| Mean | SD | Total | Mean | SD | Total | IV, Random, 95% CI | ||
| 5.1.1 Nano filler | ||||||||
| Kareem (2018) 0.5%ZrS | 31.25 | 1.71 | 10 | 30.93 | 1.73 | 10 | 6.2% | 0.18 [−0.70, 1.06] |
| Alsmael (2018) 0.5% TiS | 37.11 | 1.75 | 10 | 34.89 | 2.15 | 10 | 6.2% | 1.08 [0.13, 2.04] |
| Alsmael (2018) 1% TiS | 38.89 | 2.45 | 10 | 34.89 | 2.15 | 10 | 6.0% | 1.66 [0.61, 2.71] |
| Kareem (2018) 1%ZrS | 34.51 | 1.53 | 10 | 30.93 | 1.73 | 10 | 5.9% | 2.10 [0.96, 3.24] |
| Kareem (2018) 1.5%ZrS | 34.86 | 1.32 | 10 | 30.93 | 1.73 | 10 | 5.8% | 2.45 [1.23, 3.66] |
| Shakir (2018) 0.25%–2%TiO2 | 29.27 | 0.53 | 10 | 27.21 | 0.29 | 10 | 5.0% | 4.62 [2.80, 6.44] |
| Zayed (2014) 3% SiO2 | 29.97 | 0.38 | 21 | 28.09 | 0.32 | 21 | 5.7% | 5.25 [3.93, 6.58] |
| Mohammad (2019) 1% Y2O2 | 31.09 | 0.6 | 10 | 27.26 | 0.4 | 10 | 3.8% | 7.19 [4.56, 9.83] |
| Mohammad (2019) 1.5% Y2O2 | 32.31 | 0.54 | 10 | 27.26 | 0.4 | 10 | 2.8% | 10.18 [6.55, 13.81] |
| Subtotal (95% CI) | 101 | 101 | 47.5% | 3.41 [1.97, 4.84] | ||||
| Heterogeneity: Tau² = 4.11; Chi² = 86.12, df = 8 (P < 0.00001); I² = 91% | ||||||||
| Test for overall effect: Z = 4.64 (P < 0.00001) | ||||||||
| 5.1.2 Micro filler | ||||||||
| Haider (2019) 1%PP | 31.04 | 1.72 | 10 | 30.73 | 1.72 | 10 | 6.2% | 0.17 [−0.71, 1.05] |
| Azeez (2018) 0.5% Ag Zn | 33.69 | 0.56 | 10 | 33.4 | 0.61 | 10 | 6.2% | 0.47 [−0.42, 1.37] |
| Azeez (2018) 1% Ag Zn | 34.01 | 0.4 | 10 | 33.4 | 0.61 | 10 | 6.2% | 1.13 [0.17, 2.09] |
| Jebur (2018) 0.25%PF | 43.03 | 0.43 | 10 | 41.33 | 1.04 | 10 | 5.9% | 2.05 [0.92, 3.17] |
| Haider (2019) 3%PP | 34.31 | 1.51 | 10 | 30.73 | 1.72 | 10 | 5.9% | 2.12 [0.98, 3.26] |
| Haider (2019) 5%PP | 34.67 | 1.29 | 10 | 30.73 | 1.72 | 10 | 5.8% | 2.48 [1.26, 3.71] |
| Azeez (2018) 1.5% Ag Zn | 34.89 | 0.44 | 10 | 33.4 | 0.61 | 10 | 5.7% | 2.68 [1.41, 3.96] |
| Alsamaraay (2017) 1%Nylon | 44.52 | 0.79 | 10 | 42.15 | 0.89 | 10 | 5.7% | 2.70 [1.42, 3.98] |
| Jebur (2018) 0.5%PF | 45.5 | 0.36 | 10 | 41.33 | 1.04 | 10 | 4.7% | 5.13 [3.15, 7.11] |
| Subtotal (95% CI) | 90 | 90 | 52.5% | 1.95 [1.12, 2.78] | ||||
| Heterogeneity: Tau² = 1.24; Chi² = 38.35, df = 8 (P < 0.00001); I² = 79% | ||||||||
| Test for overall effect: Z = 4.61 (P < 0.00001) | ||||||||
| Total (95% CI) | 191 | 191 | 100.0% | 2.58 [1.80, 3.37] | ||||
| Heterogeneity: Tau² = 2.36; Chi² = 128.24, df = 17 (P < 0.00001); I² = 87% | ||||||||
| Test for overall effect: Z = 6.46 (P < 0.00001) | ||||||||
| Test for subgroup differences: Chi² = 2.97, df = 1 (P = 0.08), I² = 66.3% | ||||||||
| Study or Subgroup | With Filler Particle | Without Filler Particle | Weight | Std. Mean Difference | ||||
|---|---|---|---|---|---|---|---|---|
| Mean | SD | Total | Mean | SD | Total | IV, Random, 95% CI | ||
| Azeez (2018) 1.5% Ag Zn | 312.9 | 8.96 | 10 | 342.5 | 9.22 | 10 | 9.8% | −3.12 [−4.51, −1.73] |
| Alsamaraay (2017) 1%Nylon | 203.52 | 23.02 | 10 | 270.69 | 21.43 | 10 | 9.9% | −2.89 [−4.22, −1.56] |
| Azeez (2018) 1% Ag Zn | 319.9 | 6.1 | 10 | 342.5 | 9.22 | 10 | 9.9% | −2.77 [−4.07, −1.47] |
| Azeez (2018) 0.5% Ag Zn | 327.9 | 6.31 | 10 | 342.5 | 9.22 | 10 | 10.0% | −1.77 [−2.84, −0.70] |
| Jebur (2018) 0.25%PF | 216.29 | 10.86 | 10 | 213.33 | 43.33 | 10 | 10.1% | 0.09 [−0.79, 0.97] |
| Jebur (2018) 0.5%PF | 220.55 | 11.19 | 10 | 213.33 | 43.33 | 10 | 10.1% | 0.22 [−0.66, 1.10] |
| Shakir (2018) 0.25%–2%TiO2 | 1462.71 | 120.0 | 10 | 1431.17 | 56.9 | 10 | 10.1% | 0.32 [−0.56, 1.21] |
| Kareem (2018) 0.5%ZrS | 994.74 | 84.02 | 10 | 770.93 | 59.35 | 10 | 9.9% | 2.95 [1.60, 4.29] |
| Kareem (2018) 1.5%ZrS | 1424.4 | 81.72 | 10 | 770.93 | 59.35 | 10 | 8.4% | 8.76 [5.61, 11.92] |
| Kareem (2018) 1%ZrS | 1229.09 | 30.63 | 10 | 770.93 | 59.35 | 10 | 8.2% | 9.29 [5.96, 12.62] |
| Zayed (2014) 3% SiO2 | 754.8 | 4.06 | 21 | 590.0 | 3.18 | 21 | 3.1% | 44.34 [34.36, 54.32] |
| Mohammad (2019) 1% Y2O2 | 569.0 | 0.5 | 10 | 515.9 | 0.33 | 10 | 0.3% | 120.05 [78.53, 161.58] |
| Mohammad (2019) 1.5% Y2O2 | 574.0 | 0.5 | 10 | 515.9 | 0.33 | 10 | 0.2% | 131.36 [85.92, 176.79] |
| Total (95% CI) | 141 | 141 | 100.0% | 2.78 [0.66, 4.90] | ||||
| Heterogeneity: Tau² = 11.37; Chi² = 282.81, df = 12 (P < 0.00001); I² = 96% | ||||||||
| Test for overall effect: Z = 2.57 (P = 0.01) | ||||||||
| Study or Subgroup | With Filler Particle | Without Filler Particle | Weight | Std. Mean Difference | ||||
|---|---|---|---|---|---|---|---|---|
| Mean | SD | Total | Mean | SD | Total | IV, Random, 95% CI | ||
| 1.3.1 NANO | ||||||||
| Shakir (2018) 0.25%–2%TiO2 | 1462.71 | 120.0 | 10 | 1431.17 | 56.9 | 10 | 10.1% | 0.32 [−0.56, 1.21] |
| Kareem (2018) 0.5%ZrS | 994.74 | 84.02 | 10 | 770.93 | 59.35 | 10 | 9.9% | 2.95 [1.60, 4.29] |
| Kareem (2018) 1.5%ZrS | 1424.4 | 81.72 | 10 | 770.93 | 59.35 | 10 | 8.4% | 8.76 [5.61, 11.92] |
| Kareem (2018) 1%ZrS | 1229.09 | 30.63 | 10 | 770.93 | 59.35 | 10 | 8.2% | 9.29 [5.96, 12.62] |
| Zayed (2014) 3% SiO2 | 754.8 | 4.06 | 21 | 590.0 | 3.18 | 21 | 3.1% | 44.34 [34.36, 54.32] |
| Mohammad (2019) 1% Y2O2 | 569.0 | 0.5 | 10 | 515.9 | 0.33 | 10 | 0.3% | 120.05 [78.53, 161.58] |
| Mohammad (2019) 1.5% Y2O2 | 574.0 | 0.5 | 10 | 515.9 | 0.33 | 10 | 0.2% | 131.36 [85.92, 176.79] |
| Subtotal (95% CI) | 81 | 81 | 40.1% | 14.65 [8.69, 20.61] | ||||
| Heterogeneity: Tau² = 43.04; Chi² = 183.03, df = 6 (P < 0.00001); I² = 97% | ||||||||
| Test for overall effect: Z = 4.82 (P < 0.00001) | ||||||||
| 1.3.2 MICRO | ||||||||
| Azeez (2018) 1.5% Ag Zn | 312.9 | 8.96 | 10 | 342.5 | 9.22 | 10 | 9.8% | −3.12 [−4.51, −1.73] |
| Alsamaraay (2017) 1%Nylon | 203.52 | 23.02 | 10 | 270.69 | 21.43 | 10 | 9.9% | −2.89 [−4.22, −1.56] |
| Azeez (2018) 1% Ag Zn | 319.9 | 6.1 | 10 | 342.5 | 9.22 | 10 | 9.9% | −2.77 [−4.07, −1.47] |
| Azeez (2018) 0.5% Ag Zn | 327.9 | 6.31 | 10 | 342.5 | 9.22 | 10 | 10.0% | −1.77 [−2.84, −0.70] |
| Jebur (2018) 0.25%PF | 216.9 | 10.86 | 10 | 213.33 | 43.33 | 10 | 10.1% | 0.11 [−0.77, 0.99] |
| Jebur (2018) 0.5%PF | 220.55 | 11.19 | 10 | 213.33 | 43.33 | 10 | 10.1% | 0.22 [−0.66, 1.10] |
| Subtotal (95% CI) | 60 | 60 | 59.9% | −1.64 [−2.89, −0.38] | ||||
| Heterogeneity: Tau² = 2.11; Chi² = 38.76, df = 5 (P < 0.00001); I² = 87% | ||||||||
| Test for overall effect: Z = 2.56 (P = 0.01) | ||||||||
| Total (95% CI) | 141 | 141 | 100.0% | 2.78 [0.66, 4.90] | ||||
| Heterogeneity: Tau² = 11.37; Chi² = 282.87, df = 12 (P < 0.00001); I² = 96% | ||||||||
| Test for overall effect: Z = 2.57 (P = 0.01) | ||||||||
| Test for subgroup differences: Chi² = 27.44, df = 1 (P < 0.00001), I² = 96.4% | ||||||||
© 2020 by the authors. Licensee MDPI, Basel, Switzerland. This article is an open access article distributed under the terms and conditions of the Creative Commons Attribution (CC BY) license (http://creativecommons.org/licenses/by/4.0/).
Share and Cite
Barman, A.; Rashid, F.; Farook, T.H.; Jamayet, N.B.; Dudley, J.; Yhaya, M.F.B.; Alam, M.K. The Influence of Filler Particles on the Mechanical Properties of Maxillofacial Prosthetic Silicone Elastomers: A Systematic Review and Meta-Analysis. Polymers 2020, 12, 1536. https://doi.org/10.3390/polym12071536
Barman A, Rashid F, Farook TH, Jamayet NB, Dudley J, Yhaya MFB, Alam MK. The Influence of Filler Particles on the Mechanical Properties of Maxillofacial Prosthetic Silicone Elastomers: A Systematic Review and Meta-Analysis. Polymers. 2020; 12(7):1536. https://doi.org/10.3390/polym12071536
Chicago/Turabian StyleBarman, Aparna, Farah Rashid, Taseef Hasan Farook, Nafij Bin Jamayet, James Dudley, Mohd Firdaus Bin Yhaya, and Mohammad Khursheed Alam. 2020. "The Influence of Filler Particles on the Mechanical Properties of Maxillofacial Prosthetic Silicone Elastomers: A Systematic Review and Meta-Analysis" Polymers 12, no. 7: 1536. https://doi.org/10.3390/polym12071536
APA StyleBarman, A., Rashid, F., Farook, T. H., Jamayet, N. B., Dudley, J., Yhaya, M. F. B., & Alam, M. K. (2020). The Influence of Filler Particles on the Mechanical Properties of Maxillofacial Prosthetic Silicone Elastomers: A Systematic Review and Meta-Analysis. Polymers, 12(7), 1536. https://doi.org/10.3390/polym12071536