Essential Nanostructure Parameters to Govern Reinforcement and Functionality of Poly(lactic) Acid Nanocomposites with Graphene and Carbon Nanotubes for 3D Printing Application

 ,
,  , ,
, , 
 ,
,  ,
,  and
and
Abstract
1. Introduction
2. Materials and Methods
2.1. Materials
2.2. Experimental Methods
3. Results
3.1. Essential Rheological Parameters
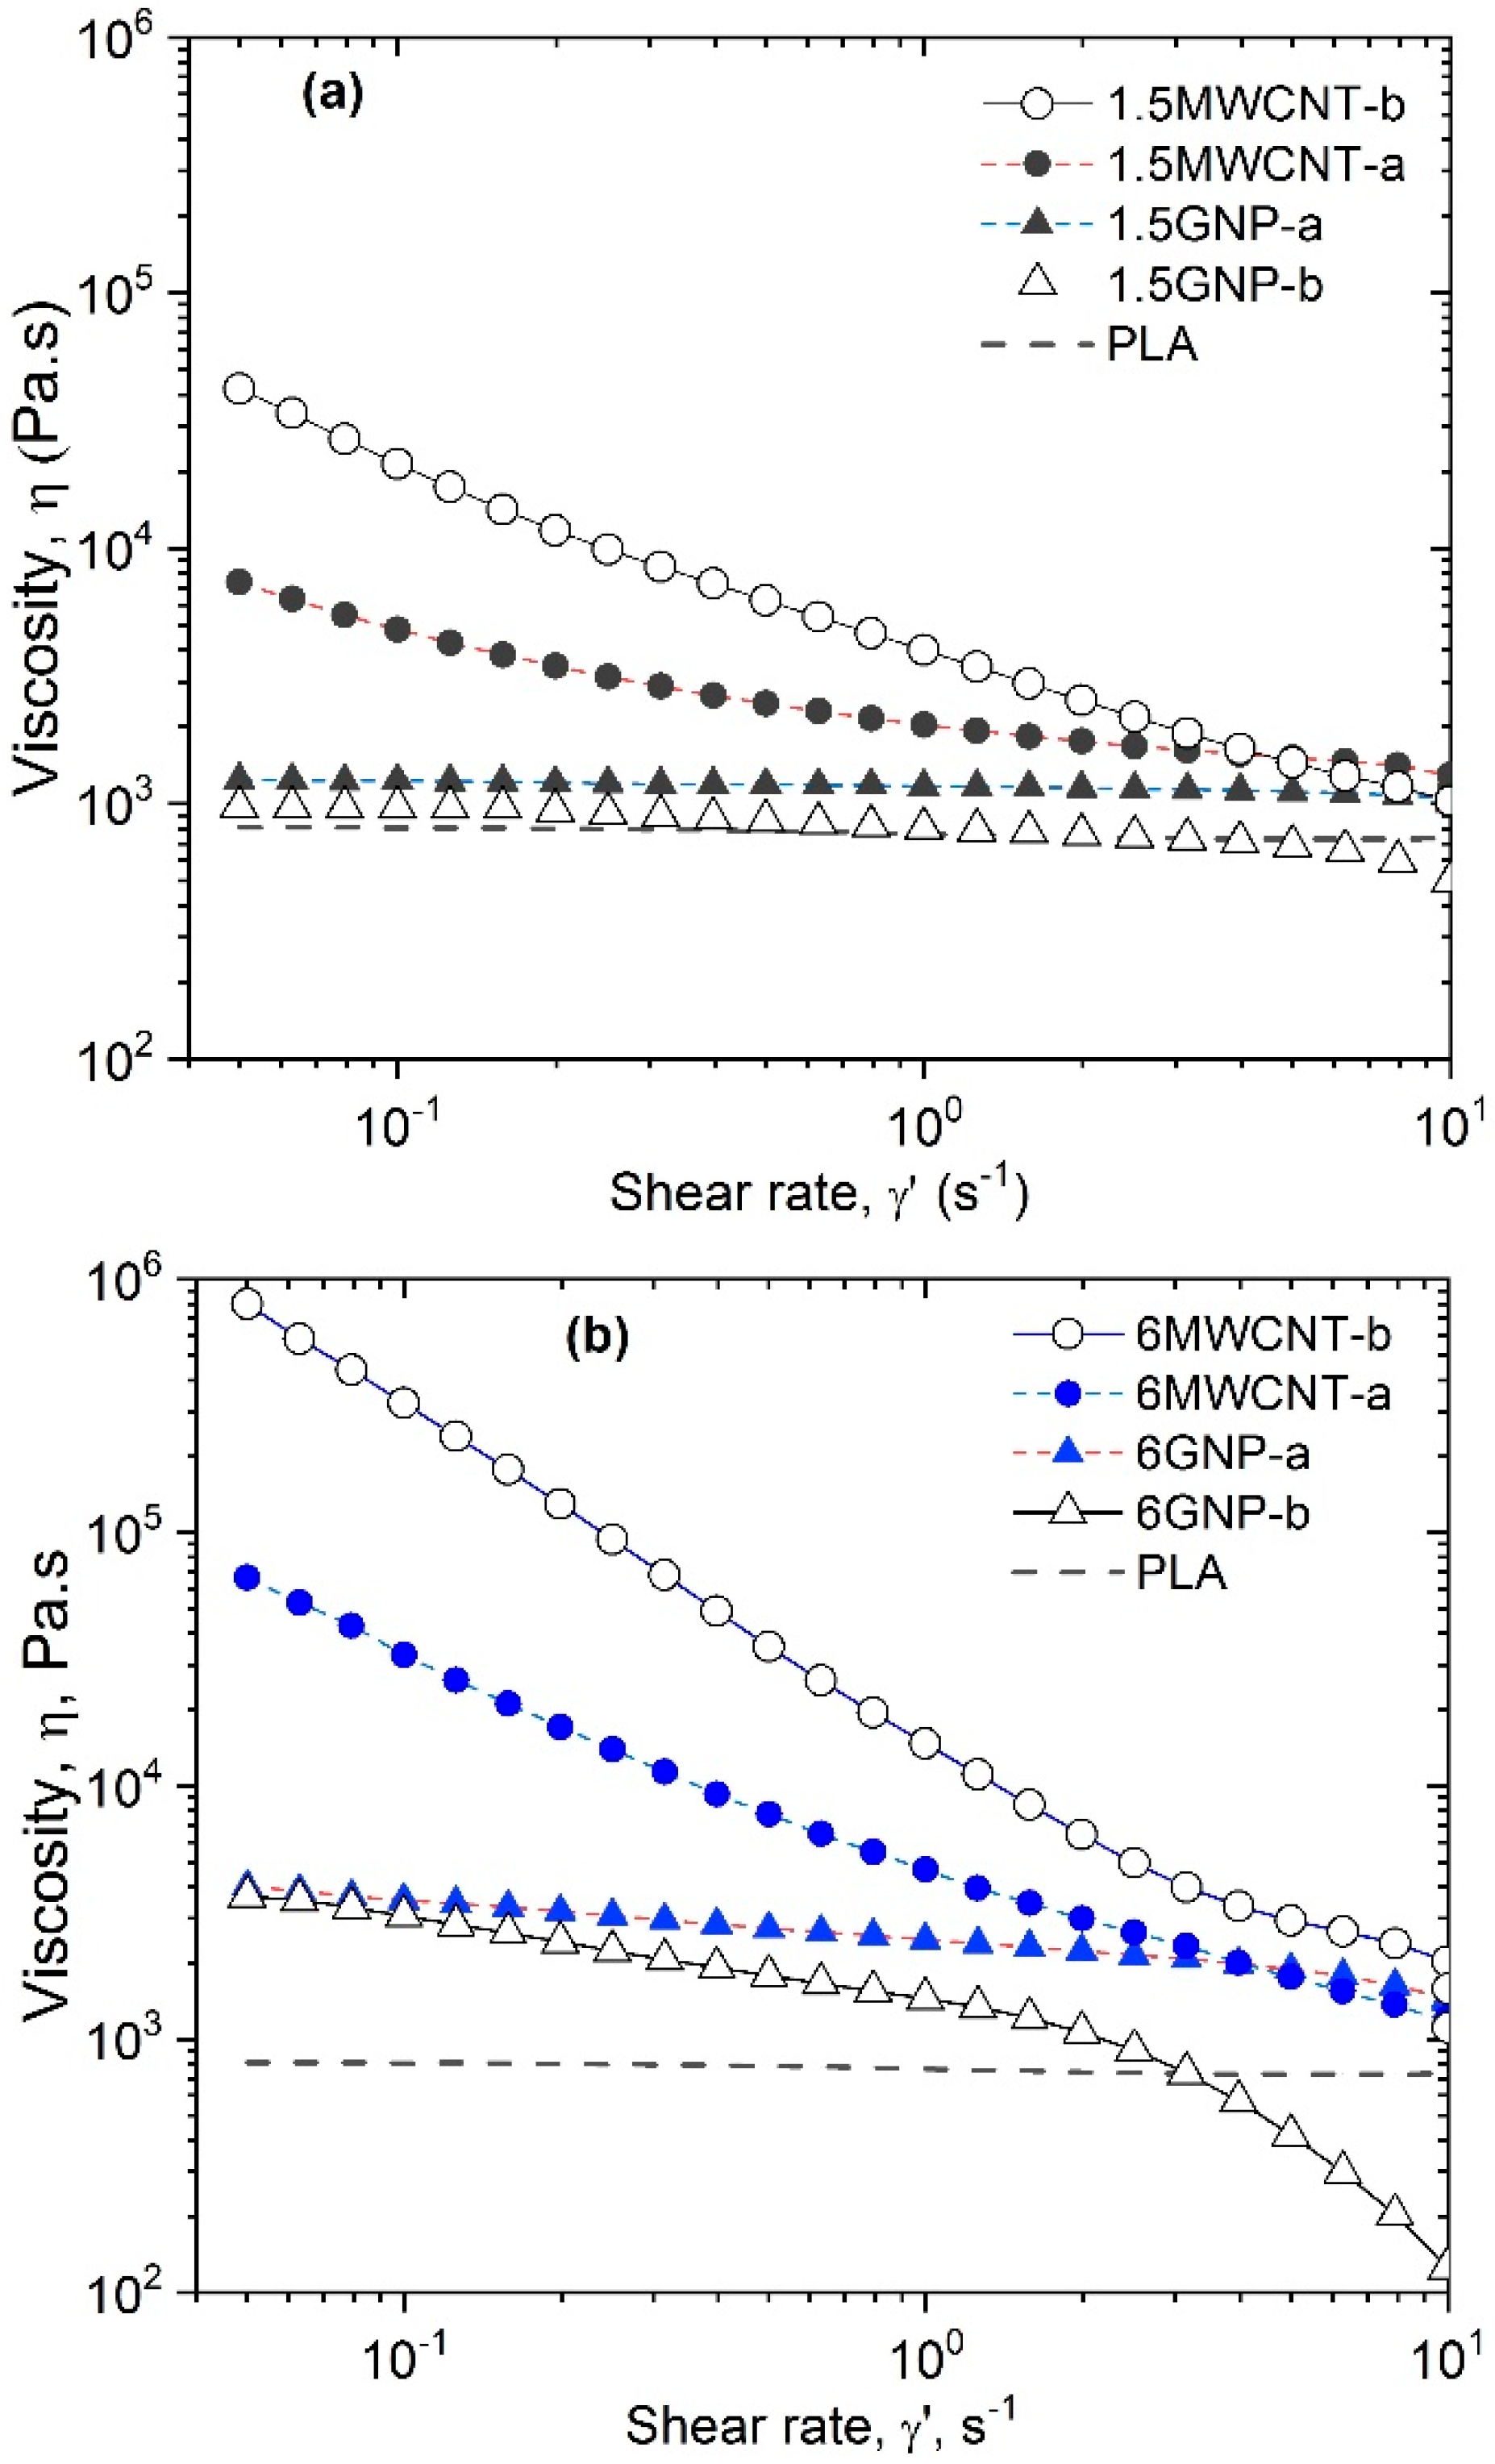
3.1.1. Degree of Dispersion
3.1.2. Rheological Percolation Threshold
3.1.3. Interfacial Interactions
3.2. Microstructure and Morphology of Nanocomposites
3.2.1. XRD Analysis of Materials
3.2.2. TEM Morphological Analysis
3.3. Mechanical Properties
3.4. Electrical Conductivity
3.5. Thermal Conductivity
- (i)
- 2D vs. 1D shape of the filler: The nanocomposites containing 2D-predominant shape fillers, such as graphene nanoparticles (GNPs) showed much better heat conduction compared to the 1D-nanotubes (MWCNTs). Thus, the total surface wetting of 2D-GNP nanoplatelets by PLA polymer favors the strong binding among the graphene surfaces and the PLA matrix, thereby a well-established morphological network of filler within the composite. Therefore, the interface contacts between 2D (GNPs) and matrix polymer are characterized by much lower thermal Kapitza resistance (Rk), if compared with the 1D (MWCNTs), where the inner surfaces of the nanotubes are poorly wetted by the PLA. This means a more effective phonon heat flow in 2D-nanoplatelets, rather than 1D-nanotubes, that matched well to those in organic molecules, thus lowering the differences of phonon density of states between the two phases [10,26].
- (ii)
- Degree of dispersion and interfacial interactions. Better dispersion and stronger interfacial interaction of both 2D and 1D fillers in the matrix polymer resulted in higher values of thermal conductivity, due to stronger suppressing of phonon scattering. In particular, at a fixed filler content (i.e., 9 wt.%), the higher interfacial interactions in the GNP-a nanocomposites resulted in 254% improvement of thermal conductivity, while 223% for the GNP-b, compared to the neat PLA. In the case of 1D-MWCNTs, the higher degree of dispersion and stronger interfacial interactions of MWCNT-b resulted in a 113% increase in thermal conductivity, compared to a 94% increase for the MWCNT-a, with respect to the matrix PLA.
3.6. Electromagnetic Shielding
- (i)
- Degree of dispersion, filler density, and structural organization: As shown in Section 3.1 and Section 3.2 above, the MWCNT-b demonstrate highest degree of dispersion in PLA matrix polymer, thereby much higher filler density in a volume of polymer at a fixed filler concentration, compared to MWCNT-a. Hence, the 6 wt.% MWCNT-b nanocomposite formed a homogeneous microstructure, while the MWCNT-a build a segregated structure of nanotubes, with poor and enriched by MWCNT regions. These structural features may be associated with the maximum shielding efficiency, SE~100% for MWCNT-b nanocomposites followed by SE ~ 90% of MWCNT-a within 6–9 wt.% filler contents. In case of GNPs fillers, the shielding efficiency of 80–86% for GNP-a, and SE = 75–80% for GNP-b nanocomposites, due to the aggregated structure with low filler density and low degree of dispersion of both fillers. Recently, researchers also reported the low frequency plasmon and high electromagnetic interference shielding efficiency of composites with a segregated carbon nanotubes network [32].
- (ii)
- Number of graphitic walls/layers in nanoparticles and interfacial interactions: The MWCNT-b nanotubes contain smaller number of graphitic walls (~5), compared to the MWCNT-a (~20), as estimated by the differences between the outer and the inner diameter. Therefore, the remarkable electromagnetic shielding efficiency of 6–9 wt.% MWCNT-b nanocomposites (SE = 100%), compared to MWCNT-a (SE = 90%), may be associated with 4-fold smaller number of the graphitic walls in MWCNT-b. Along with the simple geometrical explanation (the thinner the tube within the same weight percentage, the larger the number of individual tubes forming a percolative network), this effect also has an electromagnetic origin. In the microwave range, for long MWCNTs there exists the electromagnetic screening, when wave could not penetrate fully inside the tube, and therefore not all walls take part in the EM interaction. This means that the use of MWCNT with as small as possible number of walls is preferable, in favor of MWCNT-b [33]. For GNP nanocomposites, the GNP-a and GNP-b fillers have a stack thickness of 34 nm and 29 nm, respectively, as shown by WAXD analysis in Section 3.2.1. Therefore, both GNP fillers have similar number of graphitic layers, which may explain the similar electromagnetic shielding efficiency of both nanocomposites, SE~80%. However, the GNP-b nanocomposites demonstrate high R = 75% and very low A = 5% at 9 wt.% filler content, in contrast to the GNP-a, with R ~ 60% and A ~ 20%. This may be due to the stronger interfacial interactions in GNP-a nanocomposites compared to GNP-b one, allowing easy transfer of functionality from filler to the polymer.
4. Conclusions
Author Contributions
Funding
Acknowledgments
Conflicts of Interest
References
- Chee, W.K.; Lim, H.N.; Huang, N.M.; Harrison, I. Nanocomposites of graphene/ polymers: A review. RSC Adv. 2015, 5, 68014–68051. [Google Scholar] [CrossRef]
- Tjong, S.C. Polymer Composites with Carbonaceous Nanofillers: Properties and Applications; Wiley-VCH: Hoboken, NJ, USA, 2012; pp. 103–379. [Google Scholar]
- Shen, M.Y.; Chang, T.Y.; Hsieh, T.H.; Li, Y.L.; Chiang, C.L.; Yang, H.; Yip, M.C. Mechanical Properties and Tensile Fatigue of Graphene Nanoplatelets Reinforced Polymer Nanocomposites. J. Nanomater. Hindawi 2013, 565401. [Google Scholar] [CrossRef]
- Kotsilkova, R. Thermosetting Nanocomposites for Engineering Application; Rapra Smiths Group: London, UK, 2007; pp. 1–350. [Google Scholar]
- Kotsilkova, R.; Ivanov, E.; Krusteva, E.; Silvestre, C.; Cimmino, S.; Durracio, D. Evolution of Rheology, Structure, and Properties around the Rheological Flocculation and Percolation Thresholds in Polymer Nanocomposites. In Ecosustainable Polymer Nanomaterials for Food Packaging; Silvestre, C., Cimmino, S., Eds.; Taylor & Francis Books: Abingdon, UK, 2013; pp. 55–86. [Google Scholar]
- Wu, D.; Wu, L.; Zhou, W.; Sun, Y.; Zhang, M. Relations between the aspect ratio of carbon nanotubes and the formation of percolation networks in biodegradable polylactide/carbon nanotube composites. J. Polym. Sci. B Polym. Phys. 2010, 48, 479–489. [Google Scholar] [CrossRef]
- Gan, X.; Wang, J.; Wang, Z.; Zheng, Z.; Lavorgna, M.; Ronca, A.; Fei, G.; Xia, H. Simultaneous realization of conductive segregation network microstructure and minimal surface porous macrostructure by SLS 3D printing. Mater. Des. 2019, 178, 107874. [Google Scholar] [CrossRef]
- Jancar, J.; Douglas, J.F.; Starr, F.W.; Kumar, S.K.; Cassagnau, P.; Lesser, A.J.; Sternstein, S.S.; Buehler, M.J. Current issues in research on structure-property relationships in polymer nanocomposites. Polymer 2010, 51, 3321–3343. [Google Scholar] [CrossRef]
- Gnanasekaran, K.; Heijmans, T.; van Bennekom, S.; Woldhuis, H.; Wijnia, S.; de With, G.; Friedrich, H. 3D printing of CNT-and graphene-based conductive polymer nanocomposites by fused deposition modeling. Appl. Mater. Today 2017, 9, 21–28. [Google Scholar] [CrossRef]
- Spinelli, G.; Lamberti, P.; Tucci, V.; Kotsilkova, R.; Ivanov, E.; Menseidov, D.; Naddeo, C.; Romano, V.; Guadagno, L.; Adami, R.; et al. Nanocarbon/Poly(Lactic) Acid for 3D Printing: Effect of Fillers Content on Electromagnetic and Thermal Properties. Materials 2019, 12, 2369. [Google Scholar] [CrossRef]
- Batakliev, T.; Doycheva, I.P.; Angelov, V.; Georgiev, V.; Ivanov, E.; Kotsilkova, R.; Casa, M.; Cirillo, C.; Adami, R.; Sarno, M.; et al. Effects of Graphene Nanoplatelets and Multiwall Carbon Nanotubes on the Structure and Mechanical Properties of Poly(lactic acid) Composites: A Comparative Study. Appl. Sci. 2019, 9, 469. [Google Scholar] [CrossRef]
- Ivanova, R.; Kotsilkova, R. Rheological Study of Poly(lactic) Acid Nanocomposites with Carbon Nanotubes and Graphene Additives as a Tool for Materials Characterization for 3D Printing Application. Appl. Rheol. 2018, 28, 54014. [Google Scholar]
- Spinelli, G.; Lamberti, P.; Tucci, V.; Kotsilkova, R.; Tabakova, S.; Ivanova, R.; Angelova, P.; Angelov, V.; Ivanov, E.; Di Maio, R.; et al. Morphological, Rheological and Electromagnetic Properties of Nanocarbon/Poly(lactic) Acid for 3D Printing: Solution Blending vs. Melt Mixing. Materials 2018, 11, 2256. [Google Scholar] [CrossRef]
- Egiziano, L.; Lamberti, P.; Spinelli, G.; Tucci, V.; Kotsilkova, R.; Tabakova, S.; Ivanov, E.; Silvestre, C.; Di Maio, R. Morphological, rheological and electrical study of PLA reinforced with carbon-based fillers for 3D printing applications. AIP Conf. Proc. 2018, 1981, 020152. [Google Scholar]
- Spinelli, G.; Lamberti, P.; Tucci, V.; Ivanova, R.; Tabakova, S.; Ivanov, E.; Kotsilkova, R.; Cimmino, S.; Di Maio, R.; Silvestre, C. Rheological and electrical behaviour of nanocarbon/poly(lactic) acid for 3D printing applications. Compos. Part. B Eng. 2019, 167, 467–476. [Google Scholar] [CrossRef]
- Buscall, R.; Mills, P.D.A.; Goodwin, J.W.; Lawson, D.W. Scaling behavior of the rheology of aggregate network formed by colloidal particles. J. Chem. Soc. Faraday Trans. 1998, 84, 4249–4260. [Google Scholar] [CrossRef]
- Utracki, L.A. Clay-Containing Polymer Nanocomposites; Rapra Technology: Shawbury, UK, 2004; Volume 1. [Google Scholar]
- Hassanabadi, H.M.; Wilhelm, M.; Rodrigue, D. A rheological criterion to determine the percolation threshold in polymer nano-composites. Rheol. Acta 2014, 53, 869–882. [Google Scholar] [CrossRef]
- Krishnamoorti, R.; Vaia, R.A. Polymer Nanocomposites-Synthesis, Characterization, and Modeling, Chemistry; ASC, Oxford University Press: Oxford, UK, 2001. [Google Scholar]
- Angelov, V.; Velichkova, H.; Ivanov, E.; Kotsilkova, R.; Delville, M.-H.; Cangiotti, M.; Fattori, A.; Otaviani, M. EPR and Rheological Study of Hybrid Interfaces in Gold-Clay-Epoxy Nanocomposites. Langmuir 2014, 30, 13411–13421. [Google Scholar] [CrossRef]
- Ivanov, E.; Velichkova, H.; Kotsilkova, R.; Bistarelli, S.; Cataldo, A.; Micciulla, A.; Bellucci, S. Rheological Behavior of Graphene/Epoxy Nanodispersions. Appl. Rheol. 2017, 27, 24469. [Google Scholar]
- Spinelli, G.; Kotsilkova, R.; Ivanov, E.; Doycheva, I.P.; Menseidov, D.; Georgiev, V.; Di Maio, R.; Silvestre, C. Effects of Filament Extrusion, 3D Printing and Hot-Pressing on Electrical and Tensile Properties of Poly(Lactic) Acid Composites Filled with Carbon Nanotubes and Graphene. Nanomaterials 2020, 10, 35. [Google Scholar] [CrossRef]
- Kotsilkova, R.; Doycheva, I.P.; Menseidov, D.; Ivanov, E.; Paddubskaya, A.; Kuzhir, P. Exploring thermal annealing and graphene-carbon nanotube additives to enhance crystallinity, thermal, electrical and tensile properties of aged poly (lactic) acid-based filament for 3D printing. Compos. Sci. Technol. 2019, 181, 107712. [Google Scholar] [CrossRef]
- Yu, M.F.; Lourie, O.; Dyer, M.J.; Moloni, K.; Kelly, T.F.; Ruoff, R.S. Strength and breaking mechanism of multiwalled carbon nanotubes under tensile load. Science 2000, 287, 637–640. [Google Scholar] [CrossRef]
- Ivanov, E.; Kotsilkova, R.; Xia, H.; Chen, Y.; Donato, R.K.; Donato, K.; Godoy, A.P.; Di Maio, R.; Silvestre, C.; Cimmino, S.; et al. PLA/Graphene/MWCNT Composites with Improved Electrical and Thermal Properties Suitable for FDM 3D Printing Applications. Appl. Sci. 2019, 9, 1209. [Google Scholar] [CrossRef]
- Lamberti, P.; Spinelli, G.; Kuzhir, P.; Guadagno, L.; Naddeo, C.; Romano, V.; Kotsilkova, R.; Angelova, P.; Georgiev, V. Evaluation of Thermal and Electrical Conductivity of Carbon-based PLA Nanocomposites for 3D Printing. AIP Conf. Proc. 2018, 1981, 020152. [Google Scholar]
- Balandin, A.A. Thermal properties of graphene and nanostructured carbon materials. Nat. Mater. 2001, 10, 569–581. [Google Scholar] [CrossRef] [PubMed]
- Arjmand, M.; Mahmoodi, M.; Gelves, G.A.; Park, S.; Sundararaj, U. Electrical and electromagnetic interference shielding properties of flow-induced oriented carbon nanotubes in polycarbonate. Carbon 2011, 49, 3430–3440. [Google Scholar] [CrossRef]
- Clayton, R.P. Introduction to Electromagnetic Compatibility; John Wiley & Sons, Inc.: Hoboken, NJ, USA, 2006. [Google Scholar]
- Celozzi, S.; Araneo, R.; Lovatr, G.; Clayton, P. Electromagnetic Shielding; John Wiley & Sons, Inc.: Hoboken, NJ, USA, 2008. [Google Scholar]
- Shuba, M.V.; Yuko, D.I.; Gorohov, G.; Meisak, D.; Kuzhir, P.; Maksimenko, S.A.; Angelova, P.; Ivanov, E.; Kotsilkova, R. Frequency and density dependencies of carbon nanotube and graphene nanoplatelet based composite in the microwave and terahertz ranges. IOP Publishing. Mater. Res. Express 2019, 6, 095050. [Google Scholar] [CrossRef]
- Vovchenko, L.; Matzui, L.; Oliynyk, V.; Milovanov, Y.; Mamunya, Y.; Volynets, N.; Kuzhir, P. Polyethylene composites with segregated carbon nanotubes network: Low frequency plasmons and high electromagnetic interference shielding efficiency. Materials 2020, 13, 1118. [Google Scholar] [CrossRef]
- Shuba, M.V.; Melnikov, A.V.; Paddubskaya, A.V.; Kuzhir, P.P.; Maksimenko, S.A.; Thomsen, C. The role of finite size effects in the microwave and sub-terahertz electromagnetic response of multiwall carbon nanotube based composite: Theory and interpretation of experiment. Phys. Rev. 2013, B88, 045436. [Google Scholar] [CrossRef]
- Paddubskaya, A.; Valynets, N.; Kuzhir, P.; Batrakov, K.; Maksimenko, S.; Kotsilkova, R.; Velichkova, H.; Petrova, I.; Biró, I.; Kertész, K.; et al. Electromagnetic and Thermal properties of 3D Printed Multilayered Nano-carbon / Poly(lactic) Acid Structures. J. Appl. Phys. 2016, 119, 135102. [Google Scholar] [CrossRef]
- Meisak, D.; Gurnevich, E.; Plyushch, A.; Bychanok, D.; Georgiev, V.; Kotsilkova, R.; Kuzhir, P. Robust design of compact microwave absorbers and waveguide matched loads based on DC-conductive 3D-printable filament. J. Appl. Phys. D 2020. [Google Scholar] [CrossRef]
- Zhou, Y.-G.; Su, B.; Turng, L. Deposition-induced effects of isotactic polypropylene and polycarbonate composites during fused deposition modeling. Rapid Prototyp. J. 2017, 23, 869–880. [Google Scholar] [CrossRef]
- Leng, J.; Wu, J.; Zhang, J. Preparation of Thermoplastic Polyurethane Parts Reinforced with in Situ Polylactic Acid Microfibers during Fused Deposition Modeling: The Influences of Deposition-Induced Effects. Ind. Eng. Chem. Res. 2019, 58, 21476–21484. [Google Scholar] [CrossRef]


| Characteristics | GNP-a | GNP-b | MWCNT-a | MWCNT-b |
|---|---|---|---|---|
| Trade Name | TNIGNP | TNGNP | TNIMH4 | NC7000 |
| Supplier | Times Nano | Times Nano | Times Nano | Nanocyl |
| Purity, wt.% | 90 | >99.5 | 95 | 90 |
| Layers | <30 | <20 | - | - |
| Thickness, nm | 4–30 | 4–20 | - | - |
| Average size, μm | 5–7 | 5–10 | - | - |
| Outer diameter, nm | - | - | 10–30 | 9.5 |
| Inner diameter, nm | - | - | 5–10 | ~5 |
| Length, μm | - | - | 10–30 | 1.5 |
| Aspect ratio | 240 | 500 | 1000 | 150 |
| Functionalization (-OH, %) | - | - | 2.48 | oxidized |
| Specific Surface Area, SSA m2/g | 30–40 | 30–40 | >110 | 250–300 |
| Volume Resistivity, Ohm.cm | <0.15 | 4.10−4 | >10−2 | 10−4 |
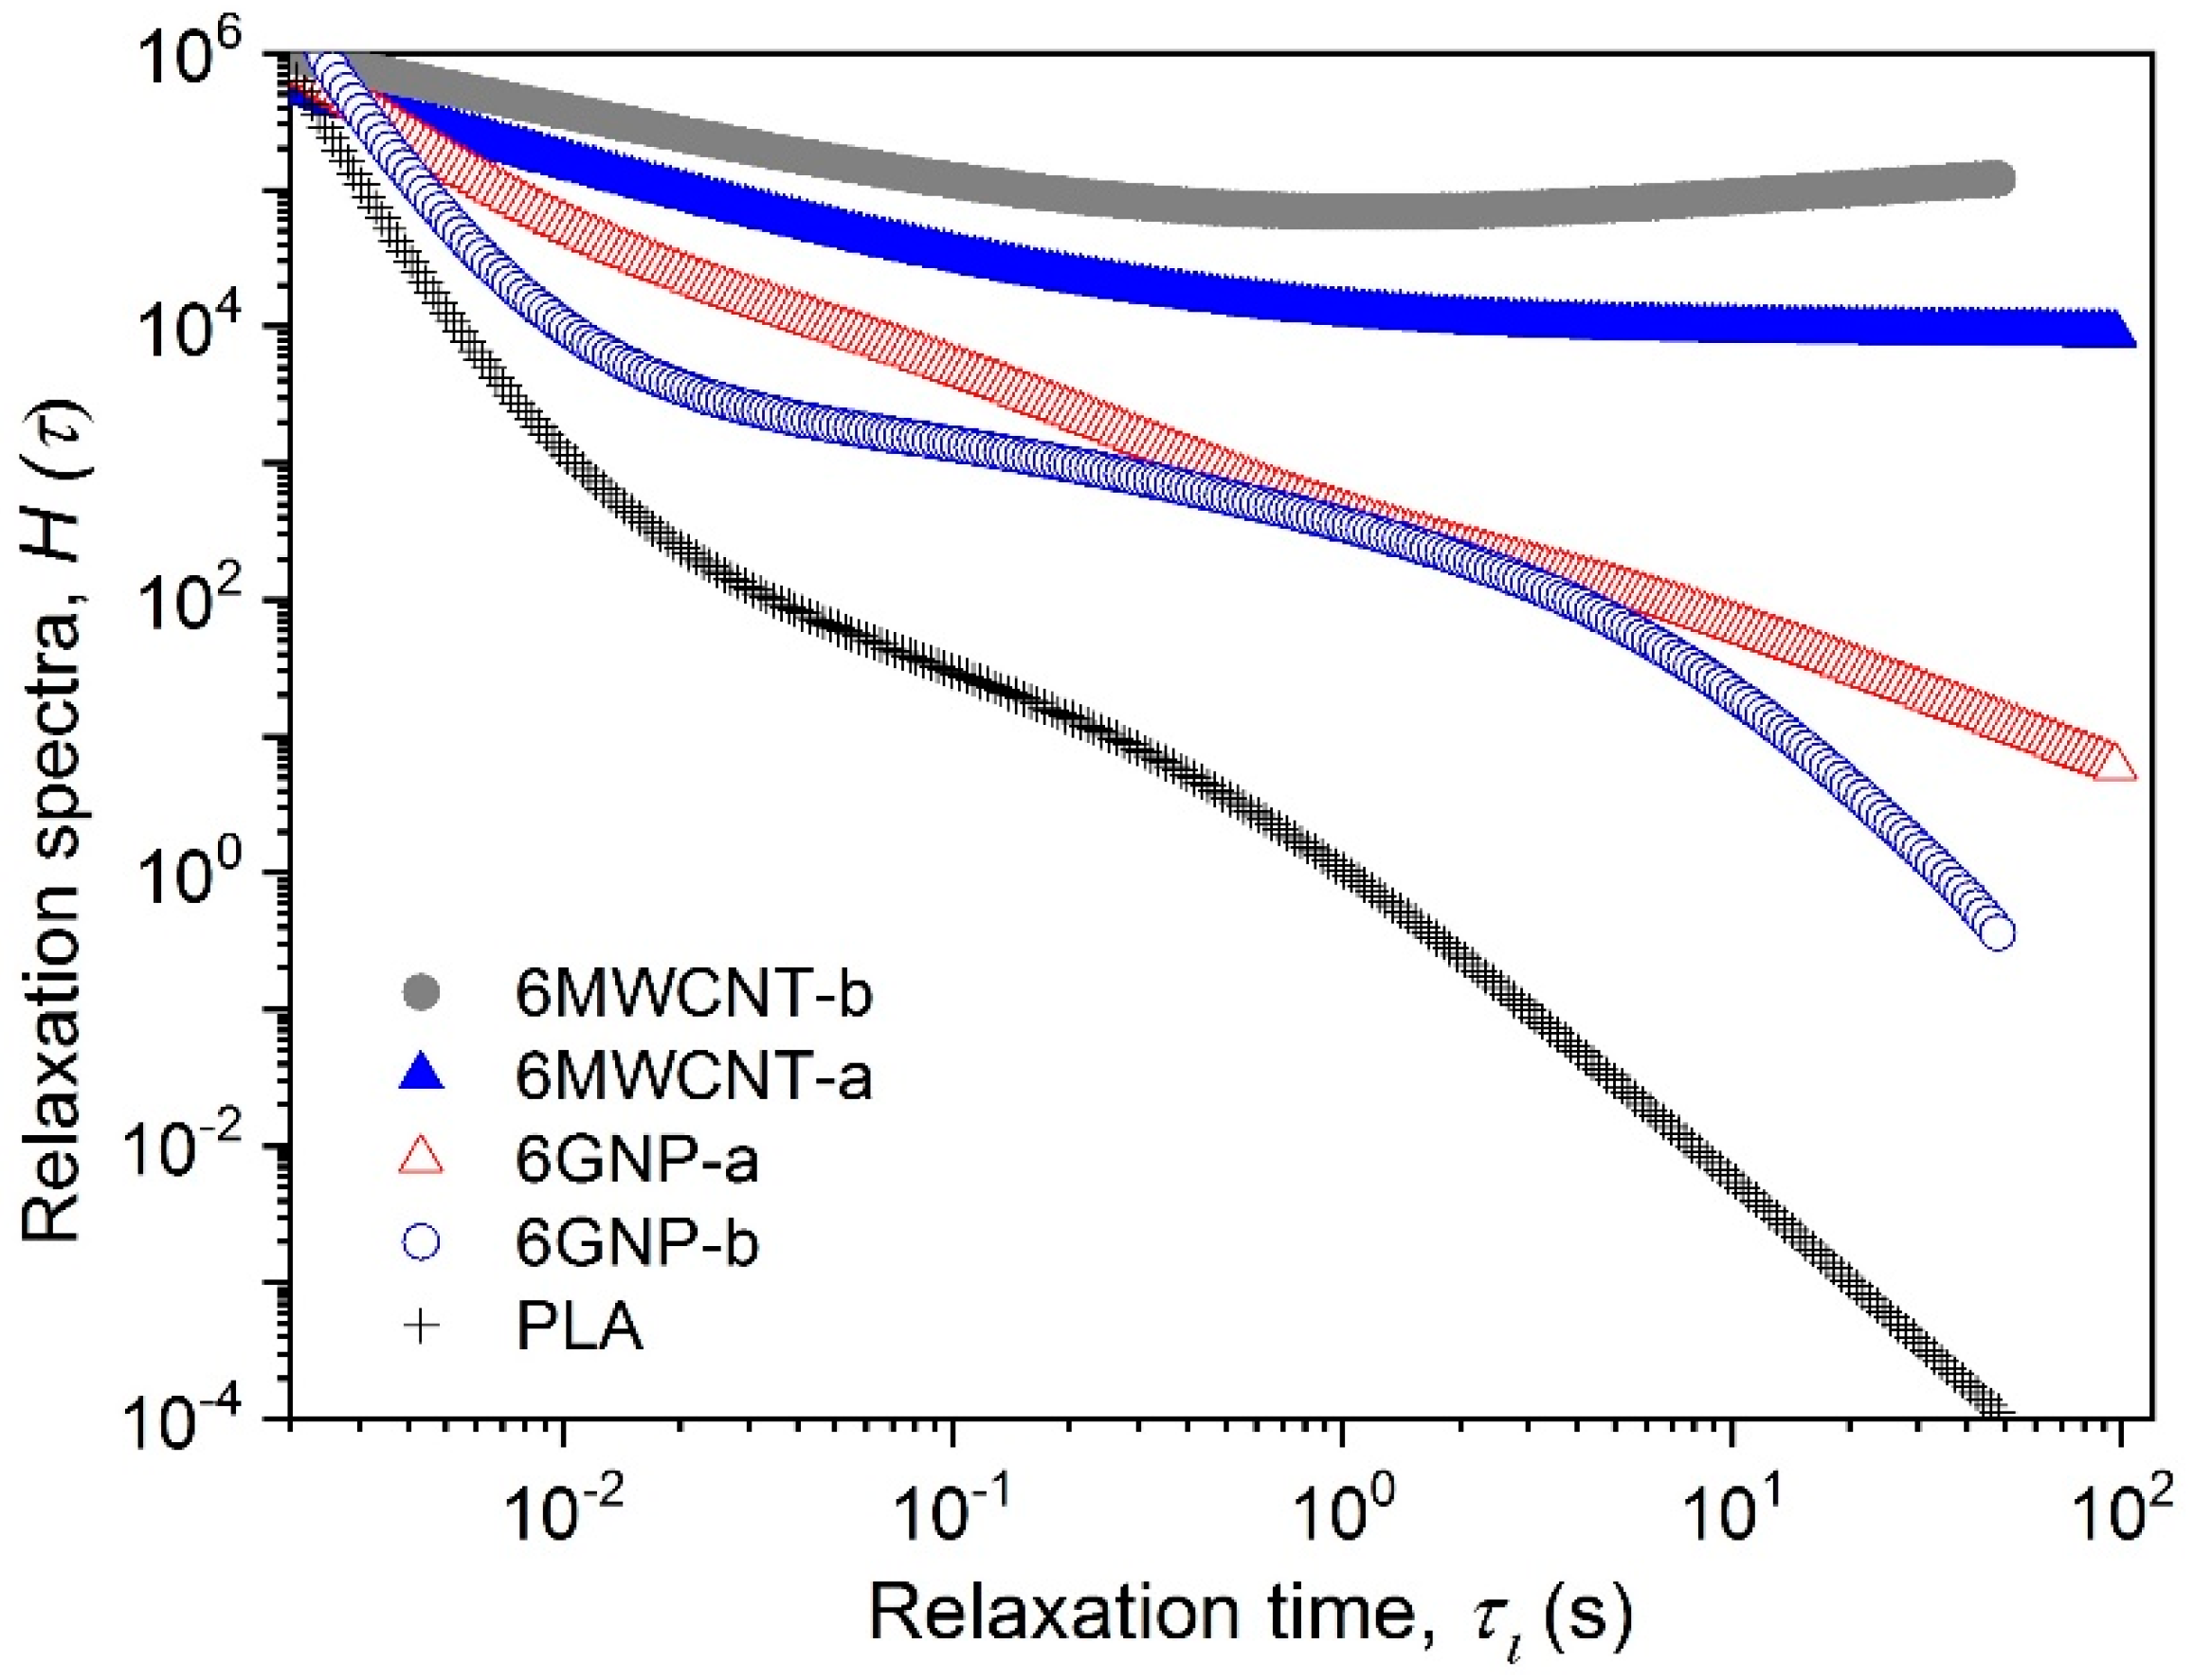
| Sample | Viscosity at = 0.05 s−1 φ = 1.5 wt.% [MPa.s] | Flow Index (n) at φ = 1.5 wt.% | Viscosity = 0.05 s−1 φ = 6 wt.% [MPa.s] | Flow Index (n), at φ = 6 wt.% | Intrinsic viscosity [η] Equation (2) | RPT Equation (2) [wt.%] | EPT Equation (6) [wt.%] | m Equation (3) | D | H(τ) at τ = 50 s |
|---|---|---|---|---|---|---|---|---|---|---|
| PLA | 0.81 | 0.991 | 0.81 | 0.991 | - | - | - | - | - | 1E-4 |
| GNP-a | 1.24 | 0.930 | 3.99 | 0.737 | 35 | 5 | 5 | 4.39 | 1.861 | 12 |
| GNP-b | 0.97 | 0.905 | 3.65 | 0.697 | 114 | 6 | 6 | 4.53 | 1.896 | 0.4 |
| MWCNT-a | 7.37 | 0.466 | 66.34 | 0.201 | 329 | 1.5 | 1.4 | 2.77 | 1.195 | 9E3 |
| MWCNT-b | 42.17 | 0.339 | 796.38 | 0 | 5001 | 0.5 | 0.5 | 2.96 | 1.311 | 1.2E5 |
| Filament Samples NC-a | Young’s Modulus MPa | Ultimate Strength MPa | Elongation % | Filament Samples NC-b | Young’s Modulus MPa | Ultimate Strength MPa | Elongation % |
|---|---|---|---|---|---|---|---|
| PLA | 594 ± 16 | 28.0 ± 3.9 | 8.5 ± 0.5 | PLA | 594 ± 16 | 28.0 ± 4.0 | 8.5 ± 0.5 |
| 1.5GNP-a | 575 ± 34 | 23.0 ± 3.5 | 7.2 ± 11 | 1.5GNP-b | 644 ± 54 | 27.5 ± 1.5 | 7.9 ± 1.0 |
| 6GNP-a | 625 ± 110 | 20.9 ± 2.3 | 6.0 ± 0.4 | 3GNP-b | 665 ± 63 | 26.6 ± 2.6 | 7.0 ± 0.6 |
| 12GNP-a | 598 ± 159 | 19.9 ± 3.3 | 5.6 ± 0.7 | 6GNP-b | 659 ± 39 | 23.9 ± 1.2 | 6.6 ± 1.3 |
| 1.5MWCNT-a | 616 ± 76 | 25.8 ± 2.3 | 7.2 ± 0.5 | 9GNP-b | 598 ± 13 | 24.8 ± 1.2 | 6.8 ± 1.7 |
| 3 MWCNT-a | 599 ± 49 | 26.6 ± 0.9 | 9.0 ± 0.9 | 1.5MWCNT-b | 697 ± 52 | 29.1 ± 0.8 | 8.2 ± 1.3 |
| 6 MWCNT-a | 638 ± 58 | 27.9 ± 2.4 | 7.2 ± 0.5 | 3MWCNT-b | 690 ± 64 | 31.7 ± 3.8 | 9.0 ± 1.3 |
| 9 MWCNT-a | 674 ± 73 | 26.0 ± 1.9 | 5.4 ± 0.7 | 6MWCNT-b | 756 ± 76 | 36.7 ± 4.3 | 9.2 ± 1.1 |
| 12 MWCNT-a | 720 ± 63 | 23.3 ± 1.9 | 4.3 ± 0.4 | 9MWCNT-b | 768 ± 51 | 27.2 ± 3.2 | 6.1 ± 1.1 |
© 2020 by the authors. Licensee MDPI, Basel, Switzerland. This article is an open access article distributed under the terms and conditions of the Creative Commons Attribution (CC BY) license (http://creativecommons.org/licenses/by/4.0/).
Share and Cite
Kotsilkova, R.; Ivanov, E.; Georgiev, V.; Ivanova, R.; Menseidov, D.; Batakliev, T.; Angelov, V.; Xia, H.; Chen, Y.; Bychanok, D.; et al. Essential Nanostructure Parameters to Govern Reinforcement and Functionality of Poly(lactic) Acid Nanocomposites with Graphene and Carbon Nanotubes for 3D Printing Application. Polymers 2020, 12, 1208. https://doi.org/10.3390/polym12061208
Kotsilkova R, Ivanov E, Georgiev V, Ivanova R, Menseidov D, Batakliev T, Angelov V, Xia H, Chen Y, Bychanok D, et al. Essential Nanostructure Parameters to Govern Reinforcement and Functionality of Poly(lactic) Acid Nanocomposites with Graphene and Carbon Nanotubes for 3D Printing Application. Polymers. 2020; 12(6):1208. https://doi.org/10.3390/polym12061208
Chicago/Turabian StyleKotsilkova, Rumiana, Evgeni Ivanov, Vladimir Georgiev, Radost Ivanova, Dzhihan Menseidov, Todor Batakliev, Verislav Angelov, Hesheng Xia, Yinghong Chen, Dzmitry Bychanok, and et al. 2020. "Essential Nanostructure Parameters to Govern Reinforcement and Functionality of Poly(lactic) Acid Nanocomposites with Graphene and Carbon Nanotubes for 3D Printing Application" Polymers 12, no. 6: 1208. https://doi.org/10.3390/polym12061208
APA StyleKotsilkova, R., Ivanov, E., Georgiev, V., Ivanova, R., Menseidov, D., Batakliev, T., Angelov, V., Xia, H., Chen, Y., Bychanok, D., Kuzhir, P., Di Maio, R., Silvestre, C., & Cimmino, S. (2020). Essential Nanostructure Parameters to Govern Reinforcement and Functionality of Poly(lactic) Acid Nanocomposites with Graphene and Carbon Nanotubes for 3D Printing Application. Polymers, 12(6), 1208. https://doi.org/10.3390/polym12061208